
Abstract
Physical activity and fitness have long been associated with health, yet youth with visual impairments tend to be less active and less fit than their sighted peers. Performance calibration (i.e., the degree to which predictions about performance reflect actual performance) may be a useful conceptual framework to investigate the relationships between perceptions of health-related fitness and measured fitness performance among youth with visual impairments. The purpose of this study was to examine the predictive and postdictive performance calibration of youth with visual impairments on a test of cardiovascular fitness. Twenty-five participants (12 female, 13 male, aged 10–17 years) completed a 6-min endurance run test. Before and after the test, participants estimated how far they would run. Based on these data, performance calibration scores were calculated, and variables were correlated. Gender and visual impairment level-based differences were compared using t tests. Participants were generally overconfident in their predicted run scores but underconfident in their postdictions. Results of the present study suggest that youth with visual impairments are generally poorly calibrated with regard to cardiovascular fitness.
Regular physical activity, including cardiovascular exercise, has been associated with overall health throughout the lifespan (Physical Activity Guidelines Advisory Committee [PAGAC], 2018). Among youth populations, physical activity engagement has been associated with decreased risk of obesity, increased bone density, and better cardiovascular fitness (PAGAC, 2018). Further, research on health-related fitness among children and adolescents without disabilities has demonstrated that greater scores on cardiovascular fitness tests have been associated with both greater levels of habitual physical activity and healthy body composition scores (Fogelholm et al., 2008; Lohman et al., 2008).
Despite mounting evidence of the importance of physical activity and fitness, research documenting physical activity among youth with visual impairments has suggested that on average, children and adolescents with visual impairments are less active than their sighted peers and are less likely to meet physical activity recommendations (Haegele & Porretta, 2015; Longmuir & Bar-Or, 2000). For example, a cross-sectional analysis of a nationally representative sample of US adolescents from the 2011–2012 National Survey of Children’s Health reported that adolescents with severe visual impairments participated in significantly fewer days of moderate to vigorous physical activity than those without visual impairments (Haegele et al., 2019). Although the area of health-related fitness among adolescents with visual impairments is underresearched, findings indicate youth with visual impairments typically do not meet age-normed standards for cardiovascular fitness (Haegele et al., 2019; Kobberling et al., 1989; Lieberman et al., 2010; Lieberman & McHugh, 2001).
While some research has sought to examine fitness levels of youth with visual impairments, little is known about the underlying psychological and self-regulatory processes that contribute to youth with visual impairments’ appraisals of their current level of cardiovascular fitness. That is, lower physical activity and cardiovascular fitness among children with visual impairments is not well understood, but psychological and self-regulatory processes are likely to play a role (Lieberman et al., 2006). Performance calibration, which refers to the degree to which a person’s perception of their performance on a specified task or skill is related to their actual achievement (Keren, 1991), may be one self-regulatory process that may influence fitness levels. Greater performance calibration (i.e., minimal differences in performance predictions and actual performance outcomes) is associated with higher achievement and learner motivation (Butler & Winne, 1995). For example, a study of university students found that those whose predictions most closely aligned with their scores on quizzes typically scored higher than those who were less accurate (Bol et al., 2005). Similar studies among upper elementary and middle school students have supported this finding (Bol et al., 2010; García et al., 2016). In a physical education setting, calibration has been examined in association with skill development (Kolovelonis et al., 2012, 2013; Kolovelonis & Goudas, 2018). For example, Kolovelonis et al. (2012) found positive relationships between performance calibration, age, and basketball dribbling task scores. In general, studies of performance calibration have concluded that lower achievers tended to be more overconfident with their predictions than their higher achieving counterparts, who tended to be much more pessimistic, and often underestimated their performances (Bol & Hacker, 2001; Chen, 2003). Researchers have termed this the “unskilled and unaware effect” (Ehrlinger & Dunning, 2003; Ehrlinger et al., 2008). Similarly, a study of performance calibration of young chess players found that participants who had greater expertise were more likely to make more accurate predictions about their performances and that better-calibrated players exhibited better motivational patterns related to future performances (Horgan, 1992).
Understanding performance calibration is important because of its potential impact on motivation, preparation, and achievement (Bol & Hacker, 2012). Because cardiovascular fitness is essential to overall health among youth populations (PAGAC, 2018), those who are well calibrated in predicting their cardiovascular fitness may have better knowledge of their abilities and inabilities in this area and may be more effective at pursuing their own physical fitness goals (Horgan, 1992; Kolovelonis et al., 2012; Kolovelonis & Goudas, 2019). Therefore, the purpose of this exploratory study was to examine the predictive and postdictive performance calibration levels of youth with visual impairments on a test of cardiovascular fitness.
Methods
Participant recruitment and characteristics
Thirty-five adolescents who were attendees at a weeklong sports camp for youth with visual impairments located in the Mid-Atlantic United States were invited to participate in this study. Potential participants and their families were recruited by camp staff members during the initial orientation meeting at the beginning of the camp. A recruitment letter and parental consent form were distributed to parents or guardians of the program attendees. The recruitment letter contained information about the study, including inclusion criteria, study protocols, options for non-participants, and the lead researcher’s contact information. Inclusion criteria for participants include those who (a) were camp attendees, (b) had a visual impairment, (c) were 10–17 years old, and (d) had the ability to participate fully in commonly held camp activities, including running associated with the camp’s track and field programming. All recruitment materials and methodological protocols were approved by the researchers’ institutional review board prior to the commencement of recruitment.
The parents of 26 camp attendees completed parental consent forms, and all attendees assented to participate; one participant, however, left the camp early and, thus, was unable to complete the study. All 25 of the remaining participants completed all study protocols. Participants (12 female, 13 male) ranged in age from 10 to 17 years (Mage = 12.77 years) at the time of data collection. Thirteen participants reported being Braille readers (i.e., having limited functional vision) and 12 reported being print readers (i.e., having more functional vision).
Measures
Three instruments were used in this study. First, participants were asked to engage in a 6-min endurance run test of cardiovascular fitness. The test was selected for use based on its concurrent validity with the 20-m shuttle run test, which has been established as a valid field measure of cardiovascular fitness for youth (Leger et al., 1988; Leger & Lambert, 1982). The 6-min endurance run test was deemed more suitable for the population in question, as reversing directions can be burdensome for individuals with visual impairments who may decrease their running speed in anticipation of the turn, while the 6-min test took place on an accessible loop with no sharp turns. Second, prior to the run test, participants were asked to estimate how far in tenths of a mile they believed they would run in 6 min. For informational reference, participants were informed of how far the average person of their age had traveled on a similar test (Leger & Lambert, 1982). Immediately following the run, participants were asked to estimate how far they believed that they had run. Together, these ratings provided the prediction and postdiction estimates. Finally, a demographic questionnaire was administered to participants.
Data collection
The 6-min endurance run test was administered during an afternoon track and field session during the camp’s third day of programming. On the first and second days of track and field programming, participants had completed 100-m sprints and half-mile practice runs for time. The outdoor course consisted of a 1-mile loop across level ground that was closed to outside pedestrian and motor traffic. The course was clearly marked for participants with functional vision who were running independently. Trained camp staff members were employed as guide runners and course monitors to ensure that all were able to run safely throughout the 6-min test. Participants were given a description of the course prior to the event. Each participant was assigned an identification number and issued a marker with their corresponding number printed on it. Participants were instructed to begin running on the whistle blast and continue moving (e.g., running or walking) until a second whistle blast signaled the end of the test. Following the test, participants were instructed to drop their markers on the ground and finish walking the remainder of the course. The lead researcher then measured the distance from the start line to each marker in meters using a commercially available measuring wheel to ensure accuracy.
Data analysis
Prior to data analysis, participant prediction and postdiction were converted from miles into meters to agree with the units recorded using the measuring wheel. All results were reported in meters. Participants’ calibration bias and accuracy were calculated using predictive and postdictive ratings for the cardiovascular test. Prediction and postdiction bias and accuracy were calculated using formulas provided by Hacker et al. (2008). Biases were calculated by subtracting each participant’s performance on the endurance run test from their predicted and postdicted scores, respectively. Calibration accuracy was obtained by taking the absolute value of the prediction and postdiction bias scores.
Demographic information such as participant age, gender, and visual impairment level were analyzed descriptively via frequencies and measures of central tendency and dispersion. Pearson product-moment correlations were used to investigate potential relationships between variables including age, run score, prediction accuracy, and postdiction accuracy. Two separate independent samples t tests were then used to investigate group differences on run scores, prediction and postdiction bias, and prediction and postdiction accuracy across gender and visual impairment levels.
Results
The mean run score across all participants was 667.18 m (standard deviation [SD] = 167.90). Participants’ mean prediction calibration bias was +123.01 m (SD = 234.31), indicating that they were generally overconfident when estimating how far they believed they could run during the test. Postdiction calibration bias had a mean of −76.55 (SD = 260.57), indicating that after completing the test, participants tended to underestimate how well they had performed. While the majority of participants (n = 14) made overconfident predictions, only eight participants remained overconfident when making postdictive performance estimations. No participants who made underconfident or accurate predictions made overconfident postdictions following completion of the run test. Pearson product-moment correlations revealed insignificant weak correlations between age and run score, run score and prediction accuracy, and run score and postdiction accuracy. Similarly, age and both prediction and postdiction scores were insignificantly related. Prediction and postdiction accuracy was moderately correlated, r = .38, though this correlation coefficient was not statistically significant (p = .06). Correlation coefficients are displayed in Table 1.
Pearson product-moment correlations between variables.
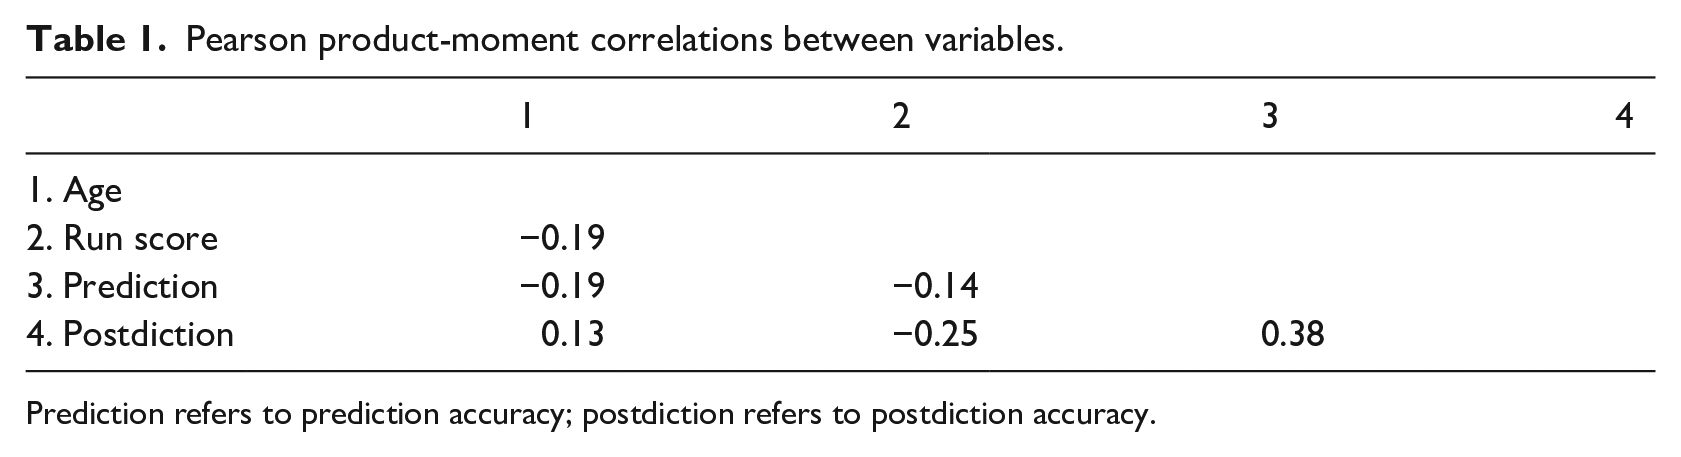
Prediction refers to prediction accuracy; postdiction refers to postdiction accuracy.
Independent samples t tests were used to examine potential differences in run scores, prediction and postdiction biases, and prediction and postdiction accuracy scores based on gender and the visual impairment level (i.e., comparing Braille and print readers). When investigating both gender and visual impairment level t tests, Levene’s tests showed no significant differences in variances between groups. Thus, results were interpreted with equal variances assumed. Result of t tests (Table 2) revealed no significant differences on run scores or calibration variables between genders or visual impairment levels (ps > .05), which indicated comparable running scores across vision levels and genders. Effect sizes for run score and prediction accuracy between gender groups were small (d = .34, d = .41, respectively), while small effect sizes for postdiction bias and postdiction accuracy were found between Braille and print reader groups (d = .34, d = .33, respectively). A medium effect size was found for prediction bias between Braille and print reader groups (d = .53).
Results of t tests on running performance and calibration between gender and visual impairment level.

Braille refers to Braille readers, print refers to print readers.
Discussion
The purpose of this study was to examine the predictive and postdictive performance calibration levels of youth with visual impairments on a test of cardiovascular fitness. Participants made predictions about their performances on a 6-min endurance run test, completed the test, and postdicted their performances before learning of their actual scores. Within the larger population, superior performance calibration has been hypothetically associated with higher achievement and performance (Keren, 1991). To the authors’ knowledge, the present work was the first to study self-regulation, specifically performance calibration, among youth with visual impairments in any context.
In general, participants tended to be overconfident when making predictions about how well they would perform. This finding is consistent with earlier research in both academic and motor contexts among persons without disabilities (Bol et al., 2005, 2010; Chen, 2003; Hacker et al., 2008; Kolovelonis et al., 2012; Kolovelonis & Goudas, 2018). While there are many potential reasons why people may tend toward inaccuracy, age, gender, achievement or performance level, and task difficulty have all been hypothesized to shape performance calibration (Keren, 1991; Kolovelonis & Goudas, 2018). In general, the data showed a change in participants’ prediction and postdiction calibration biases wherein 14 of the 25 participants made overconfident predictions about how far they would travel, while only eight participants made overconfident postdictions about their scores following the test. Despite this overall change in confidence, participant postdictions were not significantly more accurate than their predictions, just much less optimistic. This finding is in keeping with literature that found that overall performance calibration is typically resistant to improvement (Bol & Hacker, 2001).
Several earlier inquiries among children and adolescents without disabilities have found a positive association between age and performance calibration (Kolovelonis et al., 2012; Schunk & Miller, 2002). In the present study, however, age was related to neither predictive or postdictive performance calibration nor outcome on the walk-run test itself. Evidence for the relationship between gender and performance calibration is less clear, based on the literature. For example, a recent study by Kolovelonis and Goudas (2018) found that while boys tended to outperform girls on a basketball shooting task, they were also generally more overconfident when making their performance predictions, and thus, there was no gender difference in calibration bias or accuracy. The results of the present study partially support this finding, as there was no significant difference in calibration bias or accuracy for either prediction or postdiction based on gender. In contrast with the earlier work, male participants did not make significantly higher performance prediction or postdiction than female participants. Other studies have found relationships between achievement and performance calibration in which better performers were more likely to be better calibrated than were lower performers (Bol & Hacker, 2001; Chen, 2003; Kolovelonis et al., 2012). For example, Kolovelonis et al. (2012) found a positive relationship between performance on a basketball dribbling task and performance calibration among a group of fifth- and sixth-grade students. In contrast with these findings, actual performance on the walk-run test was not significantly related to either measure of performance calibration in the current study.
One unique contribution of the present research was the investigation of potential relationships between the level of visual impairment, performance on the walk-run test, and predictive and postdictive performance calibration. An earlier study found that among a group of youth with visual impairments, those with more vision (i.e., print readers) tended to have higher self-confidence and greater perceptions about the overall importance of being physically active when compared to their counterparts with less vision (Stuart et al., 2006). Based on this precedent, the current study also divided participants based on visual impairment levels; however, no relationships between having more usable vision and greater calibration, nor better performance were detected herein.
Overall, there were no significant differences in predictive or postdictive performance calibration and endurance run test performance across any of the variables measured in the present study, which is somewhat contradictory in comparison with the existing body of literature. One potential reason for this difference was the unfamiliarity of the task itself; however, several performance calibration studies have also used novel tests of sport skills, so this approach is not without precedent (Kolovelonis & Goudas, 2012, 2018). Further, although all participants had been timed in track activities during the week of camp and were given an informational reference to help them make realistic predictions, it is unlikely that most of the participants had ever been asked to complete a timed test for distance before; therefore, task novelty may have made predictions difficult for them. Task difficulty could also account for differences in findings from previous studies. In an earlier study of performance calibration of adult golfers, researchers found that participants were significantly better at predicting their performances on easier tasks than they were on difficult tasks (Fogarty & Else, 2005). Without knowing the physical fitness history of participants in the present study, the difficulty of the endurance run test for each of them cannot be ascertained.
Several limitations were present within the current study. The low sample size (N = 25) placed constraints on data analyses and may have accounted for the lack of significant differences between groups. The makeup of the population, particularly with regard to participant age, was also a concern, as middle adolescents (i.e., 15- to 17-year-olds) made up only a small part of the sample (n = 8), while younger adolescents (i.e., 10- to 14-year-olds) were overrepresented (n = 17). To better address the potential impact of age on performance calibration, future research should seek larger sample sizes with a more even participant age distribution, such that age-related comparisons may be investigated. The unfamiliar and potentially difficult nature of the walk-run test itself may have had an impact on performance calibration, including the general change from overconfidence to underconfidence reflected in prediction and postdiction biases. Although novel tests of performance calibration are not uncommon, orienting statements were used to familiarize participants with the average performance of someone of their age, and postdictions were made following completion of the run test. To further protect against issues of test novelty, future inquiries could include a practice run test to better orient participants toward making reasonable performance predictions.
In conclusion, the results of the present study indicate that like their sighted counterparts, youth with visual impairments are generally poorly calibrated and tend to be overconfident when making predictions about their performances on a test of cardiovascular fitness. In contrast, they may tend toward underconfidence when assessing themselves postperformance. Future studies within the area of performance calibration should continue to investigate the relationships between variables such as performance calibration, visual impairment level, age, and performance, while adding instruments designed to capture self-beliefs about motivation toward physical activity and physical fitness to better understand the role of performance calibration as a motivational factor.
Footnotes
Author’s Note
TN Kirk is now affiliated with University of Georgia, USA.
Declaration of conflicting interests
The author(s) declared no conflicts of interest with respect to the research, authorship, and publication of this article.
Funding
The author(s) received no financial support for the research, authorship, and/or publication of this article.