
Abstract
The aim of this study is to investigate the user requirements of individuals with blindness regarding the information to be mapped on audio-tactile maps of city centers and neighborhoods/residential areas. Beyond that specific scope, this study aims at covering a wider research gap. That is, the investigation of the usefulness that individuals with blindness attribute to different spatial information (items) of differentiated environments: city centers and neighborhoods/residential areas. A total of 115 adults with blindness took part in the research. Participants came from four countries: Greece, Cyprus, Turkey, and Germany. The researchers listed 222 pieces of information concerning city centers and 226 pieces concerning neighborhoods/residential areas and address them in survey by conducting two respective questionnaires. Participants were asked to evaluate the information regarding the usefulness of the information with regard to safety, location of services, and orientation/wayfinding during movement. The result of the study is the definition of the most useful information that should be included in orientation and mobility (O&M) aids. Thus, the findings of this study will be particularly important for designers of O&M aids, O&M specialists, rehabilitation specialists, and teachers who design and construct O&M aids for their students with blindness.
Keywords
Introduction
Nowadays the European landscape is spotted with cities. An urban city center usually consists of high-density terraces or high-rise housing and offices. City centers are complex places that host and serve a wide range of people and purposes (business, shopping, entertainment, etc.). On a daily basis, individuals with impairments are challenged by streetscape structures such as street furniture (tables, chairs, etc.), damaged or uneven surfaces, and roads running under construction. Navigating these features in a crowded city center can be even more dangerous for people with disabilities.
For individuals with visual impairments in particular, orientation without visual feedback in unknown environments is a difficult and demanding task. The type of information used by individuals with blindness for orientation and mobility (O&M) is different from those without blindness (Passini & Proulx, 1988). Koutsoklenis and Papadopoulos (2011a, 2011b, 2014) found that there are specific auditory, haptic, and olfactory cues that are used by individuals with visual impairments for wayfinding and spatial knowledge.
Recent neuroscientific work points out differences between individuals with and without visual impairment in spatial knowledge acquisition (Schinazi et al., 2016). The former usually have received special training by O&M specialists who help them to learn the main walking routes with audio-tactile feedback techniques making use of their auditory and haptic sense (Sauerburger, 1996). Such training is beneficial for orientation; however, it entails a lot of effort to learn the most important cues for finding a way (Ungar et al., 1993), and it is time-consuming.
To support orientation and wayfinding of individuals with visual impairments, many O&M aids have been developed in the previous decades. Raised-line graphics of the spatial environment, such as tactile maps, have been used to prepare individuals with visual impairments to navigate space more safely and efficiently (Espinosa et al., 1998). Thus, tactile maps contribute to spatial awareness (Habel et al., 2010) supporting wayfinding (Passini et al., 1986) as well as O&M of individuals with profound visual impairments (Lawrence & Lobben, 2011).
The next generation of tactile graphics was audio-tactile representations with the addition of auditory information to the tactile graphics. Audio-tactile maps have been used to examine the ability of individuals with visual impairments to encode space (Koustriava et al., 2016; Papadopoulos et al., 2014, 2017, 2018; Papadopoulos, Barouti, & Koustriava, 2016; Siekierska et al., 2003). Tactile graphics are placed on top of touch-sensitive surfaces such as NOMAD (Parkes, 1988) or IVEO (Gardner et al., 2009) and auditory information is delivered to the user by tapping at a certain spot. Thus, in the case of audio-tactile maps, information can be represented by tactile graphics, audio symbols, tactile symbols, audio-tactile symbols (e.g. when a user touches a tactile symbol, he can hear additional information), and Braille labels. This allows a vast amount of information to be presented in auditory modality.
Koustriava and colleagues (2016) investigated the cognitive maps of persons with visual impairments, and they found that audio-tactile maps are more helpful for wayfinding and detection of specific points of interest in a certain region than recorded verbal descriptions. The findings of Papadopoulos, Barouti, and Koustriava (2016) point in the same direction. It seems that audio-tactile maps that use a tactile map augmented with special auditory information (i.e. from the real environment) at places such as intersections are helpful to improve spatial knowledge in familiar city areas. Wang et al. (2009), with the participation of six users with blindness, showed that audio-tactile maps from their prototype system convey the most important map information and are potentially useful aids for local navigation.
Audio-tactile maps have given rise to a variety of O&M aids – from high tech to low tech – that are used or could possibly be used for spatial learning and navigation. Abd Hamid and Edwards (2013) studied how route learning using audio-tactile maps could become more interactive and accessible to the user with blindness. Their approach allows the user to rotate the Talking Tactile Tablet, thereby facilitating the development of an egocentric cognitive map. Brock et al. (2010) investigated the usage of multi-touch displays in interactive audio-tactile maps. Their system relies on a tangible overlay placed on top of the multi-touch screen. Furthermore, a touch-sensitive pin-matrix display integrated with an audio-haptic system has been developed (Zeng et al., 2014) to improve map accessibility for individuals with visual impairments while reading city maps and establishing pre-journey routes. The system allows users to explore large-scale areas through pinning and zooming. Jacobson (1996) used talking tactile maps and combined them with auditory beacons in the environment to remind the users of specific landmarks when they move outside.
All these means have been introduced to enable access to spatial information for individuals with visual impairments. Although there has been extensive work on audio-tactile stimuli, little research concerning user requirements has been detected. What is needed is, to specify audio-tactile symbols for audio-tactile maps through a user-centered approach. The end-users (individuals with visual impairments) of audio-tactile maps should define what information should be incorporated in audio-tactile maps and in which format they should be presented.
In an online survey, Abd Hamid and Edwards (2013) asked 15 mobility instructors about what landmarks are useful for the orientation of persons with visual impairments. They identified auditory cues and ranked them based on importance: sounds from ground texture, vehicle passing, vehicle brakes, street traffic, running water, vehicle horn, people leaving/entering buildings, sounds of trees, footsteps, road works, and sounds made by animals. They also evaluated landmarks according to their importance: road crossings, buildings, junctions, entrances, bridges, curbs, transport stations, bus/taxi stands, telephone booth, lamp posts, streets, fences, sidewalks, alleyways, parks, water, parking lots, and fields.
Leonard and Newman (1970) found that information that refers to specific environmental characteristics, such as crossing a street, identifying which side of the street should be used, changing walking directions, up or down curbs, and warnings and roundabouts, help with orientation during a journey. This is also confirmed by studies done by Passini and Proulx (1988), who found that wayfinding was supported by four behavioral categories such as changing walking directions, changing levels, maintaining a walking direction, and finding close ranged architectural elements in a space. Moreover, Papadopoulos (2004) suggested that cognitive maps of individuals with visual impairments appear to contain basic environmental features such as streets, buildings, parks, fixed obstacles, and bus stops.
Although all of the above recommendations are significantly useful, the review of the literature suggests that, on one hand, the use of electronic mobility aids is not widespread because they have not managed to fully meet the needs of individuals with visual impairments (Roentgen et al., 2008) and on the other hand, there are inconsistencies and lack of standardization in the production of tactile maps that hinder their success in addressing the needs of end-users (Rowell & Ungar, 2003).
There is a series of research that approached the specific features contained in the cognitive maps of individuals with visual impairments and suggested that if this information could be included on tactile maps, it would turn them into a more useful navigational tool. Koutsoklenis and Papadopoulos (2011a, 2011b, 2014) examined which auditory, haptic, and olfactory cues are more frequently used, and which ones are actually more useful for wayfinding, environment recognition, and hazards avoidance in urban areas. They found that there is a discrepancy between the most frequently used and the most useful ones.
In the same direction, Gardiner and Perkins (2005) investigated the environmental information that individuals with visual impairments recognize to customize tactile maps using meaningful features. Thus, they found that an amount of audio, haptic, and olfactory information can be perceived, while the environmental circumstances (for instance, weather) interfere with recognition. The main question arising here is whether the information that end-users can perceive themselves is indeed the right tactile information to be included on a relative map, or the information that the end-users could not perceive themselves should be included to complete their spatial encoding, or a combination of both would be preferable.
For this reason, Papadopoulos, Charitakis, et al. (2016) decided to investigate the user requirements of 40 young adults with blindness regarding the information to be included on two different types of audio-tactile mobility maps: (a) audio-tactile maps of indoors and (b) audio-tactile maps of campuses. The main result of this study was the identification of the most important information that should be included on each one of the two different types of audio-tactile maps. The importance factor was calculated by multiplying frequency of occurrence with significance (usefulness) for each information. The research presented in this article constitutes an extension of the previously mentioned research (Papadopoulos, Charitakis, et al., 2016).
Study
This research article was derived from a wider research project which aimed at the specification of user requirements of adults with blindness regarding the information to be included (mapped) on audio-tactile maps of (a) indoor places, (b) campuses, (c) neighborhoods/residential areas, (d) city centers, and (e) geographical scale (political, physical, thematic, and historic). It presents the part of a research concerning the user requirements of adults with blindness regarding the information to be included on audio-tactile maps of city centers and of neighborhoods/residential areas. To meet the purpose of the research, the investigation focused on the usefulness (importance) that individuals with blindness attribute to a large number of different spatial information (items) that could be identified in the environment of both a city center and a neighborhood/residential area. For these reasons, the usefulness that individuals with blindness consider for each item of information was evaluated. The result of this research is the identification of the information that end-users wish to be included on audio-tactile maps and in O&M aids in general, assorted in a hierarchical order from the most useful item to the least useful one.
The secondary objective of the research was to examine whether the usefulness of the items had any relation to specific attributes of the items (i.e. to the way they are used). This research particularly investigated how the participants ranked the usefulness of the information that help them move safely, the information about services, or the information that they use for wayfinding and their orientation during movement. Moreover, this study aimed to examine whether the usefulness is related to individual characteristics of persons with blindness (country of origin, gender, age, age at onset of visual impairments, and ability of independent movement).
At first, two initial lists of spatial information were developed: one for the city centers including 103 items, and one for the neighborhoods/residential areas including 100 items. The information included in these lists was considered to be important based on previous studies (Koutsoklenis & Papadopoulos, 2011a, 2011b, 2014) and on the experience of the researchers. The lists were created in English and translated in three different languages (Greek, German, and Turkish). Finally, these lists were further enriched with information suggested by focus groups that were conducted in the respective countries (i.e. Greece and Cyprus, Germany, Turkey). The sample of the focus groups consisted of individuals with blindness (potential users of the O&M aids) as follows: seven from Greece, six from Cyprus, four from Germany, and five from Turkey. Τhe sample of the focus groups consisted of 11 male and 11 female individuals. The age ranged from 23 to 50 (M = 34.6) years. Twenty participants had total blindness or severe visual impairments and two had legal blindness (visual acuity less than 1/20). The visual impairment was “congenital” for 14 participants and “acquired” for 8 participants.
Having completed the procedure with the focus groups, the final lists emerged and two consequent questionnaires were formed. The questionnaire concerning city centers consisted of 222 items (119 additional) and the one referring to neighborhoods/residential areas consisted of 226 items (126 additional).
Participants
The participants, 115 adults with blindness, originated from four countries: 40 from Greece, 8 from Cyprus, 50 from Turkey, and 17 from Germany. The convenience sample came from various associations of their country of residence. The sample consisted of 65 (56.5%) males and 60 (43.5%) females. Their age ranged from 18 to 64 (M = 34.82, SD = 11.11) years. Of the participants, 79 had total blindness, 30 had profound visual impairments (their visual acuity was less than 1/40), and 6 had legal blindness (their visual acuity was less than 1/20). The visual impairment was congenital for 62 participants and acquired for 53 participants. In terms of their level of education, 71 participants were university graduates, 21 were university students, 15 had graduated from high school, and 8 had graduated from primary school.
The majority of the participants (63%) declared that they move with and without the assistance of a sighted guide, 35% of them move without any assistance of a sighted guide, while the rest declared that they always move with assistance. The participants were also asked to indicate the frequency of their independent movement (without sighted guide) using a 5-point Likert-type scale: always, often, sometimes, rarely, or never. Of the 115 participants, 61 stated that they often move independently, 30 participants stated that they always move independently, while the majority of the rest (n = 19) stated that they sometimes move independently.
Instruments and procedures
The questionnaires were developed as an accessible text document (.docx file) to allow the participants to use a screen-reading software of their preference. The text document was structured using plain text, first-level headings, numbered lists, and bulleted lists.
During the testing procedure, the participants were asked to evaluate each item included in the two questionnaires based on its usefulness using a 5-point Likert-type scale (1 = not significant at all, 2 = somewhat significant, 3 = neutral, 4 = significant, 5 = very significant).
Results
The means for the information were calculated. In the two lists derived from the participants’ answers, the items were sorted in a descending order, starting with those considered the most useful. Table 1 presents the mean score, the standard deviation (SD), and the range of the values for the top 50 items reported by the participants for each different environment (i.e. city centers and neighborhoods/residential areas), in a hierarchical order, from the most useful (order = 1) to the least useful. The value in the brackets next to the mean score shows the order that each item holds in the respective environment. As shown in the table, there are also values in brackets greater than 50. This was necessary to show the order of an item in relation to both environments respectively.
The most useful information in each environment.
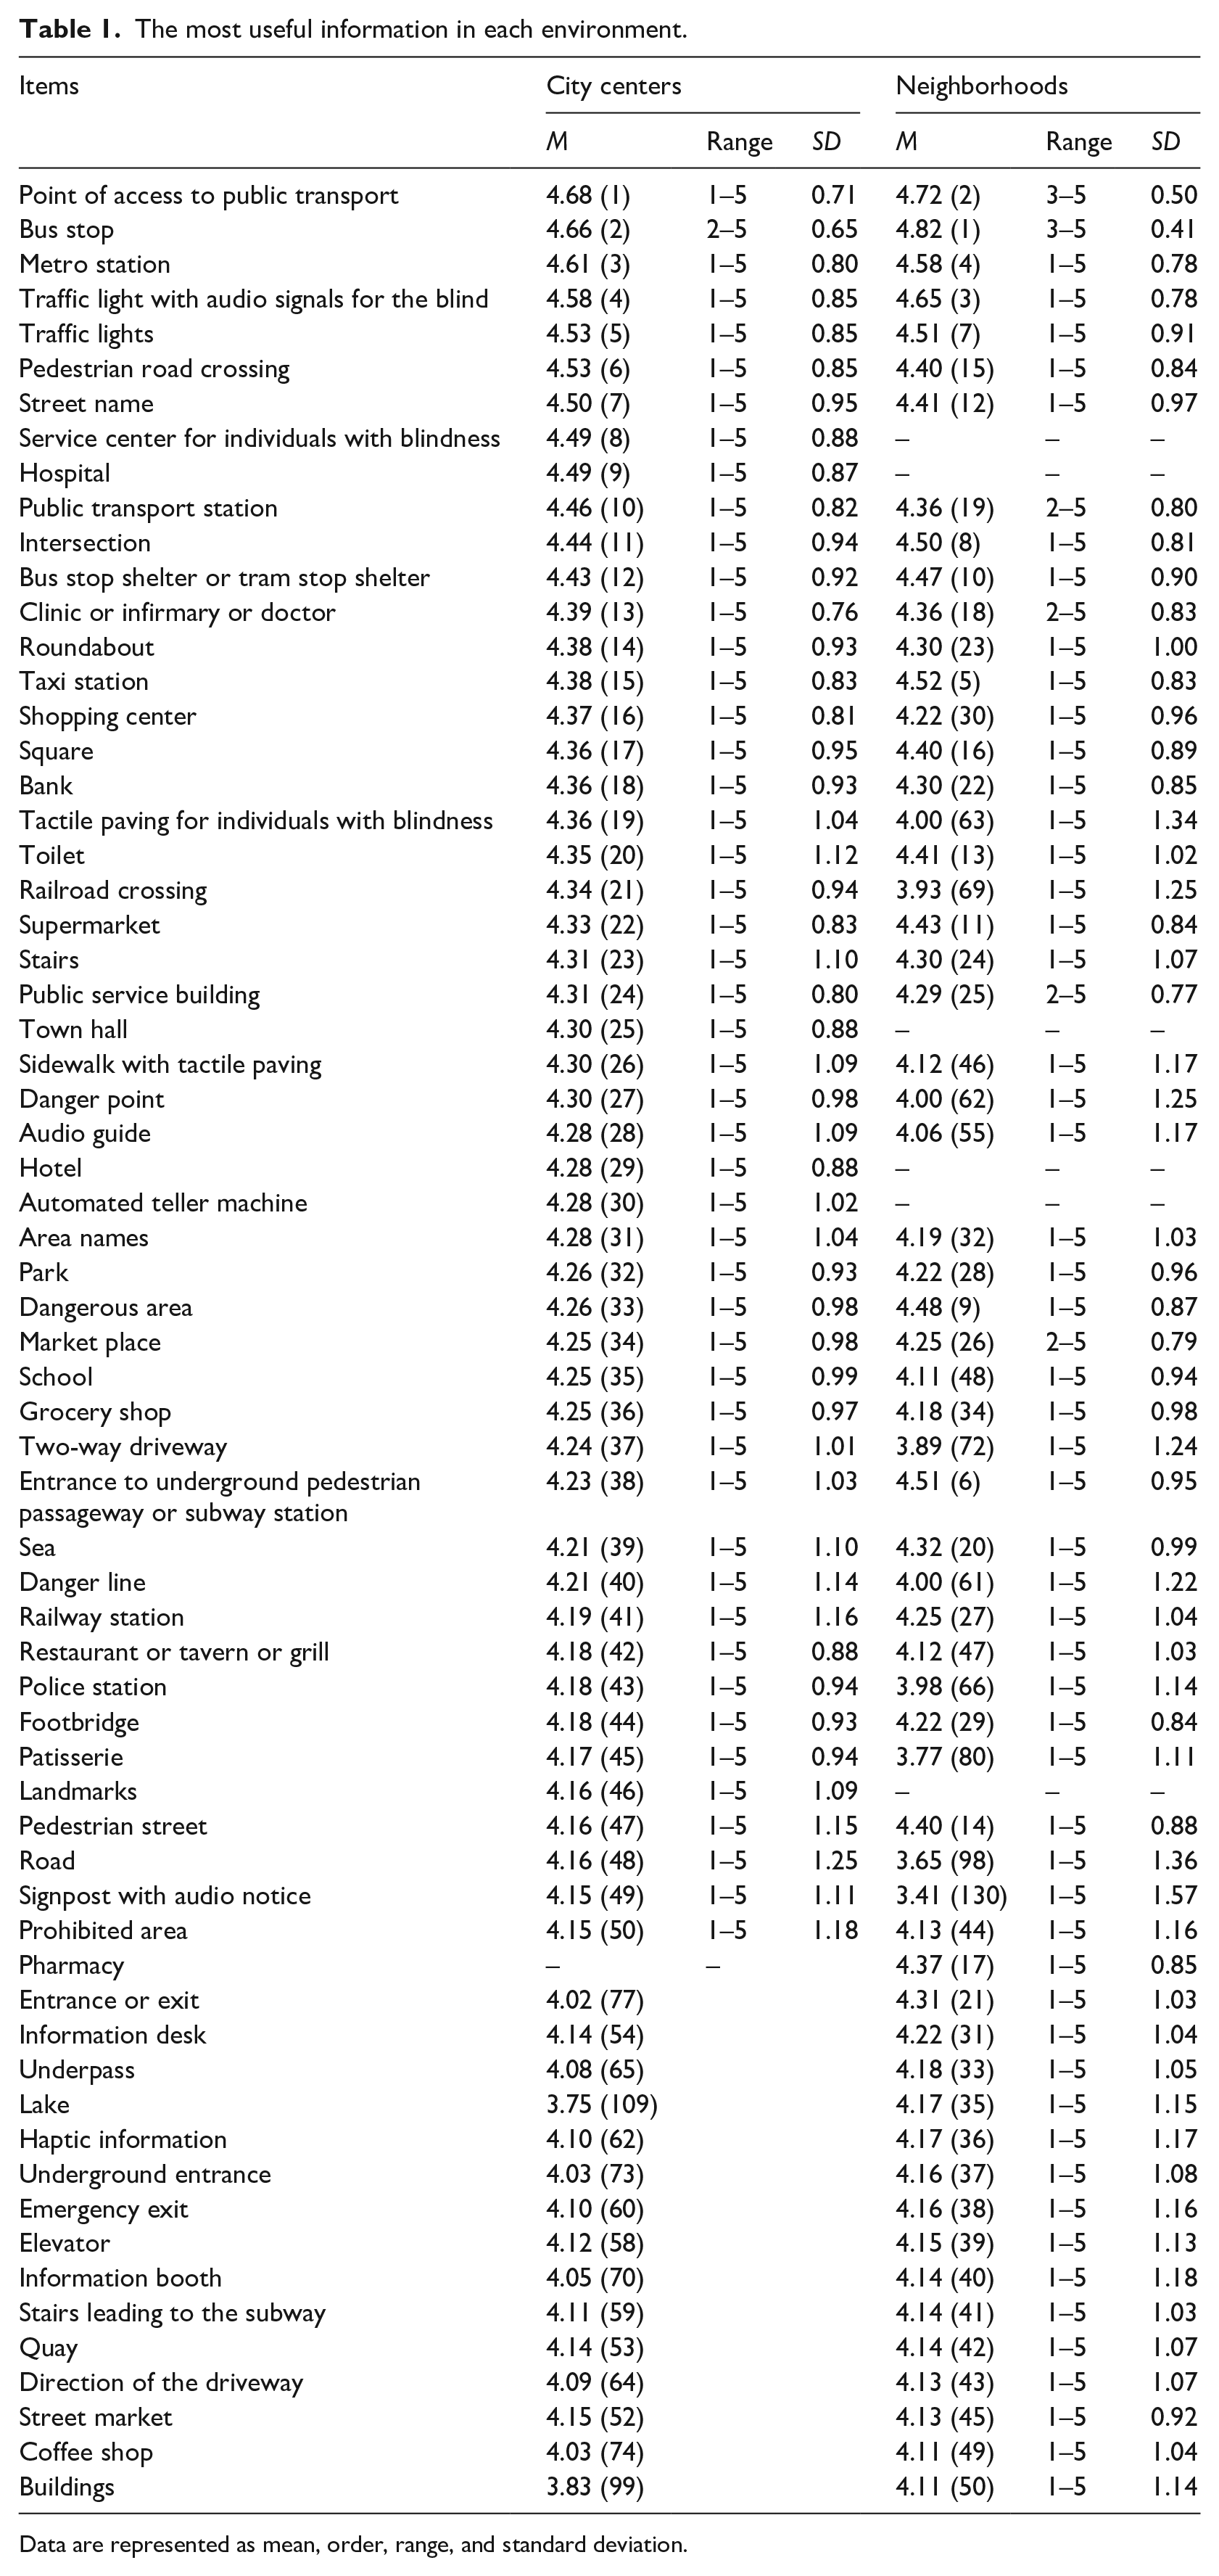
Data are represented as mean, order, range, and standard deviation.
Table 2 presents the means of the usefulness per each category of information and each country of origin. For the purpose of the analysis, the items of each questionnaire were classified into three categories: (a) safety (for instance, emergency exit, stairs, tree, obstacle), (b) location of services (for instance, gym, police station, park), and (c) wayfinding/orientation during movement (for instance, pedestrian street, sound source, tactile paving for individuals with blindness, olfactory landmark). The classification of each item in one or more of the three categories was based on the criterion of how an individual with blindness could use the information during their movement. The researchers who completed the classification were all experienced (both in research and teaching) in the field of O&M of individuals with blindness. There were cases of information that were included in more than one category.
Means of the usefulness per each category of information and each country of origin.

With regard to the city centers, it seems that the participants considered the information concerning “location of services” and “wayfinding/orientation during movement” more useful than the information concerning “safety.” However, the same applies to the neighborhoods/residential areas; the difference in means is smaller (see Table 2, Figures 1 and 2).
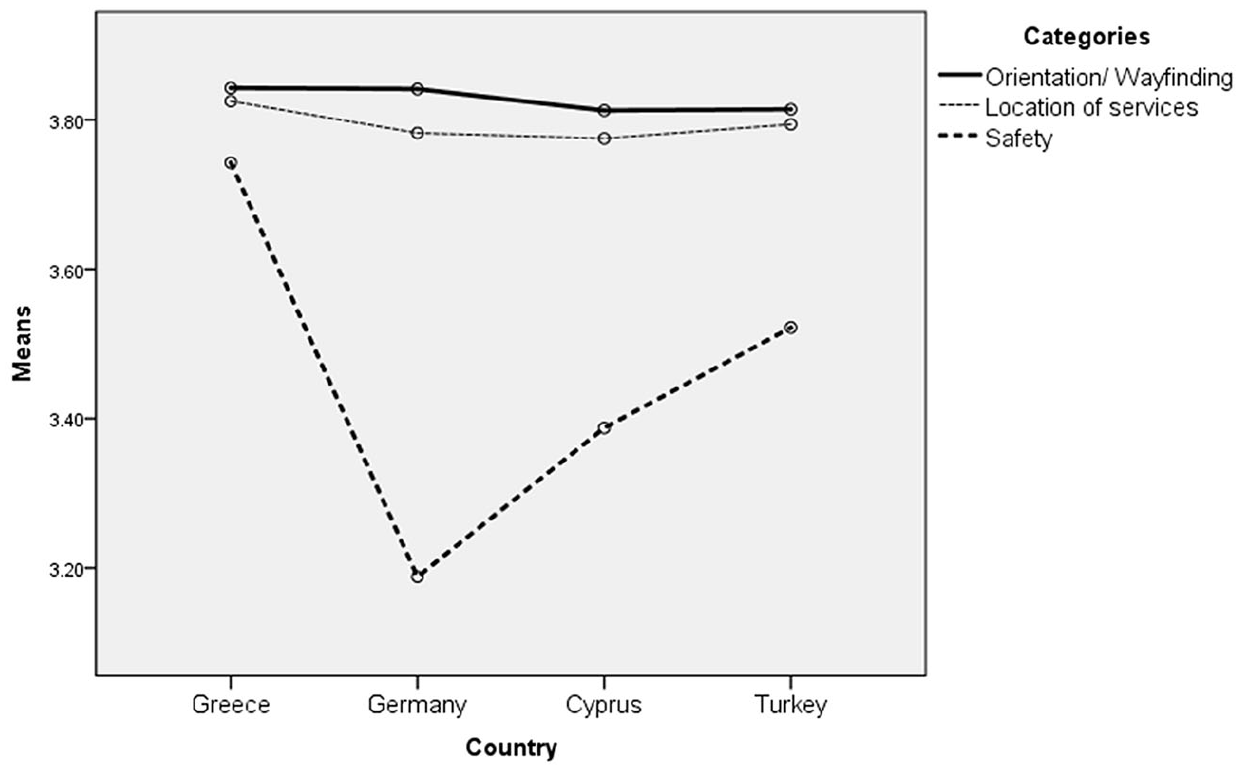
City centers: interaction between the category of information and the country of origin.
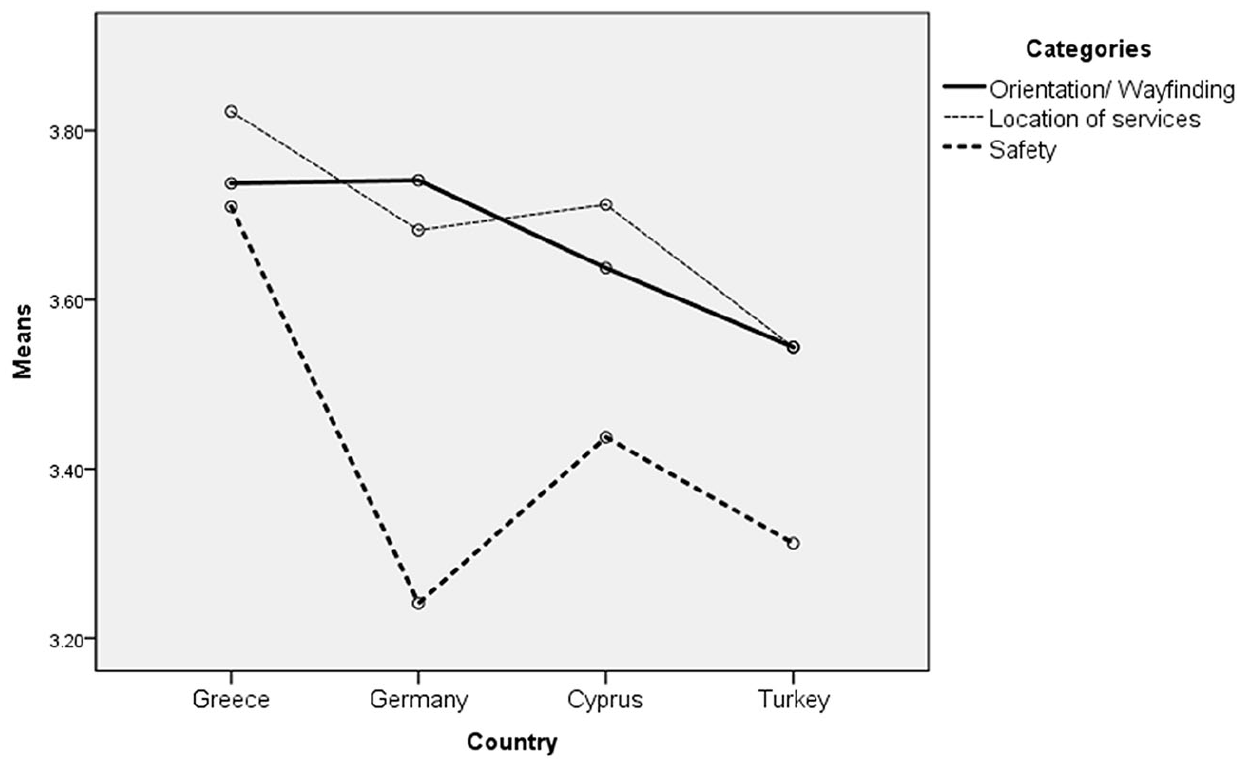
Neighborhoods/residential areas: interaction between the category of information and the country of origin.
However, it was observed that the items concerning safety differ in ascribed usefulness. Some of them were scored as highly useful (such as traffic light with audio signals for individuals with blindness, stairs, pedestrian road crossing, railroad crossing, dangerous area, and dangerous point), while others were not (such as poster, newspaper or magazine stands, people selling goods on the street, plants, and flower pot). These usually were informational items that do not have a high frequency of occurrence or are not directly related to the safety of the traveler with blindness. Moreover, there are a lot more items concerning “safety” that scored below 3.50 compared with the other two categories of information. For example, regarding the city centers, scored below 3.50, 53 out of 96 (55.2%) items concerned “safety,” 25 out of 84 (29.8%) items concerned “wayfinding/orientation during movement,” and 29 out of 100 (29.9%) items concerned “location of services.”
Participants attributed greater usefulness to the information concerning “safety” (t = 2.200, df = 114, p < .05), “wayfinding/orientation during movement” (t = 4.847, df = 114, p < .01), and “location of services” (t = 3.470, df = 114, p < .01) in city centers than in neighborhoods/residential areas.
Paying close attention to Table 2, one could observe a divergence of the mean scores among countries. With reference to the city center, there are differences in the mean scores among participants from different countries concerning “safety,” while with reference to neighborhoods/residential areas, the differences concern not only “safety” but also both “wayfinding/orientation during movement” and “location of services.” From all these differences, only the difference between Greek and German participants was statistically significant. The participants from Greece attributed greater usefulness to the information concerning “safety” compared with participants from Germany both as far as city centers (t = 2.320, df = 55, p < .05) and neighborhoods/residential areas (t = 2.129, df = 55, p < .05) are concerned.
In order to examine whether the usefulness attributed by the participants to the three categories of spatial information (items) could be influenced by the individual characteristics of the participants, six linear multiple regression analyses were carried out – three concerned the city centers and three the neighborhoods/residential areas. The variables “gender,” “age,” “age at onset of visual impairments,” and “ability of independent movement” were used as possible predictors of the usefulness that individuals with blindness attribute to the spatial information relative to the wayfinding/orientation, the location of services, and safety during movement.
Concerning the city centers, the first multiple regression analysis yielded an adjusted R2 of .026 (F = 1.747, p = .145). No significant individual predictors of the usefulness of the information referring to “wayfinding/orientation during movement” have emerged. The second multiple regression analysis yielded an adjusted R2 of .057 (F = 2.713, p < .05). Significant individual predictor of the usefulness of the information referring to “location of services” was age (b = −.248, p < .01). Elder individuals appeared to consider the information concerning “location of services” less useful. The third multiple regression analysis yielded an adjusted R2 of .049 (F = 2.481, p < .05). A significant individual predictor of the usefulness of “safety” items was age (b = −.193, p < .05). Elder individuals appeared to consider the information concerning “safety” less useful.
As far as neighborhoods/residential areas are concerned, the first multiple regression analysis yielded an adjusted R2 of .055 (F = 2.662, p < .05). The significant individual predictor of the usefulness of items referring to “wayfinding/orientation during movement” was age (b = −.238, p < .05). The second multiple regression analysis yielded an adjusted R2 of .119 (F = 4.833, p < .01). Significant individual predictor of the usefulness of the information referring to “location of services” was age (b = −.336, p < .01). The third multiple regression analysis yielded an adjusted R2 of .095 (F = 4.007, p < .01). Significant individual predictor of the usefulness of the information referring to “safety” was age (b = −.260, p < .01). Moreover, the analysis has featured the variable “gender” as close to significant individual predictor (b = −.171, p = .060). Older individuals appeared to consider the information in all three categories less useful. Moreover, females appeared to consider the information concerning “safety” less useful.
Discussion
The results of the descriptive statistical analysis of both the items for city centers and the items for neighborhoods/residential areas show that the participants consider public transport information (for instance, a bus stop, metro station, and taxi stations) to be more useful. Moreover, participants consider the information necessary for safe and independent movement as useful (e.g. traffic lights and traffic lights with audio signal for individuals with blindness, pedestrian streets, pedestrian road crossings, railroad crossings, intersections, tactile paving for individuals with blindness such as textured ground surfaces with indicators that assist pedestrians with blindness, stairs, danger points and dangerous areas, squares, street names, and area names). Those findings were expected since the research was focused on O&M aids. The basic aim of those aids is the provision of information that supports safe and successful mobility and orientation within an area. Roentgen et al. (2008) also noticed that the main functionality of electronic mobility aids is obstacle avoidance (safe and independent movement), while Gardiner and Perkins (2005) pointed out the importance of depicting hazards on maps. In addition, participants mentioned useful items they use for daily needs – for instance, service centers for individuals with blindness, toilets, hospitals, clinics, shopping malls or shopping centers, supermarkets, grocery shops, banks, post offices, automated teller machines, and parks.
Some mean scores are diverse for items from the two environments (see Table 1) such as the tactile paving for individuals with blindness, railroad crossings, danger points, patisseries, pedestrian streets, and entrances or exits. This result confirms the need for further investigation on the usefulness attributed to each item in different environments, which was also an aim of the present research. The research of Gardiner and Perkins (2005) and Koutsoklenis and Papadopoulos (2011a, 2011b, 2014), shows that the wayfinding cues to which individuals with visual impairments attribute importance are environment-specific. These differences between the two environments are probably due to the structure of the two different environments and due to the fact that some of the items does not occur that frequently in either of the two environments. For example, the tactile paving for individuals with blindness, as well as railroad crossings, occurs less frequently in neighborhoods/residential areas than in city centers. Moreover, the differences are likely due to the different needs of individuals with blindness when moving in each of the two different environments.
Some items that were placed high in the participants’ preference hierarchy provide olfactory, auditory, and haptic cues that could serve as landmarks: for instance, traffic lights with audio signal for individuals with blindness, bus stops (with emphasis on the noise the bus makes when it stops), parks (with emphasis on the difference in the soundscape), bakeries, restaurants or taverns or grills, and tactile paving for individuals with blindness. Hence, it is possible that some items were preferred because they serve an additional purpose or multiple purposes depending on the nature of the environmental features – permanent or temporary; auditory, haptic, or olfactory. Moreover, the inclusion of items in a tactile map depends on the targeted use of the tactile map (i.e. spatial encoding and cognitive map development, route decisions, landmarks or points of interest localization). The decision of which items should be included on which map constitutes very complex work. The present research studied end-users’ preferences, but it did not focus on how individuals with blindness use the information. It would be useful for future research to investigate how the useful items are used by individuals with visual impairments and whether these serve different purposes under various circumstances.
Furthermore, heterogeneity has been observed in the information concerning safety. Some items were mentioned as very useful but many were not. Those items were usually the ones with a small frequency of occurrence in the environment. This outcome suggests that the safety category was less valuable than the other two categories, and the notion of safety needs clearer definition by travelers with low vision or blindness. Concerning safety, the findings indicate that participants from Greece attributed greater usefulness to the information concerning “safety” compared with the participants from Germany, both as far as city centers and neighborhoods/residential areas are concerned. The divergence of the mean scores of the participants from different countries might have resulted from a variety of factors such as the extent of O&M training, the emphasis laid on specific skills, unfortunate experiences, and collisions with obstacles and/or previous injuries during city travel. The differences that exist between different countries lead us to consider examining in future research the possible differences in preferences of users from the same country or from the same city, as well as the factors that cause them. The design of O&M aids that will meet users’ preferences requires such studies.
Participants attributed greater usefulness to the information in all three categories in city centers than in neighborhoods/residential areas. This possibly is a result of the city centers’ complexity, which necessitates the appearance of the above-mentioned information on O&M aids more often than in the case of quiet and low-traffic neighborhoods/residential areas.
It is worth mentioning that the mean score of the least useful item in city centers was 2.658 and the mean score of the least useful item in neighborhoods/residential areas was 2.292. These mean scores fall between “somewhat significant” and “neutral,” so even these low-scoring items had some value.
There is no previous study identifying the user requirements of individuals with blindness for information to be included on audio-tactile maps. Thus, the findings of this study will be particularly important for designers of O&M aids for individuals with blindness. Moreover, the findings can be useful for O&M specialists, rehabilitation specialists, and teachers who design and construct O&M aids for their students with blindness. It should be mentioned that, although the present research refers to audio-tactile maps, the participants’ answers depict their preferences for information they need to know about the environment that should be included in O&M training and the development of other navigational aids. When using the terms “orientation and mobility aids” or “navigational aids,” we do not refer to aids such as long canes, sighted guide, and guide dogs. We refer to any aid (mainly tactile and audio-tactile maps) in which tactile or audio information is used to present spatial information that is capable to help the user with blindness to form a spatial cognitive map, and in general to learn a space in order to be able to move within it safely and successfully.
Any research on user requirements of individuals with impairments, such as this study, is particularly useful and can effectively guide the specialists involved in making aids for these users. A constant requirement of individuals with visual impairments is to develop aids that respond to their needs, and not devices that are simply presented as innovative and useful by researchers and developers, but are actually far from what they promise. However, apart from this general benefit, this study enables designers of O&M aids for individuals with blindness to choose what information they will present on the aids they develop each time, in relation to the aim of the aid and the number of items that can present (due to restrictions in the dimensions and the scale of the map). For example, if the aim is to create a tactile map as a mobility aid in a particular area and print it on a single A3 size sheet, so that the user can easily have it with him or her when he or she moves around that area alone, then the map scale is proportional to the size of the area that is required to fit into the A3 size paper. The map scale, almost always, does not allow the presentation of all the information existing in the environment on the aid. However, this information would probably be useful (more or less) to a user with blindness, and in that case, a selection of the information to be included in the aid should be made to achieve maximum level of usefulness for the user.
Limitations
A possible limitation of this study arises from generating mean values from a Likert-type scale. Such scales assume that the space between 1 and 2 is the same as the space between 2 and 3, and so on. This, however, is not absolutely correct as there could be some differences related to the attribution of values. The list of useful items for inclusion in accessible maps is not necessarily exhaustive, but provides technology developers with a good indication of the priorities of travelers with visual impairments, and can be added to subsequent studies.
Footnotes
Authors’ Note
The work presented in this paper was conducted in the frames of the AT-MAPS project.
Declaration of conflicting interests
The author(s) declared no potential conflicts of interest with respect to the research, authorship, and/or publication of this article.
Funding
The author(s) disclosed receipt of the following financial support for the research, authorship, and/or publication of this article: The project (543316-LLP-1-2013-1-GR-KA3-KA3MP) has been funded with support from the European Commission. This publication reflects the views only of the authors, and the commission cannot be held responsible for any use which may be made of the information contained therein.