




Abstract
The present research tests how socioeconomic inequality (within romantic relationships) predicts relationship quality and observable expressions of emotion—examining longitudinal self-report and behavioral data from both partners of romantic couples. In Part 1, we examined the romantic partners’ self-reports of relationship quality at baseline and after three and a half months. In keeping with prior research on how power inequality undermines relationship satisfaction, couples defined by greater socioeconomic inequality showed a decline in relationship quality over time. In Part 2, we examined observer ratings of emotional expressions in the romantic partners’ conversations in the laboratory. Here, we found greater expression of negative emotion in the conversations of couples defined by greater inequality. Importantly, it was inequality itself—rather than whether one has higher or lower socioeconomic status than the partner—that significantly predicted changes in relationship quality and observable expressions of negative emotion. These findings have implications for how deepening economic inequality may manifest in the weakening of intimate bonds—the quality of which is central to the well-being of individuals and broader society.
Intimate relationships are central to well-being (Lyubomirsky, 2008; Myers & Diener, 1995). Accordingly, scientists have long sought to understand the determinants of relationship quality in romantic relationships (Clark & Lemay, 2010; Finkel et al., 2016). Scientists have investigated the role of individual differences such as neuroticism or attachment style. Others have examined social and emotional behavior such as sharing good news, idealization, teasing, forgiveness, compassion, empathy, gratitude, laughter, and contempt (Davis & Oathout, 1987; Gable et al., 2004; Gordon et al., 2012; Gottman & Levenson, 2000; Karney & Bradbury, 1997; Keltner, 2009; Keltner et al., 1998; Murray et al., 1996). There is also a robust literature demonstrating how financial strain and poverty can weaken intimate bonds (Conger et al., 2010; Dakin & Wampler, 2008; Emery & Le, 2014; Jackson et al., 2014, 2016; Laumann et al., 1999; Papp et al., 2009).
The present research focuses on the socioeconomic status (SES) of romantic partners—examining how SES inequality between the partners predicts relational and affective outcomes. In classic sociology, social class has been defined and addressed in Marxian theories, Weberian theories, Durkheimian theories, and studies of gradationalism and social stratification (for a review, see Grusky, 2001). The current research defines and operationalizes SES as an individual’s rank in the socioeconomic hierarchy—as determined by wealth, education, and occupational prestige (Adler et al., 1994; Bourdieu, 1984; Domhoff, 1998; Kraus et al., 2012; Snibbe & Markus, 2005). We expect that greater SES inequality—operationalized as the degree to which romantic partners have dissimilar SES—will predict undermined relational and affective outcomes (as captured in self-reports of relationship quality over time and observable expressions of emotion). We expect these effects to hold for both higher and lower SES partners.
Similarity effect
Our predictions derive from several literatures. The first is that of the similarity effect in the formation and maintenance of romantic relationships (Anderson et al., 2003; Murray et al., 2002). People are attracted to similar others—in terms of physical, psychological, and demographic features (Berscheid & Walster, 1983; Byrne, 1971; Fehr, 1996; Hunt et al., 2015; Luo & Klohnen, 2005; Watson et al., 2004, 2014). As a consequence, people are likely to establish a romantic bond with a similar other; a phenomenon referred to as assortative mating (Buss, 1984; Klohnen & Luo, 2003; Lutz, 1905; Lykken & Tellegen, 1993). For instance, Schwartz et al. (2016) have found a strong tendency for people to marry those of similar educational backgrounds—among a sample of 7,398 couples who married between 1968 and 2013.
Furthermore, partner similarity promotes the long-term cohesion and stability of romantic relationships (Acitelli et al., 2001; Anderson et al., 2003; Burleson & Denton, 1992; Murray et al., 2002). Researchers have found that relationship satisfaction benefits from partner similarity in a wide range of factors such as attitudes, emotions, and educational achievement (Bleske-Rechek et al., 2009; Blum & Mehrabian, 1999; Caspi & Herbener, 1990; Gaunt, 2006; Luo & Klohnen, 2005; Russell & Wells, 1991). According to Murray et al. (1996, 2000, 2002), the sense of similarity/consensus with one’s romantic partner increases satisfaction, commitment, perceived understanding, and higher self-esteem.
The present research examines how partner dissimilarity in SES (i.e., SES inequality between partners) predicts relational and affective outcomes. Consistent with prior research, we expect that greater dissimilarity will undermine relationship quality—a prediction further supported by meta-analytic research on the similarity effect (Montoya & Horton, 2013). The similarity effect is found to be stronger for characteristics that are central to identity (such as SES) as compared to characteristics relatively peripheral to identity. The similarity effect is also found to be stronger for features that are easily detected by others. Given that naive observers can reliably identify targets’ SES from limited information such as 60-s thin slices of behavior (Bjornsdottir & Rule, 2017; Kraus & Keltner, 2009), these findings suggest that SES is a potent basis for the similarity effect.
Power asymmetry and inequity in romantic relationships
Our research also builds on and extends the literatures on power asymmetry and inequity within romantic relationships (Agnew & Harman, 2019; Hatfield & Traupmann, 1981; Simpson et al., 2015). The studies of power have revealed that our most intimate bonds are not free from power dynamics (Cho & Keltner, 2020; Keltner, 2016; Keltner et al., 2003; Kim et al., 2019). In romantic relationships, power is defined by the extent to which partners depend on one another (Emerson, 1962; Howard et al., 1986; Kim et al., 2019; Moreland & Levine, 1989; Rusbult et al., 1991; Thibaut & Kelley, 1959). The person with more resources to bring to the relationship (and more alternatives to the current relationship) tends to be less dependent—wielding more power/control within the relationship (Caldwell & Peplau, 1984; Kelley & Thibaut, 1978; Kim et al., 2019; Sprecher et al., 2006; Sprecher & Felmlee, 1997; Thibaut & Kelley, 1959).
Although most individuals (at least in Western European cultures) report a preference for an egalitarian relationship wherein both partners enjoy equal power, actual data from romantic couples reveal power asymmetries (to some extent) in approximately half of heterosexual and homosexual couples (Caldwell & Peplau, 1984; Galliher et al., 1999; Simpson et al., 2015). According to Sprecher and Felmlee (1997; Sprecher et al., 2006), these power asymmetries tend to remain stable across time. However, power asymmetries between romantic partners pose a threat to relationship quality—leading to lower satisfaction and more conflict (Caldwell & Peplau, 1984; Simpson et al., 2015; Sprecher et al., 2006). Powerful partners are also found to bully, coerce, and tease in harsh ways (Bentley et al., 2007; Falbo & Peplau, 1980; Gonzaga et al., 2008; Keltner et al., 1998, 2003; Langner & Keltner, 2008).
The classical framework of Equity Theory also provides insight and support for our predictions (e.g., Bellani et al., 2018; Hatfield & Traupmann, 1981). A basic proposition of the theory—which draws from exchange and social comparison theories—is that individuals feel distress when perceiving inequity in relationships with others (Huseman et al., 1987). In marital relationships, those who feel equitably treated in their marriages report greater relationship satisfaction, relationship stability, and sexual satisfaction (Bellani et al., 2018; Hatfield et al., 1982; Utne et al., 1984). The present research extends these literatures of power asymmetry and inequity by examining how SES inequality—a construct closely related to, yet distinct from power inequality or inequity (for conceptual distinctions, see Kraus et al., 2012)—within romantic relationships predicts relationship quality.
Economic inequality and relationships
Finally, our predictions also derive from the epidemiologically oriented research capturing how economic inequality weakens social ties (Wilkinson & Pickett, 2009). For example, people tend to trust other individuals less in regions where income inequality is higher (Kawachi et al., 1997; Lim et al., 2005; Oishi et al., 2011; Uslaner, 2002). Those in U.S. states with higher income inequality (such as New York or California) tend to score lower in trait Agreeableness—the Big Five personality factor known to predict empathy, altruism, and compassion (de Vries et al., 2011; John & Srivastava, 1999; Kogan et al., 2014). Structural income inequality has also been found to be associated with greater social conflict, violence, and racism (Connor et al., 2019; Daly et al., 2001; McCarty et al., 2006). And with respect to intimate relationships, income inequality has been related to higher divorce rates, lower marital satisfaction, and greater preference for financial prospect—rather than mutual affection—in choosing potential marriage partners (Cho et al., 2020; Levine et al., 2010; Lim et al., 2005).
More directly related to the current research, there are also initial strands of evidence suggesting that economic inequality at the dyadic level may also undermine relationship quality in romantic relationships. For instance, sociologists have found that spousal dissimilarity in education relates to lower marital satisfaction (Stutzer & Frey, 2006; Tynes, 1990; Weisfeld et al., 1992). Partner dissimilarities in income and working hours have also been associated with lower life satisfaction (Keizer & Komter, 2015). And although not specific to romantic couples, Côté et al. (2017) captured reduced affiliation—as measured in both self-reports and peer ratings of lower affiliative motivation, inauthentic facial expressions, and behavioral disengagement—in cross-class interactions (than same-class interactions) among strangers and friends.
The present research
The present investigation builds on and extends the aforementioned literature by examining the influences of SES inequality (between romantic partners)—as shown in longitudinal self-reports of relationship quality (Part 1) and observable expressions of emotion during conversations in the laboratory (Part 2). In Part 1, we examined romantic partners’ self-reports of relationship quality (relationship satisfaction, commitment, closeness, and thoughts about breaking up) at baseline and after three and a half months. We expected that SES inequality will predict an overall decline in relationship quality over this time span. In Part 2, we examined observer ratings of emotional expression in the romantic partners’ conversations about their relationship. We expected to find more negative (than positive) emotion in the interactions of couples defined by greater SES inequality. This prediction derives from two sources: (1) studies showing that negative emotions such as anger, envy, frustration, contempt, shame, and embarrassment are pronounced in hierarchical relationships (Keltner, 1995; Keltner et al., 1998; Van Kleef et al., 2015), whereas positive emotions such as laughter, love, and mirth track more egalitarian relationships (Clark & Taraban, 1991; Keltner, 2009; Kurtz & Algoe, 2017); and (2) studies showing that positive emotional processes (e.g., capitalization) relate to greater relationship satisfaction (Gable et al., 2004).
Part 1: Socioeconomic inequality predicts a decline in self-reported relationship quality over time
In the longitudinal survey portion of the study, we examined how SES inequality between romantic partners predicts self-reports of relationship quality (i.e., relationship satisfaction, commitment, closeness, and thoughts about breaking up) over a time span of three and a half months. Consistent with extant literature, we expected to observe a decline in relationship quality, in general, in couples whose SES backgrounds were defined by greater inequality.
Method
Participants and procedure
As part of a larger study of romantic couples, both partners of 81 couples were recruited from the San Francisco Bay Area through online flyers posted on https://Craigslist.org and paper flyers placed throughout the Bay Area. 1 While most couples were heterosexual, the sample also included four lesbian couples and one gay male couple. Ethnic backgrounds of these couples were quite diverse as compared to traditional college samples (Henrich et al., 2010): 52.5% participants identified themselves as European or European American, 17.3% as Chinese or Chinese American, 8% as African or African American, 4.3% as Mexican or Mexican American, and 17.9% as other ethnicities. Age ranged from 17 years to 60 years (M = 23.84, SD = 6.37), and relationship length ranged from 6 months to 361 months (M = 29.23 months, SD = 43.40 months). Nearly half (46%) of the couples reported that they were cohabiting at the time of the initial survey.
After both partners agreed to participate in the study, the couples completed an online survey before their laboratory visit and were recontacted three and a half months after their laboratory visit to complete an online follow-up survey. One hundred thirty-three participants (i.e., 82.6% of the total sample) responded to the follow-up survey, including nine couples who reported a breakup sometime after the laboratory visit. Each partner received US$20 for participating in the laboratory study, and US$10 for participating in the follow-up survey.
Measures
Socioeconomic status
Both subjective and objective measures of SES were collected. Participants completed two versions of the MacArthur Scale of Subjective SES (e.g., Adler et al., 2000). In one version, participants were presented with an image of a ladder with 10 rungs. They then read the following instructions.
Think of this ladder as representing where people stand in the United States. At the top of the ladder are the people who are the best off—those who have the most money, the most education and the most respected jobs. At the bottom are the people who are the worst off—who have the least money, least education, and the least respected jobs or no job. The higher you are on this ladder, the closer you are to the people at the very top; the lower you are, the closer you are to the people at the very bottom. Where would you place yourself on this ladder?
Each rung of the ladder was given a number between 1 and 10, and participants placed a large “X” on the rung where they think they themselves stand. Higher numbers reflect higher placement on the ladder (M = 5.57, SD = 1.64). In another version, participants were presented with an image of a ladder, also with 10 rungs, which represents hierarchy in their community. They then read these instructions.
Think of this ladder as representing where people stand in their communities. People define community in different ways; please define it in whatever way is most meaningful to you. At the top of the ladder are the people who have the highest standing in their community. At the bottom are the people who have the lowest standing in their community. Where would you place yourself on this ladder?
Again, each rung was given a number between 1 and 10, and participants placed a large “X” on the rung where they think they stand; higher numbers reflecting higher placement on the ladder (M = 5.51, SD = 1.65). Scores from the two ladders were positively correlated (r = .44, p < .001).
Objective education information was also collected: own education, maternal education, and paternal education. For each person, participants chose (a) high school graduate or less, (b) some college (not currently in college), (c) some college (currently in college), (d) technical school, (e) college graduate, or (f) graduate school. Median education level was some college (currently in college) for the participants and college graduation for both mothers and fathers. Subjective SES (averaged across U.S. and community scores) and education level (averaged across own, maternal, and paternal education scores) were positively correlated (r = .22, p = .008).
As input for response surface analysis (RSA; described in detail in data analytic strategy), keeping with prior research (Côté et al., 2017), we standardized each score and averaged across the standardized scores for an overall index of actor SES (M = −0.01, SD = 2.98) for each participant. 2 Since data from both partners of couples were collected, each actor SES score had a corresponding partner SES score.
Baseline relationship quality
We measured relationship satisfaction with the 5-item Relationship Satisfaction subscale of the Investment Model Scale (Rusbult et al., 1998). Participants responded to items such as “Our relationship makes me happy” on a 7-point scale (1 = strongly disagree to 7 = strongly agree). Higher scores indicate greater satisfaction in the relationship (α = .88, M = 6.02, SD = 0.87). We also measured relationship commitment with the 7-item Commitment Level subscale of the Investment Model Scale (Rusbult et al., 1998). Participants responded to items such as “I want my relationship to last for a very long time” on a 7-point scale (1 = strongly disagree to 7 = strongly agree). Higher scores indicated greater commitment to the relationship (α = .87, M = 6.13, SD = 0.92). Closeness was measured with the “Inclusion of Other in the Self” scale (Aron et al., 1992). Participants were presented with a series of seven pairs of circles. In each pair of circles, one circle represented the participant and the other circle represented the partner, and the circles overlapped to varying degrees (from not overlapping at all to almost completely overlapping). Participants chose the pair which best represents their relationship with their romantic partner. Higher scores indicated greater closeness (M = 5.18, SD = 1.24). Participants’ thoughts about breaking up were measured with a 4-item questionnaire adapted from the Marital Instability Index (Booth et al., 1983; Impett et al., 2010). Participants answered the following questions: “Have you or your partner ever seriously suggested the idea of breaking up?” “Have you discussed breaking up with a close friend?” and “Even people who get along quite well with their partner sometimes wonder whether their relationship is working out. Have you ever thought your relationship might be in trouble?” on 3-point scales (1 = never; 2 = within the last month; 3 = currently). They also answered the following question: “Have you and your partner had a separation or broken up?” on a 2-point scale (1 = never, 2 = within the last month). Since these four breakup items were measured on different response scales, we standardized each score and averaged across the four standardized scores to create an index of thoughts about breaking up. Higher scores indicated more thoughts about breaking up (α = .70, M = −0.01, SD = 2.93). Finally, after reversing their score on thoughts about breaking up, we standardized each of the four indicators and then combined them (by averaging across the four standardized scores) into a composite variable of baseline relationship quality (α = .70, M = 0.17, SD = 2.87), as input for the response surface analyses. 3
Follow-up relationship quality
Three and a half months after their visit to the laboratory, participants completed the same measures of relationship quality: relationship satisfaction (α = .93, M = 5.67, SD = 1.22), relationship commitment (α = .88, M = 5.97, SD = 1.06), closeness (M = 5.03, SD = 1.45), and thoughts about breaking up (α = .78, M = 0.00, SD = 3.13). As with baseline measures, we standardized each of the four indicators and combined them into a composite variable of follow-up relationship quality (α = .84, M = 0.11, SD = 3.18).
Data analytic strategy
To test our hypothesis that SES inequality between romantic partners will predict relationship quality over time, we used RSA, which allows nuanced testing of (dis)similarity hypotheses. RSA models the ways in which all possible combinations of two variables (i.e., in this case, actor SES and partner SES) predict the outcome variable(s) (i.e., negative and positive emotionality). This approach is found to enable more accurate and fine-grained testing of (dis)similarity hypotheses compared to conventional approaches including profile correlation scores, difference scores, and absolute difference scores (Barranti et al., 2017; Humberg et al., 2019). We modeled the RSA effects using the RSA package (version 0.9.11; Schönbrodt, 2017) in R.
By using polynomial regression coefficients to plot how all possible combinations of actor SES and partner SES predict the outcome variable in three-dimensional space, RSA provides four coefficients (a1–a4) that statistically test how these combinations predict the outcome variable (Barranti et al., 2017). The a1 coefficient tests the linear slope along the line of perfect congruence, revealing whether congruence at higher versus lower levels of SES predicts the outcome variable. The a2 coefficient tests the curvature of the line of perfect congruence, revealing whether congruence at extreme versus moderate levels of SES predicts the outcome variable. We did not expect significant a1 or a2 coefficients, expecting that couples defined by greater inequality will in general show more negativity than positivity (regardless of their specific levels of SES).
Our main focus—among the four RSA coefficients—was on the a3 and a4 coefficients. The a3 coefficient tests the slope of the line of incongruence. The direction (positive or negative) and significance of the a3 coefficient indicate whether a particular direction of incongruence predicts the outcome variable: a positive and significant a3 coefficient would suggest that having higher SES as compared to one’s partner (actor SES > partner SES) predicts higher levels of the outcome variable, whereas a negative and significant a3 coefficient would suggest that having lower SES as compared to one’s partner (actor SES < partner SES) predicts higher levels of the outcome variable. Most importantly, the a4 coefficient tests the curvature of the line of incongruence, so that the direction (positive or negative) and significance of the a4 coefficient indicate whether the magnitude of incongruence in SES (i.e., the absolute amount of SES inequality between the two romantic partners) predicts the outcome variable: a positive and significant a4 coefficient (i.e., convex curvature) would suggest that greater SES inequality predicts higher levels of the outcome variable, whereas a negative and significant a4 coefficient (i.e., concave curvature) would suggest that greater SES inequality predicts lower levels of the outcome variable. For confidence in the conclusion drawn from a significant a4 coefficient, the a3 coefficient has to be nonsignificant, given that a significant a3 coefficient—implying that a specific direction of incongruence matters—would contradict the general incongruence effect implied by a significant a4 coefficient (Humberg et al., 2019).
Results
Among the total sample, approximately 15.7% of the couples had perfectly identical SES (as indexed with our measurements), and the rest of couples had varying degrees of SES inequality between the two partners. We also found that the two partners’ SES were positively correlated (r = .27, p = .002), consistent with overall findings from the assortative mating literature (e.g., Buss, 1984; Klohnen & Luo, 2003; Lutz, 1905; Lykken & Tellegen, 1993).
To examine how SES inequality between romantic partners predicts relationship quality over time, we conducted multilevel polynomial regression—given the nature of the data (i.e., individuals nested within couples)—and used these regression coefficients to generate the four RSA coefficients. The polynomial regression coefficients and four RSA coefficients are presented in Table 1, and the response surfaces are shown in Figure 1. Consistent with our hypothesis and findings from Part 1, we found a significant negative (i.e., concave) curvature (a4 = −.18, p < .01) in a model predicting the follow-up relationship quality (controlling for baseline relationship quality). This suggests SES inequality between romantic partners predicted a decline in relationship quality over the time span of three and a half months. The a3 coefficient was nonsignificant, further supporting the conclusion drawn from the a4 coefficient. That is, the specific direction of dissimilarity (i.e., whether one has relatively higher or lower SES as compared to the partner) did not significantly predict relationship quality over time. The a1 and a2 coefficients were also nonsignificant, suggesting that SES inequality predicted relationship quality over time regardless of individual differences in SES (i.e., lower vs. higher SES and extreme vs. moderate SES).

Response surfaces for actor SES and partner SES predicting follow-up relationship quality; controlling for baseline relationship quality (Part 1). SES = socioeconomic status.
Response surface analyses: SES inequality predicting outcomes in Parts 1 and 2.

Note. SES = socioeconomic status; RSA = response surface analysis; A = actor SES; P = partner SES. Standard errors are in parentheses.
*p < .05; **p < .01.
Discussion
Results from Part 1 supported our hypothesis that SES inequality between romantic partners predicts a decline in relationship quality over time. Importantly, it was the absolute amount of inequality itself—rather than whether one has relatively higher or lower SES as compared to the partner—that was driving the changes in self-reports of relationship quality (i.e., relationship satisfaction, commitment, closeness, and thoughts about breaking up) over time.
Part 2: Socioeconomic inequality predicts greater expression of negative emotion in romantic partners’ conversations
In a laboratory portion of this study, we videotaped both partners of actual romantic couples while having semi-structured conversations about their relationship. Outside observers, naive to hypothesis, rated the overall affective tone (i.e., positivity and negativity) of these videotaped conversations. Consistent with our Part 1 results and extant literature, we expected to find greater expression of negative emotion (rather than positive emotion) in the face-to-face conversation of romantic partners whose relationships were characterized by greater SES inequality.
Method
Participants and procedure
The same couples from Part 1 came into the laboratory, completed baseline measures, and participated in semi-structured videotaped conversations. For these conversations, couples were seated in two chairs in a private room where the chairs were angled to face each other. Two small cameras were mounted on the wall approximately 6 feet (1.83 m) above the ground, with a camera pointed at each partner at an angle which allows full-frontal recording. These cameras, visible to the couples, captured an image of the participants from the top of their heads to their laps, thus allowing for the coding of facial, bodily, and gestural behavior. The cameras were controlled by research assistants—from an adjacent control room—who were able to see and hear activities in the experiment room and were also able to communicate with the participants via intercom. Relevant to the current research, each partner took a turn in speaking about a time in their life when they felt significant love for their partner and how they expressed that love. Speaking order was randomly assigned with a coin toss, and length of the conversations ranged from 51 s to 8 min (M = 3 min, 37 s; SD = 1 min, 10 s).
Outside observer ratings of emotional expression in romantic partners’ conversations
Three trained coders, blind to the hypothesis, independently rated the videotaped conversations between the partners for their expression of positive and negative emotion.
Expression of positive emotion
Coders rated the extent to which participants expressed positive emotion while talking to their partner, using a 7-point scale (1 = no positive emotions at all to 7 = a lot of positive emotions; α = .83, M = 4.22, SD = 1.26).
Expression of negative emotion
Coders also rated the extent to which participants expressed negative emotion while talking to their partner, using a 7-point scale (1 = no negative emotions at all to 7 = a lot of negative emotions; α = .79, M = 1.53, SD = 0.79).
Data analytic strategy
To test our hypothesis that SES inequality between romantic partners will predict emotional expression in their conversations, we modeled RSA effects using the RSA package (version 0.9.11; Schönbrodt, 2017) in R, same as in Part 1.
Results
To examine how SES inequality between romantic partners predicts the expression of positive emotion and negative emotion, each, in couples’ conversations, we again conducted multilevel polynomial regression and used these regression coefficients to generate the four RSA coefficients (as in Part 1). The polynomial regression coefficients and four RSA coefficients are presented in Table 1, and the response surfaces are shown in Figure 2(a) and (b). Mirroring the results in Part 1, we found a significant positive (i.e., convex) curvature in the model predicting negative emotional expression (a4 = .06, p < .05). This suggests that SES inequality between romantic partners predicted greater expression of negative emotion during the conversations. The a3 coefficient was nonsignificant, further supporting the conclusion drawn from the a4 coefficient. That is, the specific direction of dissimilarity (i.e., whether one has relatively higher or lower SES as compared to the partner) was not a significant predictor of negative emotional expression. The a1 and a2 coefficients were also nonsignificant, suggesting that SES inequality predicted negative emotional expression regardless of individual differences in SES (i.e., lower vs. higher SES and extreme vs. moderate SES). Positive emotional expression, however, was not significantly predicted by SES inequality between romantic partners, as shown in the nonsignificant a4 coefficient.
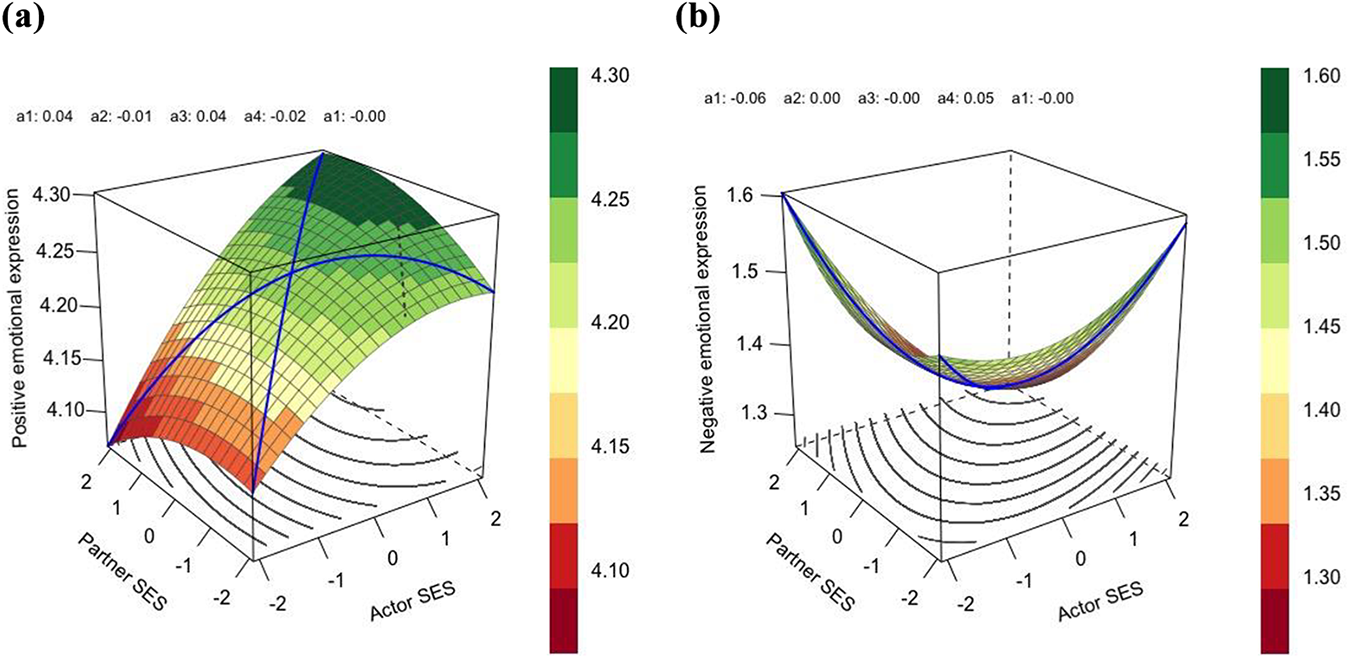
(a) Response surfaces for actor SES and partner SES predicting observer ratings of positive emotional expression (Part 2). (b) Response surfaces for actor SES and partner SES predicting observer ratings of negative emotional expression (Part 2). SES = socioeconomic status.
Discussion
Overall results from Part 2 supported our hypothesis, showing that negative emotional expression was more pronounced in the interactions of couples defined by greater SES inequality. Importantly, again as in Part 1, it was the absolute amount of inequality itself—rather than whether one has relatively higher or lower SES as compared to the partner—that was driving the effects on outside observer ratings of negative emotional expression during couples’ conversations. These findings potentially suggest a behavioral mechanism (display of negativity) through which SES inequality between romantic partners might undermine relationship quality. However, in our behavioral data, SES inequality only predicted outside observer ratings of negative emotional expression—and not of positive emotional expression—at a significant level. We in part attribute such results to the specific topic of the conversation—which would have lead majority to couples to express more positive emotion in general, as can be seen in the descriptive means—and also find these patterns to be consistent with prior research on affect in hierarchical relationships—which demonstrate that negative emotions, more so than positive emotions, tend to track hierarchical/unequal interpersonal relationships (Keltner et al., 1998; Kraus et al., 2011; Van Kleef et al., 2015).
General discussion
Based on longitudinal self-reports and behavioral data from partners in romantic relationships, the present research tested the hypothesis that SES inequality between romantic partners undermines relationship quality. In Part 1, the longitudinal portion of the study, we found that greater SES inequality predicted a decline in self-reported relationship quality (i.e., relationship satisfaction, commitment, closeness, and thoughts about breaking up) over the time span of three and a half months. Converging with these findings, in Part 2, the laboratory portion of the study, we found relatively more expression of negative emotion, as detected by outside observers, in the face-to-face conversations of couples defined by greater inequality.
The current findings contribute to several literatures. First, our findings advance the study of similarity within close relationships. While the central role of similarity in promoting interpersonal attraction and relationship satisfaction has been well-documented across a wide range of characteristics (e.g., Anderson et al., 2003; Buss, 1984; Klohnen & Luo, 2003; Lutz, 1905; Lykken & Tellegen, 1993; Murray et al., 2002), how (dis)similarity in SES might predict relational outcomes has yet to be examined in-depth, and most of the relevant findings in this domain have relied on self-report measures and were cross-sectional. By using both longitudinal measurement and observational methods, the present research documented that SES inequality, or dissimilarity, predicted more negative emotional expression and declines over time in self-reports of satisfaction, commitment, closeness, and thoughts about breaking up. These findings held for both partners, namely those of lower SES than the partner, and those with higher SES, suggesting the costs of inequality in romantic relationships extend to people with greater and lesser advantage in terms of social class.
The findings from both studies also contribute to the expanding study of SES (Kraus et al., 2012). Prior research bridging SES and intimate relationships have, for instance, related lower SES to reduced reports of commitment to the relationship and lower degrees of sexual satisfaction (e.g., Emery & Le, 2014; Laumann et al., 1999). These studies, of note, focused largely on how SES influences the individual. The present research extends this literature to the discussion of how inequality in SES—within a particular dyadic context—influences well-being in intimate relationships, and shows that this dynamic is evident in behavioral and longitudinal processes.
Also notable is the fact that results from our longitudinal survey and behavioral data, together, may suggest a potential route through which SES inequality between romantic couples eventually undermines relationship quality. In our observer ratings of the emotional dynamics of couples’ conversations in the laboratory, negative emotional expression was relatively more pronounced in the interactions of couples defined by greater inequality, in keeping with prior research on emotional processes in hierarchical social relationships (Keltner et al., 1998; Kraus et al., 2011; Van Kleef et al., 2015). This points to obvious mechanisms of how SES will shape romantic satisfaction (Gottman & Levenson, 1989, 2000).
Other possible mechanisms of the inequality-relationship quality link—derived from prior research on how SES shapes differences in values and taste, emotional regulation strategies, approach versus inhibition relational goals, or threat vigilance, to name a few (Côté et al., 2010; Keltner et al., 2003; Kraus et al., 2011; Snibbe & Markus, 2005)—also represent future steps in unpacking how inequality shapes romantic relationships. And given that our prediction about the inequality–relationship quality link is in part rooted in the literature of power asymmetry in intimate relationships, it would also be a potential next step of inquiry to examine whether power differences—in control over resources of influence within the dyad—are another route through which SES inequality between romantic partners reported decreased relationship quality over time.
Alongside these extensions of the present investigation, it is also important to consider the limitations of our two studies. First, Parts 1 and 2 were based on the same sample. Despite considerable diversity in the demographic backgrounds of couples, future research based on different populations of greater sample size will increase the generalizability of conclusions drawn from the current research. Second, although participants’ material wealth is embedded in the subjective SES measures, objective income information was not collected in the study. Hence, it would be an important future step to directly obtain objective measures of wealth (e.g., personal income, household income) and, given sufficient sample size, to compare how the different dimensions of objective SES (e.g., material wealth vs. educational attainment) and subjective SES, as captured in the MacArthur ladder measure, contribute to the inequality–relationship quality link (e.g., Kraus et al., 2012). Furthermore, the current analyses do not directly speak to whether the effects of SES inequality between romantic partners on relationship quality might differ depending on their relationship length (due to limitations of the statistical method used in our studies)—which would be an important inquiry to address in future work.
Finally, a meaningful future step would be to understand how SES inequality unfolds into outcomes in other kinds of relationships. Social support from friendships, work relations, and mentor–mentee relations provide a firm basis for an individual’s rise in society. Given these circumstances, findings from the present investigation may suggest that relational costs of wealth disparities might function as one means by which structural inequality is maintained and perpetuated (for other inequality-enhancing mechanisms, see Piff et al., 2018).
Supplemental material
Supplementary_material - Socioeconomic inequality undermines relationship quality in romantic relationships
Supplementary_material for Socioeconomic inequality undermines relationship quality in romantic relationships by Minha Cho, Emily A. Impett, Belinda Campos, Serena Chen and Dacher Keltner in Journal of Social and Personal Relationships
Footnotes
Acknowledgment
The authors would like to thank Cameron Anderson, Iris Mauss, members of the Berkeley Social Interaction Laboratory, members of the Self Identity and Relationships Laboratory, and two anonymous reviewers for their helpful feedback on previous versions of the manuscript.
Funding
The author(s) disclosed receipt of the following financial support for the research, authorship, and/or publication of this article: This work was supported by the Russell Sage Foundation.

Open research statement
Supplemental material
Supplemental material for this article is available online.
Notes
References
Supplementary Material
Please find the following supplemental material available below.
For Open Access articles published under a Creative Commons License, all supplemental material carries the same license as the article it is associated with.
For non-Open Access articles published, all supplemental material carries a non-exclusive license, and permission requests for re-use of supplemental material or any part of supplemental material shall be sent directly to the copyright owner as specified in the copyright notice associated with the article.
