



Abstract
Recently, Wagers articulated a theory of internal power to explain intimate partner violence (IPV). Internal power is conceptualized as comprising five domains: self-concept clarity, self-esteem, self-efficacy, self-determination, and mastery. Individuals with high internal power are expected to engage in little to no IPV. The present study tested measurement invariance of the internal power instrument across sex and race/ethnicity using a sample of 749 college students. Tests for measurement invariance indicated partial invariance of the internal power instrument across sex and race/ethnicity. Further, group-based structural equation models revealed several sex- and race/ethnicity-specific differences in the relationships between the five factors of internal power and self-reported IPV perpetration. Implications for Wagers’ internal power theory and similar instruments are discussed.
Keywords
Introduction
It is commonly accepted that power plays an important role in intimate partner violence (IPV; e.g. Babcock et al., 1993; Coleman & Straus, 1986; Murphy & Meyer, 1991), yet theories articulating causal pathways between power and IPV are rare (e.g., Grose & Grabe, 2014). Emery (2011) argued power should be restored to its central place in understanding IPV, and Grose and Grabe (2014) noted the importance in differentiating power from control in theoretical development. Wagers’ (2012, 2015) theory of internal power attempts to address these criticisms of theories of IPV.
Wagers (2012, 2015) notes traditional definitions of power (e.g., Blood & Wolf, 1960; Cromwell & Olsen, 1975) conceptualize power as derived from external social resources and used for the purpose of controlling others. Wagers argues this conceptualization of power is too narrow because it ignores internal characteristics, such as sense of self (identity) and self-worth, which are important psychological resources that produce a sense of power or powerfulness (Websdale, 2010). Referencing social psychological literature on personal power (see Anderson et al., 2012; Galinsky et al., 2008), Wagers theorized power has two distinct types: external power (social) and internal power (personal). Wagers et al. (2019) suggested particular aspects of internal power may vary in how they impact IPV perpetration across sex and race/ethnicity; however, this supposition was not tested. Therefore, the present study sought to test (a) measurement invariance of the internal power measure tested in Wagers et al. across sex and race/ethnicity groups and (b) sex/race group differences in the internal power-IPV relationship. This exploration will help identify strengths and weaknesses in the internal power measure and may inform policy and prevention/treatment initiatives.
Literature review
Specific to IPV, the terms “power and control” emerged in the 1980s from the Duluth Model Batterer Intervention Program curriculum, which established the concept of battering and launched the well-known “Power and Control Wheel.” Political advocacy of the battered women’s movement used the Duluth model and its Power and Control Wheel to raise awareness about IPV. This linking of power and control with IPV led to ambiguity over “power and control,” however, resulting in unclear and inconsistent definitions and measures of power and control. These issues have created challenges to developing power and control theories of IPV that articulate testable hypotheses (e.g., Emery, 2011; Grose & Grabe, 2014; Wagers et al., 2019).
Power and control are distinct concepts that need clear delineation in definitions and measurement. This is difficult to achieve because the concepts tend to overlap and, in general, lack consensus on their conceptualization and operationalization. For example, “sense of control” is conceptualized as shaped by social status and appears in the literature in various forms (Mirowsky & Ross, 1991), such as locus of control (Rotter, 1966), instrumentalism (Wheaton, 1980), self-directedness (Kohn & Schooler, 1982) and even powerlessness (Seeman, 1983). Conversely, power is historically conceptualized as a social-relational construct with the individual’s power understood in relation to interpersonal dynamics (Thibaut & Kelley, 1959; Weber, 1947). Thus, power is traditionally conceptualized as a combination of possession of resources and influence over others.
Most of the research on power examines the process within small groups, such as workplace dynamics between supervisor and employee. Interpersonal dynamics in the marriage are viewed as analogous to small social groups with hierarchical power structures, like the workplace (Gray-Little & Burks, 1983). Based on this assumption, Blood and Wolf (1960) conceptualized conjugal power (later termed marital power) in relation to decision-making authority. However, this conceptualization was criticized for being too narrow and unidimensional (Heer, 1963). Consequently, Cromwell and Olsen (1975) developed a three-pronged classification for power: power processes (techniques used to gain control); power bases (resources like money, skill, cultural authority); and power outcomes (results of using power). Their multidimensional definition of power became commonly used in IPV research on power.
Power and IPV
Family violence researchers integrated conflict theory with work on marital power, arguing power is part of hierarchical family structure and violence is a consequence of conflicts between individuals as they struggle for power (Coleman & Straus, 1986; Straus, 1971). Straus (1971) argued that spousal relationships with greater inequality are more likely to experience conflict, and marriages with more conflict have increased risk for IPV. Family violence researchers used Blood and Wolfe’s (1960) measure for marital power based on decision-making authority to examine the relationship between conflict, power, and violence. Research found that couples with either male- or female-dominant power structure experienced more conflict and violence, compared to egalitarian couples (Coleman & Straus, 1986). However, the degree of consensus about each partner’s decision-making authority played an important role. For example, conflict was greatest among male-dominant couples when there was little to no consensus about decision-making authority (Straus, 1971).
Although several scholars studied marital power and IPV, the research was plagued with many challenges because marital power was an extremely difficult construct to measure and there were myriad definitions of power (Murphy & Meyer, 1991). Eventually, this body of research was essentially abandoned because it was too difficult to empirically test the relationship between power and IPV without a consistent definition and measure of marital power (Babcock et al., 1993). However, there is currently a resurgence of interest in theory and research testing power as central to understanding IPV (Emery, 2011; Grose & Grabe, 2014; Wagers, 2015).
Internal power
Recent developments in the social psychological literature demonstrate power is not only social-relational, but also intrapersonal, or personal power (Anderson et al., 2012). Personal power is conceptualized as a psychological property gained from internal resources such as personal independence. Personal power is defined as the extent to which an individual has the ability to exercise control over oneself or the extent to which one is capable of acting with agency (Galinsky et al., 2008). Building on this research, Wagers (2015) argued that, in addition to being social-relational, personal power may be part of the individual’s personality and can impact how individuals perceive their power position in intimate relationships.
In her internal power theory, Wagers (2012) argued power has two distinct types: external and internal. External power encompasses traditional views of power such as social status, money, and authority, whereas internal power refers to the development of important internal personality resources, such as self-esteem, a sense of self or identity, and a sense of self-worth, that invoke a sense, or feeling, of power. According to Wagers (2012, p. 11), internal power is defined as “the recognition that one gains control over one’s life by directing one’s own thoughts, feelings, and behaviors, regardless of outside influences.” Internal power is conceptualized as a broad construct comprised of five underlying domains of power gained from: (1) a strong and positive self-concept (i.e., self-concept clarity); (2) an intrinsic sense of self-worth and knowing one matters in the world (i.e., self-esteem); (3) a sense of personal agency (i.e., self-efficacy); (4) an inner motivational state independent from outside forces (i.e., self-determination); and (5) recognition that control over one’s life and outcomes resides within the self (i.e., mastery). The theory asserts individuals lacking internal power may engage in controlling and abusive behaviors to compensate for weakened internal power. Internal power is inversely related to IPV, with those low in internal power more likely to use coercive control and violence toward an intimate partner than individuals high in internal power.
Preliminary studies support internal power theory (Wagers, 2012; Wagers et al., 2019). Factor analyses confirm the conceptualization of internal power as a broad construct, comprised of five interrelated domains of self-concept clarity, self-esteem, self-efficacy, self-determination, and mastery. The magnitude of these factor loadings varies, suggesting the five domains may contribute differently to internal power. Moreover, Wagers et al. (2019) found internal power was significantly related to IPV, with no significant effects for sex or race covariates on internal power. Research using the psychological scales appropriated by Wagers for internal power, however, demonstrate mixed findings regarding variation across sex and race. Several studies of the five domains (i.e., self-concept clarity, self-esteem, self-efficacy, self-determination, and mastery) of Wagers’ internal power indicate females and racial minorities tend to perceive lower magnitudes of these qualities compared to males and Whites, respectively (e.g., D’Lima et al., 2014; Gilster, 2014; Wilgenbusch & Merrell, 1999). Conversely, other studies found no sex or racial/ethnic differences in these scales (e.g., Cavendish, 2017; D’Lima et al., 2014; Wilgenbusch & Merrell, 1999), or lower levels for males and Whites (Cavendish, 2017; Gray-Little & Hafdahl, 2000). Given the history of patriarchy and racism in the U.S., it is perhaps not surprising to expect women and people of color might perceive lower levels of internal power than their counterparts, yet potential differences may not be enough to affect measurement.
Measurability
An important step in assessing the validity of instruments is ensuring they operate similarly for different groups of people (i.e., across sex or race). A common procedure used to assess this is to test for factorial invariance across multiple groups (e.g., Byrne et al., 1989; Dimitrov, 2010; Millsap, 1998). It is common practice to test factorial invariance for construct validation in fields like psychology, but surprisingly rare in IPV research. Yet, it is important to test whether constructs possess factorial invariance within key social groups because differences in the configuration (i.e., form), measurement (i.e., factor loadings, item intercepts, residual variances), or structure (i.e., factor variances and covariances) of factors across groups weakens the validity of findings as they do not adjust for group bias (Dimitrov, 2010; Millsap, 1998). If there is factorial variance across groups, these biases should be adjusted for, by allowing for either partial or complete variance in the model (Byrne et al., 1989). If a construct is theorized to be general in its application, then tests should reveal factorial invariance across groups.
Purpose
The purpose of this paper was to test the generality of internal power theory (Wagers, 2012) with regard to sex and race/ethnicity. As mentioned above, research on sex and race differences in internal power is mixed. For the internal power measure to be generalizable across sex and race, there must be evidence of measurement invariance. Therefore, the first and second hypotheses are models of internal power factors will be sex and race/ethnicity invariant, respectively. Third, extending the empirical test of Wagers et al. (2019), it is hypothesized the relationships between the five internal power domains and IPV perpetration will vary across sex and race/ethnicity, but generally those with more internal power will be less likely to engage in IPV. Since research on sex and race variations in the domains of internal power is mixed, no specific direction is hypothesized for the internal power-IPV relationship within sex or race groups.
Method
Sample and procedures
Participants for this study were recruited from undergraduate criminology courses in 2012 at a 4-year university and a community college in Florida. The criminology courses fulfilled general education requirements; hence, they were likely to contain students representative of the general student population. The survey was administered electronically, but enrollment was solicited in person. Following approval from each university’s Institutional Review Board, students were informed participation was completely voluntary and no compensation was offered for participation. A total of 749 students participated in the survey, for a response rate of 94.3%.
Measures
Sex group membership was based on responses of either “female” or “male” to the following question: “What is your sex?” Race/ethnicity group membership was based on responses of “African American/Black,” “Caucasian/White,” or “Latino/Hispanic” to the following question: “Which best describes you?” Too few respondents identified as another race (n = 3 American Indian/Alaskan Native; n = 18 Asian/Asian American; n = 3 Hawaiian other/Pacific Islander, or n = 31 Other) to include in analyses. The present study utilizes the same self-report items for internal power for constructs of clarity, self-esteem, self-efficacy, self-determination, and mastery and IPV perpetration as reported in Wagers et al. (2019).
Self-concept clarity
The self-concept clarity scale (Campbell et al., 1996; Diehl & Hay, 2011) assesses an individual’s perceived temporal stability, consistency, and conviction of self-beliefs. The scale consists of 12 Likert-style items with responses on a five-point scale (1 = strongly agree to 5 = strongly disagree). Prior research found strong reliability (test-retest correlations between r = .70 and .79; Campbell et al., 1996) and internal consistency (Cronbach’s alpha of .88 to .91; e.g. Campbell et al., 1996; Deihl & Hay, 2011) for the scale. The factor for clarity presented here utilizes 6 of these items (see Table 1).
Self-esteem
The Rosenberg self-esteem scale (Rosenberg, 1965) assesses one’s global feelings of self-worth or self-acceptance. The scale is comprised of 10 items with responses on a four-point scale (strongly agree = 3 to strongly disagree = 0). Research has shown the instrument has good internal consistence (Cronbach’s alpha of .77 to .88; Dobson et al., 1979; Flemming & Courtney, 1984) and good reliability (test-retest r = .82 to .85) (Flemming & Courtney, 1984; Silbert & Tippett, 1965). The self-esteem factor in this study utilizes 7 of these items (see Table 1).
Self-efficacy
The general self-efficacy scale (Schwarzer & Jerusalem, 1995) assesses a general sense of self-belief that one can perform tasks or cope with adversity in various domains of human functioning. The full scale contains 10 items with responses on a four-point scale (1 = not at all true, 2 = hardly true, 3 = moderately true, 4 = exactly true). The general self-efficacy scale has demonstrated high reliability, stability, and construct validity across several studies (e.g., Leganger et al., 2000; Schwarzer & Born, 1997). The factor for self-efficacy used here is comprised of 9 of these items (see Table 1).
Self-determination
The self-determination scale (Sheldon, 1995; Sheldon et al., 1996) assesses the degree to which an individual can be described as having an internal locus of causality. It is comprised of 10 items with responses on a five-point scale (1 = strongly disagree to 5 = strongly agree). The overall scale has demonstrated both good internal consistency (alphas .85 to .93) and adequate test-retest reliability (r = .77 over an 8-week period) (Sheldon et al., 1996). The self-determination factor presented here contains 7 of these items (see Table 1).
Mastery
The mastery scale (Pearlin et al., 1981) assesses the extent to which an individual believes life events are under one’s own control versus being controlled by others or fatalistically ruled. The scale is comprised of 7 items with responses on a four-point scale (strongly agree = 1 to strongly disagree = 4). The scale has been shown to be unidimensional in confirmatory factor analysis (Pearlin & Schooler, 1978; Pearlin et al., 1981). The mastery factor tested here contains 5 of these items (see Table 1).
Interpersonal violence/abuse behaviors
IPV was measured using modified versions of the psychological and physical abuse perpetration instruments developed for the Safe Dates program (Foshee et al., 1996, 1998). The psychological abuse perpetration items ask participants to indicate how often they had ever engaged in certain behaviors using a four-point response format (never = 0, seldom = 1, sometimes = 2, and very often = 3), as do the physical abuse perpetration items (response format never = 0, 1 to 3 times = 1, 4 to 9 times = 2, and 10 or more times = 3). Both scales have demonstrated internal consistency with Cronbach α = .88 (Foshee et al., 1998). For this study, participants were asked to indicate their use of behaviors in the context of an intimate relationship (defined as a boyfriend/girlfriend or a husband/wife for at least a month or longer). Participants who indicated they had never been in an intimate relationship were not administered the interpersonal violence/abuse items.
The present study utilizes Wagers and associates’ (2019) factor structures for psychological abuse, controlling behavior, and physical violence. Psychological abuse was comprised of 4 items: “said something to hurt their feelings on purpose,” “brought up something from the past to hurt them,” “insulted them in front of others,” and “did something just to make them jealous.” Controlling behavior was comprised of 3 items: “made them describe where they were every minute of the day,” “would not let them do things with other people,” and “told them they could not talk to someone of the opposite sex.” Physical violence was comprised of 8 items: “hit them with something besides my fist,” “kicked them,” “threw something at them and hit them,” “hit them with my fist,” “pushed, grabbed, or shoved them,” “scratched them,” “slapped them,” and “bit them.” Confirmatory factor analysis (CFA) indicated the three-factor model fit the data very well (χ2[87, n = 599] = 140.890, p < .001; root mean square error of approximation [RMSEA] = .032[90% confidence interval (CI): .022–.042]; comparative fit index [CFI] = .969; Tucker-Lewis coefficient [TLI] = .962; standardized root mean square residual [SRMR] = .043). All the factor loadings were significant and ranged from .613 to .814. High scores on the factors indicated greater perpetration of IPV.
Analytic strategy
Analyses were completed using Mplus version 8.2 (Muthén & Muthén, 1998–2018), with missing values imputed using the EM algorithm. The analyses proceeded in two phases. First, measurement invariance was tested for the internal power model. Measurement invariance was tested using multigroup CFA and the procedures described by Dimitrov (2010). Following Dimitrov (2010), a forward sequential approach was used to test configural invariance, measurement invariance, and structural invariance, respectively, of the five-factor model of internal power across groups based on sex and race/ethnicity, separately. The adequacy of nested models was tested by comparing (a) Satorra-Bentler scaled (mean-adjusted) chi-square change (ΔSBχ2) between the more restrictive model and the less restrictive model (Satorra & Bentler, 2001) and (b) the change in the comparative fit index (CFI) (Cheung & Rensvold, 2002). A non-significant chi-square difference and a change in the CFI of .01 or greater (values ≤ −.01) indicates invariance of the model. Second, structural equation models (SEM) were tested to examine the impact of internal power on self-reported IPV perpetration.
Results
A total of 749 respondents took the survey: 421 in spring and 328 in fall. The average age of respondents was 21.09 (SD = 4.22). Slightly more women (51.7%) completed the survey than men (46.1%; 2.3% missing). The sample was somewhat diverse with respect to race: 14.7% Black or African American, 17.9% Latino/Hispanic, and 57.8% White/Caucasian. There were no significant differences in age, sex, or race across the two survey administrations.
Sex variance of internal power
To determine whether internal power theory operates differently for men and women, measurement invariance was tested across sex. First, the five-factor CFA for internal power was tested separately for each sex group. The goodness-of-fit indexes indicated a good fit for each group: for women, χ2(503, n = 378) = 824.228, p < .001; RMSEA = .041 (90% CI: .036 - .046); CFI = .929; TLI = .921; SRMR = .052; for men, χ2(503, n = 337) = 793.652, p < .001; RMSEA = .041 (90% CI: .036 - .047); CFI = .923; TLI = .914; SRMR = .059. Second, a multigroup CFA was estimated across the two sex groups with no invariance imposed (free for the two sex groups). This model provided similar results as the separate sex group models, but served as the baseline model (M0) providing goodness-of-fit indexes for the full sample. Table 1 provides standardized factor loadings for the baseline model of internal power for the subgroups of men and women. The baseline model was a good fit (χ2[1006, n = 715] = 1617.258, p < .001; RMSEA = .041 [90% CI: .037 - .045]; CFI = .927; TLI = .918; SRMR = .055). Based on these results, there was configural invariance of the CFA model across the two groups. That is, the same factor model fit the data for the two sex groups, independently.
Results of variant (free) and partially invariant CFA models for sex and race groups.
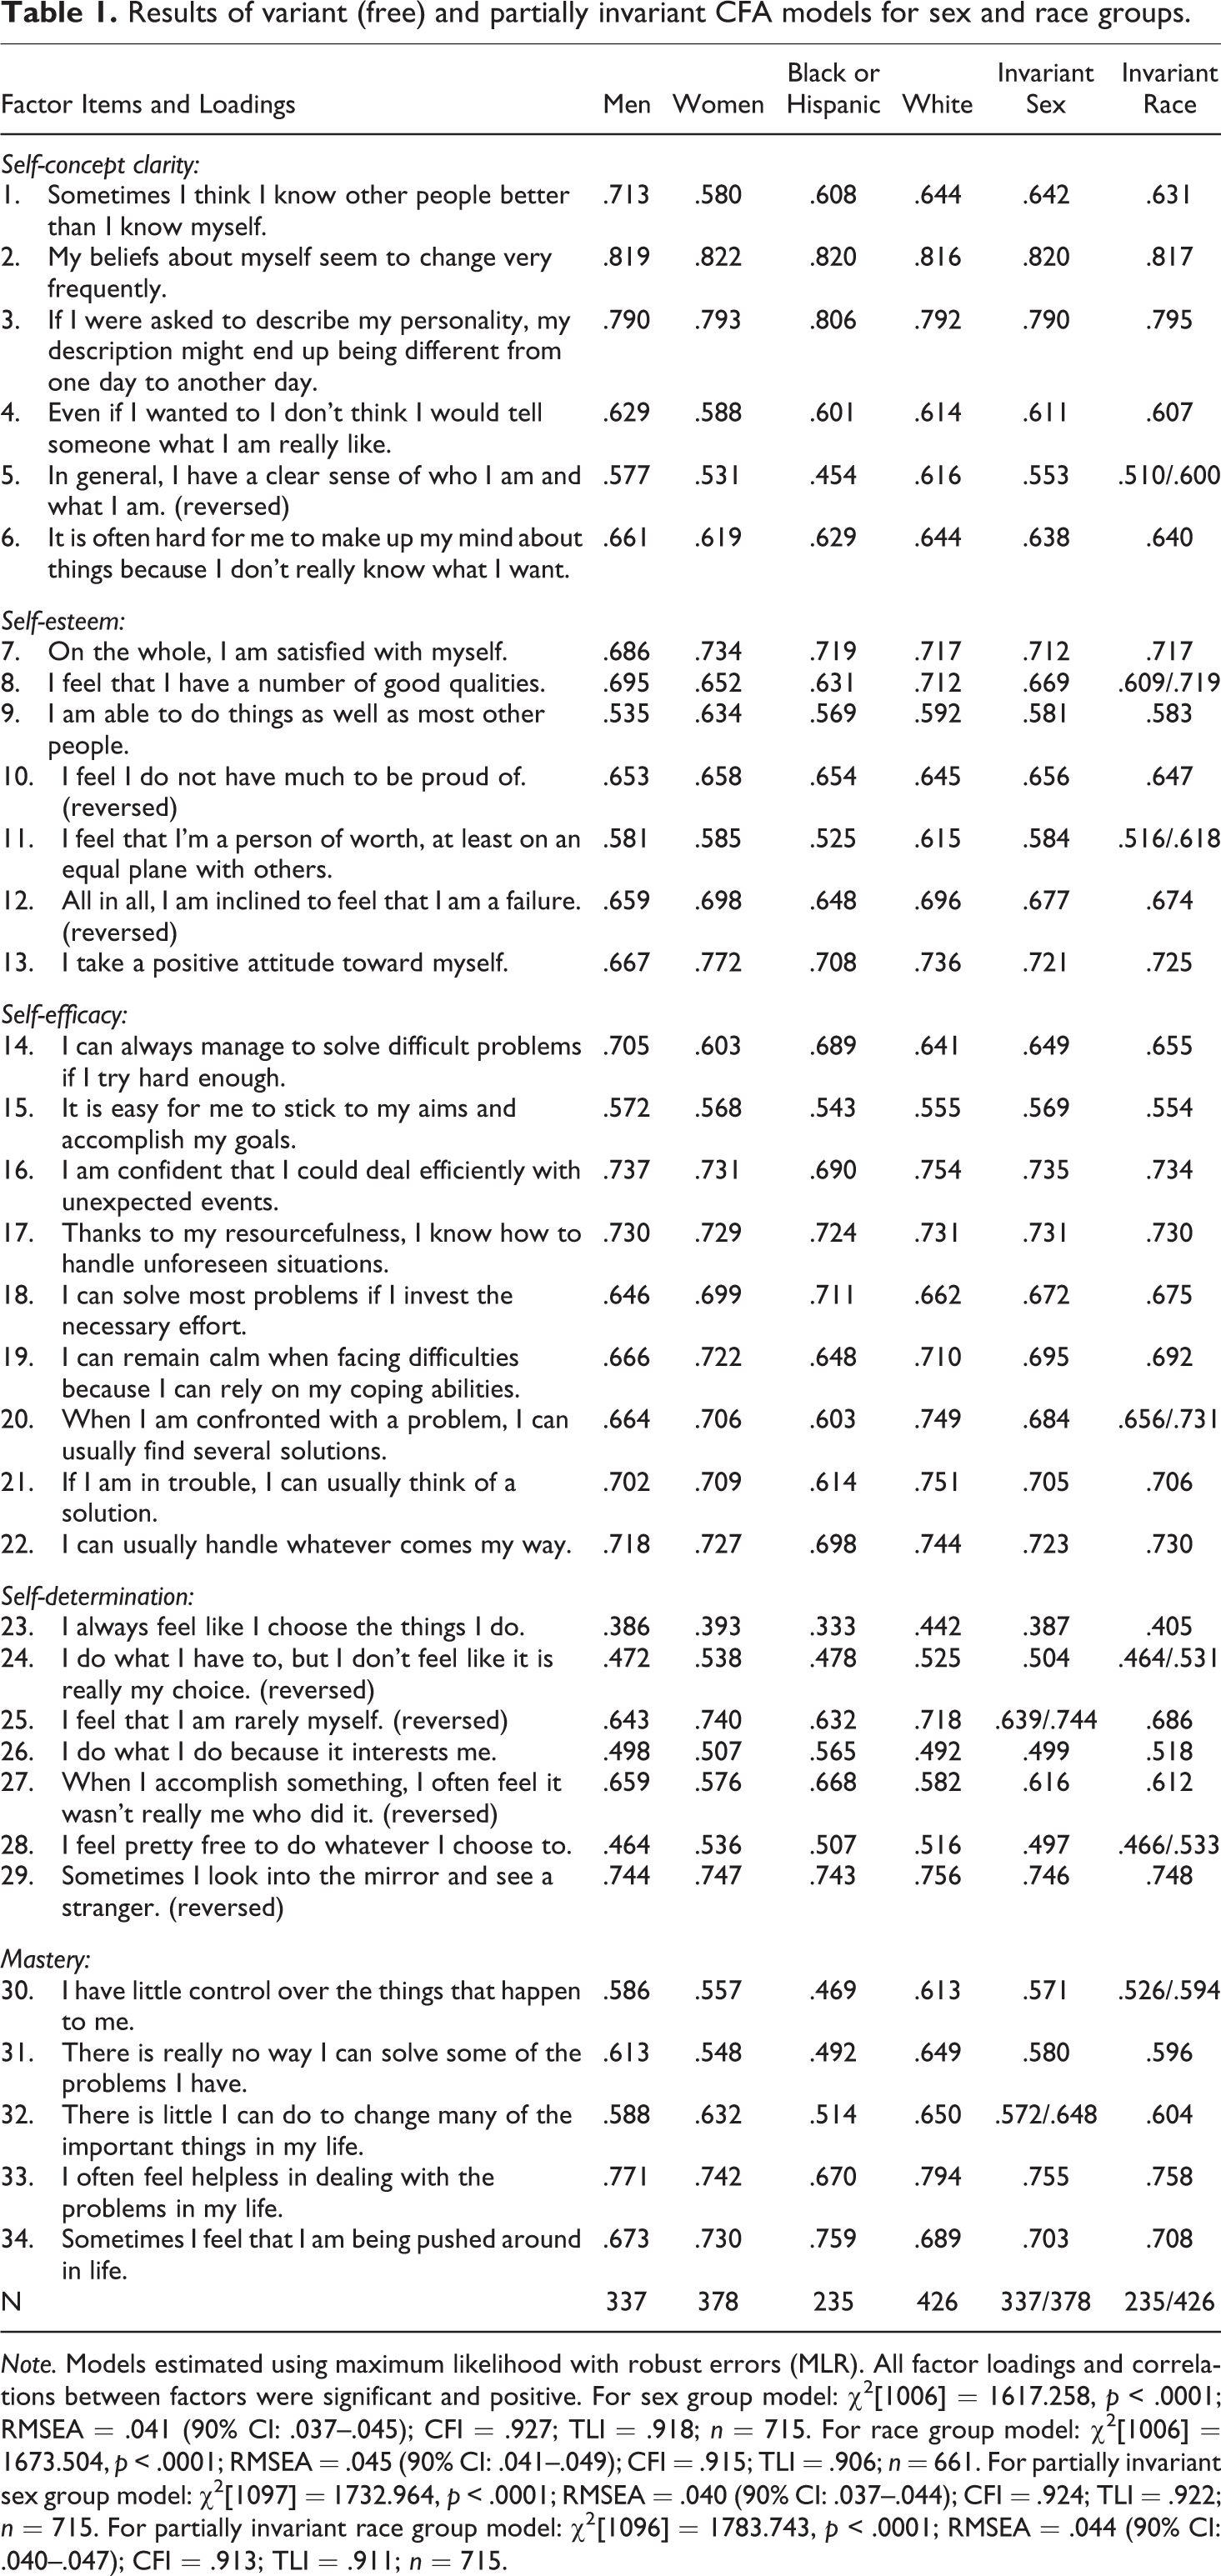
Note. Models estimated using maximum likelihood with robust errors (MLR). All factor loadings and correlations between factors were significant and positive. For sex group model: χ2[1006] = 1617.258, p < .0001; RMSEA = .041 (90% CI: .037–.045); CFI = .927; TLI = .918; n = 715. For race group model: χ2[1006] = 1673.504, p < .0001; RMSEA = .045 (90% CI: .041–.049); CFI = .915; TLI = .906; n = 661. For partially invariant sex group model: χ2[1097] = 1732.964, p < .0001; RMSEA = .040 (90% CI: .037–.044); CFI = .924; TLI = .922; n = 715. For partially invariant race group model: χ2[1096] = 1783.743, p < .0001; RMSEA = .044 (90% CI: .040–.047); CFI = .913; TLI = .911; n = 715.
Following the establishment of configural invariance, testing for model invariance was conducted using the forward sequential process described by Dimitrov (2010). Results reported in Table 2 indicated only partial invariance for internal power across sex. For metric invariance (weak measurement invariance), the factor loadings were equal across sex. The comparison of model M0, where the factors were freed across sex, to model M1, where the factor loadings were set invariant across sex, showed metric invariance across sex. The Satorra-Bentler scaled chi-square difference was not significant and the CFI change value was greater than −.01. These results suggest it would be appropriate to examine relationships between the latent factors of internal power and external variables across sex (Dimitrov, 2010).
Testing for factorial invariance across sex groups.
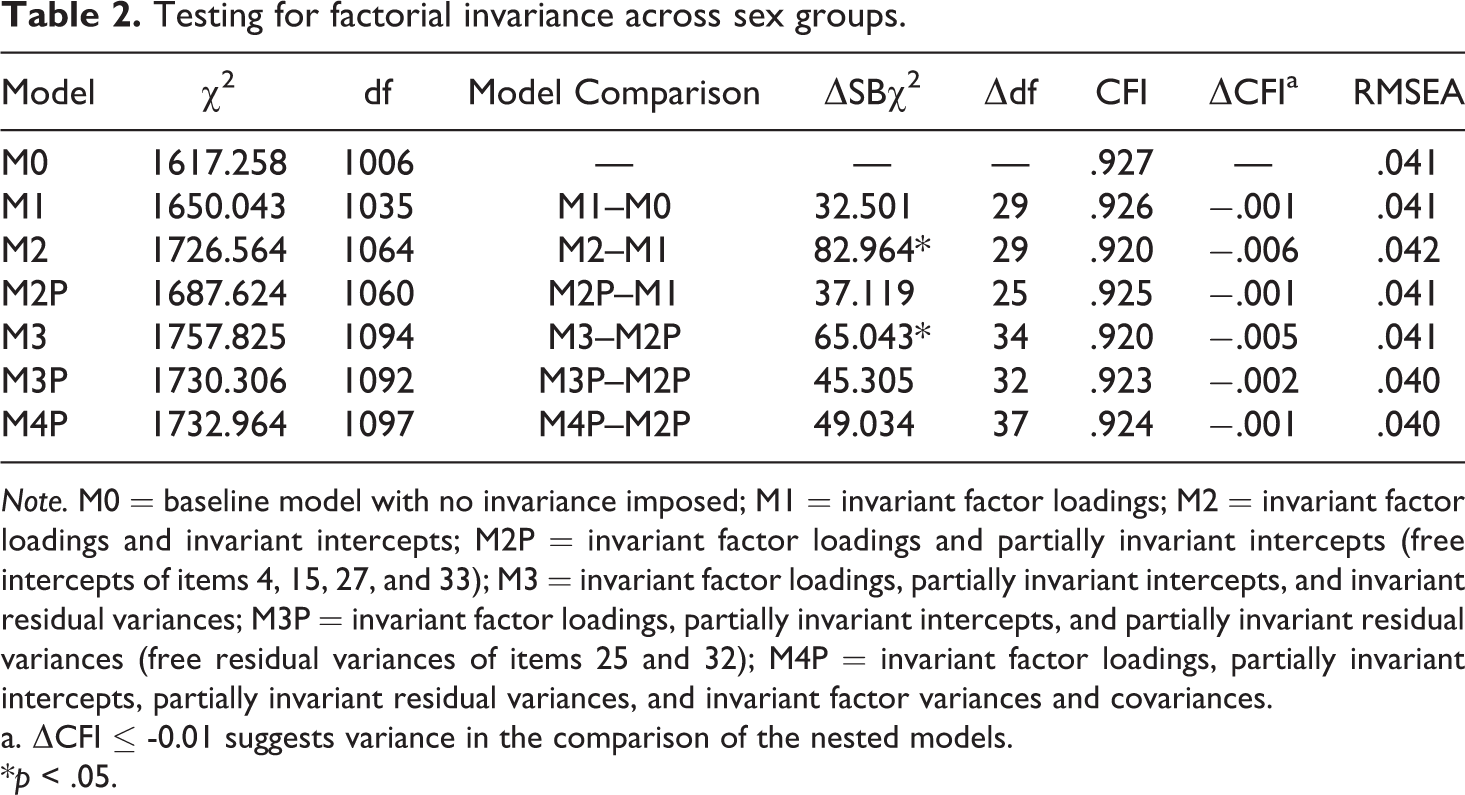
Note. M0 = baseline model with no invariance imposed; M1 = invariant factor loadings; M2 = invariant factor loadings and invariant intercepts; M2P = invariant factor loadings and partially invariant intercepts (free intercepts of items 4, 15, 27, and 33); M3 = invariant factor loadings, partially invariant intercepts, and invariant residual variances; M3P = invariant factor loadings, partially invariant intercepts, and partially invariant residual variances (free residual variances of items 25 and 32); M4P = invariant factor loadings, partially invariant intercepts, partially invariant residual variances, and invariant factor variances and covariances.
a. ΔCFI ≤ -0.01 suggests variance in the comparison of the nested models.
*p < .05.
For scalar invariance (strong measurement invariance), there was partial item invariance across sex. Since model M2 was significantly different from model M1 based on the Satorra-Bentler chi-square, though the CFI change value was greater than −.01 (i.e., −.006), this suggested non-invariance of the intercepts across sex. An examination of modification indices suggested four intercepts could be set free to improve fit: item 4 (see Table 1) in clarity, item 15 in self-efficacy, item 27 in self-determination, and item 33 in mastery. The intercepts were higher for women in items 4, 15, and 27, but higher for men in item 33. A lack of invariant intercepts for these 4 items indicates differential item functioning with the mean responses for items higher in one sex group than the other. Non-invariant item intercepts suggest the presence of sex-based item bias (Dimitrov, 2010), which may be due to group differences in social desirability, reference frameworks used for making judgments, or preoccupation with strengths or weaknesses (Chen, 2008). Importantly, non-invariant item intercepts indicated the means for their associated latent factors were not comparable across sex. When the intercepts of items were freed, the Satorra-Bentler chi-square change was non-significant (see model M2P).
For invariance of item uniqueness (strict measurement invariance), there was partial invariance of item error across sex. A model was estimated with equal variances and covariances of the item residuals across sex. As shown in Table 2 for model M3, the scaled chi-square difference between model M3 and model M2P was significant, though the CFI change value was greater than −.01 (i.e., −.005). This indicated one or more residuals were likely not invariant across sex. The modification indices suggested freeing the residuals for item 25 (see Table 1) in self-determination and item 32 in mastery. The residual variances were lower for women than men for both items. This lack of invariant error variances for these items suggests they were not measured with the same precision in the sex groups (Dimitrov, 2010). After freeing the items (model M3P), the scaled chi-square difference was non-significant. Thus, there were invariant factor loadings, partially invariant intercepts, and partially invariant error (residual) variances across sex.
Wagers et al. (2019) tested a second-order factor model of internal power that was comprised of five first-order factors of clarity, self-esteem, self-efficacy, self-determination, and mastery. Therefore, it is important to test the five first-order factors for structural invariance by specifying a model with equal factor variances and covariance across sex. As shown in Table 2 for model M4P, the scaled chi-square difference was non-significant and the CFI change was greater than −.01. Thus, the variability of the five factors of internal power and the correlational relationships among them were generalizable across sex (Dimitrov, 2010), once the aforementioned items were freed to allow partial invariance for intercepts and residuals. The standardized loadings for the final partially invariant model (M4P) for the internal power factors across sex are reported in the Invariant Sex (Men/Women for unique items across sex) column in Table 1.
Race variance of internal power
Similar to the sex-based models, race/ethnicity variant models of internal power were examined. Initially, three groups of race/ethnicity (Black/African American, Hispanic, vs. White) were examined. Unfortunately, there was an insufficient number of cases in the Hispanic and Black subgroups to permit estimation of the complex models. Consequently, the Black and Hispanic subgroups were combined for comparison with the White subgroup of respondents.
The five-factor CFA for internal power was tested separately for both race/ethnicity groups. The goodness-of-fit indexes indicated a good fit for each group: for Blacks/Hispanics, χ2(503, n = 235) = 736.076, p < .001; RMSEA = .044 (90% CI: .037 - .051); CFI = .911; TLI = .901; SRMR = .066; for Whites: χ2(503, n = 426) = 930.743, p < .001; RMSEA = .045 (90% CI: .040 - .049); CFI = .918; TLI = .908; SRMR = .052. Next, a multigroup CFA was estimated across the two race groups with no invariance imposed, serving as the baseline model (M0). Table 1 provides the standardized factor loadings for the baseline multigroup CFA model of internal power by race group, which was a good fit (χ2[1006, n = 661] = 1673.504, p < .001; RMSEA = .045 [90% CI: .041–.049]; CFI = .915; TLI = .906; SRMR = .058). Based on these results, there was configural invariance of the CFA model over the two race groups. The same factor model fit the data for the two race groups, independently.
Results reported in Table 3 show there was partial invariance for internal power across race. For the metric invariance (weak measurement invariance), there were equal factor loadings across race. The comparison of model M0 (free factors) to model M1 (invariant factor loadings) showed metric invariance across race. The scaled chi-square difference was not significant and the CFI change was greater than −.01. These results suggest the relationships between the latent factors of internal power and external variables were compared across race (Dimitrov, 2010).
Testing for factorial invariance across race groups.

Note. M0 = baseline model with no invariance imposed; M1 = invariant factor loadings; M2 = invariant factor loadings and invariant intercepts; M3 = invariant factor loadings, invariant intercepts, and invariant residual variances; M3P = invariant factor loadings, invariant intercepts, and partially invariant residual variances (free residual variances of items 5, 8, 11, 20, 24, 28, and 30); M4P = invariant factor loadings, invariant intercepts, partially invariant residual variances, and invariant factor variances and covariances.
a. ΔCFI ≤ -0.01 suggests variance in the comparison of the nested models.
*p < .05.
For scalar invariance (strong measurement invariance), there was item invariance across race. The Satorra-Bentler chi-square change was non-significant and the change in CFI was greater than −.01 (see model M2). The invariant intercepts suggest the absence of item bias across race (Dimitrov, 2010).
For invariance of item uniqueness (strict measurement invariance), there was partial invariance of item error across race. As shown in Table 3 for model M3, the scaled chi-square difference between models M3 and M2 was significant, although the CFI change was greater than −.01. The modification indices suggested freeing the residuals for 7 items (see Table 1): item 5 in clarity, items 8 and 11 in self-esteem, item 11 in self-esteem, item 20 in self-efficacy, items 24 and 28 in self-determination, and item 30 in mastery. For these 7 items, residual variances were lower for Whites than Blacks/Hispanics. Non-invariant error variances for these items suggests the items were not measured with the same precision in each racial group (Dimitrov, 2010). After freeing these items (model M3P), the scaled chi-square difference was non-significant. Thus, there were invariant factor loadings, invariant intercepts, and partially invariant error (residual) variances across race.
For structural invariance across race (model M4P), the scaled chi-square difference was non-significant and the CFI change was greater than −.01. Thus, the variability of the five factors of internal power and the correlational relationships among them were generalizable across race. The standardized loadings for the final partially invariant model (M4P) for the internal power factors across race are reported in the Invariant Race column in Table 1.
Sex variance of internal power related to IPV
SEM was used to test the influence of the partially invariant CFA for internal power on self-reported IPV, as illustrated in Figure 1. Since the above test for strong measurement invariance (intercepts) revealed differential item functioning for 4 items, which indicated it may be inappropriate to assume the latent factor means for internal power were the same for men and women, multigroup SEM was estimated to examine sex differences in the relationships between the five internal power factors and the IPV factors. The level of significance selected was p < .05. The factor loadings for IPV were allowed to vary across sex.

Structural equation model for relationship between internal power and IPV.
As reported in Table 4, results indicated a good fit of the model to the data (χ2[2261, n = 715] = 3450.102, p < .001; RMSEA = .038 [90% CI: .036 - .041]; CFI = .905; TLI = .901). There were differences in the relationships between the internal power factors and the interpersonal violence/abuse factors within sex. For men, self-determination was significantly and negatively related to physical violence (standardized estimate = -0.66, p = 0.020). For women, self-determination was significantly, negatively related to controlling behavior (standardized estimate = -0.76, p = .043). Mastery (standardized estimate = -0.43, p = .022) and self-efficacy (standardized estimate = -0.24, p = .044) were significantly, negatively related to physical violence. Results suggest gendered effects for internal power on IPV perpetration.
Summary of SEM results for internal power and ipv perpetration by sex and race groups, standardized coefficients (standard errors in parentheses).

Note. All factor loadings and correlations between factors were significant and positive. For sex group model: χ2[2261] = 3450.102, p < .001; RMSEA = .038 (90% CI: .036–.041); CFI = .905; TLI = .901; n = 715. For race group model: χ2[2244] = 3393.921, p < .001; RMSEA = .039 (90% CI: .037–.042); CFI = .905; TLI = .900; n = 661.
*p < .05; **p < .01; †p < .10.
Race variance of internal power related to IPV
Multigroup SEM was also used to test the influence of the partially invariant CFA for internal power on self-reported IPV across race (see Figure 1). As reported in Table 4, results indicated a good fit of the model to the data (χ2[2244, n = 661] = 3393.921, p < .001; RMSEA = .039 [90% CI: .037 - .042]; CFI = .905; TLI = .900). There were differences in the relationships between the internal power factors and IPV factors within race. For individuals in the Black/Hispanic group, self-esteem was significantly and negatively related to psychological abuse (standardized estimate = -0.42, p = 0.002). None of the other internal power factors were significantly related to the three factors of IPV for individuals who identified as Black/Hispanic. For Whites, mastery was significantly, negatively related to psychological abuse (standardized estimate = -0.58, p = .007), controlling behavior (standardized estimate = -0.52, p = .012), and physical violence (standardized estimate = -0.71, p = .011). Self-esteem was significantly, positively related to controlling behavior (standardized estimate = 0.41, p = .036) and physical violence (standardized estimate = 0.60, p = .008). Results suggest racial/ethnic effects for internal power on IPV perpetration.
Discussion
This study examined measurement invariance in a factor model of Wagers’ (2012, 2015) internal power theory across sex and race. Findings indicated the configuration and factor loadings (weak measurement invariance) of the five-factor internal power model were invariant across both sex and race. In practice, this is often a minimum level of sensitivity for using scales across diverse populations. Differences were observed, however, when testing greater sensitivity of the scales by examining strong measurement invariance (intercepts). For the racial group model, factor item intercepts were invariant. For the sex group model, tests revealed non-invariant intercepts, suggesting bias in the endorsement of certain internal power items in four of the factors. In particular, on average, men reported higher agreement with item 4 in self-concept (“…I don’t think I would tell someone what I am really like”) and item 27 in self-determination (“…I often feel it wasn’t really me…”), while women reported higher agreement with item 15 in self-efficacy (“…stick to my aims and accomplish my goals”) and item 33 in mastery (“…feel helpless in dealing with the problems in my life”). This sex bias may reflect gendered socialization differences rooted in patriarchy. For example, patriarchy teaches men to be confident and strong and women to be dependent and vulnerable. The mastery and self-concept items may be picking up on socially proscribed patriarchal values affecting one’s sense of self. The self-determination item may be picking up on gender-based social privilege, whereby men may feel their accomplishments are related to the privilege of their sex.
Neither the sex-based nor race-based models met conditions to satisfy strict measurement invariance. Several items had unequal error (residual) variances, particularly in the race-based analyses. For the items demonstrating non-invariant residual variances, results suggested the models did a better job estimating the internal power factors for women compared to men and for Whites compared to Blacks/Hispanics. Results did not, however, suggest a pattern in how the items varied across sex and race within the five domains of internal power. Moreover, the proportion of items demonstrating measurement non-invariance across the groups (2/34 [5.9%] for sex and 7/34 [20.6%] for race/ethnicity) was generally small. Therefore, the constructs of internal power seem generalizable across sex and race, overall, but the model could benefit from strengthening the validity of certain items.
The findings have measurement implications for internal power theory of IPV (Wagers, 2012, 2015). First, scholars who use Wagers’ measurement of internal power should test for sex differences in the model to determine its sensitivity to group differences. Second, Wagers (2012, 2015) should consider elimination or modification of the items that demonstrated non-invariance in their intercepts across sex as they may reflect biases rooted in patriarchal values. Examination of the items in the various scales borrowed to reflect internal power domains reveals the questions are very general (see Table 1). Wagers might consider providing greater context, either in the instructions for the scales or within the items themselves, to improve precision in the items for men and people of color.
Further, this study found partial and mixed support for Wagers’ (2012, 2015) internal power theory of IPV when examined across sex and race subgroups. Internal power factors were significantly related to a few IPV perpetration factors among women and, more so, Whites. Among men and Black/Hispanic individuals, however, the internal power factors were generally unrelated to IPV perpetration. In addition, for Whites, self-esteem was related to IPV perpetration in the opposite direction than the theory asserts. Future research should investigate the context of IPV in relation to internal power. As Emerson (1962, p. 32) stated in his power-dependence theory, “…power is a property of the social relation….” There may be group differences in how one’s internal sense of power impacts abusive behavior within the context of interpersonal interactions.
There are several limitations to this study. First, this study examined cross-sectional data, and cannot make causal inferences. Since no specific time reference was provided for the IPV indicators, it is impossible to determine the temporal order of IPV in relation to internal power characteristics. Therefore, the relationships reported here are correlations, which may not be causal. Future research should examine measurement invariance in a longitudinal model of internal power and IPV perpetration to determine causality. Second, the findings may not be generalizable to students in other regions and non-student populations. Third, sex was binary, reflecting self-identification as female or male. Since gender roles may impact power, control, and IPV (e.g., Coleman & Straus, 1986) and feminine characteristics may improve relationship quality (e.g., Steiner-Pappalardo & Gurung, 2002; Young et al., 2014), future studies should examine group differences in measurement of internal power across biological sex as well as gender. Relatedly, sexual orientation was not measured in the present study but may impact internal power and IPV dynamics. More research is needed on the impact of the intersection of sex, gender, and sexual orientation on the power-IPV relationship. Fourth, due to sample size limitations, racial differences were limited to comparing Whites to both Blacks and Hispanics combined and the study was unable to explore sex-race groups. Future research should examine the empirical validity of internal power theory with larger, more diverse samples. Such investigation will help elucidate whether the effects detected for women and Whites apply broadly or only to certain subgroups, such as White women. Finally, future research should explore how internal power affects IPV within context and within interpersonal dyads. Wagers’ internal power theory postulates individuals engage in controlling and abusive behaviors to compensate for weakened internal power. After engaging in IPV, is the perpetrator’s internal power altered? How does the internal power of the other partner affect IPV outcomes?
Despite these limitations, the present study offered a more rigorous examination of sex/race differences in measurement than models that simply include control variables for sex/race or conduct separate analyses for sex/race subsamples. Overall, the findings suggest Wagers’ internal power is generalizable across race and fairly generalizable across sex. These findings imply mechanisms of internal power are similar for men and women and Whites and Blacks/Hispanics. Minor differences in a few of the internal power items were detected, however, suggesting certain items may contain slight sex- or race-based bias in the wording or perceived acceptability of these items—though the impact of this bias was not sufficient enough to require different factor configurations across groups, nor would the non-invariance have been detected if just relying on change in CFI alone. These findings imply parents and other authority figures involved in socialization might strengthen internal power by instilling greater self-confidence in daughters and sons and goal-orientation in sons. While the construct of internal power may be similar across sex and race, SEM results indicated internal power varies in its relation to IPV across sex and race. Low internal power appears to be a key correlate of IPV perpetration more for Whites and women than Blacks/Hispanics and men. For women and Whites, strengthening internal power may influence IPV behaviors, though longitudinal research is needed to know how.
Footnotes
Funding
The author(s) received no financial support for the research, authorship, and/or publication of this article.

Open research statement
As part of IARR’s encouragement of open research practices, the authors have provided the following information: This research was not pre-registered. The data used in the research cannot be publicly shared but are available upon request. The data can be obtained via email at: