
Abstract
Loneliness is a rising global problem just as digital communication platforms have afforded people greater opportunities to interact. This paradox suggests that increased opportunities for social interactions may be insufficient for relieving loneliness. Using daily diary methodology, we examined how features of social interactions—type and perceived quality—predicted daily loneliness. Over 14 consecutive days, 269 adult participants provided 2986 daily reports on their loneliness levels, the types of daily social interactions they had, and the quality of these social interactions. Results indicated that in-person interactions most strongly predicted reduced loneliness relative to other interaction types. Interactions characterized by positive qualities were associated with lower same-day loneliness. In turn, interactions characterized by negative qualities were associated with higher same-day loneliness. Across all subjective qualities, feeling closed off and distant from others during interactions was the strongest predictor of same-day loneliness. These findings highlight that time spent socializing is not a panacea for reducing loneliness, and increasing in-person interactions and reducing negative social experiences may best foster social connection.
Keywords
Introduction
Healthy social relationships satisfy critical psychological needs (Brown et al., 2007). When these needs are frustrated, people often experience loneliness, an aversive experience defined by a perceived discrepancy between what one wants or needs from social relationships and whether these wants and needs are met (Peplau & Perlman, 1982). Loneliness is a global health problem (Cacioppo & Cacioppo, 2018). One meta-analysis found that worldwide average loneliness in young adults increased between 1976 and 2019 (Buecker et al., 2021), with a similar increase in Chinese adults from 2002 to 2011 (Xin & Xin, 2016). From an evolutionary perspective, loneliness is a warning signal that a person’s social supports and resources are insufficient to meet their needs (Cacioppo et al., 2006; Cacioppo, Cacioppo, & Boomsma, 2014). When these needs go unfulfilled for an extended period, loneliness persists and increases risk for multiple mental and physical health conditions, including depression, suicide, heart problems, and premature death (Holt-Lunstad et al., 2015; Luo et al., 2012; VanderWeele et al., 2011).
The global increase in loneliness is also perplexing. It comes as new communications technologies have offered unprecedented opportunities for socializing—which presumably should counteract loneliness (e.g., Weijs-Perrée et al., 2015). Thus, opportunities for frequent social interactions may be insufficient to allay loneliness. Indeed, researchers have long emphasized that loneliness is distinct from being alone. The cognitive discrepancy model, for example, proposes that loneliness emerges when a person perceives that their relationships and interactions fall short of their expectations for social fulfillment (Peplau & Perlman, 1982). This model acknowledges that a person can be physically isolated yet find contentment in their solitude. Conversely, another person can engage in many social interactions, yet be dissatisfied with various aspects of these interactions and relationships (e.g., quality of interactions, lack of particular relationships), ultimately experiencing loneliness. Thus, the types of social interactions people have, and the quality of those interactions may be more decisive in predicting psychological health (Bruce et al., 2019; Subrahmanyam et al., 2020).
To date, only a small body of research has explored how these specific social interaction features (type and quality) might protect against loneliness. Additionally, most studies examine loneliness as a stable trait. Accumulating evidence suggests that loneliness fluctuates within people even over the course of a single day (Mote et al., 2020; Tam & Chan, 2019), and can be influenced by the ebb and flow of people’s daily social experiences (e.g., van Winkel et al., 2017). Thus, important information is lost when loneliness is measured with single point assessments. Given that people typically have multiple daily social interactions (e.g., ∼12 per day; Zhaoyang et al., 2019), assessing social experiences as they unfold is critical for building more sophisticated accounts of loneliness. Daily diary methodology, in which participants report on naturally-occurring experiences across several days, is well suited to capture the richness of daily social experiences. To this end, the current daily diary study examined how features of daily social interactions predicted concurrent and prospective loneliness.
Loneliness and Social Interactions
Social Interaction Type
Technological advancements in the 21st century have created numerous platforms for people to socialize (Gonzales, 2014). Although these technologies (e.g., virtual reality) mimic in-person interactions, there are some indications that in-person interactions offer the greatest opportunity for social connection (Sacco & Ismail, 2014). For example, in-person interactions offer increased access to socially relevant information (e.g., body language) that help people learn interaction patterns and respond appropriately in real time (Lee et al., 2011). This information is typically less available when people socialize through virtual platforms (Paradisi et al., 2021; Walther, 2011). Perhaps as a consequence, people rate in-person interactions as more meaningful (Baym et al., 2004; Litt et al., 2020) and beneficial (Sacco & Ismail, 2014) than virtual ones. Thus, in-person interactions may be best-suited for combating loneliness.
In fact, having more virtual than in-person interactions may leave people at risk for increased loneliness. This proposition can be understood in the context of the social psychological theory of loneliness which emphasizes the importance of physical proximity in loneliness (Peplau & Perlman, 1979). In this theory, it is hypothesized that physical separation from interaction partners is a precipitate of loneliness, as separation diminishes the quality and frequency of interactions and can weaken social ties. It is possible that the physical separations inherent to virtual interactions pose similar threats to social connection, especially for people who engage in more virtual interactions relative to in-person ones. Consistent with this proposition, more time spent using social networking sites (Morahan-Martin & Schumacher, 2003; O’Day & Heimberg, 2021) and interacting more via text message or phone call relative to in person (Jin & Park, 2010; 2013) has been associated with higher trait loneliness. Similar findings are also observed in adolescents. Adolescents who report spending greater amounts of time interacting via social media and minimal amounts of time interacting with others in person report the highest rates of loneliness when compared to other adolescents who report spending more time interacting in person (Twenge et al., 2019). Nevertheless, empirical findings are mixed. Social media use (Pittman, 2015), text messaging (Park et al., 2016; Reid & Reid, 2005), and video chatting (Brown & Greenfield, 2021) have also been found to alleviate loneliness and foster connection for those who struggle with in-person interactions (Lim et al., 2020; Magsamen-Conrad et al., 2014). More fine-grained studies that assess the intricacies of social interactions and their effects on loneliness are needed to help address these inconsistencies.
Perceived Social Interaction Quality
Theory posits relationships between social interaction quality and loneliness. The interpersonal process model (IPM; Reis & Shaver, 1988) contends that strong social relationships form from social interactions in which interaction partners feel safe sharing self-relevant information with each other. IPM research consistently suggests people’s positive assessments of the quality of their social interactions are the foundation for successful social connection and closeness (Reis et al., 2004; Shelton et al., 2010). Based on this work, good quality social interactions are conceptualized as interactions in which people feel socially connected (Reis et al., 2000), interested, satisfied (Nezlek et al., 2002), and authentic (Downie et al., 2008) and perceive their interaction partners as safe (i.e., warm and friendly; Kashdan et al., 2014). Good quality social interactions are also often enjoyable and/or meaningful to people. By contrast, poor quality social interactions typically lack these aspects and may include social threat or rejection (e.g., critical interaction partners; Ford & Collins, 2010; Kashdan et al., 2014). According to Sermat’s (1978) theory of loneliness, people’s ability to engage in good quality social interactions relative to poor ones is a critical predictor of loneliness. Thus, it is plausible that perceptions of social interaction quality also serve to influence loneliness.
A small body of work connects perceptions of interaction quality to loneliness. For example, three experience-sampling studies found that participants reported feeling less lonely when their interaction partners shared more personal information (Wheeler et al., 1983) and when they felt understood, cared for, and appreciated by people they interacted with in their daily lives (Kuczynski et al., 2021; Reis et al., 2000). Conversely, when people make more negative assessments of the quality of their social interactions, they are likely to feel lonelier. For example, the more people worry about being rejected during their social interactions, the lonelier they feel (Watson & Nesdale, 2012). People also feel lonelier when they feel rejected or criticized during social interactions (Leary, 2022; Mote et al., 2020). Together, findings suggest that socializing is not a surefire antidote to loneliness; rather, the impact of socializing on loneliness may be dependent on how the interaction is perceived. Examining positive and negative assessments of social interaction quality can clarify the nature and strength of these relationships.
The Present Study
We collected data during the COVID-19 pandemic—a time when stay-at-home orders abruptly disconnected people from their social networks and forced them into social isolation. People may have endured intense loneliness due to increased social distancing (Killgore et al., 2020) and likely made efforts to allay their loneliness, making this a historically important and valuable moment to assess buffers against loneliness. The present study used daily diary methodology to test how specific features of daily social interactions predicted loneliness. Data and analytic code are posted on the Open Science Framework (OSF): https://osf.io/sk8rm/.
The present study included the following aims and hypotheses:
In-person interactions would most strongly predict lower daily loneliness, relative to all other types of interactions (i.e., social media, video chatting, messaging, and other).
Higher social interaction enjoyment and meaning, social connection, authenticity, social safety, and partner’s interest would predict lower daily loneliness.
Higher social disconnection, social threat, and rejection feelings and worries would predict higher daily loneliness.
Given the dearth of research on interaction quality and loneliness, we did not specify hypotheses on which perception of social interactions would be the strongest predictor of loneliness.
Method
Participants and Procedure
Descriptive statistics and bivariate correlations for screener and symptom measures.
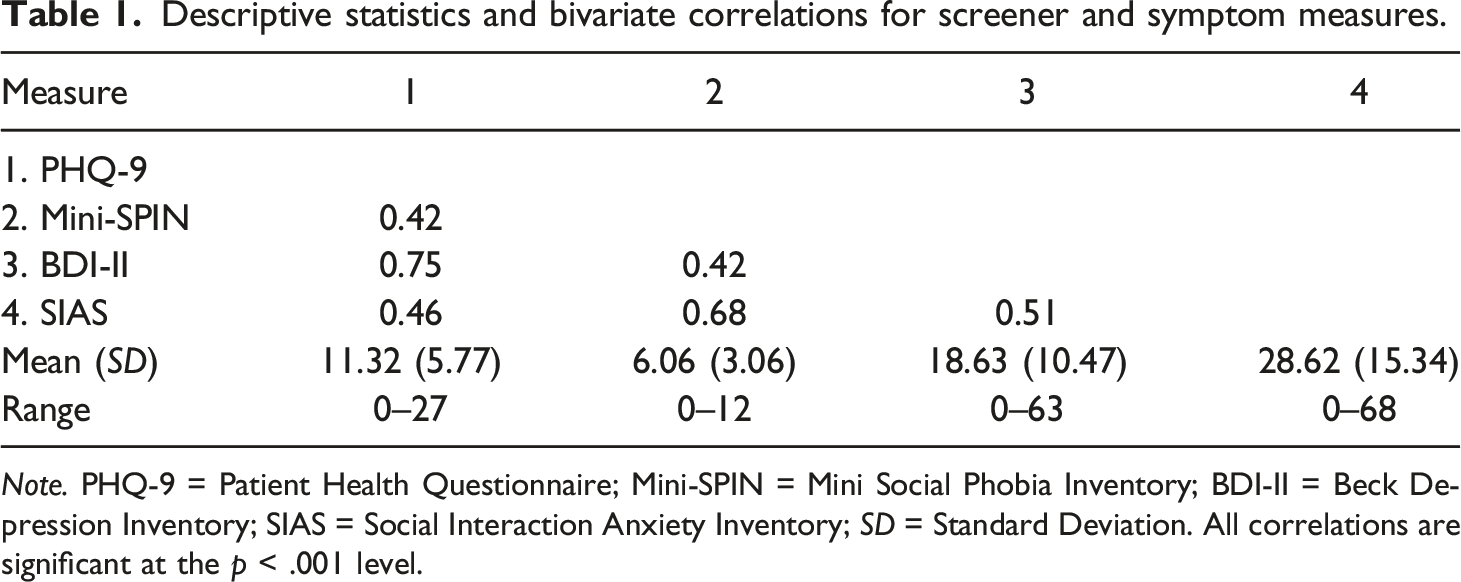
Note. PHQ-9 = Patient Health Questionnaire; Mini-SPIN = Mini Social Phobia Inventory; BDI-II = Beck Depression Inventory; SIAS = Social Interaction Anxiety Inventory; SD = Standard Deviation. All correlations are significant at the p < .001 level.

Distribution of social anxiety and depression symptoms. Note. The x-axis represents SIAS scores; y-axis represents BDI-II scores. The vertical line denotes the cut off score (28) indicating clinically elevated levels of social anxiety symptoms. The horizontal line denotes the cut off score (19) indicating moderate levels of depression symptoms.
Participants then completed an end-of-day survey about social and emotional experiences for 14 days. Surveys were sent at 8 p.m. and expired at 11:59 p.m. Data were collected from June to November 2020; 40.1% participants began surveys in June, 19.0% in July, 24.5% in August, 9.7% in September, and 6.7% in October. Of the 326 who completed the baseline survey, 292 participants completed the 14-day daily survey portion of the study.
Participants could earn up to $50 for participating: $2 for completing each daily survey, $12 in compliance bonuses ($5 for completing at least 5 surveys each week and an additional $1 for completing all seven surveys), and $10 for completing a 1-month follow-up survey. Participants received weekly updates on their survey compliance and earnings to date.
After data collection, three members of the research team reviewed the data for patterns of invalid responding (e.g., reporting the same answer for every item in one survey). Sixteen participants were removed due to invalid responses. Per guidelines for handling missing intensive longitudinal data (Nezlek, 2011), seven participants who completed only one daily survey were removed. The final sample included 269 adults (79.2% female, 19.0% male, 1.9% other) with a mean age of 33.1 years (SD = 14.6, range = 18–73). Racial/ethnic composition was as follows: 71.4% White/European American, 7.4% Black/African American, 10.8% Asian/Pacific Islander, 23.0% Hispanic/Latino, 1.9% Arab/Middle Eastern, and 1.9% identified as “other”. Sexual orientation composition was as follows: 72.5% heterosexual, 16.4% bisexual, 6.3% gay/lesbian/queer, and 4.8% identified as “other.”
Measures
Symptom Measures
Depression Symptoms
The 21-item Beck Depression Inventory (BDI-II; Beck et al., 1988) assesses severity of depressive symptoms in the last 2 weeks using a 4-point Likert scale ranging from 0 to 3, where the descriptors for each item vary. Participants are asked to “...read each group of statements carefully. And then pick out the one statement in each group that best describes the way you have been feeling during the past two weeks, including today.” An example item reads: (0) I do not feel sad, (1) I feel sad much of the time, (2) I am sad all the time, and (3) I am so sad or unhappy that I can’t stand it. Items were summed to create a total score. Clinical cutoffs are as follows: 0–9 = minimal depression; 10–18 = mild depression; 19–29 = moderate depression; and 30–63 = severe depression (Beck et al., 1988). Reliability was acceptable (α = .90).
Social Anxiety Symptoms
The 20-item Social Interaction Anxiety Scale (SIAS; Mattick & Clarke, 1998) assesses general fears and avoidance of social interactions (e.g., “I have difficulty talking with other people”) using a 5-point Likert scale (0 = not at all to 4 = extremely). The three reverse-scored items reduce reliability and validity (Rodebaugh et al., 2011) and thus were excluded in total score computation. SIAS scores reliably discriminate between people with and without SAD, with scores above 28 on the 17-item SIAS indicating clinically significant levels of social anxiety (Rodebaugh et al., 2011). Reliability was acceptable (α = .94).
Daily Measures
Unless noted, participants rated all daily measures on a 5-point Likert scale (1 = not at all to 5 = extremely), with higher scores indicating higher endorsement of the items.
Loneliness
Daily loneliness was assessed with four items drawn from UCLA Loneliness scale (Russell, 1996). The wording of the items was changed to reflect feelings of loneliness that day (e.g., “Today, I felt that I lacked companionship”). Items were averaged to create a total score for each day.
Time Spent Socializing
Social interaction quantity was measured with one item (i.e., “Today, how much time did you spend interacting with people”). Participants could choose from the following options: 1 = less than 1 hour, 2 = 1-3 hours, 3 = 3-5 hours, 4 = more than 5 hours, or 5 = I did not interact with other people today.
Social Interaction Type
Participants indicated the types of social interactions they had: “In-person interaction (one-on-one)”, “In-person interaction (small group)”, “Live Video Chat (e.g., Skype, Zoom, Facetime)”, “Texting (one-on-one)”, “Texting in a group chat”, “Email for social reasons”, “Online instant messaging (e.g., Facebook messenger, G-chat)”, “Dating website or app (e.g., Bumble, Tinder, Grindr, OkCupid)”, “Direct one-on-one messaging through social media (e.g., Instagram, Facebook, Snapchat)”, “Posting on a social media site (e.g., Facebook, Instagram, Snapchat, TikTok)”, “Using technology to facilitate a group event (e.g., watching a movie together through Netflix Party, Facebook Watch Party, or virtual happy hour)”, or “Phone call.” Participants could select multiple options to indicate every social interaction type they experienced each day. Participants were not asked to estimate the number of times they experienced each type. If participants did not socialize that day, they selected, “I did not interact with other people today.”
To streamline categories, interactions were consolidated into 5 types: in-person, messaging, social media, video chat, and “other.” In-person interactions were averaged to create the “in-person” subtype; online instant messaging and texting were averaged to create the “messaging” subtype; direct one-on-one messaging through social media and posting on a social media site were averaged to create the “social media” subtype; live video chat and using technology to facilitate a group event were averaged to create the “video chat” subtype; email for social reasons, dating website or app, phone call, and any other method of connecting with people were averaged to create the “other” subtype.
Social Interaction Quality
Social Interaction Enjoyment
Social interaction enjoyment was assessed with one item (i.e., “Thinking about all of your social interactions today (in-person and online), how enjoyable were they?”). This item was adapted from a daily diary study on social interaction quality (Nezlek et al., 2000).
Social Interaction Meaning
Social interaction meaning was assessed with one item (i.e., “Today, my social interactions were meaningful”). This item was adapted from a study that used experience-sampling methodology (ESM) to explore social interaction quality (Villanueva et al., 2020).
Social Connection and Disconnection
Social connection was assessed with one item (i.e., “Thinking about how you felt towards other people in your social interactions today (in person and online), to what extent did you feel close and connected?”). This item was adapted from a prior daily diary study that examined social closeness (Murray et al., 2003). Social disconnection was assessed with one item (i.e., “Today, I felt distant and closed off from people in my social interactions”). This item was adapted from the Social Connectedness Scale-Revised (SCS-R; Lee et al., 2001).
Authenticity
Authenticity was assessed with one item (i.e., “Today, I was effortlessly myself during my social interactions”). This item was adapted from a previous daily diary study on social interaction quality (Shelton et al., 2005).
Social Safety and Threat
Perceptions of social interaction partners were assessed with two items. One assessed social safety (i.e., “Today, during my social interactions, other people were warm/friendly”) and one assessed social threat (i.e., “Today, during my social interactions, other people were critical/judgmental”). These items were used in an ESM study on social interaction dynamics (Kashdan et al., 2014).
Partners’ Interest
Partners’ interest in the conversation was assessed with one item (i.e., “Today, people in my social interaction(s) showed genuine interest in our conversation”). Partners’ interest in the participant was assessed with one item (i.e., “Today, people in my social interactions showed genuine interest in me”). These items were adapted from an ESM study on social interaction dynamics (Kashdan et al., 2014). Following guidelines on interpretation of correlation coefficients (Schober et al., 2018), we combined and averaged items in cases where between-person correlations exceeded .90. These items were strongly correlated (r = .92) and were consequently averaged.
Rejection Concerns
Rejection concerns were assessed with two items. One item assessed the extent to which participants felt rejected (“Today, during my social interactions, I felt rejected”) and one item assessed the extent to which participants were worried about being rejected (“Today, during my social interactions, I was worried that I would be rejected”). These items were adapted from a daily diary study on rejection (Ford & Collins, 2013).
Results
Analytical Overview
Analyses were conducted in R version 4.2.1 (R Core Team, 2021). Power analysis curves generated with EMAtools::ema.powercurve (Kleiman, 2017) suggest that power was sufficient (>.8) to detect small effects. Multilevel reliability of daily measures was computed using psych::multilevel.reliability (Revelle, 2021), which estimates reliability within repeated measures data; we report reliability of within-person variations averaged over items (RCN) and between-person differences averaged over time and items (RKRN). We computed intraclass correlation coefficients (ICC) for all daily measures, which represents the percentage of variance attributable to differences between subjects relative to the total variance.
Multilevel modeling was used to accommodate the hierarchical nesting of the data, with days (Level 1) nested within persons (Level 2). Multilevel models were run using the lmer function in the lme4 package (Bates et al., 2015). Continuous Level 1 variables were person-mean centered (Nezlek, 2011). Because standardizing Level 1 variables eliminates meaningful person-level variance (Nezlek, 2011), Level 1 variables were not standardized, and bs can be interpreted based on original item scales.
We examined how each social interaction type and perception of social interaction quality predicted loneliness contemporaneously (day n) and prospectively (n + 1). In these analyses, loneliness was the outcome variable and social interaction features were Level 1 predictors. All analyses controlled for the effects of participants’ average endorsement of each perception across the study duration. In prospective analyses, the effects of same-day loneliness were controlled for. Analyses also controlled for the effects of time spent socializing, as it is negatively associated with loneliness (Kuczynski et al., 2021). Two multilevel effect sizes were estimated for each model: marginal R2m (i.e., proportion of the total variance explained by the fixed effects) and conditional R2c (i.e., proportion of the total variance explained by both fixed and random effects) (Nakagawa et al., 2017).
We conducted four multiple predictor multilevel models to assess the relative importance of each predictor in predicting same- and next-day loneliness. We assessed multicollinearity for all multiple predictor models using the check.collinearity function in the performance package in R (Lüdecke et al., 2021). Variance inflation factors (VIFs) exceeding 5 indicate problematic multicollinearity across predictor variables (Gareth et al., 2013); thus, models were only analyzed if VIFs were <5 and multicollinearity was tolerable. All models had VIFs below threshold. Dominance analyses were performed for each model using the dominanceAnalysis function in the dominanceanalysis package to determine the strongest predictor of loneliness in each model (Navarrete & Soares, 2020). Dominance analysis yields two indices that estimate the predictive ability of Level 1 predictors: R&B R 1 2 and S&B R 1 2. Both indices estimate the amount of additional variance accounted for by adding a given predictor in multiple predictor models. However, R&B R 1 2 is best suited for explaining which predictor accounts for the most within-person variance in multilevel models (Luo & Azen, 2013). Thus, although both indices are reported, R&B R 1 2 estimates were used to determine the strongest predictors of the outcome variable.
Descriptive Statistics
Within-and between-person bivariate correlations and descriptive statistics for daily variables.

Note. Within-person correlations are above diagonal; between-person correlations are below diagonal. SI = social interaction. SD = standard deviation. ICC = intraclass correlation coefficient represents the between person variance to the total variance. R CN = reliability of within-person variations averaged over items.
R KRN = reliability of between-person differences averaged over time and items.
**p < .01, *p < .05.
Participants submitted 2986 surveys with an average of 11.1 surveys across the 14-day period (SD = 3.5). Most participants (61.3%) completed 12 or more daily surveys. A small percentage of participants (14.9%) completed less than half of the daily surveys. Participants socialized on average 10 days during the study and reported socializing on average 96% of days in which they submitted a survey. More than half of days (51.6%) featured in-person social interactions; 31.5% of days had interactions via social media, 16.2% were via video chat, 43.7% were via instant messaging, and 7.2% of days contained an “other” response. Cumulative percentage is >100% because participants could select multiple interaction types each day.
Primary Analyses
Social Interaction Type
Social interaction type and contemporaneous and prospective loneliness.

Note. b = unstandardized beta coefficient. 95% CI = confidence interval. t = t-statistic. R2m = marginal r-squared term; R2c = conditional r-squared term. Test statistics represent the effects from separate models.
Dominance analysis: Social interaction type and loneliness.
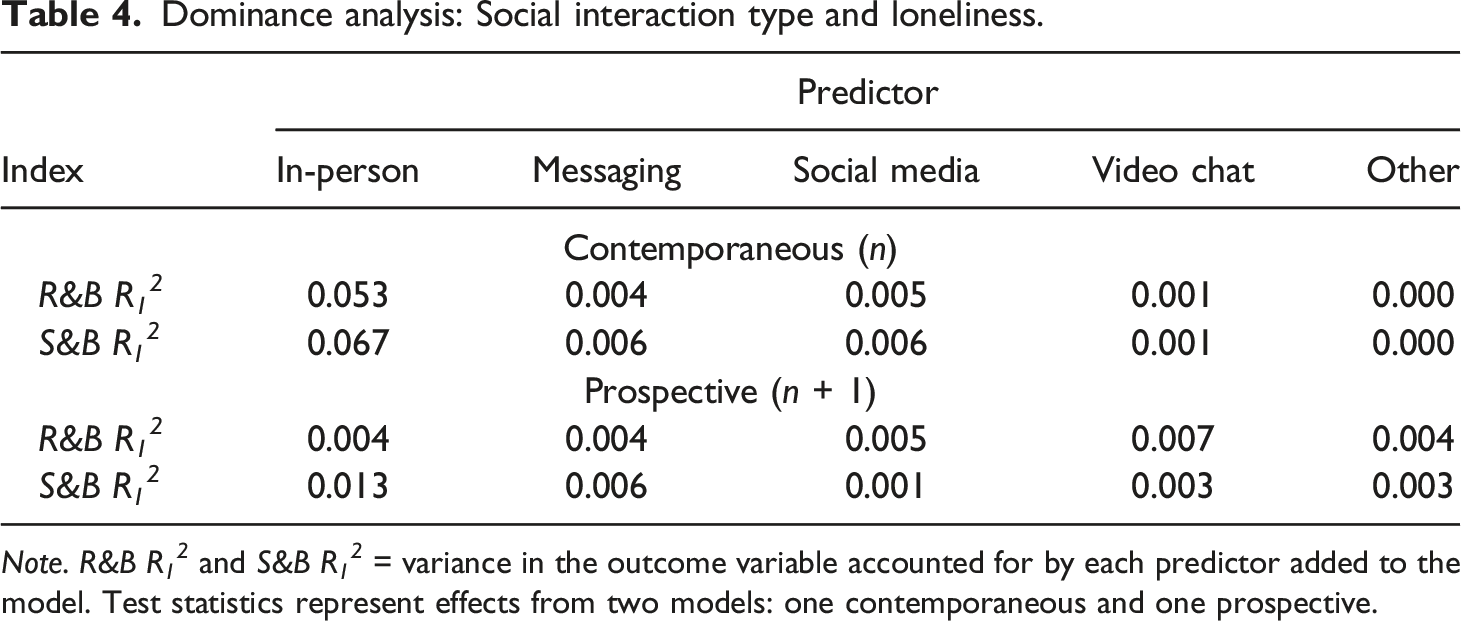
Note. R&B R 1 2 and S&B R 1 2 = variance in the outcome variable accounted for by each predictor added to the model. Test statistics represent effects from two models: one contemporaneous and one prospective.
Paradoxically, interacting with others via social media and video chat predicted increases in next-day loneliness. No lagged effects were observed for interacting in person, via messaging, or “other” interactions and next-day loneliness. Full statistics are presented in Table 3. Interacting via video chat was the strongest predictor of increased next-day loneliness relative to all other interaction types. Full statistics are presented in Table 4.
Social Interaction Quality
Perceived social interaction quality and contemporaneous and prospective loneliness.
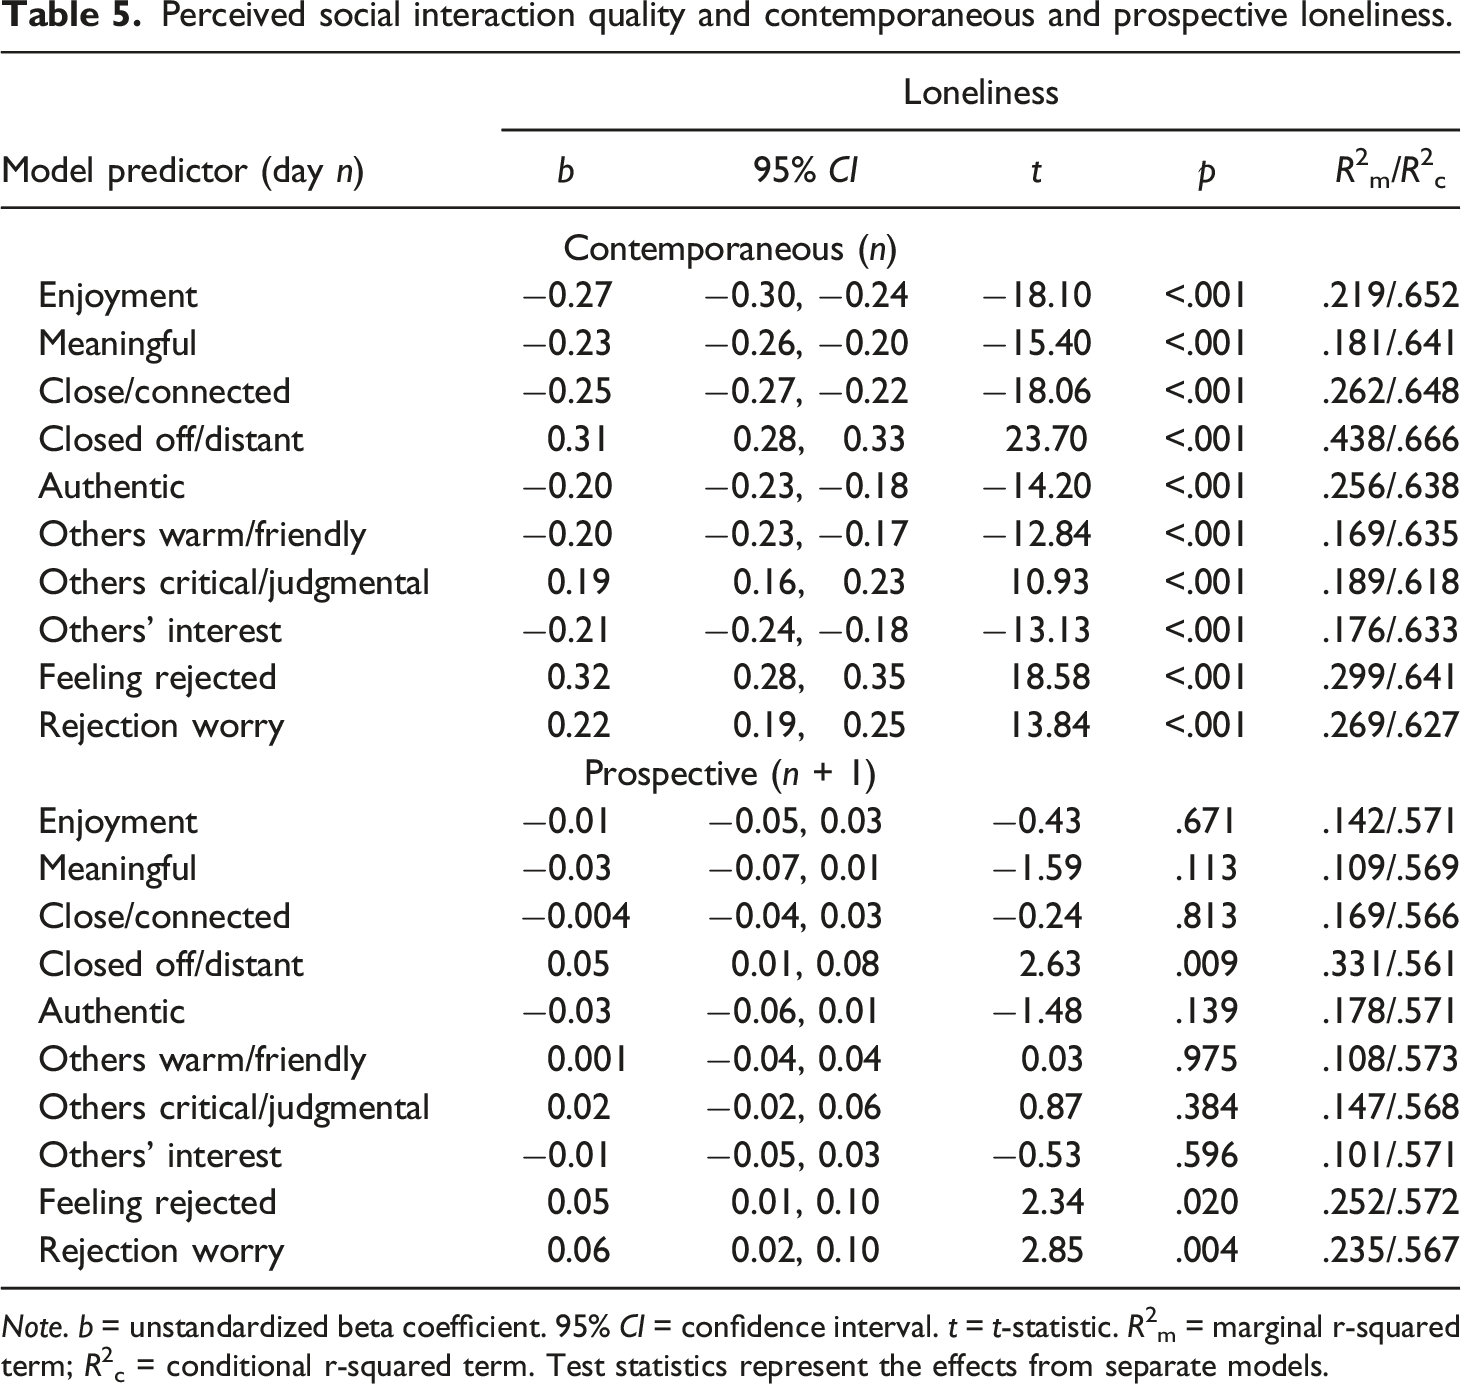
Note. b = unstandardized beta coefficient. 95% CI = confidence interval. t = t-statistic. R2m = marginal r-squared term; R2c = conditional r-squared term. Test statistics represent the effects from separate models.
Dominance analysis: Perceived social interaction quality and loneliness.

Note. R&B R 1 2 and S&B R 1 2 = amount of variance in the outcome variable accounted for by each predictor added to the model. Test statistics represent effects from two models: one contemporaneous and one prospective.
Feeling closed off and distant, feeling rejected, and worrying about rejection predicted increases in next-day loneliness. No lagged effects were observed for positive perceptions on next-day loneliness. Full statistics are presented in Table 5. Feeling closed off and distant was the strongest predictor of next-day loneliness when compared to all other perceptions. Full statistics are presented in Table 6.
Discussion
This study was designed to examine how two features of social interactions—type of interaction and its perceived quality—might protect (or not protect) against daily loneliness. Using daily diary methodology, we found that socializing in person and via social media were associated with reduced loneliness. We also found links between participants’ perceptions of the quality of their social interactions and their daily loneliness, such that positive perceptions were associated with reduced loneliness and negative perceptions were associated with greater loneliness. Taken together, features of participants’ social interactions robustly predicted daily reports of loneliness, even after accounting for how much time was spent socializing each day.
The Advantages of In-Person Interactions
As predicted, socializing in person was the strongest predictor of same-day loneliness; when participants socialized in person, they reported feeling less lonely than on days they did not relative to other types of interactions. Although aspects of our design were novel, this finding aligns with findings from other recent experience-sampling methodology (ESM) studies suggesting that interacting more with others in person (relative to interacting virtually) is associated with higher well-being (Kroencke et al., 2022), increased positive affect, and reduced stress (Forbes et al., 2021). One possible explanation for this pattern is that in-person interactions offer greater opportunities for social connection. In-person interactions offer unobstructed access to social cues (e.g., nonverbal behaviors; Sacco & Ismail, 2014) that help people understand their interaction partners and effectively respond to fast-moving social dynamics. Moreover, in-person interactions require close physical proximity between interaction partners, a known predictor of better social outcomes (e.g., perceived partner warmth; Okdie et al., 2011). Thus, there are multiple indications that the nature of in-person interactions suits them for fostering the kinds of human connections that allay loneliness.
Nevertheless, it is also important to note that socializing through social media also predicted lower same-day loneliness, albeit to a lesser degree. Social media is often criticized for its lack of social richness or intimacy (Scott et al., 2022), but the social distance may act as a “safe haven” for people who struggle with in-person interactions (Erwin et al., 2004). For example, some people report being able to be more authentic when they interact via social media compared to in person (Bargh et al., 2002). Additionally, social media interactions are not bound by time and geographical constraints, providing greater flexibility for when and with whom people can interact. People perceive online interactions as accessible and easy to facilitate when attempting to maintain communication with close friends who are geographically distant (Scott et al., 2022). This flexibility may offer more opportunities for interactions and provide people the freedom to interact when they feel prepared to do so, even if those interactions lack intimacy.
Interestingly, despite being the strongest predictor of same-day loneliness, in-person interactions were unrelated to changes in next-day loneliness. In fact, none of our types of social interaction were associated with reduced next-day loneliness. Paradoxically, interacting via social media and video chat predicted more next-day loneliness. In other contexts, social media use has been linked with worse psychological functioning (e.g., increased loneliness, depression; Kross et al., 2013) which is commonly attributed to increased opportunities for self-scrutiny and negativity towards others (Verduyn et al., 2017). Psychological benefits of interacting via social media may ultimately be squandered by these intense and often long-lasting costs of social media use, especially because these costs directly oppose social connection. The link between video chatting and adverse psychological outcomes also bears comment. Although a small body of research finds that video chatting can help foster social connectedness when in-person interactions are less accessible (Greenberg & Neustaedter, 2013; Nguyen et al., 2021), there are likely limits. First, it can be difficult to recognize social cues over camera, especially if the quality of the video is impeded by background distractions (Ames et al., 2010). Second, video chatting may result in increased loneliness for some people because it is a reminder of the in-person interactions they are missing out on (Marler et al., 2022) or leaves them missing their close companions, especially those who they cannot interact with in person. Thus, understanding how types of social interactions impact loneliness may require considering the interplay of short- and long-term effects of the ways in which people interact.
Perceived Social Interaction Quality
Various indices of social interaction quality were strong predictors of daily loneliness. As hypothesized, participants reported less loneliness when their social interactions were more enjoyable and meaningful and they reported feeling socially connected, interested, satisfied, safe, and authentic. Participants reported more loneliness when they felt socially disconnected, threatened, and had rejection concerns during their social interactions. Prior research consistently finds that the quality of people’s social interactions hinges on their perceptions of themselves and others during the interaction. For example, feeling authentic and competent, engaging in more communal behaviors during an interaction (e.g., being friendly; Downie et al., 2008; Wieczorek et al., 2021), and liking one’s interaction partners (Sun et al., 2020) have been linked to good quality social interactions. Our findings align with prominent theories of loneliness (e.g., Peplau & Perlman, 1982; Sermat, 1978) that outline tight links between healthy social functioning and reduced loneliness. Our findings also add to recent work (e.g., Mote et al., 2020; Sun et al., 2020; Wieczorek et al., 2021) that contends that loneliness is a malleable experience that is strongly influenced by people’s evolving perceptions of the quality of their daily social interactions.
Despite the common assumption that loneliness is isomorphic with isolation (e.g., Wigfield et al., 2022), we found that people reported increased same- and next-day loneliness on days when they had social interactions they perceived to be negative. In fact, loneliness was most acute in interactions where people felt distant and closed off from others. Self-relevant disclosure is commonly cited as one of the most important predictors of rewarding human communication and connection (e.g., Luo & Hancock, 2020). When absent, people are more likely to form negative impressions of their interaction partners (Papsdorf & Alden, 1998) and struggle to form interpersonal bonds, heightening risk for loneliness (Wei et al., 2005).
Interestingly, positive perceptions of social interactions have more transient effects on loneliness than negative perceptions. None of the positive perceptions predicted next-day loneliness, whereas three of the four negative perceptions predicted more next-day loneliness. These effects may be attributable to humans’ general tendency to attend to and perseverate on negative experiences at higher rates than positive ones (i.e., negativity bias; Cacioppo, Cacioppo, & Gollan, 2014). Additionally, negative social experiences may be more socially and psychologically impactful than positive ones. For example, one study found that having more negative social interactions was associated with a 20 percent increase in likelihood of reporting depression symptoms whereas having more positive social interactions did not impact the likelihood of reporting depression symptoms (Primack et al., 2018). Other work has found that negative interactions more strongly impact couples' relationship satisfaction than positive ones (Gottman & Krokoff, 1989). Thus, the key to lasting reductions in loneliness may be more heavily dependent on reducing poor quality social interactions than on increasing high quality ones.
Strengths, Limitations, and Future Directions
One strength of this study is that we examined the impact of diverse, naturally-occurring social interactions on daily loneliness in a relatively large sample with many observations. Our daily diary design also allowed us to examine prospective relationships that provide insight into the enduring effects of social interaction features that might allay or exacerbate loneliness. Additionally, we assessed individuals with a broad range of internalizing symptoms during unprecedented circumstances that increased risk for loneliness. Our sample and window of data collection allowed for a unique examination of how people combat loneliness in the face of challenges that directly interfere with social connection.
At the same time, several study limitations offer directions for future research. First, we assessed features of social interactions over the entire day at the end of each day, and participants’ reports may have been subjected to end-of-day recall bias; making appraisals about an interaction several hours after the interaction occurred can be biased by more salient interactions that occur later in the day. Additionally, participants reported on their average perception of social interactions that occurred throughout the day rather than each interaction. This end-of-day prompt schedule prohibits examination of specific social interactions, such as how perceptions vary throughout the day. Although daily diary designs provide several data points per person to examine within-person processes, ESM designs with multiple prompts per day (e.g., ecological momentary assessment; event-contingent reporting) may offer greater precision for understanding connections between social interaction features and perceptions. Second, to make our study feasible, we focused on two social interaction features; we recognize that our design did not include all factors that likely influence loneliness (e.g., interaction partner; Rinderknecht et al., 2021). Additionally, interaction features may also covary with interaction type (e.g., greater likelihood of in-person interactions with neighbors than long-distance relatives). We recommend high-powered future investigations that focus on how different social interaction features may interact to predict loneliness. Third, several strengths of the study design may also serve to constrain the generalizability of our findings. These data were collected during a time when loneliness was unusually salient. Stay-at-home orders coupled with fears of spreading illness disrupted people’s socialization and increased rates of loneliness (Ernst et al., 2022). Thus, it is possible that acute social disconnection compounded the effect of social threat on loneliness. Our sample was also restricted to Florida residents to minimize inter-state policy variability; thus, study findings necessarily have uncertain generalizability to other U.S. states or in other countries. Additionally, study participants were restricted to those who reported elevated social anxiety and/or depression during the screening process. Because these individuals often experience chronic social difficulties, there may be less possibility in these groups for subjectively good quality social interactions to attenuate loneliness (Hames et al., 2013; Lim et al., 2016). For example, our observations of short-lived buffering effects of positive perceptions of social interaction quality may result from particular features of social anxiety or depression. However, according to baseline measures, our sample had a range of social anxiety and depression symptoms. Thus, our findings may not entirely represent experiences of those with clinical levels of social anxiety and depression. Future research that examines the generalizability of our results, is warranted.
Conclusion
Loneliness is a costly global issue. Despite the ubiquity of technology-mediated interaction, rates of loneliness continue to rise. Increasing access to social interactions appears to be insufficient to address loneliness. Rather, tackling loneliness likely requires a more fine-grained understanding of the consequence of different kinds of social interactions. In this investigation, we demonstrated that specific features of social interactions are associated with reduced loneliness, including interactions that occur in person, those that elicit feelings of safety and warmth, and those in which a person feels authentic and engaged with their interaction partner. The strongest predictors of loneliness, however, were social interactions characterized by threat and social disconnection, which predicted lasting increases in loneliness. These findings offer support for negativity bias principles that posit that negative experiences have a more salient and dominant impact on people than positive experiences (Baumeister et al., 2001; e.g., minimizing interactions fraught with negativity may be more important for allaying loneliness than seeking positive interactions). In sum, present results suggest that spending time socializing is not a panacea for loneliness; quality matters as much. Therefore, in an increasingly connected world with near-immediate access to other people, it will be critical to understand the tradeoffs of different social interactions.
Footnotes
Funding
The author(s) disclosed receipt of the following financial support for the research, authorship, and/or publication of this article: This research was supported by a research grant awarded by the University of South Florida to Fallon R. Goodman (USF COVID-19 Rapid Response Grant Program).
Open Research Statement
As part of IARR’s encouragement of open research practices, the authors Gabriella Silva, Ruba Rum, Justine Brennan, Jonathan Rottenberg, and Fallon R. Goodman have provided the following information: This research was not pre-registered. The data and materials used in the research are publicly posted. Data and analytic code can be obtained at: ![]() . Questions about retrieving the data can be directed to:
. Questions about retrieving the data can be directed to: