



Abstract
Despite a number of research studies investigating the Yes–No vocabulary test format, one main question remains unanswered: What is the best scoring procedure to adjust for testee overestimation of vocabulary knowledge? Different scoring methodologies have been proposed based on the inclusion and selection of nonwords in the test. However, there is currently no consensus on the best adjustment procedure using these nonwords. Two studies were conducted to examine a new methodology for scoring Yes–No tests based on testees’ response times (RTs) to the words in the test, on the assumption that faster responses would be more certain and accurate whereas more hesitant and inaccurate ones would be reflected in slower RTs. Participants performed a timed Yes–No test and were then interviewed to ascertain their actual vocabulary knowledge. Study 1 explored the viability of this approach and Study 2 examined whether the RT approach presented any advantage over the more traditional nonword approaches. Results showed that there was no clear advantage for any of the approaches under comparison, but their effectiveness depended on factors like the false alarm rate and the size of participants’ overestimation of their lexical knowledge.
Introduction
The Yes–No test
The Yes–No (checklist) vocabulary test format remains one of the better-known measures of vocabulary size. It simply consists of the presentation of a list of words and testees are asked to indicate whether they know the words presented or not. It has the major advantage of measuring a large number of items in a relatively short period of time (e.g. Beeckmans, Eyckmans, Janssens, Dufranne, & Van de Velde, 2001), which allows a higher sampling rate than most other formats can offer. Yes–No tests also have the advantages of test administration to a large number of people (Nation, 1990), limited task demands (e.g. Harrington & Carey, 2009), easy development of items, straightforward and automatic scoring, and no apparent negative washback effects (Meara, 1990). Overall, the Yes–No test format is time and resource efficient (Mochida & Harrington, 2006). In addition, a number of validation studies compared the results of Yes–No tests to those of other tests of vocabulary size (mainly using multiple-choice formats), and the majority have found strong correlations (r ≥ .50) (e.g. Anderson & Freebody, 1983; Harrington & Carey, 2009; Lemhöfer & Broersma, 2009; Meara & Buxton, 1987; Meara & Jones, 1988; Mochida & Harrington, 2006), although much weaker correlations have been found with productive measures of vocabulary knowledge (e.g. Cameron, 2002; Eyckmans, Van de Velde, van Hout, & Boers, 2007).
However, despite its advantages and generally positive validation evidence, the Yes–No format is subject to several important criticisms: evidence that it seems to work differently for testees with different L1s (Meara, 1990) and low-proficiency students (Meara, 1994); the difficulty of testing polysemous words (Anderson & Freebody, 1983); and the inability to measure productive vocabulary. Most importantly, it has been criticized because of the possibility of testee overestimation, that is, responding ‘yes’ to words they do not know (e.g. Meara, 2010).
The most widely used approach to solve this last limitation (originally used by Zimmerman, Broder, Shaughnessy, & Underwood, 1977, and Anderson & Freebody, 1983) has been the inclusion of nonwords, that is, imaginary words that look like real words in the language being assessed (e.g. ploat). The assumption behind this method is that if testees tick many of these nonwords, they are not being careful in their judgements and scores need to be adjusted downwards. Ideally, a person who knew all the words in the test would respond ‘yes’ to all the real words and ‘no’ to all the imaginary words (Meara & Buxton, 1987). In reality, some nonwords are often ticked and the problem then becomes how to best adjust scores downwards based on this fact.
Scoring the test
Including words and nonwords in the test produces four types of responses:
hits (H) (‘yes’ responses to real words)
false alarms (FA) (‘yes’ responses to nonwords)
misses (‘no’ responses to real words)
correct rejections (‘no’ responses to nonwords).
Based on the proportion of H and FA, scores from Yes–No tests can be adjusted downwards. The simplest adjusting formula for calculating the proportion of words known is to subtract the number of FA from the number of H:

However, this formula has been considered too simplistic. Zimmerman et al. (1977) developed a recognition test to assess vocabulary knowledge and proposed the use of ‘signal detection theory’ to account for the possibility of response errors when completing a task. This theory attempts to quantify the ability to discern between an important, real signal and noise (any error or undesired random disturbance of a useful information signal). Results of their study showed that this ‘signal detection’ approach was a promising way of adjusting for response errors.
From the field of psychology with Green and Swets (1966) and Zimmerman et al. (1977), signal detection theory first reached the field of vocabulary testing through the work of Anderson and Freebody (1983). They used a scoring system which relied on a simple approach similar to what educators had traditionally used to correct multiple-choice or true/false tests for guessing, based on the proportion of hits (H) and false alarms (FA). This formula has been later referred to as the ‘correction for guessing’ formula (cfg) (e.g. Huibregtse, Admiraal, & Meara, 2002). It was also used by Meara in some of his earliest papers in the development of Yes–No tests (e.g. Meara & Buxton, 1987). (P = proportion)

However, they realized that the cfg formula stressed the hit rate over the false alarm rate. Consequently, Meara developed a more advanced formula, also based on signal detection theory (e.g. Meara, Lightbown, & Halter, 1994), which would adjust raw scores according to how much each subject was guessing. This measure has been traditionally called ‘delta m’ (Δm), and referred to in more recent studies as ‘Meara’s Δm’ (e.g. Huibregtse et al., 2002). Δm equals the cfg formula minus the ratio FA/H:

In 2002, Huibregtse et al. conducted a study comparing the three main approaches proposed so far and claimed that although Δm accounted for the possibility of guessing it did not account for participants’ response styles. They then proposed a new adjustment formula which would account for both factors:

They took results of a Yes–No test developed by Meara in 1992 and applied the different scoring systems to examine which method provided the best estimate. Results showed that the measure of Δm always yielded an underestimation of the intended standard, whereas the ‘cfg’ method gave an overestimation for large hit proportions. The simple H – FA formula produced values that were in most cases comparable and sometimes identical to those of the Isdt approach. Based on these results, they suggested the use of their new method of correcting and adjusting the scores of Yes–No tests.
Mochida and Harrington (2006), in their study comparing scores of the Yes–No tests with scores of the Vocabulary Levels Test (VLT), also examined the four above scoring methods (plus raw hits scores) and found they all yielded only small differences in the outcomes. In fact, the raw number of hits was the best mean predictor for overall performance on the concurrent Vocabulary Levels Test. Results from the simplest H – FA were comparable to the more complex cfg and Isdt formulas, and they therefore concluded that it is a parsimonious and very serviceable alternative, at least for non-research applications of the Yes–No format. However, Beeckmans et al. (2001), motivated by the strange patterns found in the results of a Yes–No test administered to their French-speaking learners of Dutch, examined the effect that the different correction formulae had on test results and concluded that the Yes–No test format ‘suffers from a bias which cannot be handled by one of the correction methods while maintaining a sufficiently accurate measurement’ (p. 272). Thus, despite several comparisons, there is still no consensus on the best scoring methodology, although some more recent researchers have adopted the simple H – FA formula (e.g. Harrington & Carey, 2009).
Exploring the time element in Yes–No tests
There have been very few attempts to investigate the relationship between reaction time (RT) and vocabulary knowledge in Yes–No tests. This idea of using word recognition speed to assess testees’ vocabulary knowledge was first attempted in an indirect way by Meara (1994). He aimed to produce a standard set of words reflecting different frequencies which could be used to check native speaker (NS) RTs, which could then be compared with non-native speaker (NNS) RTs. Learners would be asked whether they knew the words or not, and they would be assessed on how far they deviated from native recognition norms. However, this approach was abandoned because of the lack of appropriate equipment to measure small differences in RTs in the classroom and because of the difficulty of comparing NS and NNS RTs.
More recent studies have tried to incorporate a time element in computerized versions of the Yes–No test, using RT data. Harrington and Carey (2009), for example, investigated the relationship between placement level decisions and individual references in response time in Yes–No tests and they found that, in general, the mean RT for the Yes–No test decreased as a function of placement level. However, results also showed that RT was not a very sensitive discriminator of placement levels.
Furthermore, Miralpeix and Meara (2010) explored the relation between vocabulary size and lexical access, by means of a Yes–No test and a lexical access task. Results showed that there was no significant correlation between size and speed of lexical access. However, results did not show a totally random relationship either, which led to the conclusion that the relation between these two variables might only be observable at specific stages of learners’ development and that it might not be a straightforward one.
Following this new trend in lexical research, the present paper explores the relationship between RTs and accuracy of responses in Yes–No tests. In an attempt to overcome some of the limitations of the use of nonwords outlined above and to explore the potential use of RT data to validate and score Yes–No tests, two experimental studies were conducted. Study 1 examined the viability of the use of RTs to validate and score Yes–No tests. Study 2 explored whether the proposed RT approach presented any advantages over the more traditional approaches based on the selection of nonwords.
Study 1: A reaction-time approach to scoring Yes–No tests
Study 1 explores the possibility of using RTs, that is, the time it takes testees to make their judgments, for scoring responses on Yes–No tests. The rationale behind this approach is that more hesitant and inaccurate responses would be slower, whereas more certain and accurate ones would be faster. Overly slow RTs would therefore not be considered as evidence for knowledge of the target words.
Participants performed a timed version of the Yes–No test and were then individually interviewed about each of the words appearing in the test to ascertain their actual knowledge of those words. Comparing Yes–No test data and interview responses, we investigated whether RT data is a viable means of adjusting the scores in Yes–No tests. Two main research questions were addressed:
Is RT a viable way of establishing the accuracy of responses in Yes–No tests?
and if so,
Is it possible to calculate a general accuracy threshold or cut-point in RTs to adjust the scores in Yes–No tests?
Participants
Yes–No tests have been mainly used with NNS, but in order to examine these tests in the greatest detail possible, we studied both native and nonnative participants. These included 75 English NS (61 female; 14 male) and 33 NNS (20 female; 13 male). The NS were second-year university students completing a degree in English Studies at a UK institution, whereas the NNS were postgraduate students or postdoctoral researchers at the same institution, with advanced proficiency and different L1 backgrounds. All NNS participants completed an online language background questionnaire, which included a self-rating test of proficiency in English. The mean values for all four skills were above 8 (Min = 5; Max = 10). NS received module credits in compensation for their participation, whereas for NNS, participation was voluntary.
Materials
Stimuli
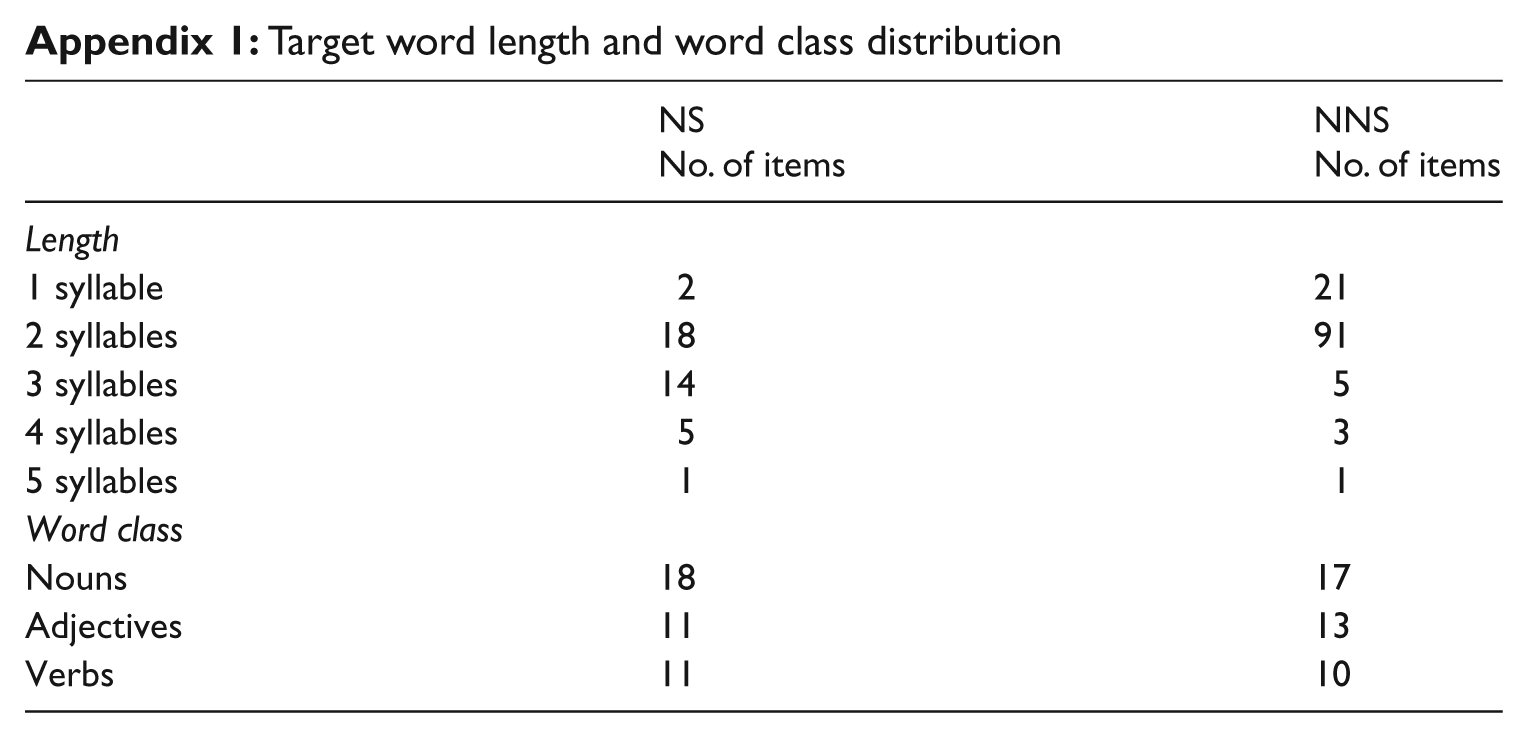
We needed to develop a set of target words, of which the participants would know some and not others, in order to get a range of responses on the test (i.e. some words judged as known, and others judged as unknown). In order to obtain such a variety of responses, we selected words from different word classes, lengths, and frequencies for the study, and balanced them according to these variables (Appendix 1). There were four groups according to level of difficulty and frequency: (1) Highly-frequent words; (2) Frequent words; (3) Infrequent words; (4) Highly-infrequent words. Highly-frequent words were taken from the most frequent words of the BYU-BNC: The British National Corpus (Davies, 2004). Frequent and Infrequent words were taken from the set of words which were known by around half of the participants (similar to those in this study) in a previous pilot study (confirming frequency with BNC corpus), suggesting they would lead to the desired variety of test responses. The Highly-infrequent words were selected from The Hutchinson Dictionary of Difficult Words (Ayto, 2006). Ultimately, 40 target words were selected for the study (Appendix 2).
The set of target words used for NNS was the same as the one used for NS except for one of the groups. The Highly-infrequent words were considered too challenging for the NNS, and so were substituted with another more frequent set of words, following the same criteria as for the rest of target items.
Measurement instruments
Fully knowing a word entails a constellation of word knowledge types (Nation, 2001), which begins with the development of a link between the word’s form and its meaning (Schmitt, 2010). However, this form–meaning link develops over time, and can have different degrees of ‘strength’ (Laufer & Goldstein, 2004). In this study, we mainly measure the form–meaning link at the meaning recall level: for example, when encountering a word in a text (i.e. its form is given) the learner will know its meaning and be able to retrieve it from memory (i.e. meaning recall) (Schmitt, 2010). Meaning recall essentially corresponds to the lexical requirements of reading and listening (the word form is encountered and the meaning must be recalled).
The testing instruments for Study 1 consisted of a computerized Yes–No test and a personal interview. The computerized version of the Yes–No test was designed using E-Prime software and run on an Apple Macintosh desk computer. Stimuli were presented one by one in the middle of the screen in random order, and participants had to decide whether they knew the words presented or not. The participants were instructed to consider a word as known if they would recognize it when encountering it in a text, and would know its meaning(s). A Cedrus button box registered participants’ responses and RTs were measured from the onset of the target word till the moment participants made their lexical decision. Instructions and practice sessions were included.
Personal interviews were conducted by the first author and consisted of two parts: meaning recall and meaning recognition. In the meaning recall part, participants were shown a list with the target words and were asked to provide an explanation of each word’s meaning in whatever way they felt best: definition, example, synonym, and so on. We also included a somewhat easier measure of the form–meaning link, meaning recognition (Schmitt, 2010), to capture knowledge below the meaning recall level. The meaning recognition part consisted of a multiple-choice item. One A3 card was prepared for each target word, each containing a multiple-choice item. Words were presented in a non-defining sentence context. There were three possible definitions for the word: two distractor definitions and the correct one, and a ‘don’t know’ option (see Appendix 3).
Procedure
Tests were conducted individually in a psycholinguistics laboratory. After instructions and a practice trial, participants completed the Yes–No test without knowing that they would be interviewed afterwards. Both accuracy and speed of response were encouraged. They were then interviewed on their knowledge of all the words included on the Yes–No test. During the meaning recall part, participants were probed until the interviewer was satisfied whether they could recall the meaning or not. If so, the meaning recognition part was bypassed and the interview moved on to the next word. If not, the meaning recognition part was performed. Participants were shown a card with the multiple-choice item and they had to say which one of the three definitions provided was the correct one. Guessing was controlled as much as possible by asking the participants to explain their reasons for selecting a particular option. A second rater scored 15 of the 108 interviews with the main researcher (13.33%). Both raters agreed in 99% of the responses evaluated.
There was no time limit, but the whole session, including the instructions, practice, Yes–No test, and interview, lasted for an average of 40 minutes for both NS and NNS.
The RT data needed to be screened for outliers. Psycholinguistic studies using the traditional word–nonword lexical decision task normally consider outliers responses faster than 200 ms and slower than 2000–2500 ms. In this study, there were no responses faster than 200 ms. However, since the task used in this study was a slightly different type of lexical decision task, RT behaviour was in general slower, and adopting the traditional criteria would result in the loss of a high percentage of data. After exploring different outliers, it seemed reasonable to select them based on the percentage of data loss and data distribution. RTs slower than 4000 ms for NS and 3000 for NNS were considered outliers and were not included in the analyses.
Results and discussion
Calculating test scores
Previous studies have compared Yes–No results against other vocabulary size measures, often with quite different characteristics (e.g. Yes–No tests vs. the Vocabulary Levels Test), which is a very indirect way of ascertaining the Yes–No format’s ability to capture lexical knowledge. This study has the advantage of directly assessing the participants’ knowledge of the target words in detail through a personal interview. Although very time-consuming, this is probably the surest way of accurately determining the participants’ actual knowledge of the words. Thus, a comparison of our Yes–No and interview scores is likely to give the soundest indication of the behaviour of the Yes–No format to date, and whether the oft-mentioned testee overestimation actually occurs.
The Yes–No test was scored awarding one point for each ‘yes’ response. There were two scoring possibilities for interviews, due to the two types of vocabulary knowledge addressed (meaning recall and meaning recognition). In ‘Criterion A’ (Table 1), one point was awarded if either meaning recall or meaning recognition were scored as correct responses. In the stricter ‘Criterion B’, one point was scored only if the meaning recall answer had been provided.
Yes–No test and interview mean scores (Study 1)
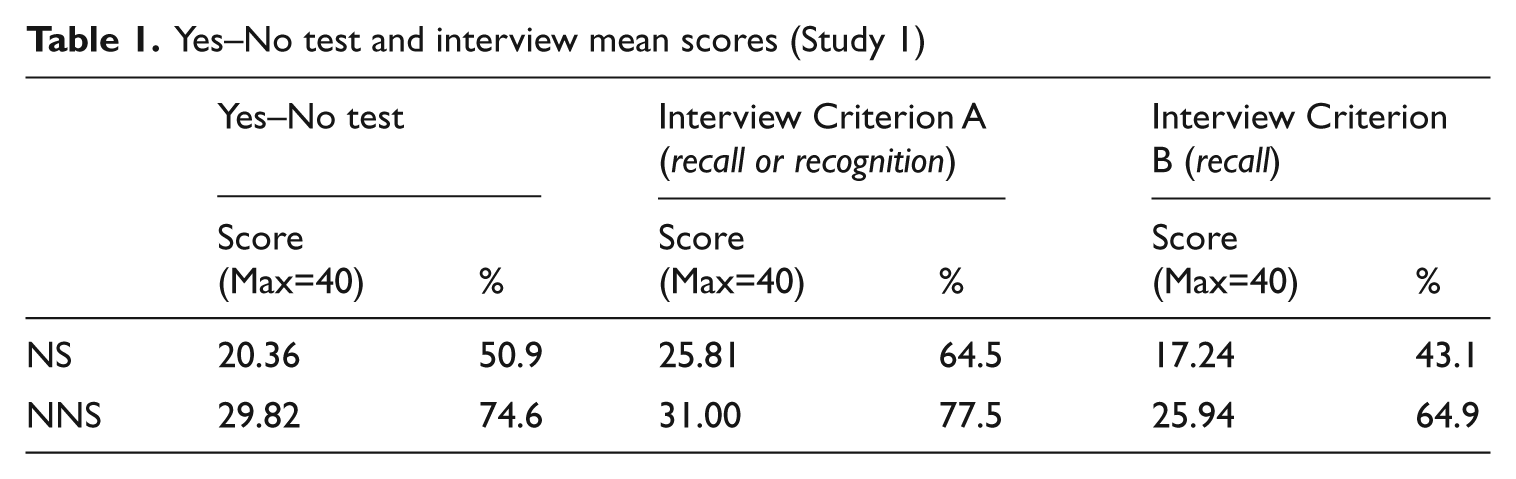
Table 1 shows that the design was successful in selecting a variety of target words, with some being known and some being unknown for each group. The NNS scored higher, due to an easier set of target words, but that is irrelevant for our purposes, as we are comparing Yes–No results against interview results, not NS against NNS results.
In this comparison, our evaluation of the effectiveness of the Yes–No test as a measure of actual vocabulary knowledge depends on the type of knowledge considered as the baseline. If we follow Criterion A, Yes–No test scores for NS would underestimate their knowledge, and for NNS it would be a very close match, questioning the need to adjust the scores of the Yes–No test. 1 However, if we follow Criterion B, there would be a clear overestimation in the Yes–No tests, which would imply the need to adjust the scores.
In deciding between Criterion A and B, meaning recall maps best onto ‘real-world’ usage (i.e. when reading a word form in text, a reader needs to know its meaning; meaning options are not given). 2 The meaning recall measure also had no guessing error. Furthermore, the Yes–No scores correlated slightly better with the interviews scores for Criterion B than A, for both NS (rho Criterion A = .481; rho Criterion B = .578; p = .000) and NNS (rho Criterion A = .823; rho Criterion B = .856; p = .000). For these reasons, Criterion B will be adopted in the present study as the true estimate of vocabulary knowledge. As a consequence, Yes–No test scores need to be adjusted downwards to reach, as closely as possible, the Criterion B interview scores.
Adjusting the scores: The RT approach
In order to explore the viability of the RT approach, we first needed to know whether RTs provided information about how accurate participants were in their responses. The assumption behind the proposed approach is that such a relationship between RTs and accuracy of responses does exist, and failure to show it would mean the impossibility of applying the RT methodology.
Responses were collapsed into ‘accurate’ (i.e. Yes–No response was confirmed by interview performance) and ‘inaccurate’ (i.e. interview performance indicated that the Yes–No response was incorrect) responses. Mann-Whitney tests between accurate/inaccurate responses and RTs were conducted with both ‘no’ and ‘yes’ responses. Only results of ‘yes’ responses will be reported in this study since these are the ones which contribute to testees’ scores and which are liable to overestimation. Following Criterion B, accurate ‘yes’ responses were those in which the test-taker had responded ‘yes’ in the Yes–No test and had later shown meaning recall ability in the interview, while inaccurate ‘yes’ responses are those in which participants were unable to show such recall.
Results in Table 2 show that there was a significant difference (p = .000) between accurate and inaccurate responses for both NS and NNS. Participants were significantly faster in saying ‘yes’ to a word when they were accurate in their responses than when there was a mismatch between what they had claimed to know in the Yes–No test and what they had shown in the interview. This pattern was also checked at the individual level and results showed that it was the case for 85% of the NS and 86% of the NNS. This difference was further explored according to the target words’ frequency. Results showed that the significant difference between faster accurate and slower inaccurate responses persisted when analysing data by higher- and lower-frequency groups (highly-frequent/frequent words and infrequent/highly-infrequent words, respectively).
RTs for accurate and inaccurate responses (Study 1)
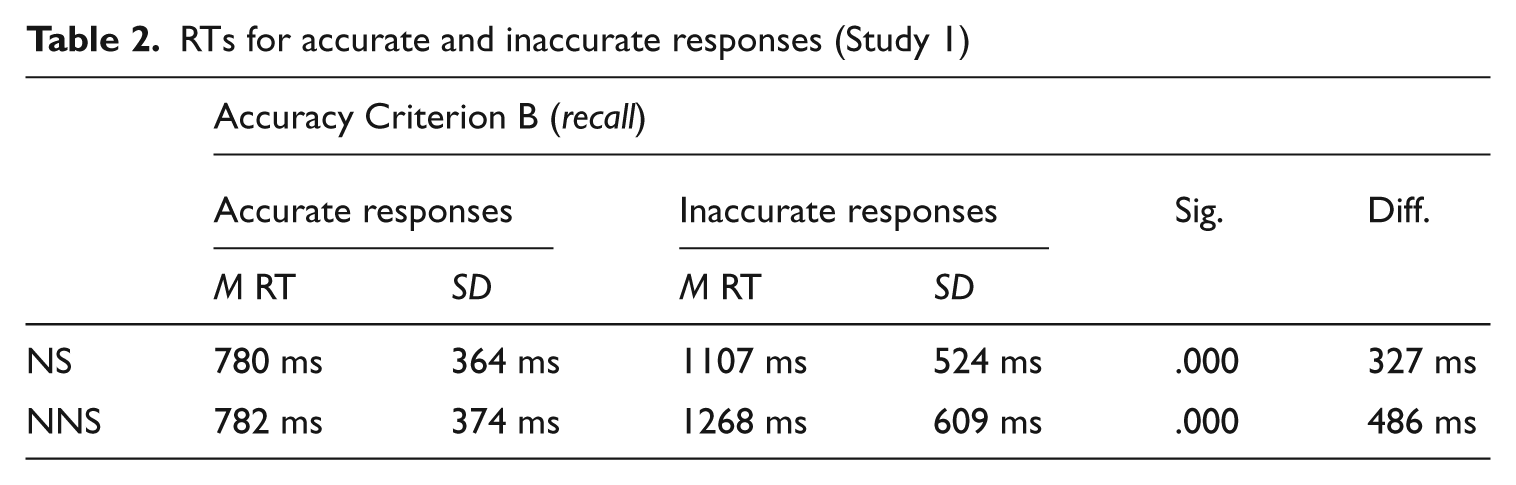
Based on these analyses, RT seems to be an effective way of discriminating between accurate and inaccurate responses. However, in order to be able to apply an RT approach, we need to find a common, general cut point in RTs from which we could say that responses in a timed Yes–No test start to become inaccurate and could therefore be discarded and used to adjust scores downwards.
Due to a lack of previous research, different ways of calculating this threshold were explored. We finally arrived at a method to calculate the threshold based on the group mean RT and standard deviation of all ‘yes’ responses. We calculated what proportion of the standard deviation it was necessary to add to the mean for ‘all yes responses’ (NS = 854 ms; NNS = 860 ms) to reach the mean for the ‘inaccurate yes responses’ (NS = 1107 ms; NNS = 1268 ms). This turned out to be 0.6 SD for the NS and 0.9 SD for the NNS (Table 3).
Calculation of the RT thresholds for NS and NNS (Study 1)

While these general threshold calculations worked at the group level, we needed to examine whether they would also work at the individual level. A threshold for inaccuracy was calculated for each participant, based on each person’s mean and standard deviation of ‘yes’ responses. For example, the threshold of a NS with a mean ‘yes’ RT of 832 ms and a standard deviation of 379 ms would be 1059 ms (832 + 0.6 × 379 = 1059.4). We then checked the percentage of each participant’s ‘yes’ responses which were correctly divided by the threshold. Ideally, all the accurate responses should fall above the threshold and all inaccurate responses below it. In other words, RTs of accurate responses would ideally be faster than the RT threshold for inaccuracy of a given participant, whereas RTs of inaccurate responses should be slower than the threshold value. Results showed that a mean of 77% of NS responses and 83% of NNS responses were accurately divided by the threshold.
However, the really interesting issue is the effect of the RT approach on test scores. Yes–No test scores were again calculated applying the RT adjustment methodology, simply by subtracting the scores corresponding to the number of ‘yes’ responses falling below the threshold for inaccuracy. Table 4 shows the mean Yes–No test raw scores and interview scores and the new adjusted scores. It can be seen that the RT-adjusted scores provide a very close match to the true estimation of participants’ vocabulary knowledge, as shown by the interview scores, although slightly on the conservative side.
Yes–No test scores before and after application of the RT approach (Study 1)
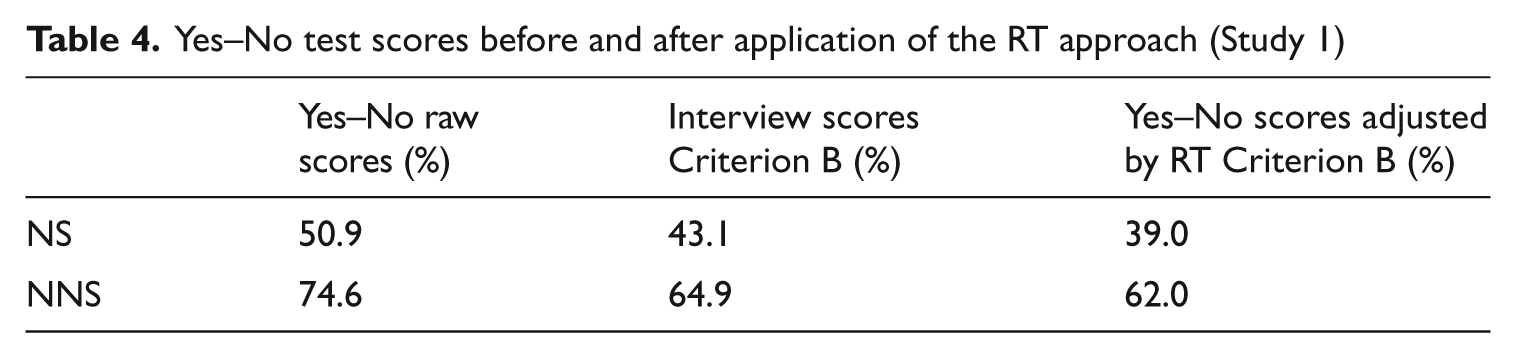
In sum, this study provides promising results for the effectiveness of the RT approach as a way of establishing a threshold between accurate and inaccurate responses in Yes–No tests and of adjusting the scores.
Study 2: A comparison of reaction-time and nonword approaches
Based on the encouraging results of Study 1, the next important question is as follows: Does the RT approach offer any advantage over the previously proposed approaches based on the selection of nonwords? A quasi-replication study was conducted in which both NS and NNS completed a similar version of the Yes–No test which, in this case, included nonwords. The comparison of the different adjustment formulae will provide a clearer account of the advantages offered by the different approaches.
Participants
Participants in Study 2 were 50 English NS (39 female; 11 male) and 55 NNS (30 female; 25 male). NS were second-year undergraduate students at a UK institution, studying English Studies, whereas the NNS were postgraduate students at the same institution, with advanced proficiency and different L1 backgrounds. Results of the language proficiency self-ratings revealed very similar results to the NNS population of Study 1 with means for all four skills above 7 (Max = 10; Min = 4). NS received module credits for their participation in the study, while NNS received an inconvenience allowance.
Materials
Stimuli
The stimuli used were the same as in Study 1 with the only exception that two items (canvass, forfeiture) were replaced by two new items (usurp, aversion) because of the potential difficulty for participants, as revealed by results of Study 1. They were replaced retaining the lexical properties of the original items.
The second difference with the stimuli used in Study 1 was that a set of nonwords was included in the test. A first important issue was deciding on the number of nonwords, since there is no consensus on the percentage of nonwords to include in the test (Beeckmans et al., 2001). The range tends to be from around 25% to 50% nonwords, with recent data obtained by Meara from the Dialang project suggesting that 33% seems to be a good compromise (Beeckmans et al., 2001). Our Yes–No test contained 40 target words, and we ended up with 16 nonwords (29%).
Based on the lack of consensus on the best design method and the inappropriateness of some of the nonwords previously used in Yes–No tests, we conducted a pilot study to check the functioning of 22 nonwords selected from the list developed by Meara and his colleagues (Cobb, n.d.). Ten NS were asked to tick those strings which they thought were real words in English. The use of nonwords which had been ticked by more than one NS was avoided. Eleven nonwords (out of the total 16 nonwords) were not marked by any of the participants, while five were marked by only one participant (see Appendix 2).
Measurement instruments
The tests were also the same as in Study 1. The only difference was that participants were told about the presence of nonwords in the test.
Procedure
The procedure was the same as in Study 1. Interviews were recorded and 10% of them were scored by another rater, with an agreement of 95.5% of the 400 cases inter-scored. Similarly, outliers in the RT data were identified following the same procedure as in Study 1. NS RTs longer than 3500 ms were discarded as outliers. RTs of NNS were considerably slower than in Study 1. Consequently, in order to get a similar percentage of data loss, the threshold for outliers had to be larger for NNS. All values slower than 4500 ms were considered outliers.
Results and discussion
The present design produced different types of scores for comparison: (1) the unadjusted/raw scores from the Yes–No test and the interviews; (2) the adjusted scores using the nonword adjustment formulae; and (3) the adjusted scores using the RT approach presented in Study 1.
Calculating test scores
Yes–No tests and interviews were scored following the same system as in Study 1 (Table 5). The results show the same pattern as in Study 1. First, NNS scores were higher than NS scores because of the difference in target words. Second, if we followed Criterion A, Yes–No test scores for NS would underestimate their knowledge, whereas for NNS it would be a very close match. However, if we follow Criterion B, there is a clear overestimation of participants’ knowledge in the Yes–No tests, which implies the need to adjust the scores downwards. Spearman Rank Order correlations showed that, as expected, there was a large, positive, and significant correlation (p = .000). Although the differences are small, for both NS (rho Criterion A = .625; rho Criterion B = .716) and NNS (rho Criterion A = .660; rho Criterion B = .665), Yes–No test and interview scores by Criterion B seem to have a slightly stronger correlation.
Yes–No test and interview mean scores (Study 2)
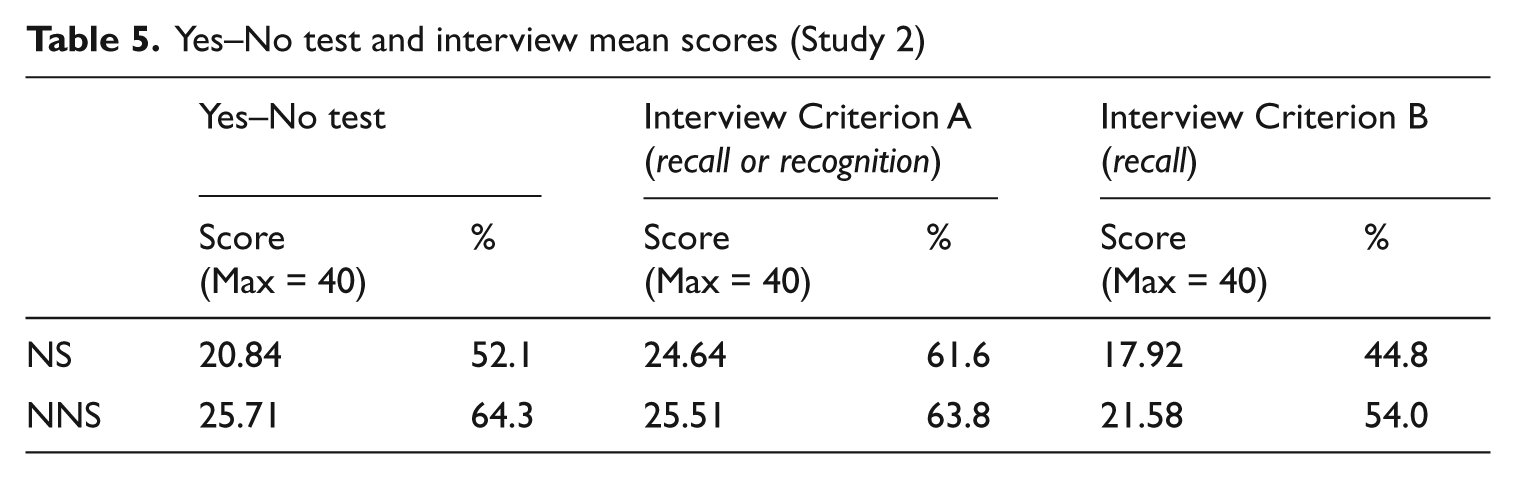
At the individual level, the percentage of participants showing overestimation, that is, higher scores in the Yes–No test than in the interview, and those showing underestimation, that is, lower scores in the Yes–No test than in the interview, was calculated. Results confirmed the group behaviour, showing that, following Criterion A, there is a higher percentage of underestimation for both NS (80% of the participants) and NNS (53%), which, as argued earlier, would question the need of adjusting the scores of the Yes–No test. However, if we follow Criterion B, there is a clear problem of overestimation for both populations (NS = 84%; NNS = 82%).
For the reasons explained in the previous section, interviews scored following Criterion B were used as our baseline of lexical knowledge. Consequently, Yes–No test scores would need to be adjusted downwards to interview scores.
Adjusting the scores: Nonword approaches
In order to explore the behaviour of the different nonword adjustment formulae, the first step was to check participants’ FA rate. Only 12 participants out of the total 50 NS (23.53%) selected some of the nonwords included in the Yes–No test, with 10 out of those 12 participants choosing only one nonword and two participants choosing two words. NNS showed a higher FA rate, but it was still low. This may suggest that the selection of nonwords may increase as proficiency level decreases. Nineteen out of the total 55 NNS (34.55%) selected some of the nonwords included in the test. The majority of these participants (N = 9) only selected one nonword; three participants selected two nonwords; four participants selected three; two participants selected four nonwords; and one participant selected eight nonwords.
The rationale behind the inclusion of nonwords in the Yes–No test is that if testees select many of these strings, they are not being careful in their judgements and scores need to be adjusted. A low FA rate would imply a more careful and honest response style and consequently a more accurate representation of actual vocabulary knowledge. However, in this study, the absence of FA does not imply the absolute lack of overestimation. In fact, around 80% (NS = 78.95%; NNS = 80.56%) of those participants who had not selected any of the nonwords in the Yes–No test still showed overestimation, as shown by the interview responses. This is a crucial issue and questions the use of nonwords in Yes–No tests. If the purpose of including nonwords is to control for overestimation, but there is still overestimation in participants’ responses even when they did not select any nonwords, this questions the effectiveness of the whole nonword approach.
Among the different adjustment methods that have been previously proposed, four adjustment formulae were compared: (1) H – FA; (2) cfg; (3) Δm; (4) Isdt.. Yes–No test scores were again calculated using these four adjustment formulae.
Adjusting the scores: The RT approach
In order to apply the RT approach to the scores, a necessary requirement was that the relationship between RT and accuracy of responses had to present the same pattern as in Study 1. Results successfully showed that NS and NNS ‘yes’ responses were significantly faster (p = .000) when they were accurate (NS: M = 695 ms, SD = 286 ms; NNS: M = 899 ms, SD = 490 ms) than when they were inaccurate (NS: M = 1108 ms, SD = 454 ms; NNS: M = 1427 ms, SD = 701 ms). As in Study 1, this difference still appeared when analysing results by item frequency.
The group RT means were then used to calculate the general thresholds, following the same procedure as in Study 1 (NS ≈ M (775.37) + 0.92 × SD (363.60); NNS ≈ M(1002.79) + 0.7 × SD (577.27). These general thresholds were then used to calculate the individual cut-point values which would be later used to discard those responses falling below that RT threshold and the consequent recalculation of Yes–No test scores.
Nonword vs. RT approaches
The first way of exploring the effectiveness of the adjustment approaches is to compare the group behaviour as shown in the mean scores (Table 6).
Mean adjusted scores (%) by approach (Study 2)

To judge the effectiveness of the different approaches, the scores need to be compared with our baseline, that is, interview scores (Criterion B). Table 6 shows that, in terms of group mean values, the RT approach provides the closest absolute match to the interview scores for NS, and about the same as Δm for NNS. All nonword adjustment formulae provide scores which are too high to some degree, not solving the problem of overestimation of participants’ lexical knowledge. The Δm formula provides the lowest scores while the Isdt formula yields the highest. These patterns are consistent for both NS and NNS. These group figures point towards the advantage of the RT approach over the more traditional nonword scoring methodologies, especially if we would prefer slight underestimation to slight overestimation (in the case of Δm for NNS). Interestingly, the Δm formula provides the best match of all the nonword formulae. This formula, which has been criticized for being an overly conservative approach, turns out to be the best estimate when compared to a very accurate baseline of actual vocabulary knowledge.
A second way of comparing the effectiveness of the approaches is by correlation analyses between the interview score and the adjusted scores (Table 7).
Correlations between interview scores and adjusted scores
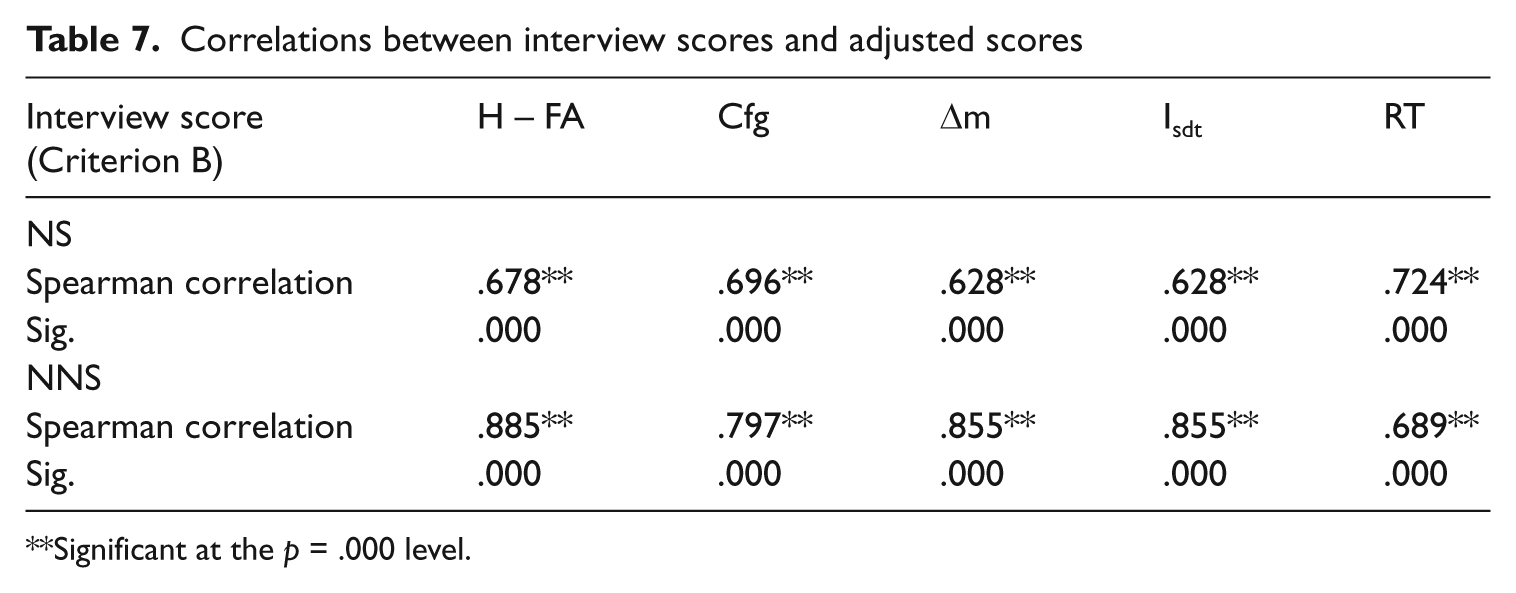
Significant at the p = .000 level.
As expected, all the different approaches provide a positive, large, and significant correlation between the adjusted scores and the interview scores. However, if comparing the strength of the correlations, there is no clear pattern. For NS the correlations for the RT-adjusted scores seem to be slightly stronger. For NNS, the size of the correlation does not show any advantage for the RT approach, with nonword approaches providing slightly stronger correlations. However, the differences among the strength of the correlation coefficients are too small to make any strong claims about the effectiveness of one approach over another. To further investigate any advantage/disadvantage for the RT approach, Fisher r-to-z transformations were run to assess the significance of the difference between correlation coefficients (Table 8).
Significance between correlation coefficients
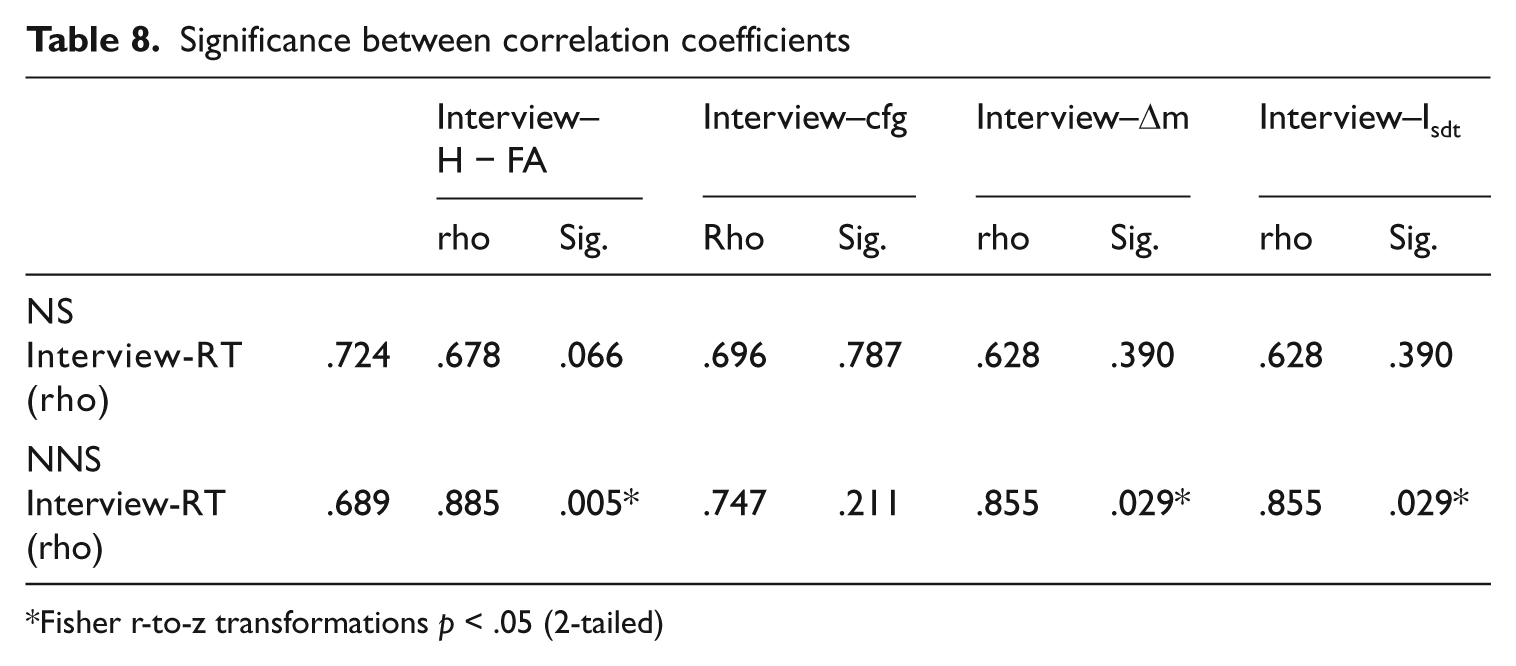
Fisher r-to-z transformations p < .05 (2-tailed)
Results in Table 8 show that there is no significant difference between the higher RT correlation with the interview scores and the lower nonword correlations, indicating no advantage for the RT approach for NS. For NNS though, the correlation coefficient for the Interview–RT results is significantly lower than those for Interview–H − FA, the Interview–Δm, and Interview–Isdt, although there were no significant differences between these three nonword coefficients when compared to each other. This suggests that these three nonword approaches, that is, H − FA, Δm, and Isdt, might provide a somewhat closer match to real vocabulary knowledge than the RT approach.
A third way of examining the effectiveness of the adjusted scores is by looking at the individual patterns. Individual results were examined to determine which approach provided the most accurate results according to the interview scores. This analysis took each individual’s FA rate into account (Table 9).
Best adjustment formula by individual result and FA rate
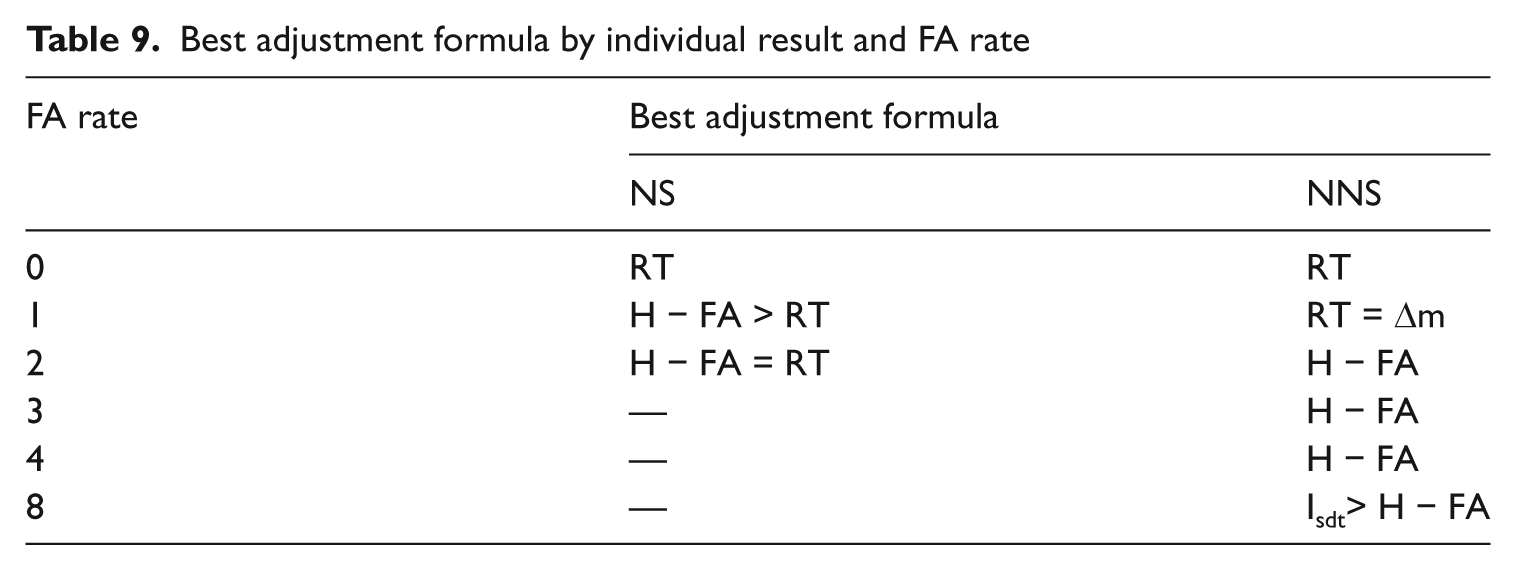
When NS and NNS did not select any of the included nonwords, then the RT approach was clearly best. This is not surprising since the application of nonword approaches on the scores of participants whose FA rate was 0 meant that scores remained unchanged. One exception to this was the Isdt formula that, for some reason, inflated the scores, producing an upwards adjustment in the scores. This finding of Isdt scores being too high, even higher than the Yes–No test score, has been found in other previous studies. Mochida and Harrington’s (2006) study, for example, showed that for the 10k level, the proportion for the Isdt was higher than the proportion of hits.
As the FA rate increases, the pattern stops being so homogeneous. With a FA rate of 1, the best approach for NS seem to be the H − FA formula, followed, very closely, by the RT approach. Again scores from the Isdtformula were too high and Δm seems to be too conservative, producing scores which are lower than the interview scores. In the case of NNS, the effectiveness of the RT approach and the Δm seem to be equally good, followed by the H − FA calculation, with the rest of nonword formulae producing overly high scores.
Raising the FA rate to 2, both the H − FA and the RT approaches seem to function equally well for NS. For one out of the two NS who showed this FA rate both of these two approaches produced the perfect match to the interview score. For the other participant, the RT approach produced an exact match whereas the rest of adjustments were too conservative, considerably lowering the scores. However, both these and the FA=1 results above must be seen as very tentative, as there is very little NS nonword data to work with. For NNS, the best adjustment method seems to be the H − FA formula, followed by RT. Δm again provided scores which were too low.
When the NNS FA rate increased to 3 or 4, the H − FA formula produced the most accurate score for the majority of cases. Finally, for the single NNS participant whose FA rate was 8, the best approach was Isdt formula, followed by the H − FA calculation.
Another important factor affecting the effectiveness of the adjustment approaches is the size of participants’ overestimation, that is, the size of the difference between the Yes–No test score and the interview score. The best adjustment methodology therefore seems to be determined by a combination of participants’ FA rate and the size of their overestimation, or whether they are underestimating or overestimating their knowledge. A closer look at the individual patterns by the combination of these two factors suggests that when the FA rate is 0 and there is a clear overestimation, that is, a clear mismatch between the Yes–No test score and the interview score, then the RT approach seems to be the best scoring method. In contrast, when there is a very close or equal correspondence between the Yes–No test score and the interview score, that is, participants are accurate in their Yes–No test responses, then the RT approach is no longer the best scoring system. In this case, any of the nonword approaches is better because they do not necessarily entail the application of an adjustment, whereas the application of the RT approach, not being based on the selection of nonwords, always implements some sort of adjustment. As the FA rate starts to increase, the RT approach loses its effectiveness in favour of some of the nonword approaches, because of being too conservative. Surprisingly, in cases where participants were clearly underestimating their knowledge in the Yes–No test, the Isdt formula seems to provide the best scores, since, as noted earlier, the calculation behind this formula seems to inflate the scores, producing higher scores that in this case would be appropriate.
There also seems to be a connection between the number of nonwords selected (FA rate) and the size of the difference between the Yes–No test score and the interview score. Spearman Rank Order correlation analyses showed that for NS this relationship was not significant (rho = .009; p = .951), which might be explained by the low FA rate of NS. However, for NNS, there was a positive, strong correlation (rho = .652; p = .000) between the number of FA and the difference between the Yes–No test and interview scores. This finding is not surprising since it makes sense to believe that the more someone is overestimating his or her knowledge of the words being assessed, the greater the chances that he or she is doing the same with the nonwords. The higher the FA rate, the more overestimation, and the larger the amount of ‘adjusting’ that needs to be done, at which point the RT approach stops being as effective.
In the end, there seems to be no clear winner in this comparison. The effectiveness of these adjusting approaches seems to depend on both the FA rate and the size of participants’ overestimation. When the FA rate is 0 and there is a clear overestimation of words known in the Yes–No test then the RT approach provides the best adjustment, for both NS and NNS. As the FA rate increases, the effectiveness of the RT approach seems to decrease in favour of the simpler H − FA nonword formula, in line with previous research findings. Similarly, when the size of the overestimation is very small or there is an equal correspondence between the Yes–No test score and the interview score, the RT approach seems to be too conservative, by producing scores which are ‘overly-adjusted’.
In sum, group mean scores showed that the RT approach provided the best absolute match to the true estimate of vocabulary knowledge. However, correlation analyses provided some conflicting evidence by suggesting the superiority of three of the nonword approaches. Moreover, when looking at the individual patterns, the RT approach seems to be a more effective approach when the FA rate is 0 or very low. As the FA rate increases and the size of overestimation is very small or non-existent, then the RT method loses effectiveness, in favour of the H − FA adjustment formula. However, this study also showed a generally low rate of nonword selection, and to the extent that this is generalizable, this would seem to strengthen the case for the RT approach.
General discussion
These studies are, to our knowledge, the first ones to explore Yes–No tests using a direct and accurate measure of knowledge of the target words, in this case time-consuming personal interviews. As such, they should provide some of the best descriptions of the behaviour of the Yes–No test format to date. The combined studies produced three main results. First, previous researchers have tried to find one method that would be suitable for all testees and all testing situations. The mixed results from our comparisons suggest the difficulty of finding a single universal adjustment approach. This might imply the need to have more than one adjustment formula available, with the appropriate one chosen for each individual testee depending on his or her behaviour, such as the FA rate and degree of overestimation.
Second, our demonstration that there can be considerable overestimation even when the FA rate is 0 seriously questions the validity of the nonword approach as it has been traditionally applied. The assumption has been that well-constructed nonwords should be as plausible as unknown real words, and so there should be an equal chance of ticking either if a testee is not being careful in his or her judgements. However, our research shows that this may not be true.
Third, the main purpose of these studies was to evaluate the viability of a RT approach to score adjustment. The results show it is promising, especially for use with individuals with low FA rates. However, it is less effective with higher FA rates.
These combined results seem to suggest an adjustment approach which combines the power of both nonword and RT techniques. Yes–No tests are increasingly being administered electronically, and this opens the door to involving RT results in the scoring procedure. This leads us to envision a electronic Yes–No test with nonwords. A computer could tally the number of FAs each examinee produced. If the number is zero or one, the RT adjustment would automatically be applied for that examinee. This would address the issue of overestimation even when zero nonwords were ticked. If the number of FAs were 2–7, then the H − FA adjustment formula would automatically be applied. If the FA rate was 8 or higher, then the Isdt formula would be applied. It should not be difficult to program a computer to carry out these calculations behind the scenes and simply produce a total vocabulary size figure for the end user, so there are few practicality issues to detract from this approach. Of course, it would take some experimentation to fine-tune the FA boundaries where the different adjustment approaches would kick in, and indeed whether the overall approach is viable or not. But it would be very interesting to see whether such an approach produces more valid results than the nonword formulae currently in use.
The results reported in this paper are influenced by two main limitations. First, the NNS in these studies were advanced learners, therefore showing a very similar pattern to the NS results. Second, and as a direct consequence of this first consideration, the FA rate in Study 2 was lower than desired. Further research with learners of lower proficiency needs to be conducted to determine whether their response behaviour is similar to that of our more advanced learners.
Conclusion
Further research should be conducted before making a conclusive and well-informed decision about Yes–No test performance and the best adjustment methodology. However, the results presented in this paper constitute a positive step forward in the evaluation and implementation of the Yes–No test as a standard measure of vocabulary size, along with the use of measures of RT as part of a standardized adjustment methodology.
Footnotes
Appendix 3: Example of multiple-choice items
Appendix 1:
Target word length and word class distribution
| NS No. of items | NNS No. of items | |
|---|---|---|
| Length | ||
| 1 syllable | 2 | 21 |
| 2 syllables | 18 | 91 |
| 3 syllables | 14 | 5 |
| 4 syllables | 5 | 3 |
| 5 syllables | 1 | 1 |
| Word class | ||
| Nouns | 18 | 17 |
| Adjectives | 11 | 13 |
| Verbs | 11 | 10 |
Appendix 2:
Items used in Yes–No test
| Word | BNC frequency | Nonwords c |
|---|---|---|
| 1. office | 24794 | 1. acklon |
| 2. problem | 28559 | 2. aistrope |
| 3. little | 51928 | 3. haque |
| 4. book | 24388 | 4. humberoid |
| 5. job | 22209 | 5. pring |
| 6. effect | 23147 | 6. hoult |
| 7. agreement | 13229 | 7. bodelate |
| 8. effort | 7576 | 8. bance |
| 9. behaviour | 12151 | 9. horobin |
| 10. purpose | 9209 | 10. litholect |
| 11. augment | 155 | 11. rudge |
| 12. calibrate | 30 | 12. scudamore |
| 13. canvass | 96 | 13. twose |
| 14. cogent | 85 | 14. berrow |
| 15. conducive | 290 | 15. cambule |
| 16. incongruity | 65 | 16. quorant |
| 17. insulate | 108 | |
| 18. invigorate | 16 | |
| 19. portentous | 48 | |
| 20. onerous | 240 | |
| 21. adroit | 34 | |
| 22. edict | 96 | |
| 23. evince | 22 | |
| 24. expedite | 56 | |
| 25. extant | 231 | |
| 26. forfeiture | 154 | |
| 27. imperil | 27 | |
| 28. multifarious | 56 | |
| 29. diaphanous | 19 | |
| 30. abet | 17 | |
| 31. heuristic a | 94 | |
| 32. confabulate a | 1 | |
| 33. abrade a | 9 | |
| 34. badinage a | 18 | |
| 35. dashpot a | 12 | |
| 36. macaronic a | 1 | |
| 37. naevus a | 15 | |
| 38. pabulum a | 5 | |
| 39. saccade a | 4 | |
| 40. talipot a | 1 | |
| 31. relief b | 6421 | |
| 32. profit b | 5884 | |
| 33. crucial b | 4402 | |
| 34. reluctant b | 1956 | |
| 35. accurate b | 1887 | |
| 36. investor b | 830 | |
| 37. enhance b | 1412 | |
| 38. negligence b | 1273 | |
| 39. hazardous b | 714 | |
| 40. threshold b | 978 |
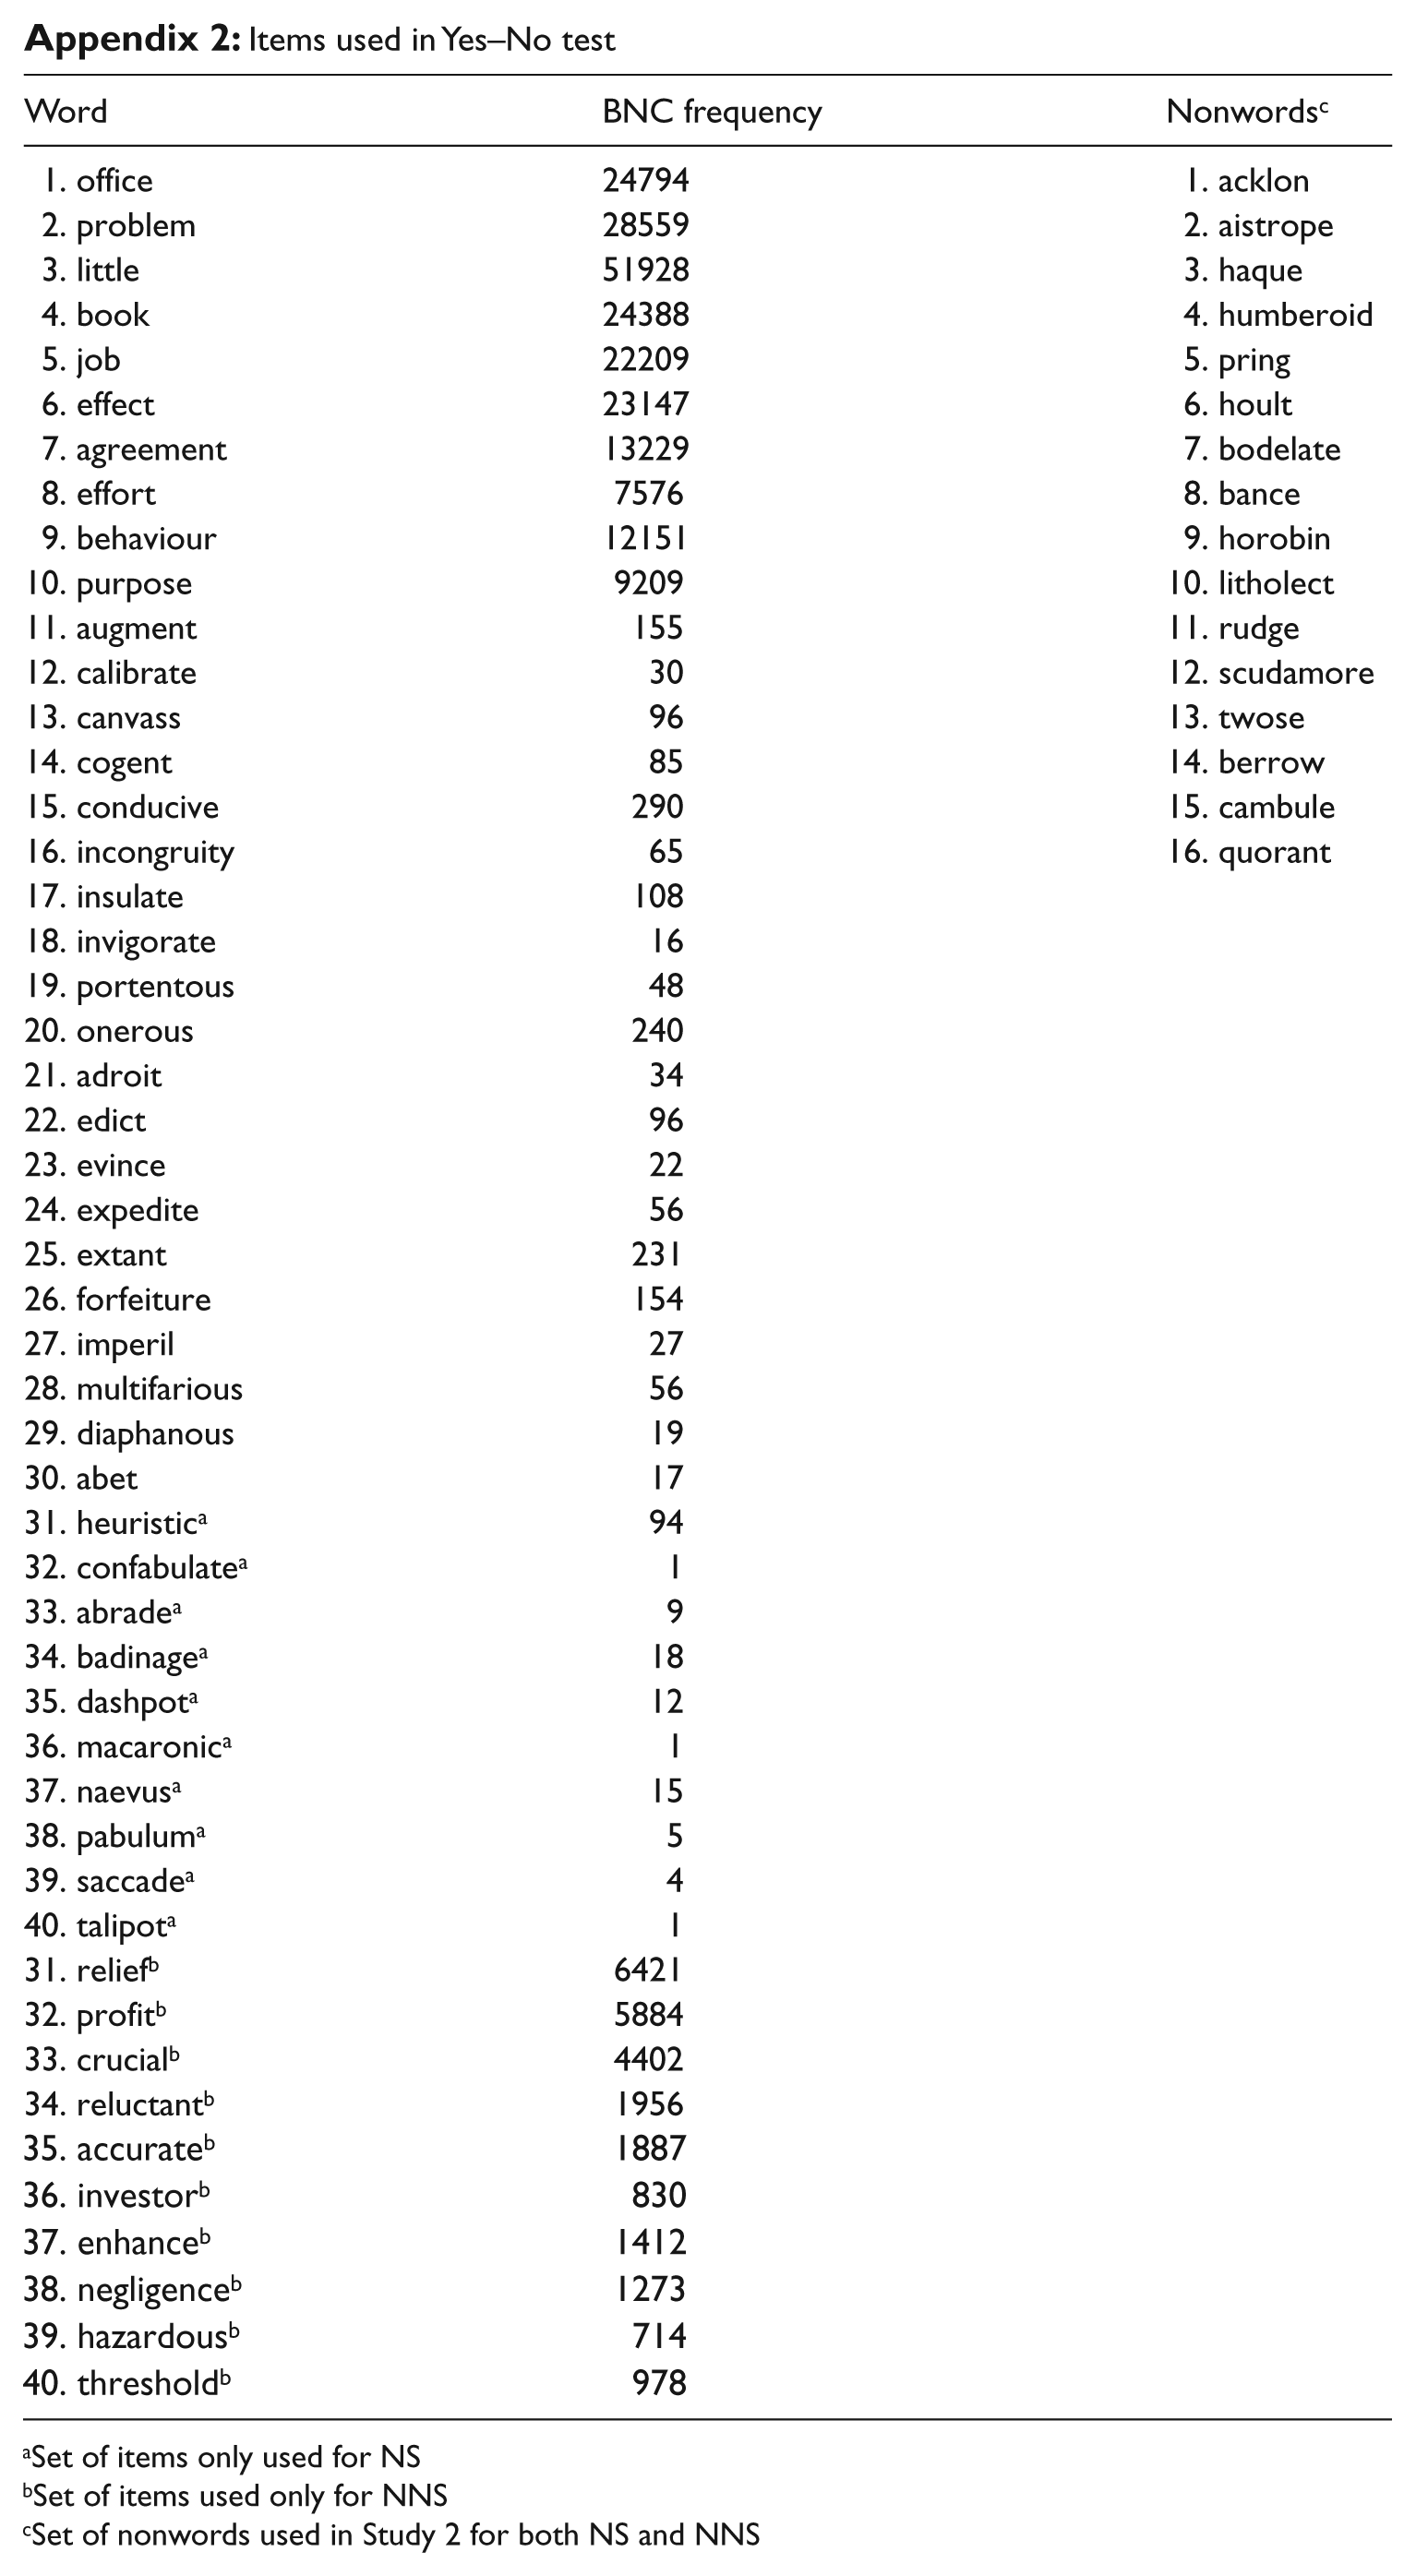
Set of items only used for NS
Set of items used only for NNS
Set of nonwords used in Study 2 for both NS and NNS
Notes
References
Supplementary Material
Please find the following supplemental material available below.
For Open Access articles published under a Creative Commons License, all supplemental material carries the same license as the article it is associated with.
For non-Open Access articles published, all supplemental material carries a non-exclusive license, and permission requests for re-use of supplemental material or any part of supplemental material shall be sent directly to the copyright owner as specified in the copyright notice associated with the article.
