
Abstract
This study introduces Expectancy-value motivation theory to explain the paths of influences from perceptions of test design and uses to test preparation as a special case of washback on learning. Based on this theory, two conceptual models were proposed and tested via Structural Equation Modeling. Data collection involved over 870 test takers of College English Test Band 4 in China. A perception of assessment questionnaire was given at the beginning of a 10-week preparation period; a test preparation questionnaire was given eight weeks later. Test takers who endorsed high-stakes, instrumental test uses as the primary purpose for taking the test tended to value test taking; test takers who perceived test design positively tended to attach high importance to test taking and appeared more confident. Furthermore, higher endorsed task value and higher expectation of test success jointly contributed to greater engagement in test preparation. Knowledge of the test was also related to increased self-regulation in test preparation and more practice of test-taking skills.
Keywords
Introduction
Washback or backwash, a term widely used in language testing and applied linguistics, refers to the influence of testing on teaching and learning. Although the number of studies on washback have increased considerably since the seminal work of Alderson and Wall (1993), it is still not clear precisely how testing influences teaching and learning. Many studies on washback (e.g. Cheng, 2005; Qi, 2005) are triggered by concerns about the negative influence of testing on teaching and learning, such as teaching and learning to the test and excessive practice of test papers, which lead to narrowing of the curriculum and downplaying the goal of improving language ability.
Some educators and critics believe the source of negative washback is standardized testing, especially the Multiple Choice test format. Some testers, however, argue that test design does not affect the nature of washback; it is the misuse or abuse of test results that triggers negative washback. Despite heated debates in language testing, we are not aware of any study that has actually examined the effects of test design and test use in order to better understand influences of testing on teaching and learning. Although multiple factors have been identified that affect the nature and scope of washback, there is little agreement regarding the differential effects of test design and test uses. It is still not clear how these factors work together, which ones are more salient, or in what ways test design and test uses influence teaching and learning.
Many reasons account for the current state of research on washback. One is methodological. Most existing washback studies are primarily qualitative and exploratory (e.g. Alderson & Hamp-Lyons, 1996; Cheng, 2005). These studies have identified multiple factors contributing to the washback phenomenon, yet they do not assess the relations among these factors statistically. Thus, there is a need for quantitative studies of these mediating factors to examine the relationships between them. Another reason is the lack of an appropriate theory to guide statistical examination of the relationships among the numerous factors identified. Without a sound theory, statistical modeling is data driven and post hoc, and therefore prone to error.
In light of the state of research on washback, the present study sets out to examine this phenomenon quantitatively via the guidance of an established theory. Expectancy-value motivation theory is taken from learning psychology as a way to interpret the mechanism of washback on learning during test preparation. A model of washback on learning is conceptualized on the basis of this theory and verified statistically via Structural Equation Modeling.
Test design vs. test use
A central issue in the debate regarding the influence of test design and use on teaching and learning concerns the source of adverse consequences and the parties to be held accountable. Testers argue that tests are neutral measurement tools and therefore harmless. Adverse consequences (i.e. negative washback in different forms) are primarily a function of test misuse and abuse; therefore, the (mis)users should be held responsible. Shohamy (2001), for instance, argues that a test is powerful not because of its technical strength but because of the social and/or political functions that tests are used to perform. Messick (1998) makes a similar point, ‘Test makers are not responsible for the consequences of test misuse’ (p. 40). Jin (2006) comments in the context of College English Test Band 4 (hereafter CET4) in China: ‘Misunderstanding and misuses of the test have caused some negative impact on teaching and learning’ (p. 72).
Educators and critics, however, believe there is a connection between the way a test is designed, and the way teachers teach and students learn. They criticize standardized testing for promoting exam-driven, superficial learning approaches, and demand reform of the assessment system (e.g. Entwistle & Entwistle, 1992; Fredericksen & Collins, 1989; Frederiksen, 1984). One central criticism of standardized testing focuses on its dominant use of Multiple Choice Questions (MCQ). Educators believe MCQ tend to assess knowledge-based memorization and factual recall, but not complex, high-level thinking skills (e.g. Fulcher, 2000; Scouller, 1998). Because deep learners may perform more poorly on MCQ-based examinations than surface, rote learners (e.g. Scouller, 1998), opponents argue that standardized testing discourages the teaching and learning of high-level cognitive skills. Based on these educational considerations, Fredericksen and Collins (1989) argue that test validation should incorporate an examination of its consequences. Accordingly, if a test fails to induce positive washback, it is not systematically valid.
Despite these debates, no consensus has yet been reached regarding the differential effects of test design and use on learning. Although each side has evidence to support its stand, no empirical studies have been conducted to tease out the effects of test design from those of test use by examining both simultaneously within one model. If test design and test uses do affect the teaching and learning that precede testing, it is likely that their influences follow different paths.
Washback mechanism: The black box
Most existing washback studies are primarily qualitative and exploratory (e.g. Alderson & Hamp-Lyons, 1996; Alderson & Wall, 1993; Andrews, Fullilove, & Wong, 2002; Cheng, 2005; Gosa, 2004; Wall & Alderson, 1993; Watanabe, 1996). Many focus on teachers and teaching; few focus on learners and learning. Existing studies have found washback to be highly complex, with contextual factors and personal factors all playing a role in shaping its nature and scope (e.g. Wall & Alderson, 1993). Within classrooms, teacher factors are found to be pivotal (Alderson & Hamp-Lyons, 1996; Qi, 2005). In a given educational setting, contextual factors and individual factors interact and largely determine both the kind and amount of washback that occurs. However, it is still not clear in what ways these factors combine and interact with each other.
Compared with washback on teachers and teaching, studies on learners and learning are scarce. Only a few empirical studies of washback have focused on learning and learners. For example, in Gosa’s (2004) study in Romania, she found students’ expectation of assessment was the single most important factor in explaining students’ perspectives on teaching and learning activities. The students’ expectation of assessment not only influenced their attitudes towards teaching, but also their own learning. Nine out of the 10 diarists in the study did not prepare for the test at all because of their expectation that the test was easy. Similarly, Green (2007) compared an IELTS preparation course with university language courses. He concluded that individual learners’ goals and their ‘understanding of test demand’ (p. 93) influenced their learning outcomes to a greater extent than their choice of course and its content. Although the precise nature and process of washback on learning are still unclear, studies from learning psychology (cf. Struyven, Dochy, & Janssens, 2005) suggest that students coordinate their strategy use with their expectations of assessment demands.
Expectancy-value theory
In the area of learning psychology, effects of test expectation on learning are studied within the Expectancy-value motivation framework. Expectancy-value theory posits that ‘Individuals’ choice, persistence, and performance can be explained by their beliefs about how well they will do on the activity and the extent to which they value the activity’ (Wigfield & Eccles, 2000, p. 68). The full model for Expectancy-value theory is presented in Figure 1. This model (Jacobs & Eccles, 2000) is developed for the academic context on the basis of Atkinson’s (1964) Expectancy-value theory. Elaboration of the full model is beyond the scope of this paper. Of interest to this study are the four cells on the right-hand side of the full model. Expectation of success and Subjective task value are believed to be two crucial motivational factors jointly mediating the effects of a child’s goals and general self-schemata on achievement-related choices and performances. Personal short-term and long-term goals and perceptions of task demand are three of the six factors under Child’s Goals and General Self-schemata, which are believed to influence expectation of success and task evaluation, and which, in turn, affect Achievement-Related Choices and Performance.
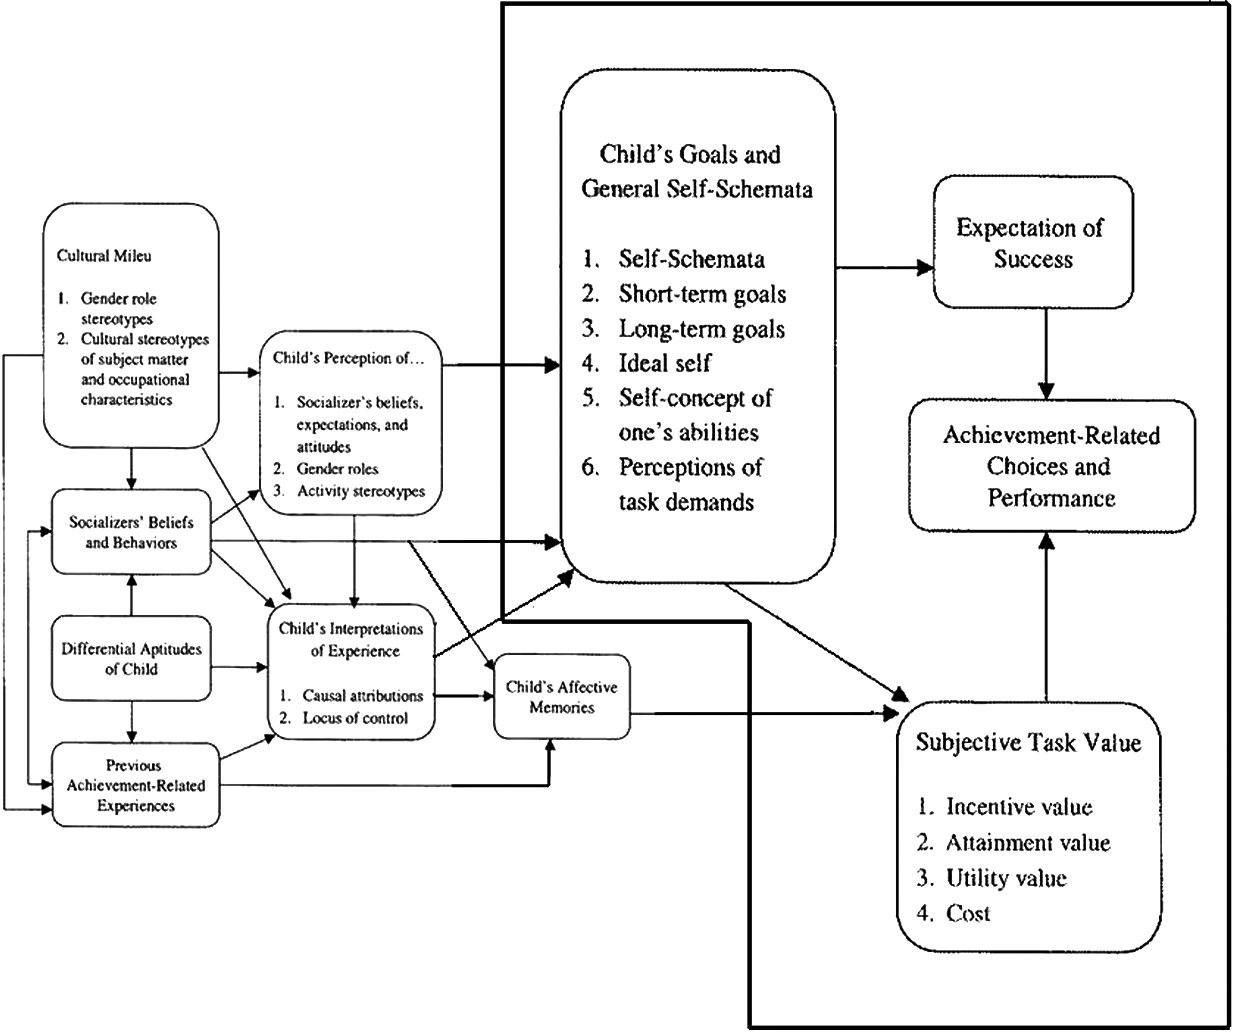
Expectancy-value motivation theory from Jacobs and Eccles (2000, p. 407)
Expectancy-value theory posits that when facing a task and making related choices, students ask themselves two questions: ‘Do I want to do it?’ and ‘Can I do it?’ (Eccles & Wigfield, 2002). If they answer ‘yes’ to both, then they are more likely to engage in the task and perform well on it. Students’ answers to these two questions are believed to be affected by their personal goals and perceptions of task demands.
Expectation of success refers to individuals’ beliefs about how well they will do on upcoming tasks. In an academic context, this refers to students’ beliefs about their capability to conduct a given academic task successfully (Schunk, 1991). From the student perspective, this is analogous to answering the question ‘Can I do it?’ Expectation of success is closely related to the construct of self-efficacy (Bandura, 1982). Conceptually, self-efficacy stresses individual confidence towards the task, while the expectation construct in Expectancy-value theory stresses the expectation of outcomes. Empirically, these two constructs are closely related. In its operational form, expectation of success is often measured analogously to self-efficacy. Subjective task value is the extent to which individuals value the upcoming task as desirable. From the student perspective, the construct of task value is analogous to answering the question ‘Do I want to do it?’ Task value is operationalized in terms of attainment value, intrinsic interest, utility value, and costs (Jacobs & Eccles, 2000).
Numerous empirical studies have been conducted in connection with Expectancy-value theory and the key related constructs (e.g. Bandura, 1982; Bong, 2001; Pajares, 1996; Pintrich, 1999; Wigfield, 1994). Most of these have focused on the effects of goals and self-efficacy on academic achievement. Fewer studies examine their effects on learning. Pintrich and his colleagues are the most noted group focusing on learning and strategy use. Their studies (e.g. Pintrich, 1999, 2000) found that students’ self-efficacy and values consistently related positively to strategy use.
Conceptual models of washback on learning
The analogy between students facing an academic task and facing a test-taking challenge is straightforward. Preparation for test taking can be regarded as a special instance of learning, which is likely to be affected by test takers’ expectancy of success and the values attached to success. Expectation of success and test value can be two useful factors for explaining the paths of influence from testing to preparation. From this perspective, preparation for test taking, as a special case of washback on learning, can be understood as test takers’ learning behaviors directed by personal goals and in response to perceived cognitive and situational demands. It is conceivable that test takers’ perceptions of test demands may affect their judgment and expectation of success. Similarly, perceived test uses are likely to serve as short-term goals, which are likely to affect test takers’ evaluation of test importance.
The Jacobs and Eccles model (2000), however, is ambiguous as to the exact paths of influence from goals and perceptions to the two motivation factors: Value and Expectancy. It is not clear whether the former affect both or just one of the latter. Elsewhere (e.g. Eccles et al., 1983; Wigfield, 1994), goals are discussed in association with task evaluation, and perception of task demand is often associated with expectation of success or efficacy beliefs. Because of the theoretical ambiguity, two competing models are specified for statistical modeling, explaining the paths from testing to preparation with slight differences.
Model 1 (Figure 2 without the two dashed lines) hypothesizes that the two perception factors influence preparation entirely via the two motivation factors – Expectancy and Value – as posited by the theory. Model 2 (Figure 2) hypothesizes the same relationships between perceptions and preparation, but two additional direct paths (the dashed lines in Figure 2) are added. Meanwhile, both Model 1 and Model 2 recognize a positive correlation between the two factors (the double arrowed line), as noted by Eccles and Wigfield (2002).

Conceptual model 1 & 2
Specifically, test takers’ perceptions of test design are defined as the language skills they perceive as necessary for test taking (labeled as P-test design). Test takers’ perceptions of test uses are defined as the degree to which they endorse high-stakes, instrumental test uses as their primary motive to take the test (labeled as P-test uses). Perception of language skills is considered a useful indicator of test design because the more test takers agree that they need to use language skills in order to answer test items correctly, the more likely it is that they will endorse the test design (Xie, 2011). Perceived test uses are essentially test takers’ short-term goals in relation to CET4 test taking and the potential uses of test results. Only high-stakes, instrumental test uses were assessed and reported in the present study because they are the focus of interest in the debate regarding test washback.
The present study assessed the above conceptual models to address the following two research questions:
Do test takers’ perceptions of test design and high-stakes test uses influence preparation simultaneously?
If so, in what ways and to what extent do perceived test design and test uses influence preparation?
This section has reviewed the literature relating to washback and Expectancy-value theory, thereby presenting the conceptual models and two research questions. The next section outlines the research method.
Method
General methodological considerations
This study focuses on washback on learning during a special test preparation period prior to test taking. According to Prodromou (1995), washback proceeds on a continuum from covert to overt influence as the date of the test approaches, particularly when the test-taking dates are externally determined and the stakes are high. While washback prior to the preparation period is less observable and hence ‘covert,’ during the preparation period, washback is intensive, observable, and ‘overt.’ Examples of covert washback are the impact of the test syllabus on textbooks, the impact of test results on teacher appraisal, and the impact on students’ views of achievement. Overt washback takes the form of purposeful preparation to maximize performance (e.g. teaching and learning to the test, using test materials, practicing test papers, and drilling test items). Overt washback is the main interest of this study, because it seems to be the most closely related to test design and validity concerns, over which test designers can exert control.
Methodologically, overt washback during test preparation may be the most intense form of washback accessible to observation and measurement. Given that there is little theory within language testing regarding washback mechanisms, overt and intensive washback facilitates the initial exploration of the mechanisms.
At the practical level, the high-stakes nature of the CET4 and the controversies regarding its negative washback made it an excellent case for exploring the theoretical interests of this study. The study was conducted in China with test takers preparing for CET4, a standardized, norm-referenced English proficiency test taken at the end of a two-year College English program by all non-English-major undergraduates. It is a high-stakes test because its results are widely used for university graduation and job application. In recent years, CET4 has received wide criticism for its negative washback on teaching and learning. These criticisms, however, are more often emotionally charged and politically motivated than empirically grounded. There are few empirical studies investigating CET4 washback (e.g. Gu, 2005).
Participants
Participants of this study are from a university in Guangzhou, a large city in southern China. From April to June 2009, over 800 second-year university students who registered to take CET4 took part in this study. This university was selected due to its ranking among the lower tier. The washback from CET4 on teaching and learning is more obvious and intense in lower tier universities because students at these universities tend to have lower levels of English ability and are more likely to fail the test than those at higher tier universities. Because of the high-stakes nature of CET4 and relatively large failure rates, lower tier universities tend to spend more resources on test preparation. It is understandable that CET4 affects these universities more than higher tier ones. The university’s lower tier status made it a highly appropriate choice for observing and studying the mechanisms of washback.
In addition, students’ test preparation for CET4 in this university was homogeneous and intense. Every summer, two months before the CET4 was administered, all regular second-year English classes at the university were suspended to provide additional time for test preparation. Because students were aware of this practice in advance, the majority would not start preparation for the CET4 until this special period commenced. This pedagogic arrangement provided a logistically and ethically convenient context for the present study.
Instrumentation
Two separate questionnaires were created to survey students’ perceptions of assessment and test preparation practices. The two questionnaires were developed from a qualitative study in 2007 and were verified in a pilot study with another sample (N = 157) in 2008. Items with sound psychometric properties were selected and used in the present study. The perception questionnaire measured four major constructs: perception of test design, perception of test uses, expectation of success, and test value.
Perception of test design was measured by asking students about the language skills that they perceived as necessary for answering CET4 (e.g. In order to answer questions on the short-conversation section correctly, I must grasp the gist of the talk). In the construction of this scale, care was taken to map the items back to the official documents of the test (CET4 test syllabus). This was to ensure that all of the intended language skills appeared on the questionnaire, so that the questionnaire would fully represent these skills.
Perception of test uses was measured by asking students to what extent high-stakes test uses were their primary purposes for taking CET4. This scale has three items (α = .673): I take CET4 in order to get CET4 certificate for job seeking; I take CET4 in order to get my degree; I take CET4 in order to get my graduation certificate. 1 These three items refer to the most prevalent, high-stakes uses of CET4 results (Jin, 2006).
Expectation was measured using the self-efficacy scale from the Motivated Strategy Learning Questionnaire (Pintrich, 1991) modified to fit the CET4 context. It comprises five items (α = .884): If I prepare for it in appropriate ways, I believe I will pass CET4; If I try hard enough, I will pass CET4; I think I will do well on the test; Taking consideration of its difficulty and my ability, I think I can pass CET4; I have confidence in doing well on CET4.
The test value scale asks test takers to evaluate the importance of CET4; it has three items (α = .738) incorporating attainment importance, utility value, and intrinsic value of interest: Doing well on CET4 is very important for me; Passing CET4 is useful for my future; Taking CET4 can help me to learn the English language.
Test preparation was defined in terms of students’ self-reported practices during the 10-week test preparation period. It had five scales: test analysis (i.e. assessing test and evaluating oneself); rehearsing test-taking skills; drilling target skills; memorizing; and socio-affective strategies. Appendix A presents examples of the items used to measure perception and test preparation.
Data collection
Data collection started 10 weeks before the June 2009 administration of CET4 with the perception questionnaire given at the beginning of the preparation period. The test preparation questionnaire was given eight weeks later, near the end of the preparation period and about two weeks before the participants took the test.
Data analysis
Data preparation
All items were rated on Likert scales. Items in the perception questionnaire were scored on a 6-point Likert scale of agreement. Items in the Test preparation questionnaire were scored on a 5-point Likert scale of frequency. A 6-point scale was used for the perception questionnaire to avoid a possible skewness problem, which was encountered when the perception questionnaire was piloted. Because a finer scale could detect a wider variance for each item, thereby attenuating the skewness problem, a 6-point scale was used in the present study.
All items were entered into SPSS for data cleaning and preliminary analysis. Missing value analyses were conducted to check missing rates and missing patterns. Expectation Maximization (EM) algorithm was used to impute missing values at the item level (Graham, 2009). Outliers were identified through examining the stem-and-leaf plot, boxplot, and Mahalanobis Distance of each item (Tabachnick & Fidell, 2007). The skewness and kurtosis statistics of all items were examined to check normality assumptions of their distributions. Multivariate normality assumption was checked via Mardia Coefficients of Kurtosis. Mardia coefficient values lower than 3.0 were considered acceptable. After data cleaning and imputation, the data met the normality assumption of multivariate analysis and were ready to be analysed. 888 cases were kept for the perception questionnaire; 872 cases were kept for the test preparation questionnaire.
Item-level exploratory factor analysis (EFA) was conducted to find out whether the items designed to measure one construct indeed loaded together. Based on the EFA results, composite variables were computed by averaging item scores within each factor. Composite variables were used as observable indicators in Confirmatory Factor Analysis. Finally, Structural Equation Modeling (SEM) was used to assess the structural relationships. AMOS7.0 (Arbuckle, 2006) was used for all latent factor modeling.
SEM
SEM is a comprehensive statistical approach to testing theoretical hypotheses about the relationships among observed and latent variables (Hoyle, 1995). The purpose of structural modeling is to verify whether hypothesized relationships among variables are supported by empirical data. Usually, a model is specified a priori according to a substantive theory, common sense, or a hypothesis to be tested. SEM then estimates the discrepancy between the correlation-covariance matrix as implied by the model and the observed correlation-covariance matrix of the empirical data. The discrepancy is measured by Chi-square statistics. The smaller the Chi-square value, the closer the data fit the model. When the fitness is satisfactory, the model is considered to be an approximate representation of the relationships among the variables in the model. It represents one plausible explanation until further evidence falsifies this explanation.
Besides Chi-square statistics, four other indices are often used to measure model fitness: Goodness-of-fit Index (GFI; Jöreskog & Sörbom, 1981), Comparative Fit Index (CFI; Bentler, 1990), Tucker-Lewis Index (TLI; Tucker & Lewis, 1973), and Root Mean Square Error of Approximation (RMSEA; Steiger, 1990). For GFI, CFI, and TLI, values above .90 are considered a good model fit. RMSEA values of .05 or lower are considered to represent a close fit, while values up to .08 represent a reasonable fit.
Mediation analysis
Mediation analysis is one way to explain a chain of relations from a predictor to a dependent variable, or the mechanism by which one factor exerts influences on another. Mediation exists when an antecedent variable affects an outcome variable indirectly through at least one intervening variable, or mediator (MacKinnon, Fairchild, & Fritz, 2007). Mediation analysis is prominent in testing theories regarding process mechanisms. Mediation models may involve one mediator or multiple mediators. The mediation models tested in the present study involve two mediators (i.e. Expectancy and Value) used to explain the paths of influences from test-taker perceptions to test preparation.
For a mediation relation between X and Y where M is the mediator, the standard notation uses a to represent the raw correlation between X and M, b to represent the partial correlation of M to Y adjusted for X, and c’ the relation of X to Y adjusted for M. This study uses four common measures to suggest the overall magnitude of mediation effects. The first is to examine whether the direct path c’ is significantly different from zero (Baron & Kenny, 1986). When the path c’ is not significantly different from zero, it is considered complete or perfect mediation. Otherwise, it is considered partial mediation. Partial mediation indicates the potential to identify additional mediators. The other three commonly used measures of mediation effects are ab, ab/(ab+c’) (Alwin & Hauser, 1975), and β a *β b (Preacher & Kelley, 2011). While ab represents unstandardized measure of indirect effect, β a *β b represents standardized indirect effect. ab/(ab+c’) is also called mediation ratio, which suggests the proportion of mediated effects to the total effects.
Results
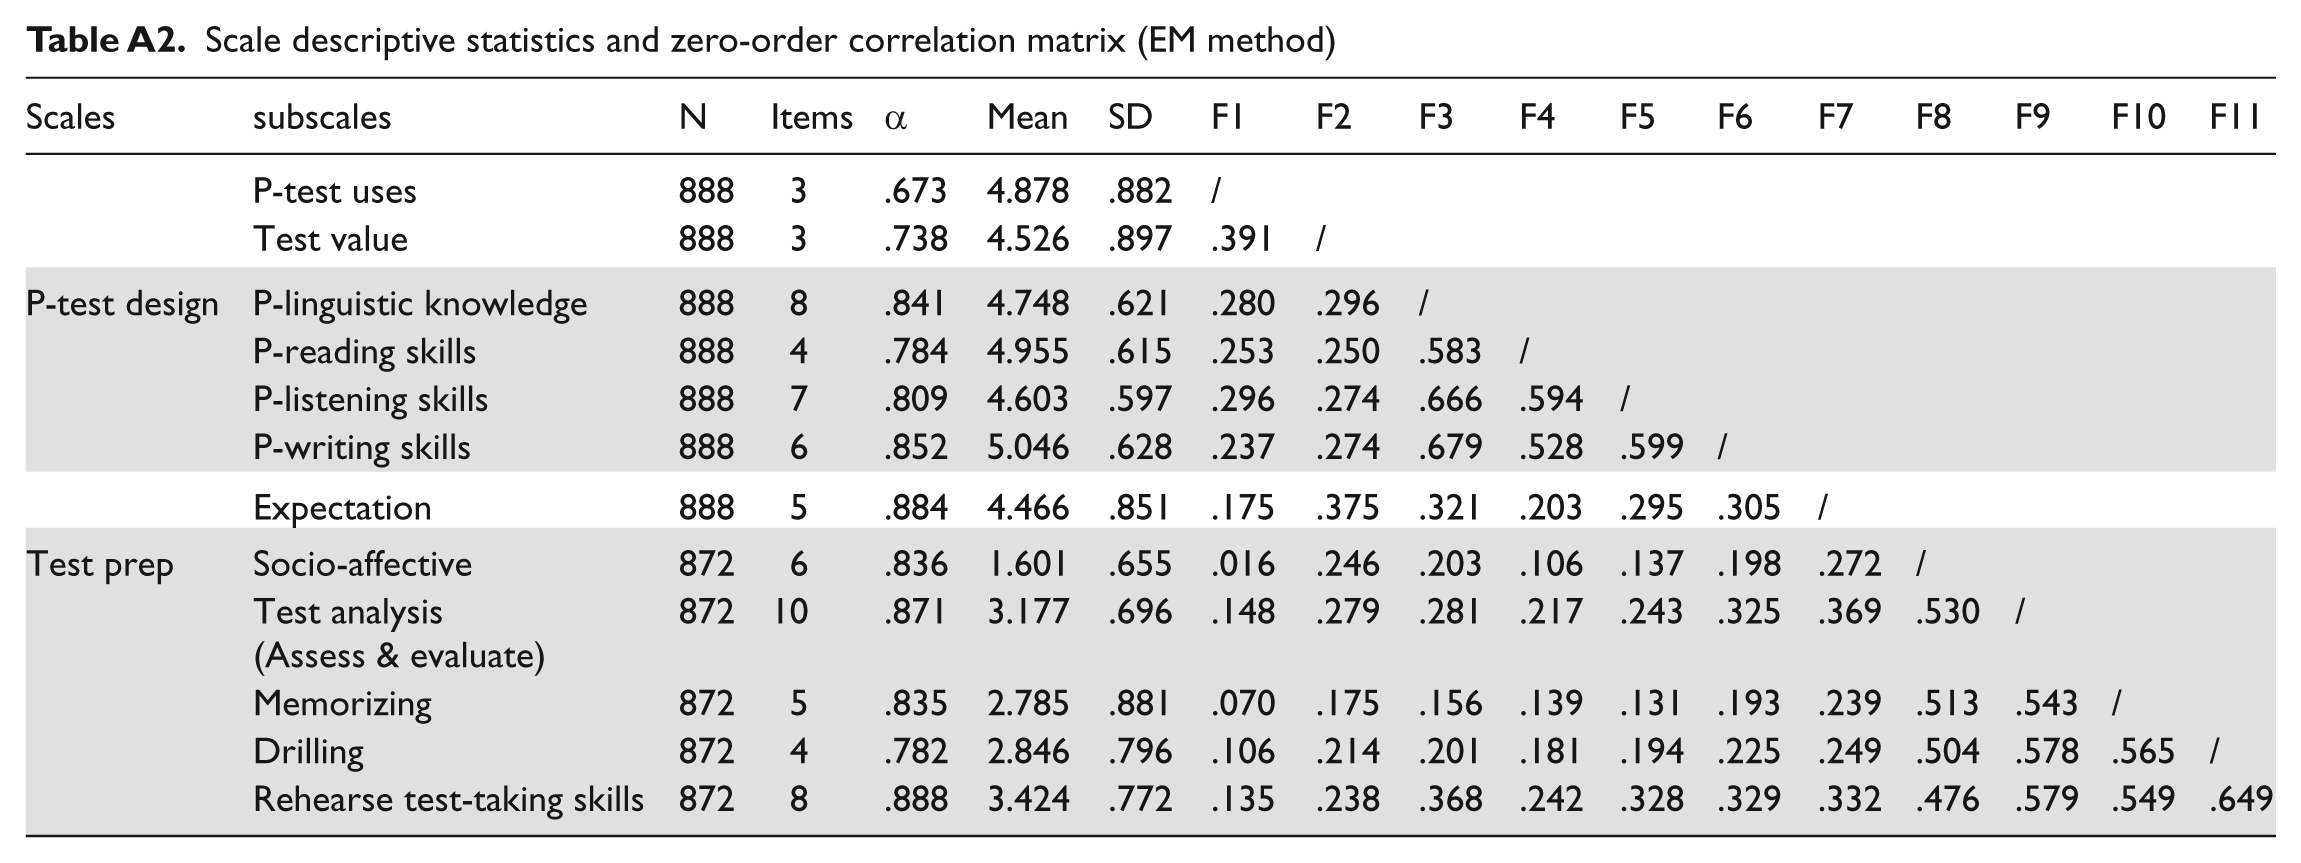
In this section, the results of the data analysis are presented. Because of space limitations, item-level EFA results are not presented; instead, descriptive statistics of subscales and correlation matrix are provided in Appendix B. Interested readers can request further details via the corresponding author’s email.
Measurement model
Confirmatory factor analysis suggests that the two questionnaires have achieved satisfactory reliability and validity. The full measurement model is schematized in Figure 3. Model fit indices for this measurement model suggest that it fits the data satisfactorily (χ2 = 260.46, df = 57, RMSEA = .054, CFI = .958, NFI = .947, TLI = .933). Given a large sample size and a relatively large number of observed indicators (N = 12), the Chi-square statistic is relatively small. RMSEA is .054, and the three comparative model fit indices are all above .90.

Measurement model with standardized coefficients
This measurement model includes five major scales: perception of test design (p-test design), perception of test uses (p-test uses), expectation, test value, and test preparation (Test prep). The p-test design scale has four subscales: perceived test demand for linguistic knowledge, perceived test demand for reading skills, perceived test demand for listening skills, and perceived test demand for writing skills. In this measurement model, the latent factor of p-test design represents the degree of test takers’ positive endorsement of test design. The higher the endorsement of language skills as necessary for test taking, the more the test takers perceived test design as positive. Endorsement of test demand is also indicative of test takers’ knowledge of the test.
The test preparation scale includes five sub-scales representing five types of test preparation practices: using socio-affective strategies to seek external help and to motivate oneself, conducting test analysis via assessing test requirements and evaluating oneself, memorizing vocabulary and model essays, drilling target language skills, and rehearsing test-taking skills. Sample items of the subscales are provided in Appendix A. The latent factor of Test Prep represents the degree of engagement in preparation indicated by coherent uses of various strategies.
Hypothesis testing results
Both hypothesized models fit the data satisfactorily. RMSEA is lower than .05, NFI, CFI, and TLI are above .95. Compared with Model1 (χ2 = 189.50, df = 49, RMSEA = .049, CFI = .969, NFI = .959, TLI = .950), Model 2 (with direct paths) fits the data even better (χ2 = 155.44, df = 47, RMSEA = .044, CFI = .976, NFI = .966, TLI = .960). Because these two models are nested within each other, the Chi-square difference test is appropriate to test which model fits the data better. The result of the Chi-square difference test suggests Model 2 is better than Model 1 (Δχ2 = 34.06, df = 2, p < .001), which further suggests that adding two direct effects from Perception variables to Test preparation significantly improved model fitness. That is, the two mediators can explain only part, but not all, of the influence from Perceptions to Test preparation. Specifically, there is a significant direct effect (β = .26, p < .001) from P-test design to Test Prep, which cannot be explained by the two mediators. Figure 4 presents Model 2 with standardized parameters.
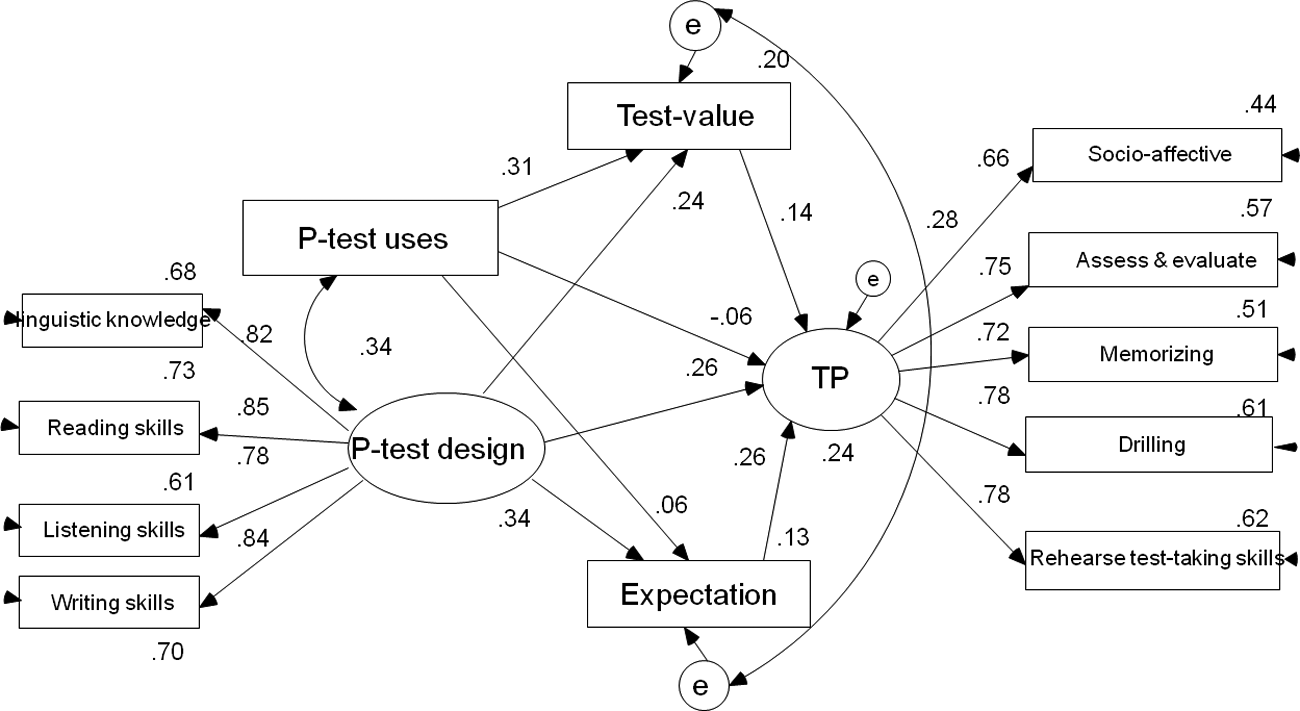
Model 2 with standardized path coefficients and R-squares
Of the four mediation paths tested in Model 2, three paths are significant (see Table 1). Because the path from P-test use to Expectation is not significantly different from zero (β = .055, n.s.), Expectation is not considered to be a useful mediator of the effects of P-test use on Test Prep. Value is considered an important mediator between P-test use and Test Prep. The direct path is not significantly different from zero (c’1 = −.034, n.s.), suggesting a complete mediation. That said, both the unstandardized and the standardized indirect effect measures (ab = .034, β a *β b = .044) suggest that the total mediated effect is small. Moreover, both Expectation and Value are useful mediators for the effects from P-design to TP, though the effects are only partial (c’ = .326, p < .001). Partial mediation suggests there may be other additional mediators between perception of test design and test preparation. The three effect size measures suggest that both the ratios of mediated effects and the magnitude of the effect mediated are small. Compared with the value mediator, the expectation factor explains more effects from P-design to TP.
Effect size of mediation effects

Post-hoc analysis: Differential effects of perceptions on test preparation practices
Finally, a post-hoc analysis of specific effects was conducted to find out whether perceived test design and endorsement of high-stakes test uses influenced the types of preparation that test takers chose to engage in. All direct paths from P-test design and P-test uses to the five indicators of test preparation were assessed in turn. Assessments of these specific effects were post hoc and data driven.
Three significant direct paths were identified. For the sake of model parsimony, only these three were kept in the final solution (χ2 = 122.06, df = 52, RMSEA = .033, CFI = .986, NFI = .975, TLI = .975). This round of post-hoc assessments found that test takers with higher awareness of necessary skills tended to use more meta-cognitive strategies in preparation, that is, higher usage of assess & evaluate strategies (β = .12, p < .001). They also rehearsed test-taking skills more frequently (β = .19, p < .001). In addition, test takers who endorsed high-stakes test uses tended to use socio-affective strategies less frequently during test preparation (β = −.07, p = .018).
Discussion
Research question 1 asks: ‘Do test taker perceptions of test design and high-stakes uses influence preparation simultaneously?’ The findings of this study indicate that both perceptions of test design and high-stakes test uses influenced preparation simultaneously. Compared with perceptions of high-stakes test uses, perceptions of test design seemed to exert relatively greater impact on overall test preparation (Standardized total effect: .386 vs. .003). This finding is consistent with previous studies that conclude instrumental goals exert relatively little effect on strategy use (Pintrich, 1999). However, this finding should not be used to suggest that high-stakes test uses exert little impact on preparation. Because this study measures preparation in terms of the usages of various preparation strategies, it does not measure other aspects of test preparation. For instance, in allocating time and effort, test takers strategically prioritize test-related tasks and materials. This is an important aspect of test preparation, but was not included in the test preparation construct in this study. Prioritizing test-related tasks during test preparation can be viewed as a coping strategy, which might be associated with test anxiety and the stakes attached to test uses. Further studies should include more comprehensive aspects of test preparation in the dependent variable.
Research question 2 asks: ‘In what ways and to what extent do perceived test design and test use influence preparation?’ Two mediators (Expectation, Test-value) were introduced to explain the path(s) of influences from testing to preparation. This round of modeling found these two mediators to be useful and important in understanding the mechanisms of the washback process.
Paths of influence from perceived test uses to preparation
In this study, evaluation of test importance (Test-value) explains the influence from perception of test uses to preparation (a complete mediation). Meanwhile, no significant, direct relation was found between endorsement of instrumental test uses and expectation of success. This finding suggests that the endorsed instrumental uses affected preparation primarily via the value aspect of motivation. Test takers who endorsed instrumental test uses as short-term goals assigned more importance to test taking; the value attached to test taking motivated them to engage more in preparation via usage of multiple preparation strategies. That said, the total effect of endorsed instrumental test uses on preparation is slim (standardized total effect = .003). A negative direct path from P-test uses to Test Preparation is observed. However, the path coefficient is not significant statistically, and we do not consider it meaningful. Nevertheless, similar negative path coefficients have been observed elsewhere. For example, Pintrich (1999) reports standardized regression coefficients from extrinsic goals to use of cognitive strategies (from −.03 to .11) and to self-regulation (−.03 to .06). However, he does not mention whether the negative values are statistically significant or meaningful.
Furthermore, this study also found a negative relation between the endorsement of instrumental test uses and the use of socio-affective strategies for seeking help. Test takers who endorsed instrumental test uses reported using socio-affective strategies less frequently during test preparation (β = −.07, p = .018). Karabenick (2004) observed that perception of a competitive classroom environment discouraged students from seeking achievement-related help. High-stakes test uses might intensify competitive classroom environments, and thus be inversely related to the usage of socio-affective strategies for seeking help.
Path of influence from perceived test design to preparation
This study found both Expectation and Test-value are useful mediators to explain the effects from perception of test design to preparation. For the mediation effects of expectation, this study found that test takers who endorsed language skills as necessary tended to show more confidence towards test taking; higher self-efficacy, in turn, is associated with greater engagement in preparation. Bandura (1982) noted that self-appraisal of various information is a necessary process in the formation of positive self-efficacy. Gist and Mitchell (1992) noted that perceived task requirements as one determinant of self- efficacy were associated with reduced fear and uncertainty. Perhaps knowledge of test demands helps to dispel fear towards test taking. Though test takers might not yet possess the language skills and knowledge perceived as necessary, knowing what is necessary could give them a sense of direction and control over the upcoming task. As they learn more about what to prepare for, the locus of control returns to their hands rather than being the possession of a mysterious, unknown body. Thus, they appear more confident towards test taking.
Higher self-efficacy was associated with more engagement in preparation. In connection with Gosa’s (2004) finding that high self-efficacy in conjunction with perception of an easy test led to little test preparation, it suggests that test takers tended to perceive CET4 as challenging but not easy. Therefore, high self-efficacy positively contributed to greater engagement in preparation. Bandura (1982) noted that some self-doubt may actually activate learning and preparatory behaviour, while supreme self-efficacy in conjunction with perception of easy tasks may discourage them. Contingent with perceived task difficulty or easiness, self-efficacy may exercise positive or negative effects on learning effort. That said, existing studies observe more positive relations from self-efficacy to effort and usage of strategies than negative ones (e.g. Pajares, 1996; Pintrich, 1999).
Pintrich (1999, p. 463) summarized many studies and generated a range of standardized estimations between self-efficacy and cognitive strategy use (from .009 to .36) and between self-efficacy and self-regulation (from .12 to .58). The lower end of the ranges represents standardized regression coefficients, while the higher end represents zero-order correlations. In this study, the path coefficient from self-efficacy to engagement in preparation (β = .26, p < .001) is located in the middle. This relatively stronger relationship is probably because self-efficacy was measured with careful specification of test taking and preparation in this study. Because the judgment of self-efficacy is task and domain specific, specification in self-efficacy assessment and task correspondence may have strengthened the predictive accuracy of self-efficacy (Pajares, 1996).
Regarding the mediation effects of test value between perception of test design and preparation, this study found positive endorsement of intended test demand was related to higher evaluation of test importance (β = .148, p < .001). Eccles et al. (1983) noted that the value attached to academic tasks is dependent on both personal and task characteristics. When the task is perceived as instrumental for achieving personal goals, it is associated with higher utility value. On the other hand, when the task is perceived as interesting and meaningful, it is associated with intrinsic value. In this study, those test takers who endorsed test design positively might have also considered the preparation process as a useful and meaningful learning experience related to the long-term goal of developing language ability. In fact, one item of the test value scale states: ‘Taking CET4 can help me to learn English language.’ The usefulness of the preparatory process for achieving long-term goals may attract additional value to test taking.
Consistent with previous studies (e.g. Pintrich 1999), this study found higher task value is associated with greater engagement in preparation (β = .14, p < .001). For the relationships between task value and strategy use, a range between .03 and .67 is identified (Pintrich, 1999) with the lower end of the range representing standardized regression weights (the unique contribution of task value) and the higher end representing zero-order correlations. The path coefficient observed in this study indicates the unique contribution of test value to preparation; it is located towards the lower end of the range, indicating a small but significant effect.
Furthermore, test taker perceptions of test design also affect usage of preparation strategies. This study found that test takers who endorsed language skills as necessary for test taking tended to conduct more test analysis (β = .12, p < .001) and practice more test-taking skills (β = .19, p < .001). According to L2 strategy researchers, task knowledge is one type of meta-cognitive knowledge, which provides the knowledge base for effective planning, monitoring and evaluating. It ‘prompts learners to initiate a task analysis to realize what it needs to be done. It also dictates what must be done to complete the task’ (Wenden, 1998, p. 524). Test analysis (assessing the test and evaluating self) may be affected by knowledge of test demand. Test takers might use their knowledge of the test to manage the preparation and to identify appropriate test-taking skills for test taking.
Implications for practice
For test developers and users of test results, in this case, the university registrar who will check whether graduation requirements have been met or potential employers who may require the CET as an employment requirement, the findings of this study indicate that both test design and use may affect preparation for the test simultaneously, though their paths of influence may be different. Overall, endorsement of intended language skills as a test demand contributed to engagement in test preparation (.36, medium effect); endorsement of high-stakes test uses only marginally contributed to test preparation (.003, marginal effect). Perceptions of test design and perceptions of test uses explained 24% variances of the test preparation factor.
Although this study shows that perceived test uses have less impact on overall preparation than does perceived test design, this finding is by no means conclusive. This finding is partly related to the way test preparation was measured. Further studies need to incorporate other aspects of preparation (e.g. strategic task prioritizing) into the measure to generate a more comprehensive view of the impact of high-stakes test uses.
For educational reformers using high-stakes testing as a lever of change, the findings of this study might be of special interest. The study provides one tentative answer to the question: ‘Why do measurement-driven interventions aiming at producing positive washback often miss their target?’ More often than not, intended washback is not realized; that is, what is learnt does not correspond to what was intended. If nothing else, the chain of mediators between what is assessed and what test takers prepare for reveals the complexity of the process from testing to learning. First of all, intended skills need to be endorsed by test takers as necessary. Positive endorsement of intended skills is necessary, but not sufficient. Test takers also need to consider the test valuable and doable (i.e. ‘I want to do it’’ and ‘I can do it’). Perception of test demand acts as the first filter for the intended skills to get through. Expectation and Value act as the second filter. The skills intended by test designers may not be endorsed by test takers; the endorsed skills may not be prepared and learnt if test takers consider them unimportant or unattainable. Because these filters operate along the path from testing to learning, what passes through them may be considerably less than what is intended. Perhaps only the aspects of intended skills that are perceived by test takers as necessary, important, and manageable are prepared and hopefully learnt. This observation is consistent with Qi’s study (2005), which found that teachers refused to endorse the intended communicative language skills as necessary for test taking. The mismatch between the intended and endorsed test demands undermined the test designers’ intentions to promote innovation in teaching.
Limitations and future directions
Although the results of this study add to our understanding of the paths from testing to preparatory behaviours, there are several limitations that must be addressed in future studies. One is to examine test preparation as a special instance of washback on learning. For any high-stakes external testing context, when the test time approaches, the most intensive washback is likely to be observed. Overt washback of a high-stakes examination is nevertheless a special instance. It is likely to exhibit different characteristics from covert washback on learning when test taking is not immediate. As the purpose of this study was to explore the mechanisms of washback, confining the study of washback to a specific period not only made the study logistically feasible, but also made methodological sense. Test preparation is the time when testing exerts the most direct and visible impact on learning. Confining washback on learning within the test preparation period enhanced the internal validity of this study, though, at the same time, it reduced its generalizability to other contexts. Given this limitation, a natural extension would be to investigate ‘covert washback’ during pre-preparation time periods.
Another limitation is related to the adoption of Expectancy-value motivation theory. By adopting this theory, the present study assumes test preparation consists of planned, motivated, rational, and achievement-related behaviours, and excludes other possibilities (e.g. habitual, irrational, or emotional behaviours). Although test preparation is more likely to be planned and rational, other influences may also affect it. Such influences, however, were not investigated in this study.
Moreover, although preparatory behaviours can be studied analogously to learning and situated within a framework of achievement motivation, test preparation within a high-stakes context is different from more general learning in that it is often intrinsically associated with human reactions to pressure, fear, and anxiety. It would therefore be beneficial for future studies to investigate test preparation within the framework of coping mechanisms. Specifically, affective aspects of motivation such as test anxiety could be introduced into the model as another useful mediator for understanding the paths of influence of high-stakes test uses on the strategies employed in preparation and test taking.
Introducing Expectancy-value theory into washback research represents an important step toward understand washback on learning. For this purpose, it was considered prudent to simplify this phenomenon conceptually and methodologically, especially at this initial stage. In terms of methodology, the present study used self-report questionnaires to capture test takers’ perceptions and preparation behaviours. This may be considered another limitation. In future studies, it will be desirable to triangulate data from other sources as well.
This study serves to demonstrate the feasibility of borrowing an established theory from other areas to explore washback mechanisms, and the feasibility of employing SEM methodology to assess the conceptual model statistically. A larger model with more factors, although beyond a single researcher’s capacity and logistical affordance, is conceivable for future researchers. A logical extension of this study is to include more contextual and social factors into the model as informed by the full model of Expectancy-value theory. Teachers’ perceptions of test design and uses, test takers’ interpretations of past experience, and their test performance could be included in the extended model. Additionally, a similar model for the low-stakes context could be specified and tested, and then compared with that observed in a high-stakes context.
Finally, this study provides empirical evidence that both test design and high-stakes test uses can affect test takers, albeit at different magnitudes and following different paths. Utilizing Expectancy-value motivation theory, we have provided potentially useful insights to understand the complexity of washback on learning. However, more empirical studies are necessary in order to obtain a more comprehensive picture of this phenomenon.
Footnotes
Appendix A
Sample items for perception and test preparation
| Subscales | Example items |
|---|---|
| In order to answer questions…correctly, I must… | |
| 1. P-linguistic knowledge | …have enough knowledge of phrases and collocation |
| …have knowledge of syntax and grammar | |
| 2. P-reading skills | …understand the key points in reading |
| … infer the implied meanings in reading | |
| 3. P-listening skills | …make inference about the speakers’ attitudes and views |
| …catch important stress and intonations in listening | |
| For CET4 essay, I… | |
| 4. P-writing skills | …write in smooth and fluent English |
| …establish a clear main theme | |
| During this test preparation period (April to June), I… | |
| 1. Socio-affective strategies | …tried to learn from others; |
| …sought teachers’ advice to improve test performance. | |
| 2. Test analysis (assess & evaluate) | …analyzed question types to identify frequently assessed questions; |
| …analyzed test papers to identify the level of difficulties in each section. | |
| 3. Memorizing | …recited sentence patterns for improving performance on writing; |
| …memorized linking words and phrases. | |
| 4. Drilling | …drilled on my reading comprehension skills; |
| …timed my practice to improve reading speed. | |
| 5. Rehearse test-taking skills | … trained my skills to choose options through logic elimination; |
| …tried to find ways to keep concentrated on listening tasks. | |

Appendix B
Scale descriptive statistics and zero-order correlation matrix (EM method)
| Scales | subscales | N | Items | α | Mean | SD | F1 | F2 | F3 | F4 | F5 | F6 | F7 | F8 | F9 | F10 | F11 |
|---|---|---|---|---|---|---|---|---|---|---|---|---|---|---|---|---|---|
| P-test uses | 888 | 3 | .673 | 4.878 | .882 | / | |||||||||||
| Test value | 888 | 3 | .738 | 4.526 | .897 | .391 | / | ||||||||||
| P-test design | P-linguistic knowledge | 888 | 8 | .841 | 4.748 | .621 | .280 | .296 | / | ||||||||
| P-reading skills | 888 | 4 | .784 | 4.955 | .615 | .253 | .250 | .583 | / | ||||||||
| P-listening skills | 888 | 7 | .809 | 4.603 | .597 | .296 | .274 | .666 | .594 | / | |||||||
| P-writing skills | 888 | 6 | .852 | 5.046 | .628 | .237 | .274 | .679 | .528 | .599 | / | ||||||
| Expectation | 888 | 5 | .884 | 4.466 | .851 | .175 | .375 | .321 | .203 | .295 | .305 | / | |||||
| Test prep | Socio-affective | 872 | 6 | .836 | 1.601 | .655 | .016 | .246 | .203 | .106 | .137 | .198 | .272 | / | |||
| Test analysis (Assess & evaluate) | 872 | 10 | .871 | 3.177 | .696 | .148 | .279 | .281 | .217 | .243 | .325 | .369 | .530 | / | |||
| Memorizing | 872 | 5 | .835 | 2.785 | .881 | .070 | .175 | .156 | .139 | .131 | .193 | .239 | .513 | .543 | / | ||
| Drilling | 872 | 4 | .782 | 2.846 | .796 | .106 | .214 | .201 | .181 | .194 | .225 | .249 | .504 | .578 | .565 | / | |
| Rehearse test-taking skills | 872 | 8 | .888 | 3.424 | .772 | .135 | .238 | .368 | .242 | .328 | .329 | .332 | .476 | .579 | .549 | .649 |
Acknowledgements
This paper is based on the first author’s PhD thesis, for which the second author was primary supervisor. Both authors would like to thank the co-supervisor, Raymond Lam, for his contributions to the study. We would also like to acknowledge that this study received partial support from Educational Testing Service under Small Grants for Doctoral Research in Second or Foreign Language Assessment.