
Abstract
One critical issue with cognitive diagnostic assessment (CDA) lies in its lack of research evidence that shows how diagnostic feedback from CDA is interpreted and used by young students. This mixed methods research examined how holistic diagnostic feedback (HDF) is processed by young learners with different profiles of reading skills, goal orientations, and perceived ability. HDF provides three learner profiles: learners’ current skill mastery levels; self-assessed skill proficiency; and goal orientations. It also has a section for plans for future learning. A total of 44 Grades 5 and 6 students (aged 11–12) from two classrooms, their parents and teacher received individually customized HDF reports. Students’ reading skill mastery profiles were determined based on the application of cognitive diagnostic modeling to their performance on a provincial reading achievement measure, while their perceived ability and goal orientation profiles were created by using self-assessment and goal-orientation questionnaires. Students and parents provided written responses to their HDF reports.
The study findings show the dynamic influence of young students’ profiles on the ways in which they perceive, interpret and use HDF. Students’ responses to diagnostic feedback did not differ substantially across reading mastery levels; however, psychological factors most strongly impacted the efficacy of learner feedback processing. Furthermore, the result that it was not students’ actual goal orientations but their perceived parent goal orientations that showed significant relationships with their skill mastery levels strongly indicates that young students’ responses to HDF are likely to be influenced by broader learning environments, and such influences are further filtered through their own perceptions. Understanding students’ interactions with diagnostic feedback is critical for maximizing its effect because their perceptions about ability and orientations to learning strongly influence the ways in which they process diagnostic feedback on their learning.
Keywords
Cognitive diagnostic assessment (CDA) aims to bring theory-based systematic assessment close to the heart of pedagogy by providing diagnostically useful information that can be used to tailor instruction to individual students’ needs (Jang, 2009; Lee & Sawaki, 2009; Leighton & Gierl, 2007). Diagnostic profiles generated from CDA are expected to serve as feedback in providing pedagogically useful diagnostic information for teachers and students, and further help to raise students’ metacognitive awareness of their own learning progress (Butler & Winne, 1995).
Research shows that students become motivated when feedback is provided (Black & Wiliam, 1998); however, there is little research on how young students respond to diagnostic feedback, and further, how individual characteristics and contextual factors influence their responses to feedback. Previous research on feedback has been predominantly focused on its type (e.g., direct vs. indirect error correction) and delivery mode (e.g., written vs. oral). Feedback also tended to be treated as a fixed stimulus to which learners respond uniformly (Ferris, 2003). However, students, especially young learners, demonstrate dynamic learner characteristics in terms of individual traits, such as ability, goal orientation (Dweck, 1986), perceived ability, and home environments.
In this paper, we conceptualized and developed holistic diagnostic feedback (HDF) in order to provide young learners with comprehensive information about their current skill mastery levels, perceived skill proficiency, and goal orientations, while prompting and guiding them to set their learning goals. The present paper reports a mixed methods investigation into how students with different profiles respond to HDF based on the application of cognitive diagnostic modeling to population data from a provincial literacy assessment in Canada. Considering the importance of parent influence on young learners, we also examined how parents respond to their children’s HDF reports. Specifically, the following research questions were addressed in the study:
What is the relationship between young students’ reading skill profiles and their responses to HDF?
What is the relationship between students’ perceived reading ability and their responses to HDF?
How do students’ goal orientations influence their responses to HDF?
How do parents respond to their children’s HDF reports?
Literature review
Diagnostic feedback
Generally, feedback is conceptualized as information provided for learners following an assessment task regarding positive aspects and areas for improvement in their performance (Hattie & Timperley, 2007). Diagnostic feedback generated from CDA differs from evaluative feedback which is summative in nature and tends to rely on qualifiers, such as “good,” “nice job,” or “excellent.” It also differs from corrective feedback which provides information about whether a student’s response is correct. In contrast, diagnostic feedback from CDA highlights both strengths and areas for improvement for students (Huff & Goodman, 2007) by providing descriptive information that links cognitive processes and strategies underlying assessment tasks to task performance (Balzer, Doherty, & O’Connor, 1989; Butler & Winne, 1995). The quality of diagnostic inferences depends on cognitive validity evidence supporting diagnostic inferences about the mastery of target skills (Mislevy, 1995; Weir & Khalifa, 2008) and the pedagogical usefulness of diagnostic information.
Previous research on feedback has lacked insights into how feedback is contextualized and filtered through learners’ perceptions, goals, and affects. Feedback research should consider how learners’ internal beliefs facilitate or hinder the use of feedback, how learners evaluate the validity of feedback, and whether they renew their perceptions about learning progress. Learners do not simply respond to feedback; rather, they interpret it according to their internal beliefs, evaluate its validity, and renew their perceptions about own learning progress as well as strategies employed. Accordingly, in the present study, diagnostic feedback from CDA was incorporated into customized HDF reports along with students’ goal orientations and perceived abilities in order to facilitate students’ self-regulation and maximize the potential of diagnostic feedback. In the following section, we pay close attention to goal orientations and perceived ability.
Perceived ability
Students’ perceived ability is likely to influence ways in which they interpret and use diagnostic feedback. If there is a considerable gap between perceived ability and diagnostic results, students need to be guided to pay attention to this gap. Students’ perceived ability is often measured using self-assessment (Butler & Lee, 2010; Cohen, 1994; Dann, 2002; Ross, 1998; Zimmerman, 1990). Assessing students’ perceived ability through self-assessment also has the potential of helping students to develop positive attitudes to learning (Paris & Paris, 2001). However, the validity of self-assessment has been hotly debated due to its inaccuracy (Brown & Hudson, 2002; Jang, 2014). Further, little is known about young students’ capacity to self-assess their own abilities with accuracy. Butler and Lee (2010) attribute this lack of attention to the belief that children are incapable of evaluating their performance or regulate own learning accurately. Certainly, students do not naturally develop accurate self-assessment skills. They need careful guidance from teachers, and with such support, young children may be able to develop the ability to self-assess accurately. Careful feedback research should address students’ perceived ability to determine its effect on learners’ approaches to feedback, because closing the perceptual gaps is a prerequisite to planning remedial action.
Goal orientations
Feedback is potentially more effective when it provides information about the learner’s progress toward a set of goals, rather than about discrete responses to individual tasks. However, learners adopt different approaches to learning tasks. According to goal orientation theory (Dweck, 1986), they can hold a mastery or performance goal orientation toward tasks. Mastery-oriented learners tend to enjoy challenging tasks and welcome constructive feedback. In contrast, performance-oriented learners are interested in demonstrating their competence to others and seeking positive responses.
Underlying these goal orientations are two distinct views of intelligence (Dweck & Leggett, 1988). Those who hold incremental views consider intelligence as a malleable attribute that can be improved given sufficient effort. These learners can get bored when they achieve success with minimal effort, and enjoy intrinsic rewards. In contrast, those who hold a fixed entity view consider it as an innate attribute that cannot be changed. They may view constructive feedback that explains areas for improvement as a threat to self-esteem, show anxiety and shame, devalue tasks, and express boredom.
Diagnostic feedback can serve as a means to re-orient learners toward goal-driven, malleable-intelligence learning (Ames, 1992). Goal-oriented feedback may help the learner understand that ability can be enhanced through effort and that failure and mistakes are part of the competence-building process (Hoska, 1993).
However, students do not learn in a sociocultural vacuum. Parents are known to affect how students approach academic tasks (Friedel, Cortina, Turner, & Midgley, 2007; Kim, Schallert, & Kim, 2010; White, 1996). For example, Wentzel (1998) observed that students with positive social interactions with significant others such as peers, parents and teachers tended to show strong academic goal orientations. Evidently students operate within a wider context than their individual selves, as Bronfenbrenner (1994) describes in his ecological model of human development. Therefore, not only do individual goal orientations influence how students receive and use feedback, but parental attitudes may have an effect on their attitude to feedback.
Method
Participants
Forty-four students from two Grades 5 and 6 classrooms in a private school located in southern Ontario, Canada, participated in the study. Taught by the same female literacy teacher, the classes included 25 boys and 19 girls. Thirty-three students (72%) were born in Canada. The remaining 11 students were born in seven different countries including Egypt (n = 4), Australia (n = 1), England (n = 2), USA (n = 1), Korea (n = 1), South Africa (n = 1), and Thailand (n = 1). Twenty-six students spoke only English at home, while 15 spoke both English and other languages at home. There were three students who spoke only other languages at home.
Data collection
We used a developmental mixed methods research design in which quantitative data were used to determine relationships among variables concerning students’ learning characteristics, while qualitative data were used to describe processes underlying variables (Maxwell & Loomis, 2003). Both variance and process theories were used for determining and substantiating the relationships among variables that characterize students’ cognitive, psychological, and perceptive learning traits and profiles.
Mixed methods data were collected from November 2012 to June 2013. Students completed reading and writing assessments, 1 goal-orientation and self-assessment questionnaires, and a home language background questionnaire. The students’ parents also completed a questionnaire that surveyed their perspectives about their child’s learning.
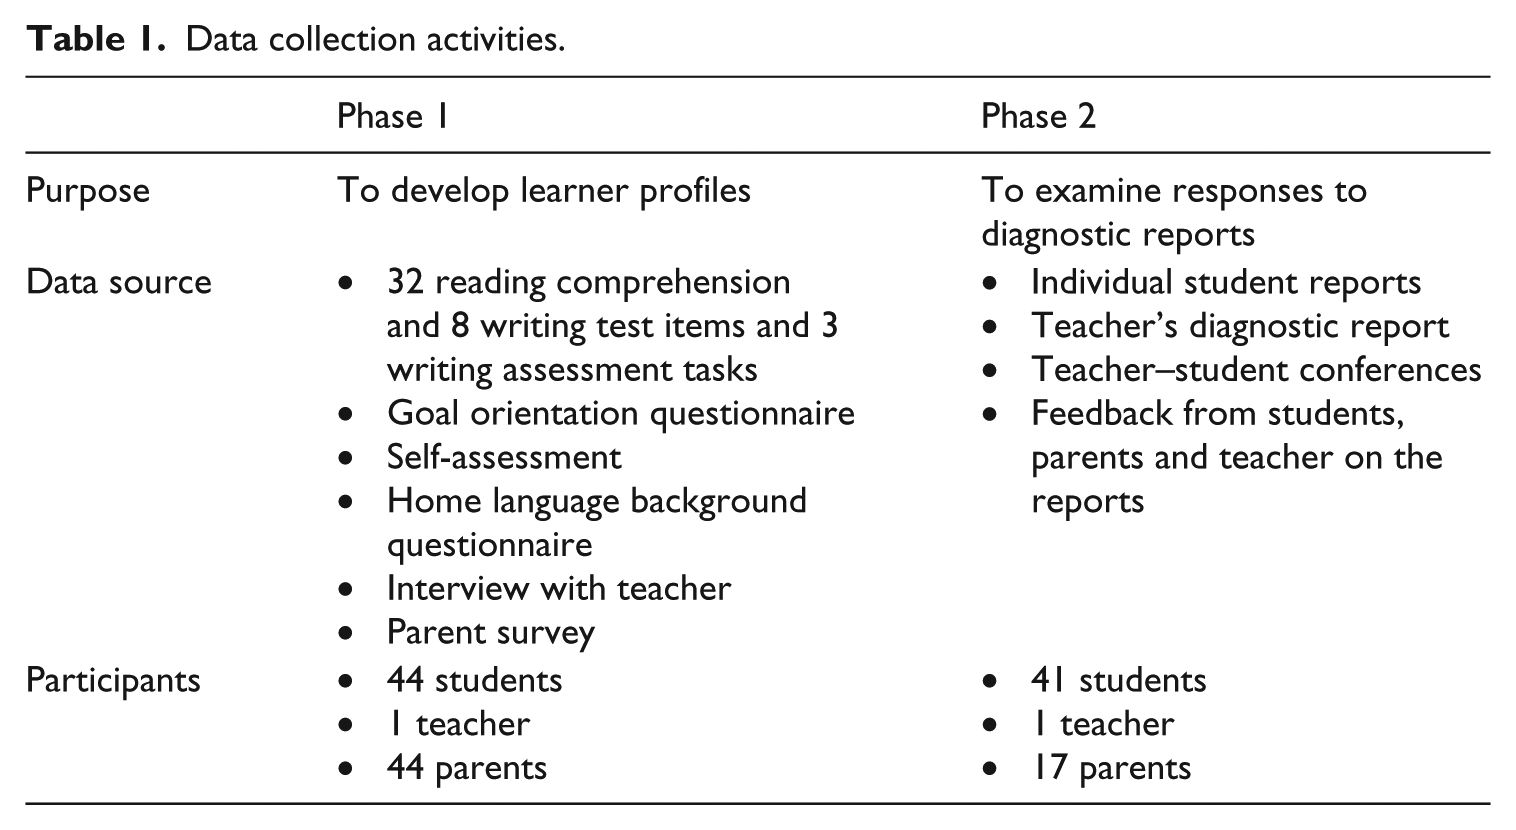
We developed diagnostic profiles of elementary school students based on the conjunctive Reparameterized Unified Model (RUM) (Jang, 2005; Roussos et al., 2007) retro-fit to provincial literacy achievement test performance data. We also created perceived ability and goal orientation profiles separately. We customized HDF reports based on individual students’ profiles of reading and writing skill mastery, perceived ability, and goal orientation. Each individual student and the teacher received customized HDF reports. We gathered data from students’ written responses to the HDF reports. Table 1 summarizes the data collection activities and data sources.
Data collection activities.
Measures
Reading achievement measure
A Grade 6 provincial reading achievement assessment was used to estimate students’ reading skills mastery levels. The measure included 32 multiple-choice reading comprehension test items embedded in five different passages and eight items that tested writing conventions. We used a Q matrix developed for the first phase of the present large-scale study (Jang, Dunlop, Wagner, Kim, & Gu, 2013), in which we identified six reading skills based on the multi-componential view positing that reading requires multiple skills involving both automatic and strategic cognitive processes (Cain, Oakhill, & Bryant, 2004). This view emphasizes that skillful reading requires orchestrating multiple cognitive processes sequentially and simultaneously and building the capacity to self-evaluate these processes (Baker & Brown, 1984; Grabe & Stoller, 2002; Smith, 2004). This multi-componential view of reading resonates well with curricular frameworks used in Ontario. For example, the current Ontario elementary literacy curriculum introduces a variety of cognitive literacy skills, specified by the provincial literacy standards along with grade-specific expectations.
The six reading comprehension skills used to develop HDF profiles for 44 student participants included: (1) textually explicit comprehension; (2) textually implicit comprehension; (3) inferencing; (4) processing grammatical knowledge; (5) processing vocabulary knowledge; and (6) summarizing main ideas in text. Among 40 items, 22 items were associated with measuring textually implicit comprehension (IMP, α = .87). Ten items measured textually explicit comprehension (EXP, α = .70), while eight items were associated with inferencing (INF, α = .63), grammar (GRM, α = .64), and vocabulary (VOC, α = .63) respectively. Lastly, six items measured summarizing (SUM, α = .67).
Self-assessment questionnaire
The self-assessment questionnaire asked students to evaluate their ability in the same reading skills included in the student reading skill profiles. The measure included 12 items, with two items per skill, using a 5-point Likert scale (1 = not at all true, 5 = very true).
Goal orientation questionnaire
We created a goal orientation questionnaire by operationalizing the construct of goal orientation (GO) in terms of three factors: performance prove (PP), performance avoid (PA) and mastery (M) (Dweck, 1986; Midgley et al., 2000). Our GO questionnaire surveyed students’ orientations as well as their perceptions about their parents’ and teacher’s goal orientations. We modified subscales from Midgley et al.’s (2000) Pattern of Adaptive Learning Scales (PALS) so that the GO items were appropriate for young children. Due to survey length issues, for the items exploring students’ perceptions of their parents’ and teacher’s goal orientations, we included only two items per construct.
HDF reports
We created an HDF report for each student and a summary report for the teacher. As shown in Appendix 1, the mastery status of each skill was presented using a bar graph in the report. A critical feature of the HDF report was that it did not provide any numerical score in order to direct students’ attention to HDF. There was no numerical score in students’ reports. We used a walking man figure to indicate the level of mastery and a smiling face figure to indicate the student’s perceived skill proficiency (based on their self-assessment). Below each graph, students were given space to share their thoughts. The report also included a section called “Planning future learning” in which we encouraged students to plan their learning. We asked whether they agreed with the statement that summarized their goal orientation and asked them to write three learning goals they wanted to work on over the next few weeks. The teacher went over a sample report with students and held individual conferences with students after they reviewed their own reports. The report was signed by students and their teacher and was later reviewed by parents.
Parent survey
Once students finished reviewing their reports, we sent a survey to parents along with their child’s diagnostic report. The parent survey probed parents’ goal orientations, and expectations about academic assessment and report cards. The measure included six items asking about goal orientations, with two items per orientation class, using a 5-point Likert scale (1 = not at all true, 5 = very true).
Analysis
Reading skill profiles
Appendix 2 presents provincial reading measure item statistics including item difficulty (proportion correct scores) and discrimination (point-biserial correlation coefficient, rpbis) for the sample of 44 students in comparison with the entire population. As shown in Appendix 2, the Q matrix specifies the relationship between the test items and target skills (six skills in the present study) (Tatsuoka, 1983). Overall, the item statistics were comparable except a few items whose rpbis values from the sample were negative or too low (possibly owing to a small sample size). These preliminary analyses supported our intent to estimate the sample’s skill mastery levels using the cognitive diagnostic model (CDM) established with the population data.
Subsequently, we estimated 44 students’ reading skill profiles based on the application of the aforementioned cognitive diagnostic model to a provincial literacy assessment performance data (N = 120,767). Each individual student’s reading skill profile contained the posterior probability of mastery (PPM) for each of the six skills, that is, the probability that the student has mastered the target skill. If a PPM value was higher than .4, the student was considered a master of that skill. As there were six skills, 64 possible skill profiles were represented by a combination of 0s for non-masters and 1s for masters. The skills were coded in order: EXP, IMP, INF, GRM, VOC, SUM. For example, a 100000 profile indicated that the student had mastered only the explicit information processing (EXP) skill.
In addition to investigating relationships with other profile types, we used group means to examine skill mastery patterns for the whole sample and to further examine the relationship between skill mastery patterns and students’ background characteristics, for example, immigration status (immigrant vs. domestic) and home language environment (monolingual vs. multilingual). In this paper, “domestic” refers to students born in Canada, while “immigrants” were born outside Canada. “Monolingual” students speak and hear only English at home, while “multilingual” students speak and/or hear other languages at home. Owing to the small sample size and unequal cell sizes, we did not consider immigrant students’ length of residence in Canada, and statistical significance tests were not conducted.
Self-assessment
We determined students’ perceived ability profiles from their responses to the self-assessment questionnaire. Appendix 3 presents the self-assessment items and their descriptive statistics. For each of the six skills, the mean of the two associated items on the questionnaire was used as the estimate of each student’s perceived ability on that skill. To aid interpretability and comparability, mean scores were converted to a 0–1 scale, using the formula:
The relationship between perceived abilities of different skills was analyzed using bivariate correlational analysis (Pearson’s r), and by comparison of overall mean scores. In addition, the differences in perceived ability between immigrant/domestic and mono/multilingual students were investigated using group means. Owing to a small sample size and unequal cell sizes, significance testing was not conducted.
To identify discrepancies between self-assessments and skill mastery estimates from CDM, the perceived mastery score was then subtracted from the estimated mastery score. If the result was negative, the student overestimated their ability (compared to the CDM profiling). If the result was positive, the student underestimated their ability. If the result was 0, the student and CDM profiling agreed. For example, if a student believed herself a master (e.g., .70), yet CDM profiling reported them a non-master (e.g., .20), the result was −.50; the student overestimated their ability. The distribution was clearly bimodal, as shown in Figure 1.
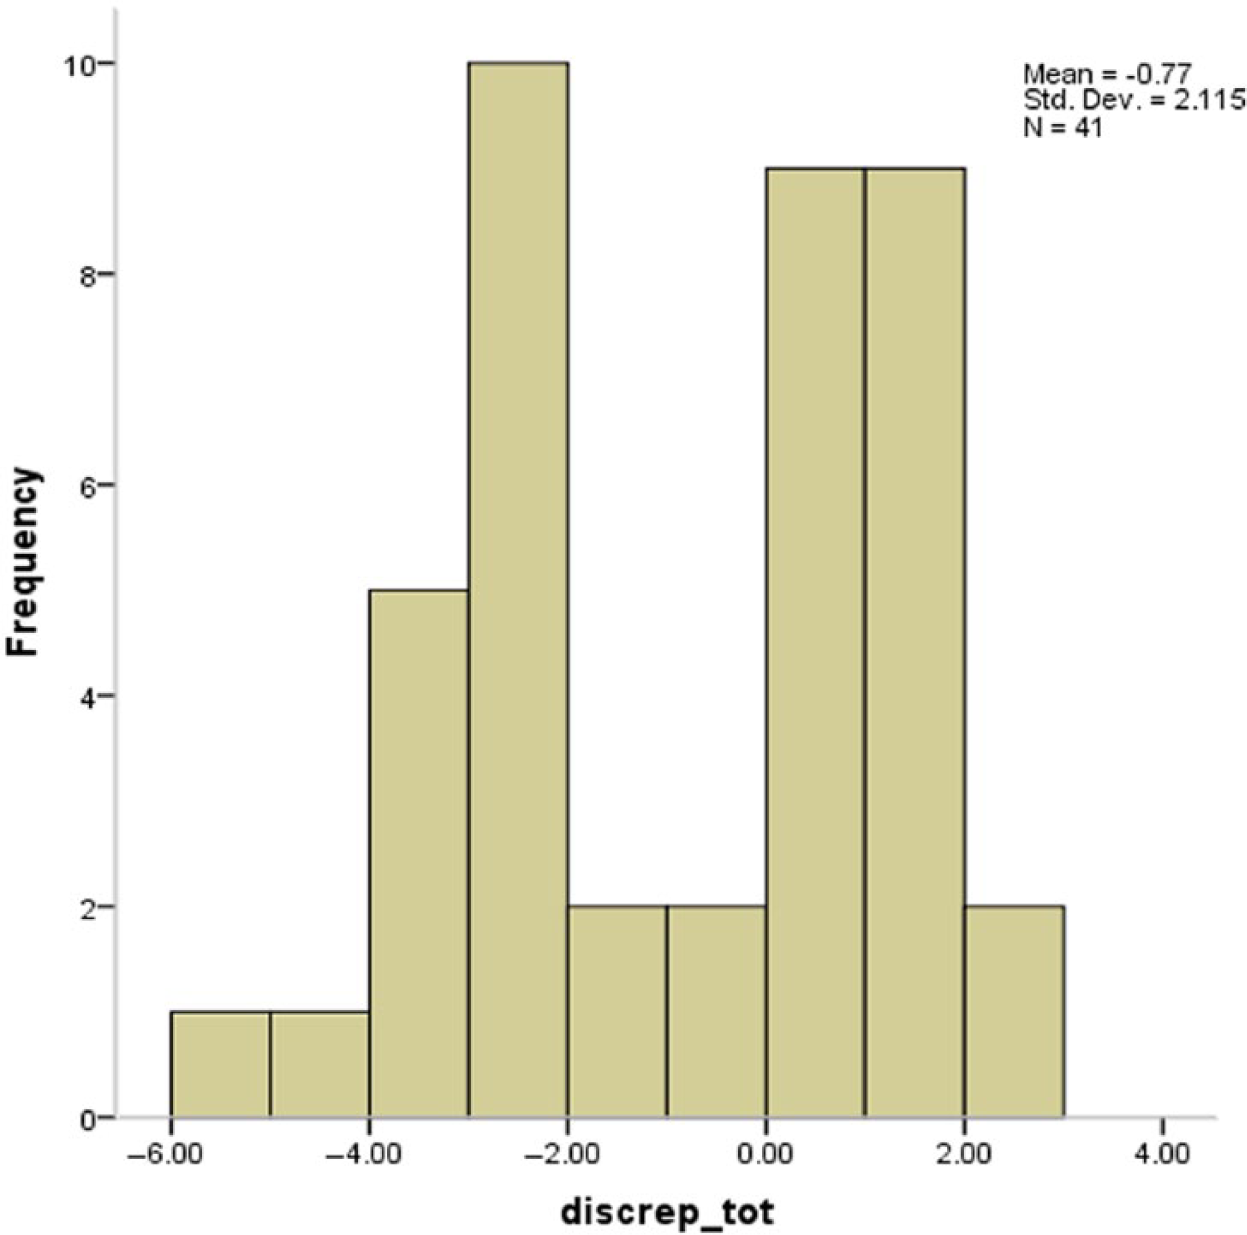
Histogram of discrepancies between self-assessment and skill mastery estimates.
We subsequently created students’ perceived ability profiles by categorizing students into two groups, over-estimators and under-estimators. The binary split was set at the mean summed discrepancy (i.e., −1.17). This binary variable was used in the consolidated learner profile analyses described below.
Goal orientation profiles
We confirmed previous validation studies of the survey items (see Midgley et al., 2000) using scale consistency (coefficient alpha) and individual items’ point-biserial correlation coefficients. Bivariate correlation coefficients between items were also inspected. Three items were excluded from data analysis based on low within-scale correlations. Appendix 4 presents the statistical characteristics of the goal orientation questionnaire items.
We then determined individual students’ goal orientation profiles based on factor scores calculated using an exploratory factor analysis (EFA) from a larger data set that included an additional group of Grade-6 students from another related study (n = 92). Because the questionnaire items were extensively validated previously (see Midgley et al., 2000), we used the EFA mainly to obtain factor scores for the purpose of profiling. The principal axis factoring extraction with oblique rotation resulted in a three-factor solution, which accounted for 54% of the total variance (see Appendix 4 for the factor loadings). Based on the EFA results, the resulting factor scores were first multiplied by 10 and added 50 to make the scores more interpretable. The scores were then placed on comparable scales to identify dominant goal orientations. Using the minimum score (mscore) and range of each of these new variables, standard scores were calculated on a 0 to 1 scale using the equation:
Rather than applying a generic cut-off score to factor scores, we identified the highest scoring factors as the dominant goal orientations so all students could have a goal orientation profile. The dominant goal orientation was the goal orientation with the highest score. Secondary goal orientations were identified when a standard score for one construct was ⩽ .15 the highest standard score for that student. In total, seven goal orientation classes were identified (in the order of PP, PA, M): (100), (001), (110), (110), (011), and (111). Meantime, students’ perceptions of their teacher’s and parents’ goal orientations were calculated using the means of each pair of associated survey items.
In addition to investigating relationships with other profile types, we further examined the relationship between students’ language background characteristics and various goal orientation dimensions using group means, and statistical significance testing was conducted using one-way ANOVAs.
Parent survey
We calculated the means of the parents’ survey responses to identify performance or mastery goal orientations, and correlated these orientations with students’ perceived parent orientations.
HDF reports
We transcribed students’ written responses to their reports. We coded the students’ responses for several features: frequency of affect, frequency of performance-oriented and mastery-oriented comments, agreement with the report and the goal orientation diagnosis, and evidence of fixed or incremental views of ability. The frequencies were grouped as low (once or twice), medium (three or four times) or high (five or more times), while agreement and view of ability variables were coded as binary fixed/incremental variables. We analyzed the results as described below, comparing student groups such as goal orientation or language background.
Regarding relationships among student profiles, we conducted bivariate correlations (Pearson’s r) between skill mastery estimates and students’ perceived abilities, and between aggregated skill mastery estimates and various goal orientation dimensions (students’ perceptions about their own, their parents’, and their teacher’s goal orientations, as well as parents’ own goal orientations).
To consider relationships between student profiles and feedback responses, we compared the two most frequent skill profiles, that is, full skill masters (111111) and non-masters’ (000000) responses to the reports, as well as mastery and performance-oriented learners’ responses, looking at each of the coded variables. We conducted two-by-two chi-square tests where cell sizes permitted. Owing to a page limitation, we report the study results focusing mainly on students’ responses to HDF reports.
Results
As described in the method section, HDF reports were tailored to individual students’ profiles and included information on their reading skills, goal orientation, and perceived ability. Overall, with the teacher’s support, most students did not have difficulty understanding their personalized reports. The teacher stated that students needed some explanations to interpret the bar graph and figures (i.e., walking man and smiley face). The following section presents students’ responses to their HDF reports by considering the characteristics of their profiles of skill mastery, goal orientation, and perceived ability. In doing so, we first report some salient characteristics of students’ profiles considering that it will enrich our understanding about their relationships with HDF responses.
What is the relationship between young students’ reading skill profiles and their responses to HDF?
Reading skill mastery profiles
Overall, students showed the highest level of mastery with a basic comprehension skill, IMP (ppmimp = .79), consistent with the population (Jang et al., 2013). The inferencing skill showed the lowest mastery level (ppminf = .48). Two fifths of the students (n = 19) mastered all six skills (i.e., 111111) whereas eight students did not master any skill (000000).
As for the relationship between skill mastery patterns and students’ background characteristics, for example, immigration status (immigrant vs. domestic) and home language environment (monolingual vs. multilingual), Table 2 presents the four subgroups’ scores and mean skill PPMs.
Mean skill mastery probability estimates among four subgroups.
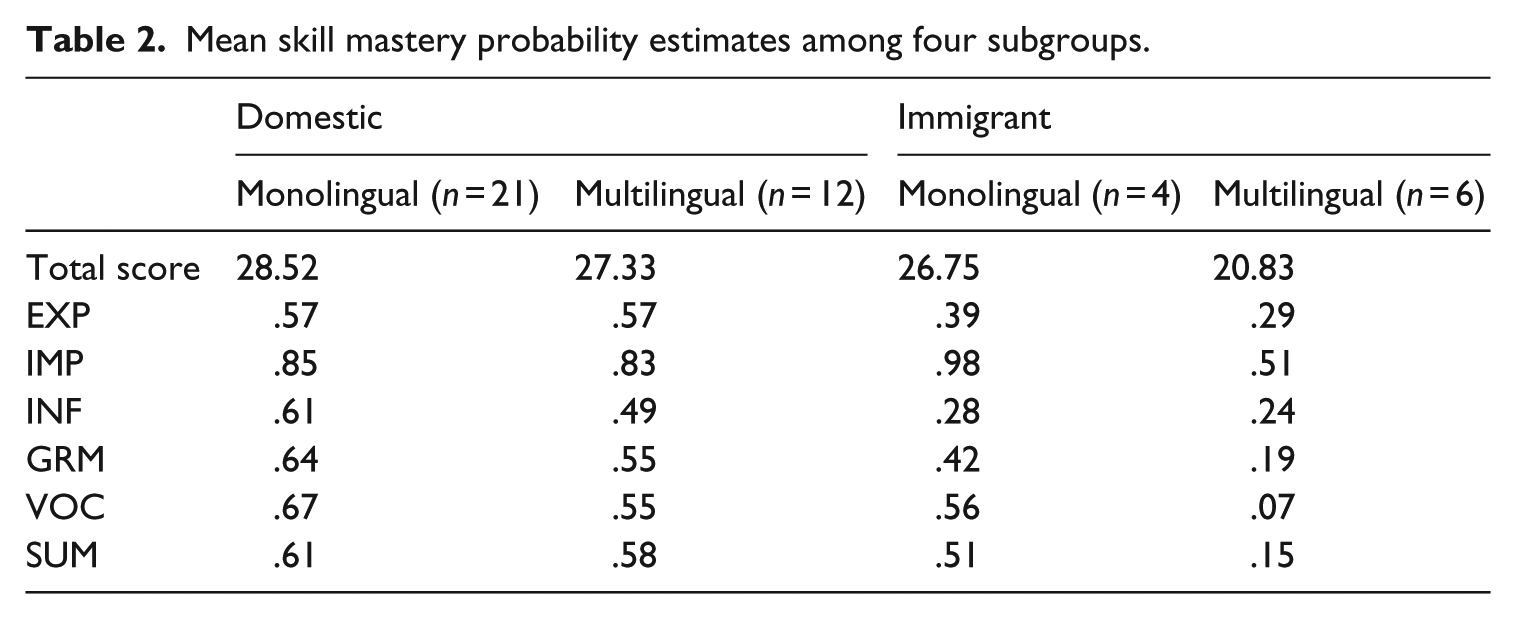
Immigrant students who hear and speak other languages at home showed much lower skill mastery levels than domestic students. In particular, skills associated with processing vocabulary knowledge and summarizing were difficult for the immigrant multilingual students. Unfortunately the small sample size (n = 6) prevented confirming this, although four of the six students had arrived in Canada in the previous three years. These immigrant multilingual students had almost no skill mastery in vocabulary and very low mastery in summarizing, closely followed by grammar and inferencing. The basic textual comprehension skills of explicit and implicit processing were higher, although still low. Students who speak English only or speak both English and other languages at home did not show much difference in skill mastery levels; however, their mastery levels differed from students who speak other languages at home.
Relationship between reading skill profiles and responses to HDF
Students’ responses to the reports showed clear trends when comparing students who were full skill masters (111111) and those who were full skill non-masters (000000). Skill masters were more likely than non-masters to show more frequent responses conveying interest in the quality of their performance. Of the skill masters, 33% expressed affect more frequently compared to 17% of the non-masters. The relationship between skill mastery level and students’ responses focusing on performance quality was statistically significant, r = .37, p = .02. Considering that immigrant children demonstrated lower skill mastery profiles, their responses to HDF were similar to patterns observed with general low skill masters, which featured relatively more interest in test results than in improving skills.
There was no statistically significant difference in agreeing on the reported skill mastery level between skill masters and non-masters. Both high and low masters disagreed in approximately the same proportions regarding the report’s skills (56% vs. 67% respectively).
What is the relationship between students’ perceived reading ability and their responses to HDF?
Perceived ability profiles
Students’ self-assessments were similar across six skills, and the only self-assessed skill that was statistically significantly correlated with skill mastery estimates was vocabulary (r = .31). There were differences in perceived vocabulary ability among students with different home language backgrounds: MEnglish_only = 4.02; Mboth_languages = 3.62; Monly_other language = 3.17. Overall, students appeared to experience difficulty in differentiating their abilities among skills, estimating highly across skills. Table 3 shows correlations between skill mastery estimates and students’ self-assessments.
Correlations between cognitive diagnostic model-based skill mastery and self-assessments.

Note: EXP = textually explicit comprehension; IMP = textually implicit comprehension; INF = inferencing; GRM = grammar; VOC = vocabulary; SUM = summary; SA_ = self-assessed; **Correlation is significant at the .01 level (two-tailed); *Correlation is significant at the .05 level (two-tailed). N = 42–44.
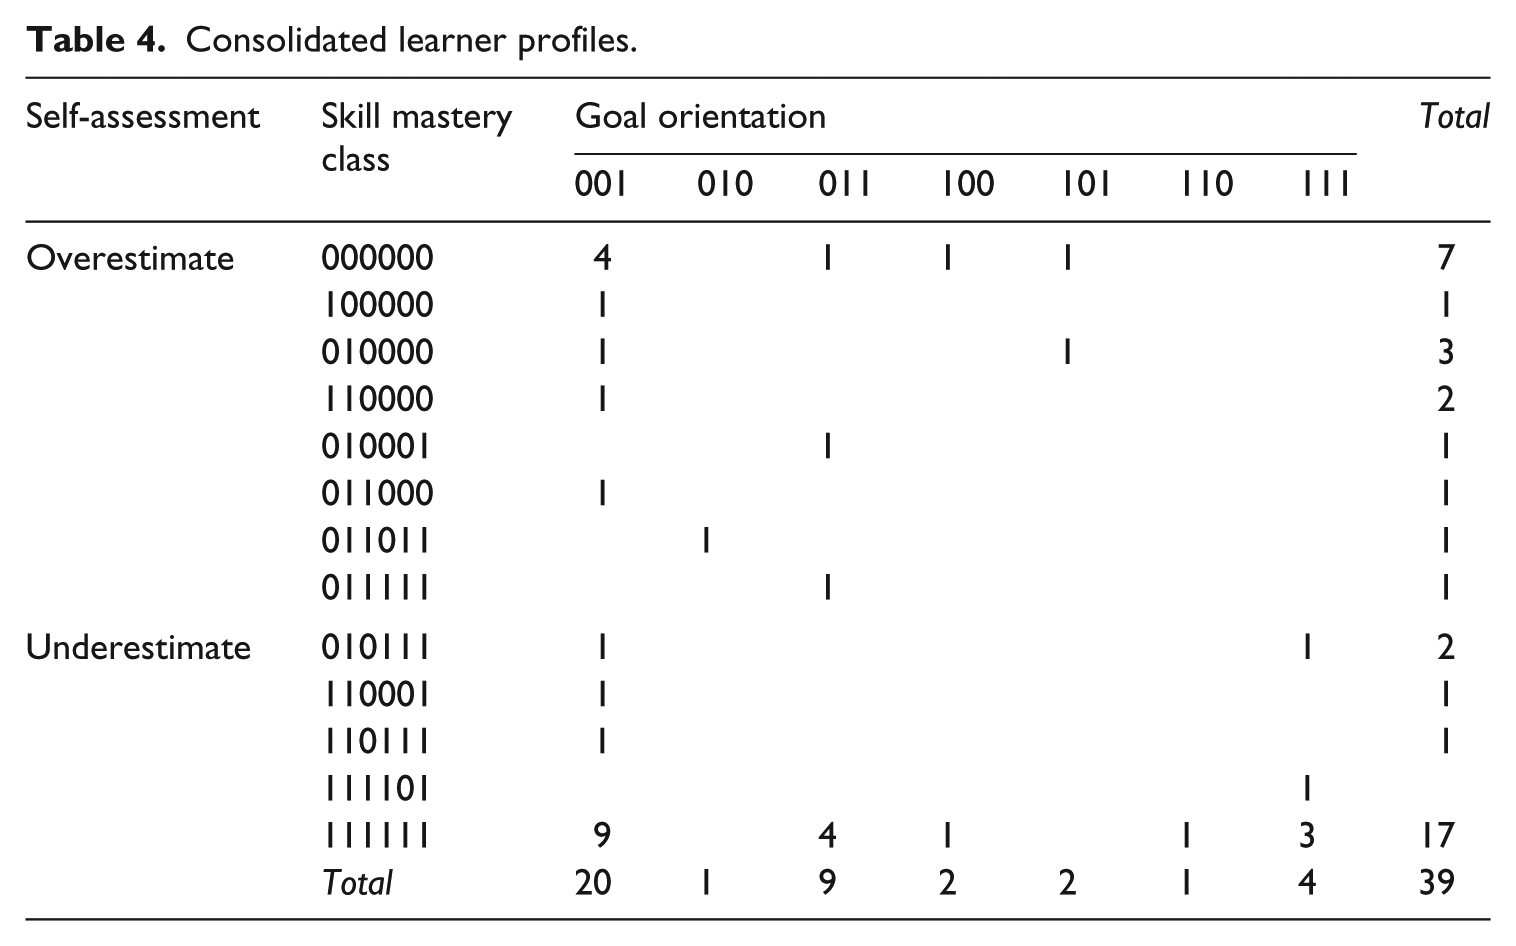
Students with low skill mastery estimates tended to overestimate their ability, whereas students with high skill mastery estimates tended to underestimate theirs. For example, 11 students who did not master any or mastered only one skill overestimated their ability. Further examination of discrepancies between self-assessment and skill mastery estimates indeed revealed that most students consistently overestimated or underestimated their abilities. Table 4 presents a distribution of consolidated learner profiles to show the relationship between students’ self assessments and mastery levels.
Consolidated learner profiles.
Relationship between perceived ability profiles and responses to HDF
Note that individual HDF reports presented both CDM-estimated skill mastery levels and self-assessed skill proficiency. Discrepancies between perceived ability and skill mastery estimates certainly dominated students’ attention and evoked emotional reactions. For example, one student wrote, “I am surprised that the guy is farther away than the ☺. I really just guess I need to work harder. I thought I knew more than I actually did” (Samar). Another student expressed his surprise by stating, “My smiley face is making me look arrogant! Yet I’m surprised the face and man aren’t equal” (Owen). Some students judged their test performance based on the degree of discrepancy. For example, two students noted that “I think I did pretty well on this part of the test. I’m glad that my “man” and “face” are close together” (Bob) and “I thought I did a great job and the red bar is really low, but the smiley face is so far back” (Leonardo). Overall, students’ self-assessments in comparison with estimated skill mastery levels appeared to draw students’ attention effectively and served as a reference for interpreting reported skill mastery levels.
How do students’ goal orientations influence their responses to HDF?
Goal orientation profiles
The majority of students (n = 20) were in the 001 class, indicating that they were largely mastery-oriented. Overall, immigrant students showed a higher performance-prove orientation than domestic students (F1,42 = 6.484, p = .015, partial eta2 = .134). Immigrant students’ perception about their parents’ performance-prove orientation (Mimm = .31) was higher than their domestic counterparts (Mdom = .17, F1,42 = 10.32, p = .003, partial eta2 = .20). Similarly, immigrant students’ perceived parent performance-avoid orientation (Mimm = 2.91) was higher than domestic students (Mdom = 2.12), and the group difference was marginally statistically significant, F1,42 = 4.22, p = .046, partial eta2 = .09. There was no statistically significant difference in students’ perceptions about their teacher’s goal orientations between immigrant and domestic students. Students’ goal orientations were not statistically significantly correlated with their skill mastery estimates as shown in Table 5.
Correlations between skill mastery and student goal orientations.
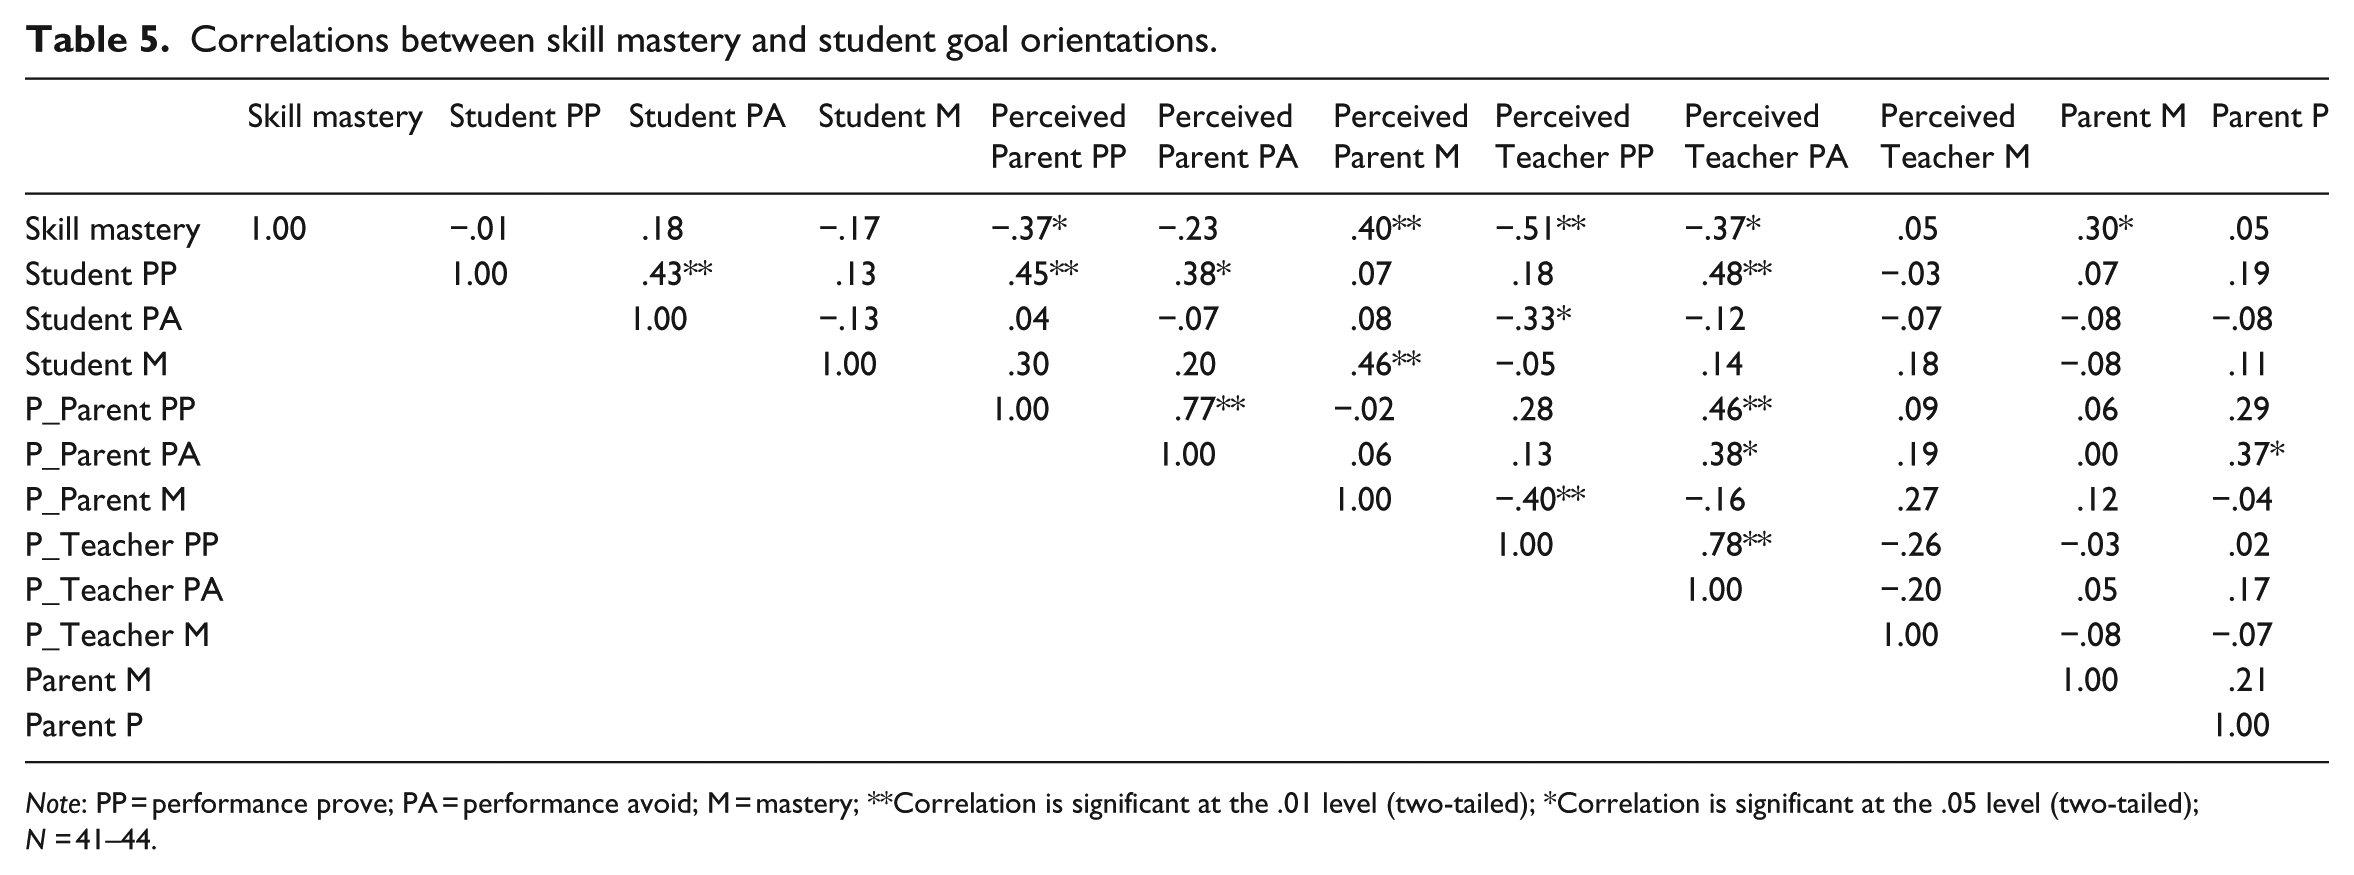
Note: PP = performance prove; PA = performance avoid; M = mastery; **Correlation is significant at the .01 level (two-tailed); *Correlation is significant at the .05 level (two-tailed); N = 41–44.
The correlational analyses further revealed that students’ own goal orientations were not statistically significantly correlated with their skill mastery estimates. However, students’ perceptions of their teacher’s and parents’ goal orientations were statistically significantly correlated with skill mastery estimates. Specifically, when students perceived their parents as holding a mastery orientation, they tended to show a higher skill mastery level (r = .40), whereas students’ perceptions about parents’ and teacher’s performance-oriented goal orientations were negatively correlated with their skill mastery estimates (r = −.37 for parents and r = −.51 for the teacher). Interestingly, students with a mastery orientation tended to perceive their parents to be mastery oriented too (r = .46). Parents’ mastery goal orientation (as actually reported by parents, not only perceived by their children) showed a statistically significant correlation with students’ overall skill mastery levels (r = .30).
Relationship between goal orientation profiles and responses to HDF
Despite no statistically significant association owing to small cell sizes, 80% of students with a performance-prove (PP) orientation showed five or more instances of commenting on their performance outcome. For example, Ken (100 profile) wrote on the report card, “Yes, I agree because I feel inbaresed [sic] when I do some thing that is easy for lot of people but hard for me.”
Students with a mastery goal orientation were the only students, in fact, who frequently showed an interest in improving specific skills (five or more times). For example, Muhammad (001 profile) responded to the report by stating that “Because learning reading help(s) me enjoy reading more, which makes me read more which makes me learn more.” In addition, mastery-oriented students’ emotional reactions tended to be positive reflecting their satisfaction with their performance with reference to their own expectations rather than in comparison to others, as shown in “I’m really happy with how I did. Usually I struggle with this. I think I should also practice more” and “I’m really glad that I surpassed what I thought. I was happy with my work” (Natasha).
Furthermore, mastery-oriented students tended to disagree on the reported skill mastery levels, whereas other students, who were non-mastery oriented (both PP and PA orientations), agreed with the reported skill mastery levels, χ2 (1, N = 38) = 8.83, p = .003.
Students’ responses to the reports also reflected their views of intelligence; that is, whether intelligence is incremental with effort or it is fixed. There was no substantial difference in the view of intelligence between high and low masters. However, a performance prove (PP) orientation was strongly associated with the fixed view of intelligence, χ2 (1, N=38) = 9.33, p = .002, while students with a mastery goal orientation showed incremental views of intelligence, χ2(1, N=38) =3.96, p = .047. For example, Owen (PP) repetitively stated that “I am amazed that I am smarter than I thought. It can’t be possible!” and “I’m glad that I know how much I know.” Students with the fixed belief of intelligence tended to attribute their poor performance to “I don’t think it’s too hard, but it’s just not fun” (Owen) or “I just didn’t show as much as I knew on the test than I really did know. I didn’t take it seriously (Jay).” On the other hand, students with the incremental belief expressed interest in improving their abilities by focusing on the areas for improvement noted on their reports. Renata wrote, “One of the skills I want to work on is my skill to make connections when I read text because it might help me enjoy and understand the story more.”
How do parents respond to their children’s HDF reports?
Overall, most of the parents found the reports “informative,” “extensive,” “concrete,” “accurate,” and “helpful.” Some parents noted that the report highlighted both strengths and weaknesses clearly. For example, Muhammed’s parent noted that “I think the report is a good way to get the children responsible & accountable for their own learning” while Seth’s parents stated that “the report highlights the strengths and weaknesses in a clear, measureable manner.” Several parents commented on information about students’ goal orientations and self-assessment results by stating that they were an “interesting way of assessing performance and comparing it to perception” (Seth’s parent), and “I think the report has merit. It tells me how my child likes to learn & also her enjoyment level” (Jessica’s parent). Zoey’s parent wrote, “She appears to self-assess lower than her actual score. However her written comments indicate more confidence.” Some parents asked for more specific information about criteria used to determine mastery levels in the reports and suggested that the reports should explain the criteria used for assessing their children.
The most common response among parents was on their children’s overall performance on the tests. Some were surprised because their children did not perform as well as they had thought they would. Some wrote, “I would have thought the scores would be higher so initially a little surprised” and “I wasn’t particularly surprised to see the mark Toby had received, considering that he has only been living in Canada for 7 months.” Others confirmed the report by stating that “The results are consistent with our observations of Owen’s ability.” A few parents expressed interest in knowing their children’s relative standing to a larger group of students by stating that “I am curious to find out how Ava did relative to her peers” or “It would be helpful if my son’s work can be compared with the rest of the grade 6 kids in Ontario.”
Most parent respondents stated that they discussed the reports with their children and took action, for example, by encouraging them to read a book and write its summary. Some stated that they discussed “her strong ability to interpret what she reads (direct or indirect) and her need to pay attention to grammar – this validates what we already knew (Jessica’s parents)” and “the importance of clearly understanding what he has read and then formulating his thoughts” (Evan’s parent). Jacob’s parent noted that he appeared “enthusiastic in discussing the report with me and was proud of his results. [He] would benefit from paying more attention in class and in spending more time reading a variety of books.”
Note that the reports sent home did not include any numerical scores. This appears to have helped parents to focus on their children’s strengths and weaknesses and maintain a positive tone. Some parents reported that they had discussed goals that their children set and their own expectations, while others discussed their children’s test-taking experience by stating that “she told me it [test-taking] was a positive experience. We agreed she needed to work on her grammar” (Nadine’s parent). Importantly, parents wished to receive more specific guidelines for helping their children to improve weak skills and wondered about how their teacher would address their children’s needs for further improvement.
Though the assessment is quite accurate, however it doesn’t really give guidance on how to improve/develop the areas mentioned. The goal is clear, but the ways to reach this goal is not clear. (Seth’s parent) I would like to know how (what resource materials) would help her to read/develop the right thinking skills or technique to reading comprehension. (Samar’s parent)
Discussion
Possibly the most crucial aspect of this study is understanding how learners with dif-ferent profiles respond to diagnostic reports (Beckmann, Beckmann, & Elliott, 2009; Orsmond, Merry, & Reiling, 2005). The feedback mechanism should be conducive to an individual’s ability to receive and process the feedback. The study’s findings regarding students’ responses to diagnostic feedback reports offers some interesting insights into the ways in which reports are perceived, interpreted and used by students, providing guidance for effective report design and then mediation by significant adults such as teachers and parents.
Students’ inflated and deflated perceived abilities deserve close attention. Certainly, incorporating them into HDF reports was an effective way to prompt deeper reflection and processing among students. Research shows similar patterns of discrepancies between students’ perceived ability and their actual performance (Dunning, Johnson, Ehrlinger, & Kruger, 2003; Ehrlinger & Dunning, 2003). However, as students became more aware of their limited skills through a subsequent intervention, inflated perception declined (Kruger & Dunning, 1999). Research further shows that young readers tend to overestimate their understanding of text, but this discrepancy declines with age (Anderson & Beal, 1995; Zabrucky & Ratner, 1986). Similarly, Butler and Lee (2010) suggest that overrated self-perception can be adjusted as young students develop enhanced cognitive understanding upon reaching the higher grades in elementary school. The study results clearly demonstrate that including self-assessments in HDF prompts students’ critical reflection and subsequent planning for learning (Butler & Winne, 1995; Hattie & Timperley, 2007). Considering inflated and deflated perceived abilities, it is important to provide students with the opportunity to develop self-assessment abilities. Teachers’ guidance of student self-assessment is necessary for ensuring the effective use of HDF (González, 2009).
Unsurprisingly, how students respond to HDF differs predominantly by their goal orientations, which makes sense given that goal orientations affect how individuals make meaning of learning evidence and how they set learning goals (Dweck, 1986). Few differences in responses were observed between high and low skill mastery profiles, corresponding with the literature that a variety of goal orientations exist across the achievement spectrum (Dweck & Leggett, 1988). The result that students’ own goal orientations were not statistically significantly correlated with their overall skill mastery is not surprising. It is partly because mastery goal orientation is often not always positively related with achievement (Barron & Harackiewicz, 2001; Pintrich, 2000), although some studies have indicated that a performance prove orientation can be positively correlated with achievement (Elliot & Church, 1997). However, this study found no such relationship.
However, all students with a mastery goal orientation were much more likely than other students to disagree with their report content, indicating greater critical engagement with content. This finding demonstrates that mastery orientated students, even if applying cognitive strategies ineffectively, approach learning with attitudes that prepare them for persistent learning.
Finally, the study results indicate that students’ responses to HDF reports reflect their beliefs about intelligence. In particular, performance-oriented students tended to show the fixed belief of intelligence, while mastery-oriented students showed incremental beliefs. As goal orientation is malleable (Button, Mathieu, & Zajac, 1996), and this study has itself shown that young leaners’ achievement and perceptions about goal orientations interact in complex ways, we suggest that the observed relationship between goal orientation and intelligence beliefs provides evidence that an environment, through results reporting and mediation, that encourages students to view intelligence as incremental would be sound educational practice.
The study indicates that children’s perceptions about their parents’ goal orientations exerted stronger effects on their achievement than their perceptions about their teacher’s goal orientations. Higher student mastery orientation was positively associated with higher perceived parent mastery orientation, and the same was true for students’ performance-prove orientation and perceived parents’ performance prove and avoid orientations. While studies support that parenting styles impact young learners’ goal orientations (Leung & Kwan, 1998; White, 1996), this study’s finding is pause for thought for parents and schools aiming to involve parents in students’ learning, especially because parents’ actual goal orientations were uncorrelated with their children’s goal orientation. It appears that what the child perceives is more influential than what the parent believes.
As Ames (1992) argues that students’ learning is hindered by excessive attention to external pressures, the tendency in this study for performance-oriented students to refer to performance outcomes when interpreting HDF reports is significant. Creating an environment that guides students with these tendencies toward referencing their own expectations rather than others’ may ameliorate risks of shallow learning among such students.
Conclusion
The present study was situated in a larger-scale research program aimed at identifying distinct literacy skill development patterns among students with different language background characteristics. We examined the feedback mechanism from the various angles of cognition, goal orientation and perceived ability. The study findings strongly indicate that students possess quite complex learning profiles and in turn, these learner characteristics mediate their perceptions, interpretations, and uses of diagnostic feedback. It is worth noting that young students’ cognitive and psychological traits are still developing, which makes it difficult to classify them into mutually exclusive profiles. There were a number of students whose goal orientations were indistinguishable among the three constructs, indicating that they had not developed distinct orientations to learning. As a result, young learners appear to be greatly influenced by their immediate surroundings including teachers and parents. It is worth mentioning that it was not students’ actual goal orientations but children’s perceived parent goal orientations that showed significant relationships with achievement levels. This implies that young students are likely to be influenced by learning environments, and such influences are further filtered through their own perceptions. Research on the feedback mechanism should take into account psychological factors in implementing and evaluating the feedback mechanism in classrooms.
We acknowledge some limitations of the study. The study findings were based on 44 elementary school students’ data collected from two classrooms in one school. An additional 59 students from three classrooms at an urban elementary school participated later in the study, which was not included in the present report. Owing to space limitations, we also did not report results from diagnostic feedback-mediated interventions that took place with students selected from the consolidated profiles. With the larger data set we will be able to examine further how students’ linguistic and cultural backgrounds influence their interpretations and actual use of diagnostic feedback.
We conclude that understanding students’ interactions with diagnostic feedback is critical for maximizing its effect. Students’ perceptions about ability and orientations to learning strongly influence the ways in which they process diagnostic feedback on their learning. Assessment feedback designers and significant adults guiding young learners need to be aware of the ways in which students’ responses can be guided toward deeper processing. Evidence of deeper processing includes referencing the self and personal goals, discussing areas for improvement, and speaking about ability as a changeable process.
Footnotes
Appendix
Statistics of goal orientation questionnaire.
Students’ goal orientation item.
| M(SD) | EFA Results |
|||
|---|---|---|---|---|
| Factor 1 | Factor 2 | Factor 3 | ||
| Performance Prove (PP) (Cronbach’s α = .89) | ||||
| It’s important to me that other students think I am good at the tasks we do. | 2.8(1.26) | .75 | ||
| I like to show other students that the tasks we do are easy for me. | 2.5(1.32) | .65 | ||
| It’s important to me that others tell me I am good at the tasks I do. | 2.5(1.32) | .70 | ||
| It’s important to me that I look smart compared to others doing the task. | 2.6(1.34) | .78 | ||
| I like to show other students that I’m good at the tasks we do. | 3.1(1.38) | .81 | ||
| Performance Avoid (PA) (Cronbach’s α = .84) | ||||
| I avoid asking questions that might make me look stupid. | 3.2(1.32) | .54 | ||
| It’s important to me that I don’t look stupid on tasks. | 3.3(1.34) | .59 | ||
| I try to look like I can do tasks even when I don’t really understand. | 2.1(1.12) | .22 | ||
| When doing tasks I really try to keep others from thinking I’m not smart. | 2.8(1.39) | .39 | ||
| I avoid tasks where other students might think I’m not smart. | 2.6(1.35) | .29 | ||
| When doing tasks I avoid looking like I have trouble doing the task. | 2.4(1.27) | .40 | ||
| Mastery (M) (Cronbach’s α = .86) | ||||
| It’s important to me that I learn a lot in tasks I do. | 4.0(.98) | .65 | ||
| When doing tasks I want to learn a lot of new skills. | 4.1(1.17) | .88 | ||
| I prefer tasks that make me learn new things. | 3.9(1.23) | .53 | ||
| It’s important to me that I really understand the tasks I do. | 4.3(1.07) | .73 | ||
| When doing tasks I want to learn as much as I can. | 4.1(1.09) | .68 | ||
| It’s important to me that I improve the skills that I use in tasks I do. | 4.0(1.19) | .68 | ||
| Eigenvalue | 5.79 | 3.36 | 1.28 | |
| Variance (%) | 31.48 | 17.14 | 4.9 | |
| Students’ perceived goal orientations of their parents and teachers. |
||||
| M | SD | |||
| Students’ perceived parents’ PP | ||||
| My parents would like it if I could show that I’m better at classwork than other students in my class. | 2.42 | 1.58 | ||
| My parents say that showing others that I am not bad at classwork should be my goal. | 1.67 | 1.21 | ||
| Students’ perceived parents’ PA | ||||
| My parents tell me that it is important that I don’t look stupid in class. | 1.74 | 1.36 | ||
| My parents don’t like it when I make mistakes in my classwork. | 2.82 | 1.24 | ||
| Students’ perceived parents’ M | ||||
| My parents want my work to be challenging for me. | 3.67 | 1.29 | ||
| My parents want me to understand concepts, not just do the work. | 4.52 | .99 | ||
| Students’ perceived teacher’s PP | ||||
| My teacher lets us know which students get the highest scores on a test. | 1.39 | .92 | ||
| My teacher points out those students who get good grades as an example to all of us. | 1.58 | 1.16 | ||
| Students’ perceived teacher’s PA | ||||
| My teacher says that showing others that we are not bad at classwork should be our goal. | 1.48 | .98 | ||
| My teacher tells us that it is important that we don’t look stupid in class. | 1.52 | 1.06 | ||
| Students’ perceived teacher’s M | ||||
| My teacher gives us time to really explore and understand new ideas. | 3.67 | 1.24 | ||
| My teacher thinks mistakes are okay as long as we are learning. | 3.81 | 1.23 | ||

Acknowledgements
We thank the editor and two anonymous reviewers for their constructive comments and suggestions. We would like to thank the Educational Quality and Accountability Office for providing the data used in this research. The opinions presented in this paper are solely those of the authors and do not necessarily reflect the opinions of EQAO.
Funding
This study was supported by the Social Sciences and Humanities Research Insight Program (No. 486987).