
Abstract
Cognitive diagnostic models (CDMs) have great promise for providing diagnostic information to aid learning and instruction, and a large number of CDMs have been proposed. However, the assumptions and performances of different CDMs and their applications in regard to reading comprehension tests are not fully understood. In the present study, we compared the performance of a saturated model (G-DINA), two compensatory models (DINO, ACDM), and two non-compensatory models (DINA, RRUM) with the Michigan English Language Assessment Battery (MELAB) reading test. Compared to the saturated G-DINA model, the ACDM showed comparable model fit and similar skill classification results. The RRUM was slightly worse than the ACDM and G-DINA in terms of model fit and classification results, whereas the more restrictive DINA and DINO performed much worse than the other three models. The findings of this study highlighted the process and considerations pertinent to model selection in applications of CDMs with reading tests.
Recent advances in a category of analytic methods collectively referred to as cognitive diagnostic models (CDMs; DiBello & Stout, 2007) show great promise for producing rich diagnostic information to aid learning and instruction (Rupp & Templin, 2008). A large number of CDMs have been proposed; however, they have been applied in only a limited number of occasions. One difficulty that practitioners face is that of how to select from such a large number of models (Jiao, 2009). As noted by Yi (2012), most previous studies using CDMs with reading comprehension tests adopted a single predetermined model. However, similarities and differences of different CDMs and the ways in which they can be applied to reading comprehension tests are not yet fully understood by researchers and practitioners. The purpose of the present study is to investigate the issue of how to select appropriate CDMs for cognitive diagnostic analyses of the Michigan English Language Assessment Battery reading test (MELAB; ELI-UM, 2003).
Literature review
The selection of CDMs for reading tests
An important decision that researchers make is that of choosing either a CDM that allows for compensatory relationships 1 among skills or one that allows for non-compensatory relationships among skills (Roussos, Templin, & Henson, 2007). With a compensatory model, a high level of competence on one skill can compensate for a low level of competence on another skill in performing a task. In contrast, with a non-compensatory model, a high level of competence on one skill cannot offset a low level of competence on another skill. Non-compensatory models have been more popular than compensatory models for cognitive diagnostic analyses. Some well-known non-compensatory models are the Rule Space Model (Tatsuoka, 1983), the Attribute Hierarchy Model (AHM; Leighton, Gierl, & Hunka, 2004), the Deterministic Inputs, Noisy And Gate (DINA; Junker & Sijtsma, 2001) model, and the Reparameterized Unified Model (RUM) or Fusion Model (Hartz, 2002). Two of the most well-known compensatory models are the Deterministic Inputs, Noisy “Or” Gate (DINO; Templin & Henson, 2006) model and the Additive Cognitive Diagnostic Model (ACDM; de la Torre, 2011). The earliest applications of CDMs were mostly with mathematics, where the solution is typically broken down into a series of steps. As all the steps must be successfully performed in order to solve a mathematics problem, it is generally agreed that non-compensatory models are appropriate for mathematics tests (Roussos et al., 2007).
However, in reading comprehension research, many researchers hold the view that reading skills are compensatory in nature. For example, Stanovich (1980) proposed a compensatory-interactive model, arguing that “a deficit in any particular process will result in a greater reliance on other knowledge sources, regardless of their level in the processing hierarchy” (p. 32). Goldsmith-Phillips (1989) tested Stanovich’s model using data from children in the second, fourth, and sixth grades and found a developmental trend that children increased using phonetic cues and decreased using sematic information for word identification. Goldsmith-Phillips regarded this finding as evidence in support of Stanovich’s model of the interactive-compensatory nature of reading comprehension. Bernhardt (2005) described a compensatory model of second-language reading, in which learners’ second-language knowledge and first-language reading ability compensate for deficiencies in each other during reading. Usó-Juan (2006) further concluded that one’s discipline-related knowledge and English-language proficiency compensate for each other when reading English for academic purposes. However, according to the Simple View of Reading (Gough & Tunmer, 1986), which is another influential model, reading comprehension (RC) is the product of linguistic comprehension (C) and decoding (D), that is, RC = C × D. Decoding refers to rapidly deriving a representation from printed input, whereas linguistic comprehension refers to deriving sentence and discourse interpretations from lexical information. As discussed by Hoover and Gough (1990), the two components have equal importance and neither can be sufficient by itself, which indicates a non-compensatory relationship. In summary, there is mixed theoretical evidence regarding whether reading comprehension is compensatory or non-compensatory, and it is not clear what CDMs should be used for reading comprehension tests.
When the relationships among cognitive skills are not completely known, it is reasonable to use a saturated CDM, which is flexible enough to accommodate different kinds of relationships among the skills. The log-linear CDM (Henson, Templin, & Willse, 2009), the General Diagnostic Model (GDM; von Davier, 2005a), and the G-DINA model (de la Torre, 2011) all offer a general framework that subsumes more constrained CDMs. However, compared with constrained models, saturated models are more complex and require a larger sample size to yield accurate estimates. In addition to the compensatory and non-compensatory relationships among the skills, another consideration in model selection is model complexity. Compared to the use of a complex saturated model, the use of simpler constrained models may lead to more straightforward and meaningful interpretations (Rojas, de la Torre, & Olea, 2012).
Review of previous CDM analyses of reading tests
Selection of the CDMs should be based on how well the model assumptions correspond to the theoretical basis used to construct a given test (von Davier, 2014). Nevertheless, most previous cognitive diagnostic analyses with reading comprehension tests used only one predetermined model without providing a justification for the model selection. As shown in Table 1, most of the earlier applications (e.g., Buck et al., 2004; Buck, Tatsuoka, & Kostin, 1997; Kasai, 1997; Scott, 1998) used the Rule Space Model, which classifies examinee item responses into categories of cognitive skill patterns. The study by von Davier (2005a) proposed and applied the GDM to TOEFL data. A few more recent studies (Jang, 2009; Jang, Dunlop, Wagner, Kim, & Gu, 2013; Kim, 2014; Li, 2011; Zhang, 2013) used the RUM (i.e., the Fusion Model) or the Reduced RUM (i.e., RRUM) estimated by the Arpeggio software (Bolt et al., 2008). The full RUM includes a residual parameter that indicates the degree to which the item response function relies on skills other than those assigned by the Q-matrix, whereas RRUM does not include this parameter. In addition, Wang and Gierl (2011) used the AHM, and Ravand, Barati, and Widhiarso (2012) used the DINA model. In summary, with the exception of von Davier (2005a), all the studies reviewed above used non-compensatory CDMs without justifying the choice of model.
Summary of studies on cognitive diagnostic analyses of reading comprehension tests.
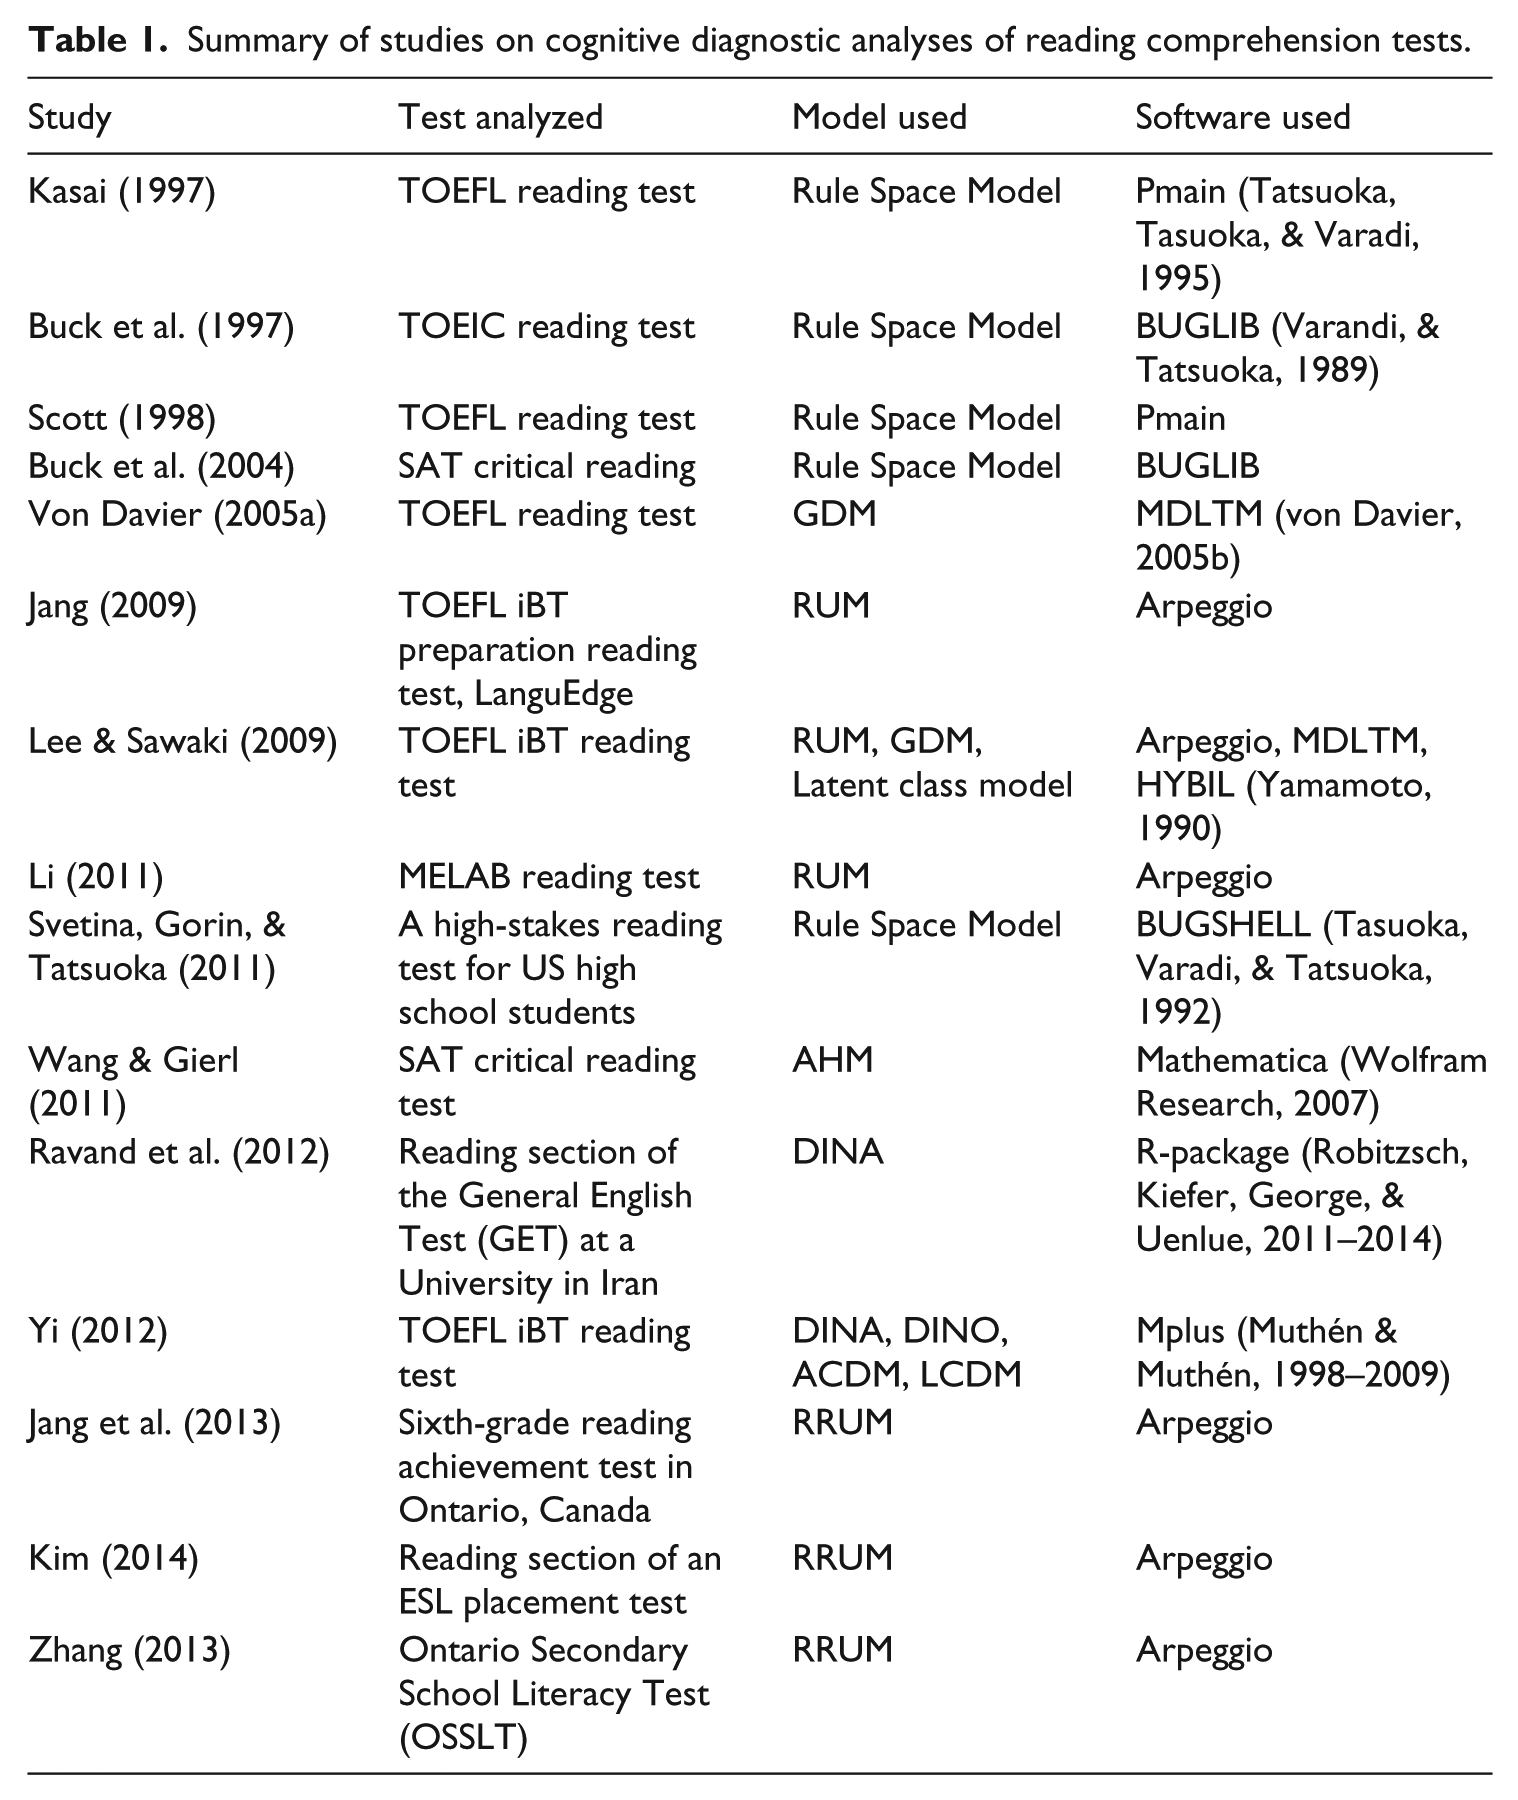
Only two of the studies listed in Table 1 used multiple models. Lee and Sawaki (2009) applied three different models to iBT TOEFL reading and listening data. The RUM and the latent class model used in the study are non-compensatory, whereas the GDM is a general model. Lee and Sawaki had to use three different software programs to estimate the three models one at a time: MDLTM for GDM, Arpeggio for RRUM, and HYBIL for latent class model. There were no common fit statistics on which the authors could base their judgment of the model fit. Lee and Sawaki thus relied on comparing examinees’ classification results across the three models, reporting similar results for all three models. Recently, Yi (2012) compared the results of four constrained models (DINA, DINO, NIDO, ACDM) and one general model (LCDM) using Mplus code. She found that the ACDM (i.e., the constrained model) functioned exactly the same way as the LCDM (i.e., the saturated model). RRUM is a constrained model of the LCDM and can be defined within the LCDM framework (Chiu & Köhn, 2015; Henson et al., 2009). However, owing to limitations of the software at the time when the study was conducted, Yi was unable to estimate the RRUM, a non-compensatory counterpart of ACDM, within the LCDM framework along with other constrained CDMs. In fact, she used RRUM results from Lee and Sawaki (2009) for the comparison, which was estimated using the Arpeggio software. Owing to this limitation, she did not obtain common model fit statistics across these models either. Thus, her findings were not conclusive regarding whether RRUM would function similarly to either ACDM or LCDM.
CDMs are often tied to specific software programs, and thus the availability and usability of software is an important concern in model selection as well. Table 2 summarizes common software programs that have been used to estimate CDMs for reading tests. The BUGSHELL, which is used to estimate the Rule Space Model, runs under the LINUX System (Tatsuoka & Tatsuoka, 2009). This could be challenging for practitioners not familiar with LINUX. Further, Arpeggio is frequently used to estimate the RUM (or RRUM). Arpeggio uses the Markov Chain Monte Carlo (MCMC) estimation procedure, which could be computationally intensive and time consuming. In addition, the AHM is estimated using code written in the Mathematica program, which is mostly used for technical computing and may not be familiar to educational researchers. In sum, these three software programs are limited in that each can be used to estimate only one model and each is relatively technically challenging for practitioners.
Summary of software programs used to estimate CDMs for reading tests.
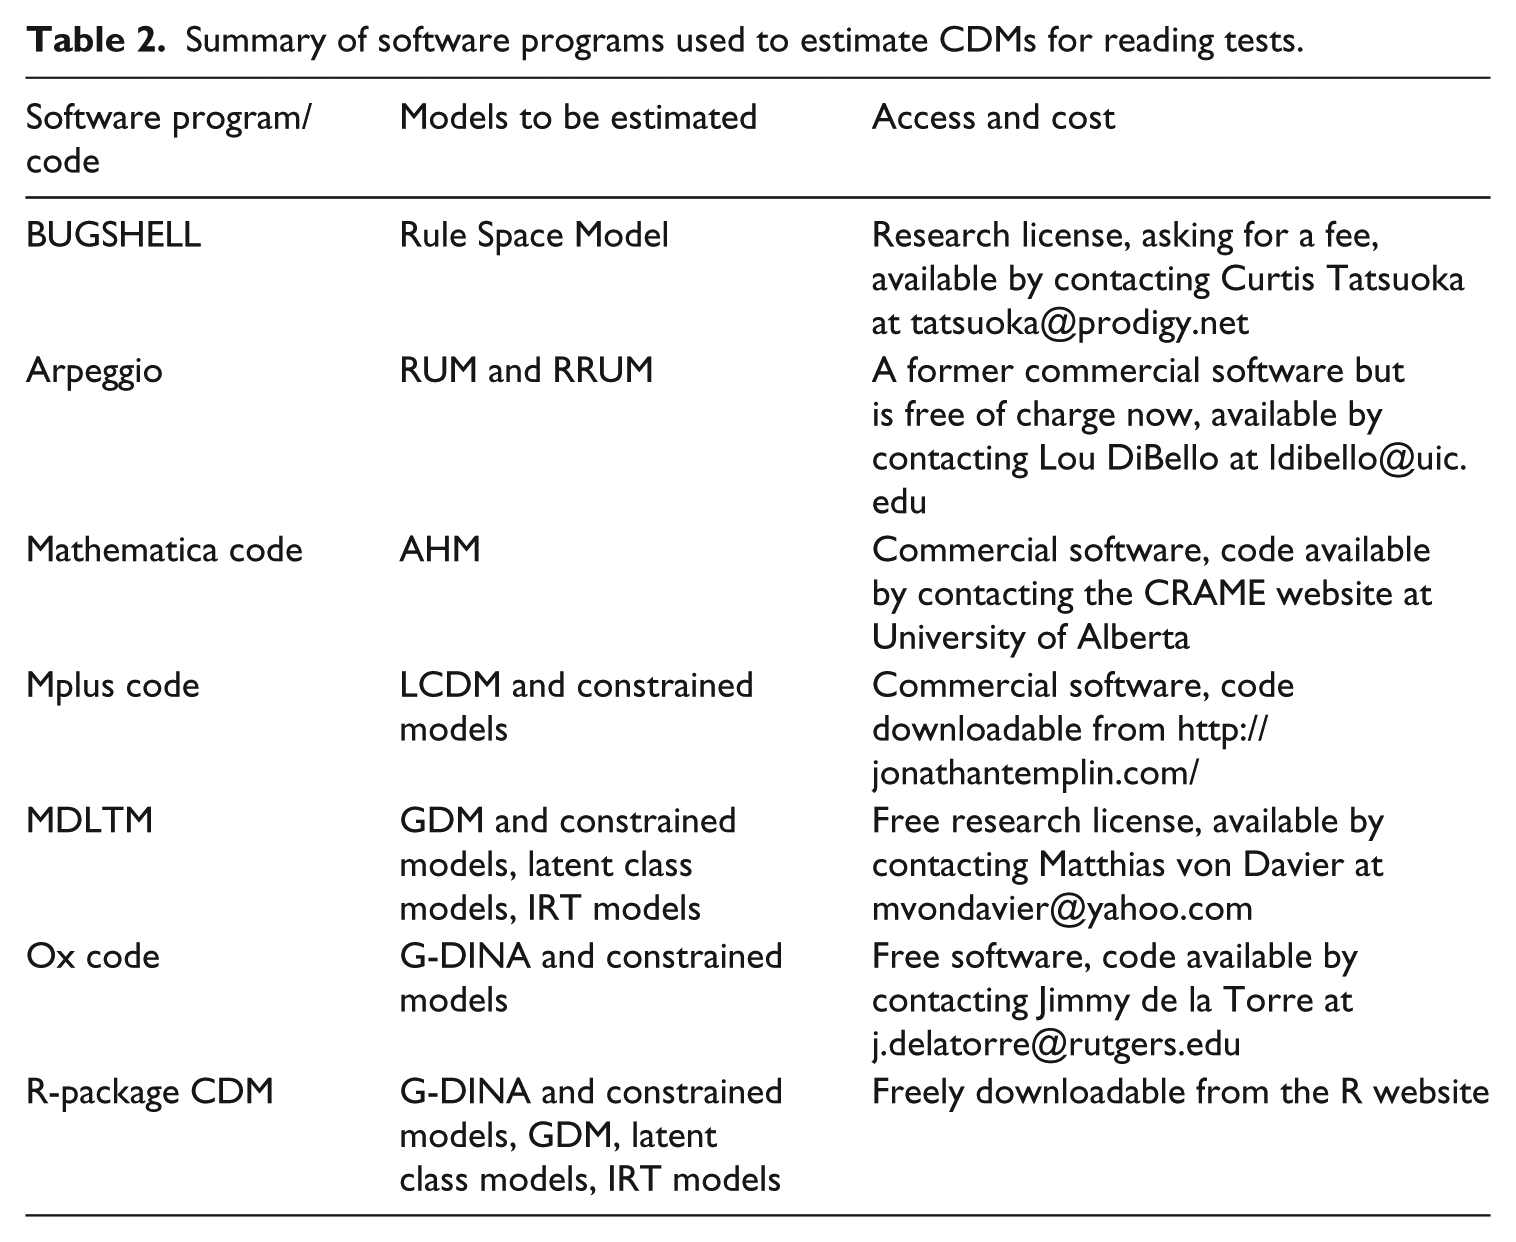
Another three software programs are the Mplus code for LCDM (Templin & Hoffman, 2013), the Ox (Doornik, 2002) code for G-DINA, and the MDLTM software for the GDM. Using an EM-algorithm, the MDLTM and the Ox code are very efficient such that convergence can be achieved in seconds or minutes (Rupp & Templin, 2008). The Mplus code for LCDM uses an accelerated E-M algorithm, and estimation time could be an issue (Templin, 2009). Finally, it is worthy to note that the R-package CDM used in the present study is probably the most comprehensive software for estimating CDMs currently available (Ravand & Robitzsch, 2015). This package estimates the G-DINA and its constrained models (including hierarchical or multi-group models), the GDM, latent class models, and various IRT models. The R-package is also very efficient with the maximum likelihood estimation. Furthermore, the R-package produces a number of informative model fit indices (Lei & Li, 2014). In summary, as a free and widely used software program, the R-package CDM has great potential to meet the needs of a large number of CDM users.
CDMs used in the present study and the model fit indices
In the present study, we compare the performance of a saturated model (G-DINA), two compensatory models (DINO, ACDM), and two non-compensatory models (DINA, RRUM) for a cognitive diagnostic analysis of the MELAB reading test using the R-package CDM, version 3.2–6. All the models investigated in this study are available in R-package CDM. The following is a brief introduction to these five CDMs and the model fit indices reported.
The saturated G-DINA model classifies examinees into

where δj0 is the intercept that represents the probability of a correct response when none of the required skills is present;
The study by de la Torre (2011) illustrated several constrained CDMs as special cases of the G-DINA. Specifically, the DINA model can be obtained by setting all the parameters in Equation 1 to zero with the exceptions of δj0 and δj12
Furthermore, when all the interaction effects in Equation 1 are constrained to zero, the model becomes an additive CDM (ACDM; de la Torre, 2011) and is compensatory. There are two parameters per item for both the DINA and DINO, whereas there are
The R-package CDM produces three relative fit indices: Akaike’s Information Criterion (AIC) = −2LL + 2P, where P is the number of parameters; Bayesian Information Criterion (BIC) = −2LL+ P ln[N], where ln[N] is the natural log of sample size; and −2 log-likelihood (−2LL). With a simulations study, Lei and Li (2014) showed that AIC performed the best among the three, whereas −2LL always selected the saturated model. The R-package also produces a few absolute fit indices. Among them, the MX2 (Chen & Thissen, 1997), which is the average of the χ2 test statistics of independence for pairwise item response frequencies over all item pairs, was found to have relatively high power in detecting model misfit (Lei & Li, 2014). The MADcor (DiBello, Roussos, & Stout, 2007) and the MADres (McDonald & Mok, 1995) generally showed acceptable power. The MADcor is the average of absolute deviations between observed and predicted pairwise item correlations across all item pairs, and the MADres is the average of absolute values of pairwise item covariance residuals across all item pairs. In the present study, we compared these fit indices across the five models. It is expected that the saturated G-DINA model would produce the best absolute fit indices because this model is highly parameterized but a more constrained model might produce better relative fit.
Methods
Data sources
Response data was collected from 2019 examinees for the MELAB Form E. The MELAB evaluates advanced-level English-language competence of adult nonnative speakers of English who expect to use English for academic studies in an American university setting. Designed to assess examinees’ understanding of college-level reading texts, the MELAB reading test consists of four passages, each of which is followed by five multiple-choice items (ELI-UM, 2003). As stated in the MELAB technical report, the MELAB reading passages are mostly expository excerpts from publications for a general adult audience. The content is not typically common knowledge. According to a standard readability formula based on sentence length and syllables per 100 words, the MELAB passages are rated at the college level (ELI-UM). The MELAB reading test included four passages and 20 multiple-choice items.
To enable the use of CDMs, a critical input is a Q-matrix (Tatsuoka, 1983), which is a mapping between items and skills. In the context of a reading test, different Q-matrices represent different hypotheses about which reading skills are required to correctly answer each item. Regarding the question of “whether separable [reading] comprehension subskills exist, and what subskills might consist of and how they might be classified” (Alderson, 2000, p. 10), researchers hold different positions. For example, a popular multi-factor model was proposed by Munby (1978), who argued that 19 micro-skills are required for reading comprehension, such as recognizing the script of a language, deducing the meaning and use of unfamiliar lexical items, understanding conceptual meaning, understanding the communicative value of sentences, recognizing indicators in discourse, having basic reference skills, skimming, scanning to locate specifically required information, and so forth. It is also argued that two factors underlie reading comprehension. These include either “vocabulary,” “decoding,” or “literal reading” as the first factor and “comprehension” or “inferential reading” as the second factor (Johnson & Reynolds, 1941; Pettit & Cockriel, 1974; Stoker & Kropp, 1960; Vernon, 1962). In summary, different reading component skills have been proposed for different reading tests.
Li and Suen (2013) adopted the view of multiple components of reading skills in their study. They built and validated a Q-matrix for the MELAB reading test form E based on evidence from related literature, students’ think-aloud protocols, and expert ratings. First, they proposed an initial reading framework based on the model of cognitive processes underlying the MELAB reading test developed by Gao and Rogers (2010) and the TOEFL iBT reading model constructed by Jang (2009). The list of reading skills of the MELAB and TOEFL fell into five categories: vocabulary, syntax, extracting explicit information, connecting and synthesizing, and making inferences. Second, with reference to this initial framework, they constructed an initial Q-matrix (i.e., mapping each item to one or more reading skills) based on evidence from students’ think-aloud verbal reports and the expert rating. Finally, this initial Q-matrix was further validated using preliminary empirical evidence. Because only two items were found to require the skill of inference, they decided to combine “connecting and synthesizing” and “making inferences” to a broader skill of “understanding implicit information.”
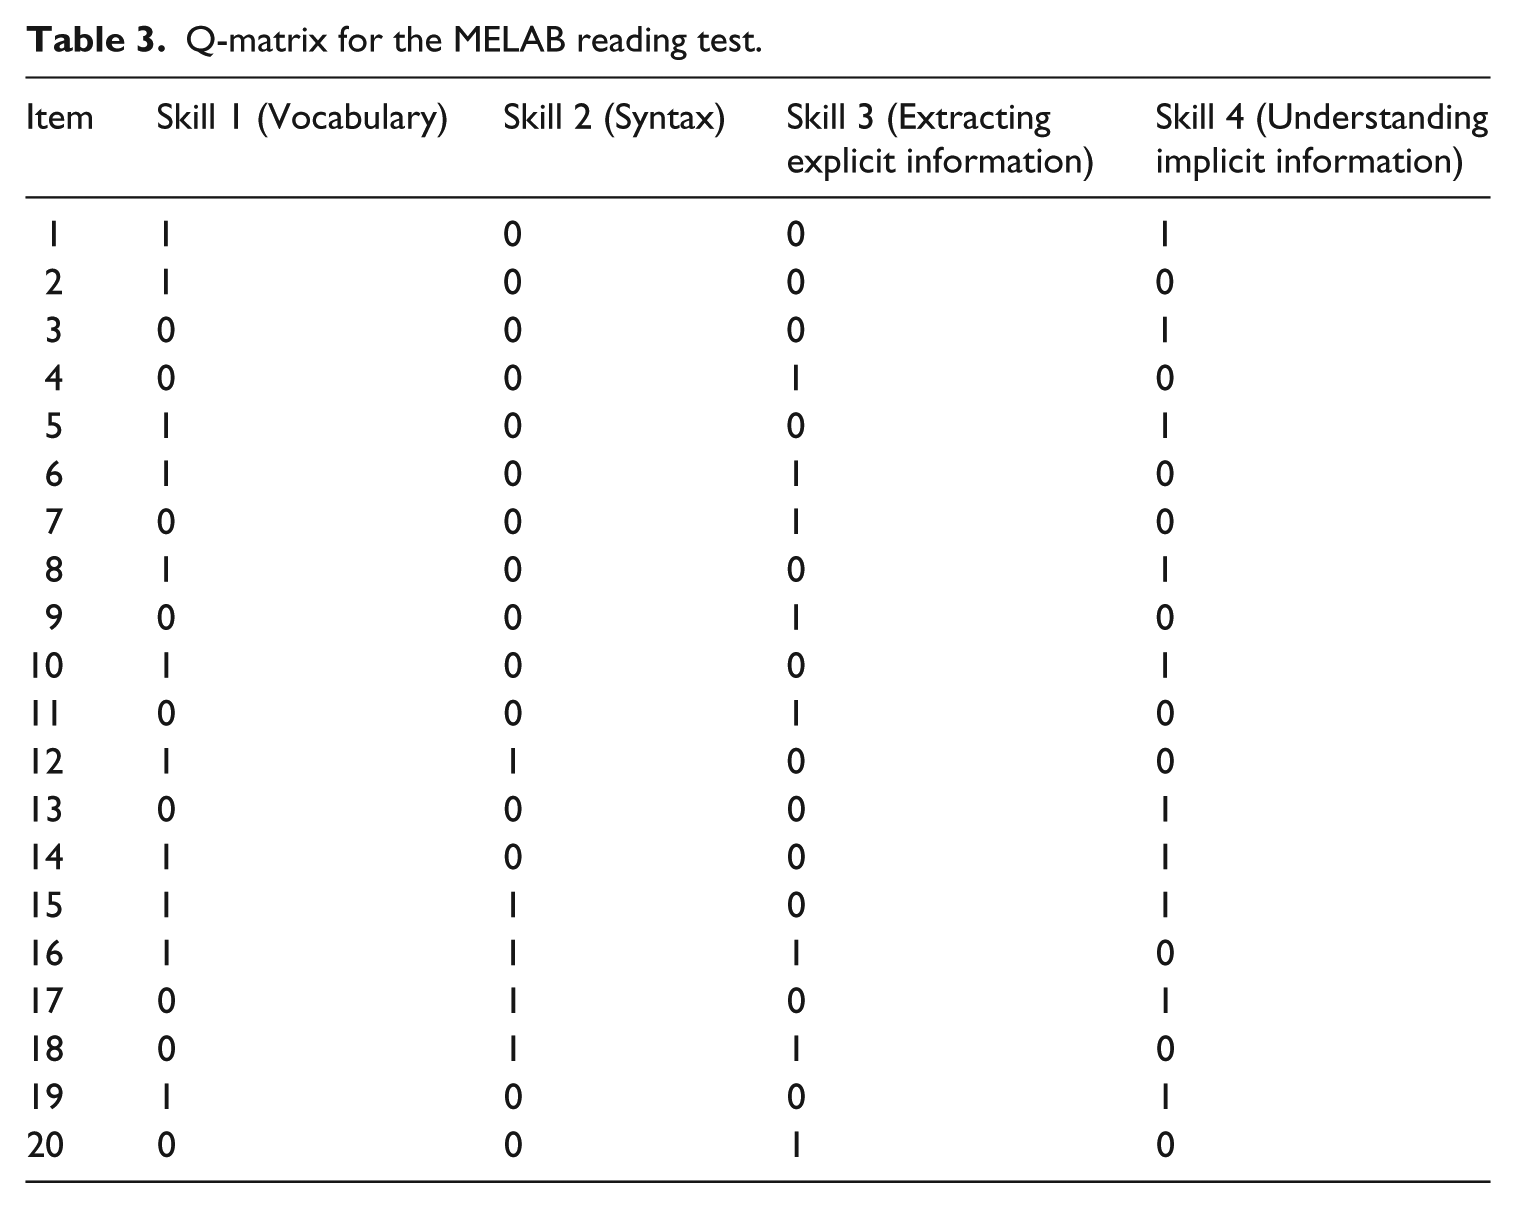
The final Q-matrix proposed in Li and Suen (2013), therefore, involved four skills: vocabulary, syntax, extracting explicit information, and understanding implicit information. The vocabulary skill refers to recognizing and determining the meanings of specific words or phrases using phonological/orthographic/vocabulary knowledge and/or contextual clues. Syntax refers to understanding sentence structure and sentence meaning using knowledge of syntax, grammar, punctuation, parts of speech, and so on. Extracting explicit information refers to matching lexical and/or syntactic information in the question to those in the relevant part of the text and identifying or formulating a synonym or a paraphrase of the literal meaning of a word, phrase, or sentence in the relevant part of the text. Connecting and synthesizing refers to integrating, relating, or summarizing the information presented in different sentences or parts of the text to generate meaning. As shown in Table 3, the number 1 indicates that the skill is required for a given item, whereas 0 indicates that the skill is not required for the item. Among the 20 items, eight items required one skill, 10 items required two skills, and two items required three skills. In total, there were 34 skill entries in the Q-matrix. The average skill per item was thus 1.7 (i.e., 34/20 = 1.7), which is higher than 1.3 in Lee and Sawaki (2009), 1.3 in Henson and Templin (2007) and 1.4 in Kim (2014) but lower than 1.8 in Jang (2005) and 2.4 in Yi (2012).
Q-matrix for the MELAB reading test.
Analysis procedures
The R-package CDM was used to estimate the five models (G-DINA, RRUM, ACDM, DINA, and DINO). The model fit was evaluated for each of the models, and then the skill classification results were compared across the five models. First, with four skills involved in the test, examinees could have 16 (i.e., 24) skill profile patterns. The proportions of examinees classified into each of the 16 skill profile patterns by the five CDMs were thus examined. Second, each examinee’s skill classification produced by the G-DINA model was compared to that produced by the other four models using the root mean square of the proportion difference and Cohen’s Kappa. As the saturated model, G-DINA is expected to produce the best absolute fit and hence classification accuracy. However, a constrained model that could produce similar classification results to the G-DINA would be preferred for parsimony. Therefore, the constrained model that had the most similar model fit and the most similar classification results to the G-DINA will be recommended.
Results
Model fit
Table 4 summarizes the model fit results of the five models and the number of estimated item parameters. With regard to −2LL and AIC, the G-DINA model had the lowest value, followed by ACDM, RRUM, and then DINA and DINO. This was to be expected because G-DINA was the saturated model. The BIC was lowest for ACDM, followed by RRUM, DINA, G-DINA, and DINO. This is probably because BIC generally imposes a large penalty for more highly parameterized models, and thus BIC for the saturated G-DINA was not low. The DINO model had the highest value for all three relative fit indices, indicating that this model had the worst fit among the four constrained models.
Model fit indices.
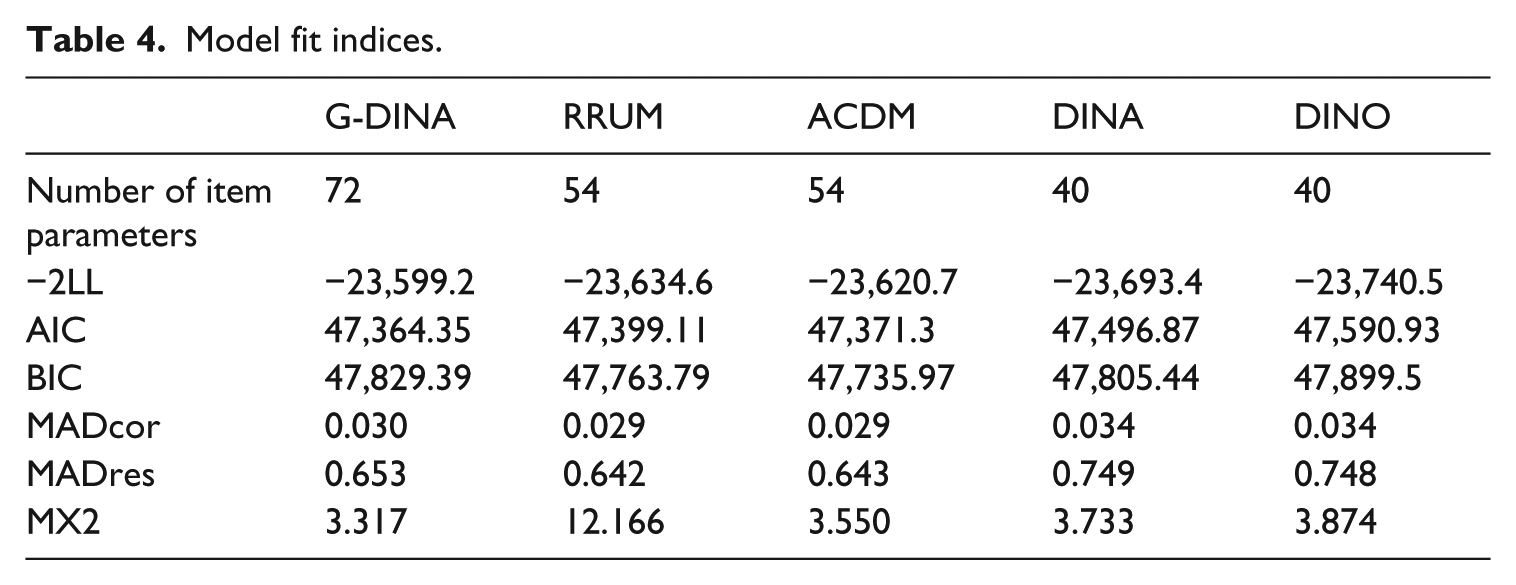
Owing to their relatively new development, the absolute fit indices of CDMs are under-studied such that there are no agreed-upon cut-off values for these indices yet. Therefore, we focused on comparing the absolute fit indices across the five models. Both MADcor and MADRres showed that the DINA and DINO models had a worse fit than the other three models. However, these two indices did not distinguish very well between G-DINA, RRUM, and ACDM. MX2, which according to Lei and Li (2014) is a well-performing absolute fit index, indicates that G-DINA fit the best, followed by ACDM, DINA, DINO, and RRUM.
In summary, the model fit indices show that (a) ACDM fit the data at least as well as the G-DINA did; (b) DINO had the worst model fit; and (c) RRUM generally fit better than the DINA or DINO.
Skill classification results
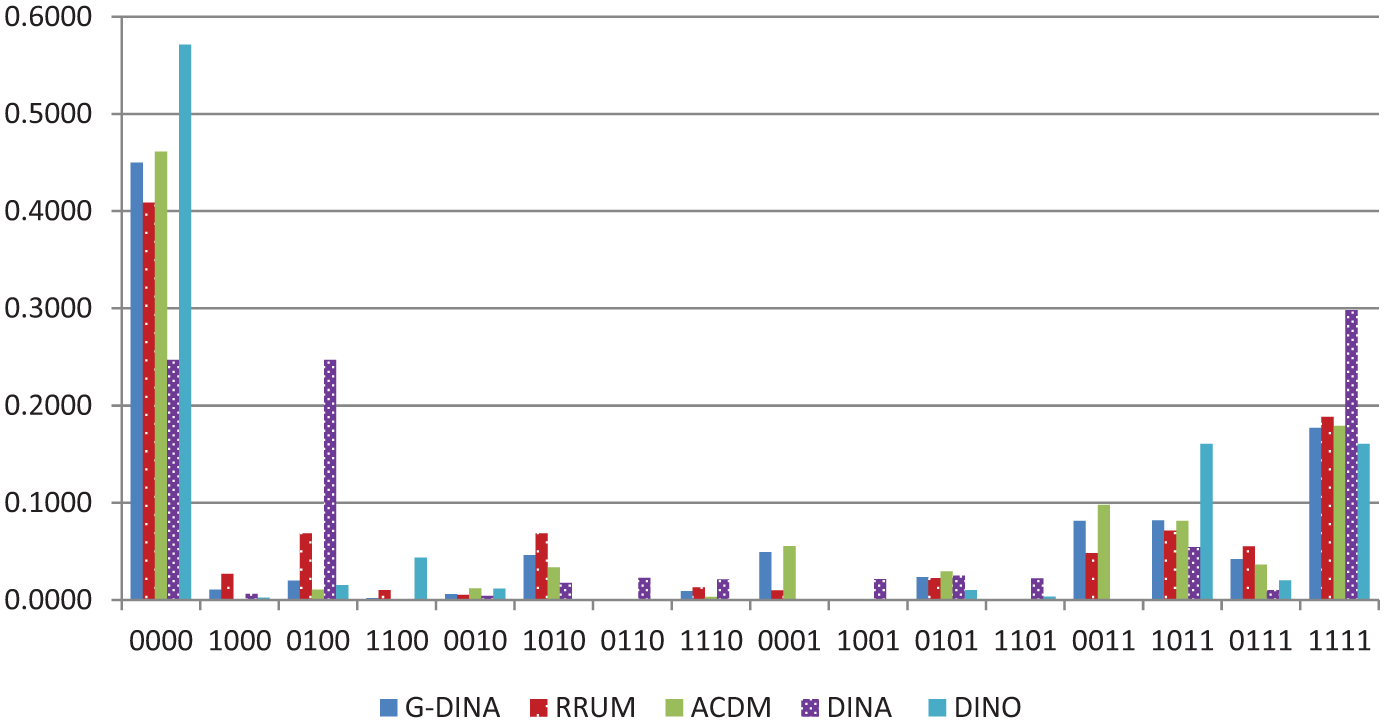
The proportion of the 16 skill profiles for the five models are presented in Table 5 and Figure 1, in which 1 indicates mastery of the skill and 0 indicates non-mastery of the skill. For instance, a skill profile of 1001 indicates that the examinee is a master of skill 1 (vocabulary), a non-master of skill 2 (syntax) and skill 3 (extracting explicit information), and a master of skill 4 (understanding implicit information). As indicated by the results generated by G-DINA, about 45% of the examinees fell into the category of 0000, which means that they had not mastered any of the skills. About 18% of the examinees fell into the category of 1111, which means that they had mastered all four skills.
Proportion of skill profile patterns across models.

Proportion of skill profile patterns across models.
In general, both ACDM and RRUM generated similar results to those generated by G-DINA, whereas DINA and DINO generated rather different results from G-DINA. Specifically, the root mean square of the proportion difference was .031 between G-DINA and ACDM, 2 .079 between G-DINA and RRUM, .347 between G-DINA and DINA, and .187 between G-DINA and DINO. This shows that the proportions of the 16 skill profile patterns were the closest between ACDM and G-DINA and that the proportions were also very similar between RRUM and G-DINA. Both DINA and DINO produced much different skill profile patterns from G-DINA, and DINA seemed to deviate from G-DINA more than DINO did.
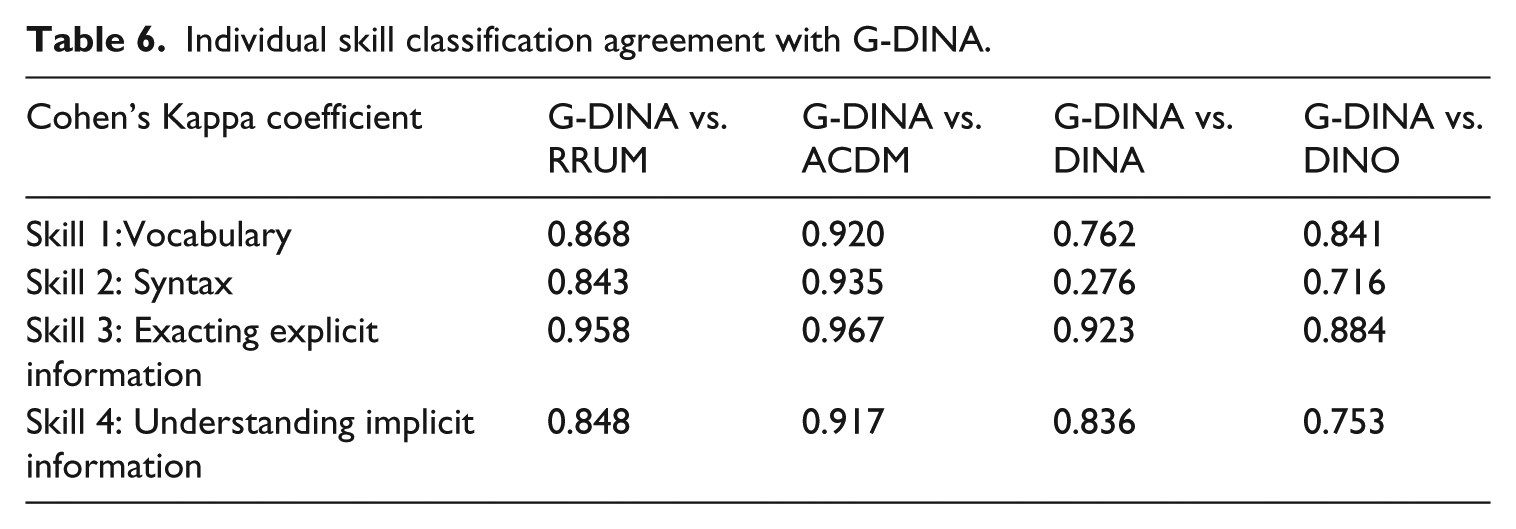
Furthermore, we compared each individual examinee’s skill classification profile produced by the G-DINA model to that produced by the other four models using Cohen’s Kappa. Cohen’s Kappa was computed with marginal classifications (i.e., masters and non-masters) for each of the four skills. As shown in Table 6, agreement was generally high for all four constrained models. For each of the four skills, Cohen’s Kappa was the highest between G-DINA and ACDM, at over .900 in all cases. This result indicates that the individual skill classification using ACDM is very similar to that produced by G-DINA. Cohen’s Kappa between G-DINA and RRUM was also very high. In summary, the model that produced the most similar skill classification results to those produced by the G-DINA was ACDM, followed by RRUM, DINO, and DINA.
Individual skill classification agreement with G-DINA.
Discussion
Comparison of the five CDMs
Compared to the saturated G-DINA, the ACDM showed comparable model fit and produced similar skill classification results, which agrees with Yi’s (2012) findings with the TOEFL iBT reading test. The ACDM is, therefore, recommended as an appropriate CDM for the MELAB reading test. In the present study, the G-DINA model estimated 72 item parameters, whereas the ACDM estimated 54 item parameters with the interaction terms among the skills being dropped. Given that the more parsimonious ACDM produced similar results to the saturated G-DINA, ACDM can be used instead of the G-DINA. Furthermore, because the ACDM can be defined from G-DINA by setting all interaction coefficients to zero (see Equation 1), the additive nature of the ACDM makes it easy to interpret the results. For instance, item 6 required skill 1 (vocabulary) and skill 2 (explicit information). The estimated intercept parameter δ60 was .3003, which was the probability to correctly answer item 6 when one did not master either of the skills. When skill 1 (vocabulary) was mastered, the probability of answering this item correctly would be increased by .1076 (
Furthermore, the RRUM was only slightly worse than the ACDM in terms of model fit and examinee skill classification results. For instance, the RRUM and ACDM were very similar in terms of the proportion of the 16 skill profile patterns. The Cohen’s Kappa coefficient was very high (ranging from .843 to .958) for the examinee skill classification between G-DINA and RRUM, which was slightly lower than that between the G-DINA and ACDM. Therefore, if RRUM had been used for the estimation, the results could have been similar to those produced by the ACDM or G-DINA.
Reading comprehension is a complicated process of “simultaneously extracting and constructing meaning through interaction and involvement with written language” (Snow, 2002, p. 11). Both DINA and DINO appear to be too restrictive for reading comprehension tests. DINA is completely non-compensatory, in that an examinee needs to master all the skills required by an item in order to answer the item correctly. For instance, item 16 requires skills 1, 2, and 3. According to the DINA model, an examinee cannot correctly answer this item if he or she has mastered only one skill or only two of the skills (either 1 and 2, 2 and 3, or 1 and 3). This may not fit the actual processes needed to answer item 16. Therefore, even though DINA has been most frequently studied in simulation studies to date, we do not recommend using this model for reading tests. DINO is completely compensatory in that examinees who have mastered only one of the required skills for an item have the same probability of answering it correctly as examinees who have mastered all the required skills. This is too restrictive and is unlikely to reflect actual reading comprehension processes. In fact, we are not aware of any published studies using DINO to model reading tests, and the present study provides further evidence of its inappropriateness for reading tests.
Choice between compensatory versus non-compensatory CDMs
Different CDMs mirror different theoretical assumptions about the relationships among the cognitive skills. By empirically comparing different models, the theoretical concepts on which they are based can be validated (George, 2013). The finding that ACDM, a compensatory model, performs better than RRUM, its non-compensatory counterpart, provides empirical evidence for the compensatory nature of reading skills (e.g., Bernhardt, 2005; Goldsmith-Phillips, 1989; Stanovich, 1980; Usó-Juan, 2006). However, it is important to note that the RRUM was only slightly worse than the ACDM in terms of model fit and skill classification results. Also, the RRUM shows much better performance than either the DINO (compensatory) or the DINA (non-compensatory). Therefore, there is insufficient evidence to rule out the alternative that reading skills could be non-compensatory. Also, we cannot draw a general conclusion that compensatory models are more appropriate than non-compensatory models for the MELAB reading test without considering model complexity (i.e., the number of item parameters in the model) .
Reading comprehension is a complicated process, involving dynamic interactions among the reader, the text, and the reading task (van den Broek & Kremer, 1999). Despite the large amount of literature in reading research, there is a lack of full understanding of the cognitive processes that underline reading comprehension (Rapp, van den Broek, McMaster, Kendeou, & Espin, 2007). According to Jang (2009), reading skills involved in the iBT TOEFL appeared to be a mixture of non-compensatory and compensatory interactions. Li (2011) also reported similar findings. Based on students’ think-aloud protocols, Li found that East Asian ESL students used their relatively more advanced comprehension skills to compensate for their deficiencies in English vocabulary and syntax knowledge. However, she also found that students with extremely low-level English-language proficiency could not compensate for this deficiency even when they were experienced readers in their native languages. Li, therefore, concluded that reading comprehension involve both compensatory and non-compensatory processes. This view also aligns with the fact that both compensatory (Stanovich, 1980) and non-compensatory (Gough & Tunmer, 1986) reading models coexist in the literature. Therefore, it seems that both compensatory and non-compensatory CDMs can be considered for cognitive diagnostic analyses of reading tests.
In fact, researchers have recently shown that some CDMs can be re-expressed as members of a larger family of models, which blurs the historical distinction between compensatory and non-compensatory CDMs (Rupp, 2012). For example, von Davier (2014) has demonstrated that the DINA model is equivalent to a special case of a more general compensatory family of diagnostic models (i.e., GDM). A multiplicative function can be quickly transformed into an additive function by using a log function. By all means, whether the CDM is compensatory or non-compensatory, the more required skills an examinee has mastered, the more likely he or she is to answer correctly the item requiring those skills. Therefore, at a macro-level, whether a compensatory or a non-compensatory model is used for reading tests is probably inconsequential. In addition to the choice between compensatory and non-compensatory CDMs, practitioners should also attach importance to model complexity, which could influence model fit and skill classification results substantially.
Conclusion, limitations, and future research
The lack of a full understanding of reading processes makes it difficult for practitioners to choose between the available CDMs. In this study, we compared the performance of a saturated model (G-DINA), two compensatory models (DINO, ACDM), and two non-compensatory models (DINA, RRUM) with the MELAB reading test. Compared to the saturated G-DINA, the ACDM showed comparable model fit and similar skill classification results, and the RRUM was slightly worse than the ACDM and G-DINA in terms of model fit and classification results. The more restrictive DINA and DINO performed much worse than the other three models. The ACDM is thus recommended as an appropriate CDM to analyze the MELAB reading test. In summary, selecting appropriate CDMs for reading tests involves many considerations, such as the relationship between the skills (e.g., compensatory versus non-compensatory), model complexity (i.e., the number of item parameters), and software availability and usability.
The present study also demonstrated a CDM selection procedure. First, the test data is analyzed with a saturated CDM and constrained CDMs. If a constrained CDM shows similar model fit and skill classification results to the saturated one, this constrained model can be used for the final cognitive diagnostic analysis. While the present study provided practical suggestions regarding model selection for reading tests, a major limitation is that it is based on one particular Q-matrix. Depending on the skills involved in a given test, multiple Q-matrices could be constructed for that test. Although the Q-matrix used in the present study was subjected to a rigorous validation process in Li and Suen (2013), we cannot claim that this Q-matrix is the only correct one. In particular, as discussed in Jang (2009), a noticeable indeterminacy involved in cognitive diagnostic assessment is the grain size of the skills. In the present study, we included only four skills in the Q-matrix, but more specific skills could have been specified. Alternative Q-matrices, especially the ones with a larger number of skills, may influence the model fit and skill classification results. In further research, multiple Q-matrices should be explored so as to examine whether the findings of the present study still hold. In addition, reading comprehension processes vary depending on student populations and the particular reading tasks involved. The present study has confirmed the findings reported by Yi (2012) who used a different reading test and different modeling procedure. Nevertheless, it still remains important to replicate and extend the present study to different reading tests and examinee populations.
Footnotes
Authors’ note
Paper presented at the 2014 Annual Meeting of Northeastern Educational Research Association (NERA), Trumbull, CT.
Declaration of Conflicting Interests
The author(s) declared no potential conflicts of interest with respect to the research, authorship, and/or publication of this article.
Funding
The author(s) received no financial support for the research, authorship, and/or publication of this article.