
Abstract
Literature provides consistent evidence that there is a strong relationship between language proficiency and math achievement. However, research results show conflicts supporting either an increasing or a decreasing longitudinal relationship between the two. This study explored a longitudinal data and adopted quantile regression analyses to overcome several limitations in past research. The goal of the study is to detect more accurate and richer information on the long-term relationship between language and math, taking into consideration the socioeconomic status, gender, and ethnicity background at the same time. Results confirmed a persistent relationship between math achievement and all the factors explored. More importantly, it revealed that the strength of the relationship between language and math differed for students with various abilities both within and across grades. Model comparison suggests that language demand contributes to the achievement gap between ELLs and non-ELLs in math. There also seems to be a disadvantage for the geographically isolated group in academic achievement. Interpretation and implications for teaching and assessment are discussed.
In 2014, the fifth edition of the Standards for Educational and Psychological Testing (AERA, APA, & NCME, 2014; hereafter, “Standards”) was published. One of the most obvious changes in this new edition is on the chapter “Fairness in Testing”. A new concept, “universal design,” was introduced. This concept is defined as “an approach to test design that seeks to maximize accessibility for all intended examinees” (Standards, 2014, p. 50). As it was elaborated later in Standards: Test items and tasks can then be purposively designed and developed from the outset to reflect the intended construct, to minimize construct-irrelevant features that might otherwise impede the performance of intended examinee groups, and to maximize, to the extent possible, access for as many examinees as possible in the intended population regardless of race, ethnicity, age, gender, socioeconomic status, disability, or language or cultural backgrounds. (2014, p. 50)
All tests employ language to measure achievement. Consequently, all test scores include variance introduced by students’ language proficiency. This issue of “construct-irrelevant variance” has already prompted scholars to pay close attention to the role of language in the quality of test scores (Haladyna & Downing, 2004). With the new goal of universal design, it becomes even more urgent to probe deeper into the relationship between language proficiency and academic performance. Research along this line is essential in order to define and measure the academic construct more accurately. The present study seeks to pursue an investigation in such direction. In this study, we focus on math as the intended subject.
Literature review
There are large amounts of research exploring the impact of language proficiency on math (Abedi & Lord, 2001; Aiken, 1972; Bailey, 2000; Cocking & Mestre, 1988; Schleppegrell, 2007). This relationship between the two has been widely explored by the testing community in the United States, owing to the obvious academic underachievement of the linguistic minority groups such as English language learners (ELLs) and the accountability responsibility No Child Left Behind (NCLB) brings (Abedi, 2004; Drake, 2014; Wright & Li, 2008). Overall, math achievement is found to be closely related to language proficiency, and this has been clearly documented for all K-12 grades (Abedi, Leon, & Mirocha, 2003, 2005; Brown, 2005; Han, 2008; U.S. Department of Education, DOE, 2008). This relationship has also been detected for various populations, including ELLs and non-ELLs, males and females, and students with both high and low socioeconomic status (SES) (Abedi & Lord, 2001; Drake, 2014; Kiplinger, Haug, & Abedi, 2000). As Abedi and Lord (2001) concluded, “this interaction between language and mathematic achievement is real” (p. 232).
Although there is strong evidence confirming the relationship between language proficiency and math, research is needed to understand how this relationship develops or whether it changes across time. There is limited research on the long-term relationship, and among those that exist it was mostly explored from the perspective of achievement gap between ELLs and native speakers (also called non-ELLs) owing to the obvious language disadvantage and academic underachievement of the former group. Additionally, results from these research studies are confusing. Some studies show that as students move up the grades, the achievement gap is increasing implying an increasing language impact on subject area achievement (Abedi et al., 2005; Fry, 2007). Others found that the achievement gap was decreasing implying a decreasing language impact on subject area achievement (Chang, Singh, & Filer, 2009; Galindo, 2010; Han, 2008). At least three confounding issues may have contributed to these conflicting results.
First, ELL status was defined differently in these studies. For example, Abedi et al. (2005) used a dichotomous ELL term but the meaning varied between districts. Some districts provided the information in the name of ELL status while others provided it in ESL (English as a Second Language) status. In one district, the ELL status had to be generated by the researchers based on years of bilingual education, which may be of a different nature from other names. Chang et al. (2009) divided their students into three groups: English-only (English), Dual-language-speaking (DUAL) and English-Language-Learner (ELL). These different criteria of classification obviously affected the meaning of the gap between ELLs and non-ELLs, thus leading to the possibly inaccurate depiction and non-comparability of the language impact across studies.
Second and related to the first point, the ELL composition in each study is different. For example, Abedi et al. (2005) studied the math gap for students from the 2nd to the 11th grade. However, every grade was formed by a separate group of students that belonged to that grade at the time of assessment. Fry (2007) found out that the decline in achievement from elementary to middle school was partly a result of a change in the composition of samples. He noticed that many former ELL students who caught up were no longer categorized as ELLs as they moved on to higher grades. At the same time, newly arrived immigrants were added to the ELL groups. In other words, the gap in math scores in these studies may not reflect the achievement gap relevant to language proficiency but the gap at the initial state. When the language impact is studied, it is hard to say whether it is really increasing or decreasing across time. In comparison, Han (2008), Chang et al. (2009) and Galindo (2010) used longitudinal data in which the students were traced for several years. The difference between these students might more accurately reflect the achievement gap between the two groups.
Third, none of the studies used a continuous measure of language ability as a covariate while estimating the math achievement gap. However, scholars have pointed out that the ELL group is actually heterogeneous in first language, cultural background, family history, socioeconomic status, and educational orientations (LaCelle-Peterson & Rivera, 1994). Variety even exists within the same ethnicity group (Reardon & Galindo, 2009). As a result, a simple group-based nominal or ordinal membership coding for ELL or non-ELL status is insufficient for any research to appropriately characterize the relationship between language proficiency and math achievement. To overcome this limitation, it is better to use a direct language measurement so that difference in language proficiency at the individual level can be taken into consideration (Chalhoub-Deville & Deville, 2008; Francis & Rivera, 2007). Our research uses high-quality longitudinal data and a vertically scaled reading score that benefits not only as a direct measure of language proficiency but also as a continuous measure available for all subjects, both ELLs and non-ELLs, across time.
Compared to the large amount of attention to the longitudinal and changing relationship between language and math across grades, very little attention was directed in the literature to the relationship that exists within a grade. Some studies on accommodation issues provided evidence for this aspect. For example, Freeman and Crawford (2008) demonstrated that a revised math curriculum that removed linguistic and cultural barriers was more effective with ELLs with higher language proficiency than those with lower language proficiency at the same grade. Kopriva et al. (2009) reported that math items in which sentences were reduced to phrases actually added to the difficulty of the items compared to items where language was modified but was still in a sentence format. Sato et al. (2010) reported that the same linguistic modification on test items has different effects on math scores for student subgroups with three different language proficiency status, including ELL, non-ELL but proficient in language arts, and non-ELL and proficient in language arts. Other studies implied that language does not affect low math ability students the same as it affects high math ability students (Abedi et al., 2005; Ausubel & Robinson, 1969; Butler & Castellon-Wellington, 2005; Chang et al., 2009; Fry, 2007; Galindo, 2009). In conclusion, the relationship between language proficiency and math achievement is not constant within or between grade(s). More research needs to be done to see how this relationship differs at various ability levels across the grades as well as within a grade.
A limitation of statistical approaches in past research adds to the motivation for the current research. All published research has revolved around a mean or an average pattern to represent a variety of possible patterns. In some studies, groups are compared based on mean math scores (Abedi & Lord, 2001; Reardon & Galindo, 2009). Other times, mean regressions are used (Brown, 2005; Chang et al., 2009). To study the differential relationship between language and math, the traditional approach would be to truncate the population into subgroups based on the unconditional math scores; mean regressions on each group could then be conducted separately. This approach, however, could create biased parameter estimates (Heckman, 1979). A more appropriate tool is quantile regression (QR) that can model more than just the central tendency. Readers interested in a detailed description of QR, can refer to Koenker (2005), Hao and Neiman (2007) or Chen and Chalhoub-Deville (2014). Suffice it to say, that QR overcomes the limitations of regular mean regression, and it is a method that has been successfully employed in many other fields to help detect differential relationships/patterns at different points of a distribution (e.g., Chevapatrakul, Kim, & Mizen, 2009; Pandey & Nguyen, 1999; Wei et al., 2006).
Study: Purpose, data, and analyses
The purpose of the present research is to explore the long-term and differential relationship between language proficiency and math achievement. A literature review has suggested the necessity of longitudinal data to capture better a long-term relationship between language and math. A direct measure of language proficiency at individual level is also desired. The current study also includes covariates such as gender and SES commonly used in past research. This study addresses three main research questions:
How does the relationship between language proficiency and math achievement vary within and across grades at different points of the math score distribution?
Does the math achievement gap between ELLs, former ELLs, and non-ELLs change as students move up the grades after language proficiency is controlled at the individual level?
How does math performance vary with respect to background variables such as gender and socioeconomic status after individual level language proficiency is controlled?
The data come from the Early Childhood Longitudinal Study, Kindergarten Class of 1998–99 (ECLS-K). The ECLS-K was developed under the sponsorship of the U.S. Department of Education, Institute of Education Sciences and National Center for Education Statistics. The ECLS-K follows a cohort of students from kindergarten to the 8th grade to measure their cognitive and social development. The specific set used in this study is the Kindergarten-Eighth Grade Full Sample Public-Use Data File especially prepared for longitudinal studies. (See the data set posted on the website http://nces.ed.gov/ecls/kinderdatainformation.asp.) Detailed information about this dataset can be located in the Combined User’s Manual for the ECLS-K Eighth Grade and K-8 Full Sample Data Files and the Electronic Codebooks (Tourangeau et al., 2009, hereafter referred to as the “Manual”) and the ECLS-K Psychometric Report for the Eighth Grade (NCES 2009-002) (Najarian, Pollack, & Sorongon, 2009, hereafter referred to as the “Report”).
There are seven waves of data collection in ECLS-K but, for several reasons, only data from the last four are used in this research. The ECLS-K data target students at different grade levels – kindergarten to grade 8 students in US schools. The present study focuses on the last four sets of data collection, which correspond to grades 1, 3, 5, and 8. Data sets related to kindergarten students are excluded because the construct is deemed to be different from later years of schooling. For instance, the Report (Najarian, Pollack, & Sorongon, 2009) state that some basic reading skills for kindergarten are not tested in subsequent grades because almost all children would have mastered them by the end of the first grade. Additionally, the ECLS-K sampling framework is different prior to the fourth data collection, which, if included, would make meaningful comparisons and generalizations unduly complicated. It is also important to note that the four waves of data used here were collected in spring, which helps circumvent likely learning loss over the summer (if there is any). In sum, the data sets included in the present study are large enough to answer the research questions posited without adding to the complexity of the interpretations.
The ECLS-K includes data from different measures. For the current study, direct reading and math assessments are selected to locate the reading and math scores. 1 Questionnaires from parents and teachers are examined to identify background variables of interest, including gender, socioeconomic status, and race/ethnicity.
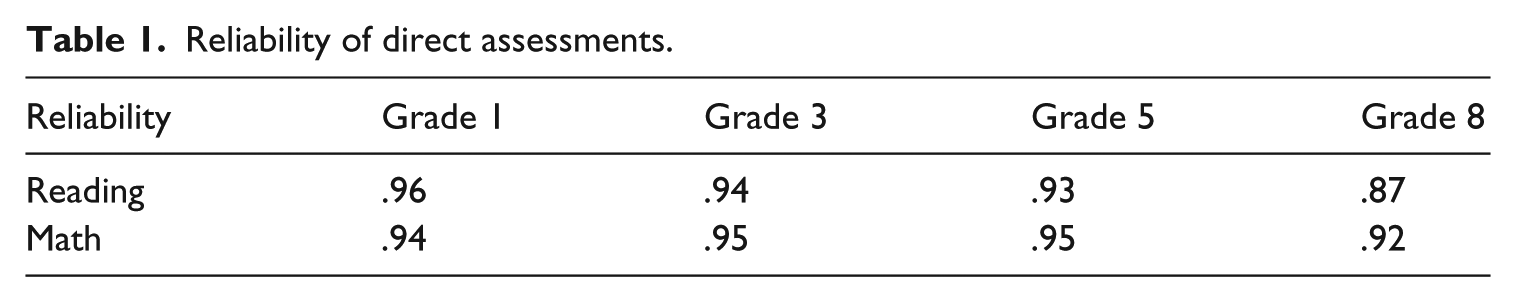
The ECLS-K scores are derived using the three-parameter IRT model and are vertically scaled across grades. The score range is 1–174 for reading and 0–212 for math. The Report (Najarian, Pollack, & Sorongon, 2009) documents the psychometric quality of the ECLS-K data and Table 1 reproduces the reading and math score reliability indices. As shown, all reliability indices are high.
Reliability of direct assessments.
Ideally, academic language proficiency (ALP) should be used as the independent variable given that ALP better represents the aspects of language proficiency that are more directly associated with academic performance (Bailey & Butler, 2003; Stevens, Butler, & Castellon-Wellington, 2000; Wilkinson & Silliman, 2000). However, such measurement is not available in ECLS-K. We use reading as a proxy for academic language proficiency for our purpose because it is deemed critical in academic performance (Mestre, 1988). Reading is also a variable frequently discussed and tested in research when language impact on math is explored (Brown, 2005; Glenberg et al., 2012; Grimm, 2008). More importantly, the use of reading scores makes it possible to investigate the relationship between language and math for all students, ELLs and non-ELLs. It is a measurement available for all individuals at all data collection points and is a continuous variable that can differentiate students’ language ability on a finer scale beyond a nominal ELL status variable.
To control for commonly recognized sources of variation in math achievement (Secada, 1992), the following variables are also included in the present study: ELL status, gender, socioeconomic status (SES), and race-ethnicity. There are three ELL status groups according to oral tests: non-ELLs (the reference group), former ELLs, and ELLs. SES is a weighted z-score based on parents’ income, educational levels, and occupations. Race or ethnic groupings are based on parent-reported data. It includes categories for White (the reference group), African American, Hispanic, Asian and Isolated. The Isolated group includes Native Hawaiians or other Pacific Islanders, American Indians, and Alaska Natives. This category is generated to test possible disadvantages in achievement owing to geographic isolation (see Drake, 2014).
As already mentioned, approaches for investigating the relationship between language and math traditionally have employed linear regression models including correlation analyses or extensions to ANOVA or MANOVA (Butler & Castellon-Wellington, 2005; Glenberg et al., 2012; Watts et al., 2014). In such studies, all the data points are lumped into one model and an average pattern is depicted. This average pattern can mask a variety of relationship patterns potentially possible. In the present study, quantile regression (QR) is used to model a series of patterns at different math ability levels in additions to linear mean regression (LMR) which serves as the base for comparison. The LMR is traditionally represented as

where i refers to the person and m refers to the specific independent variables. The independent variables are ELL, GENDER, SES, race-ethnicity and READING in this study.
The QR analyses are represented by the model

where i is the person, m is the specific independent variable, and p refers to the specific quantile regression for students at the pth percentile conditional math ability level. Seven quantile regressions are analyzed per grade to explore a possible differential language effect corresponding to the students with conditional math ability at the 5th, 10th, 25th, 50th, 75th, 90th, and 95th percentiles (quantiles).
The LMR and QR models (equations 1 and 2) are replicated for all four grades, which result in 32 grade level regression equations to be solved with 17 coefficients estimated from every full model. Standard errors are produced by bootstrapping with 1000 replications in STATA 10 and SAS 9.3. R program is used to generate tailored graphs to present the results more effectively.
Results from separate grades provide a starting place to build the longitudinal model. An overall longitudinal model is then built by collapsing all data into one file and by adding the grade (TIME) variable. The differential language impact on math across time is investigated through the interaction term TIME*READING. Similarly, TIME*GENDER, and TIME*SES document the shifting relationship between GENDER and SES with math achievement as students move up the grades. The same seven quantiles as in the grade level models are selected to see how all these effects vary depending on the students’ conditional math ability across the four grades. Grade level plots and results are presented first and changes across time are then addressed as the longitudinal model results unfold.
Results
Model results within each grade
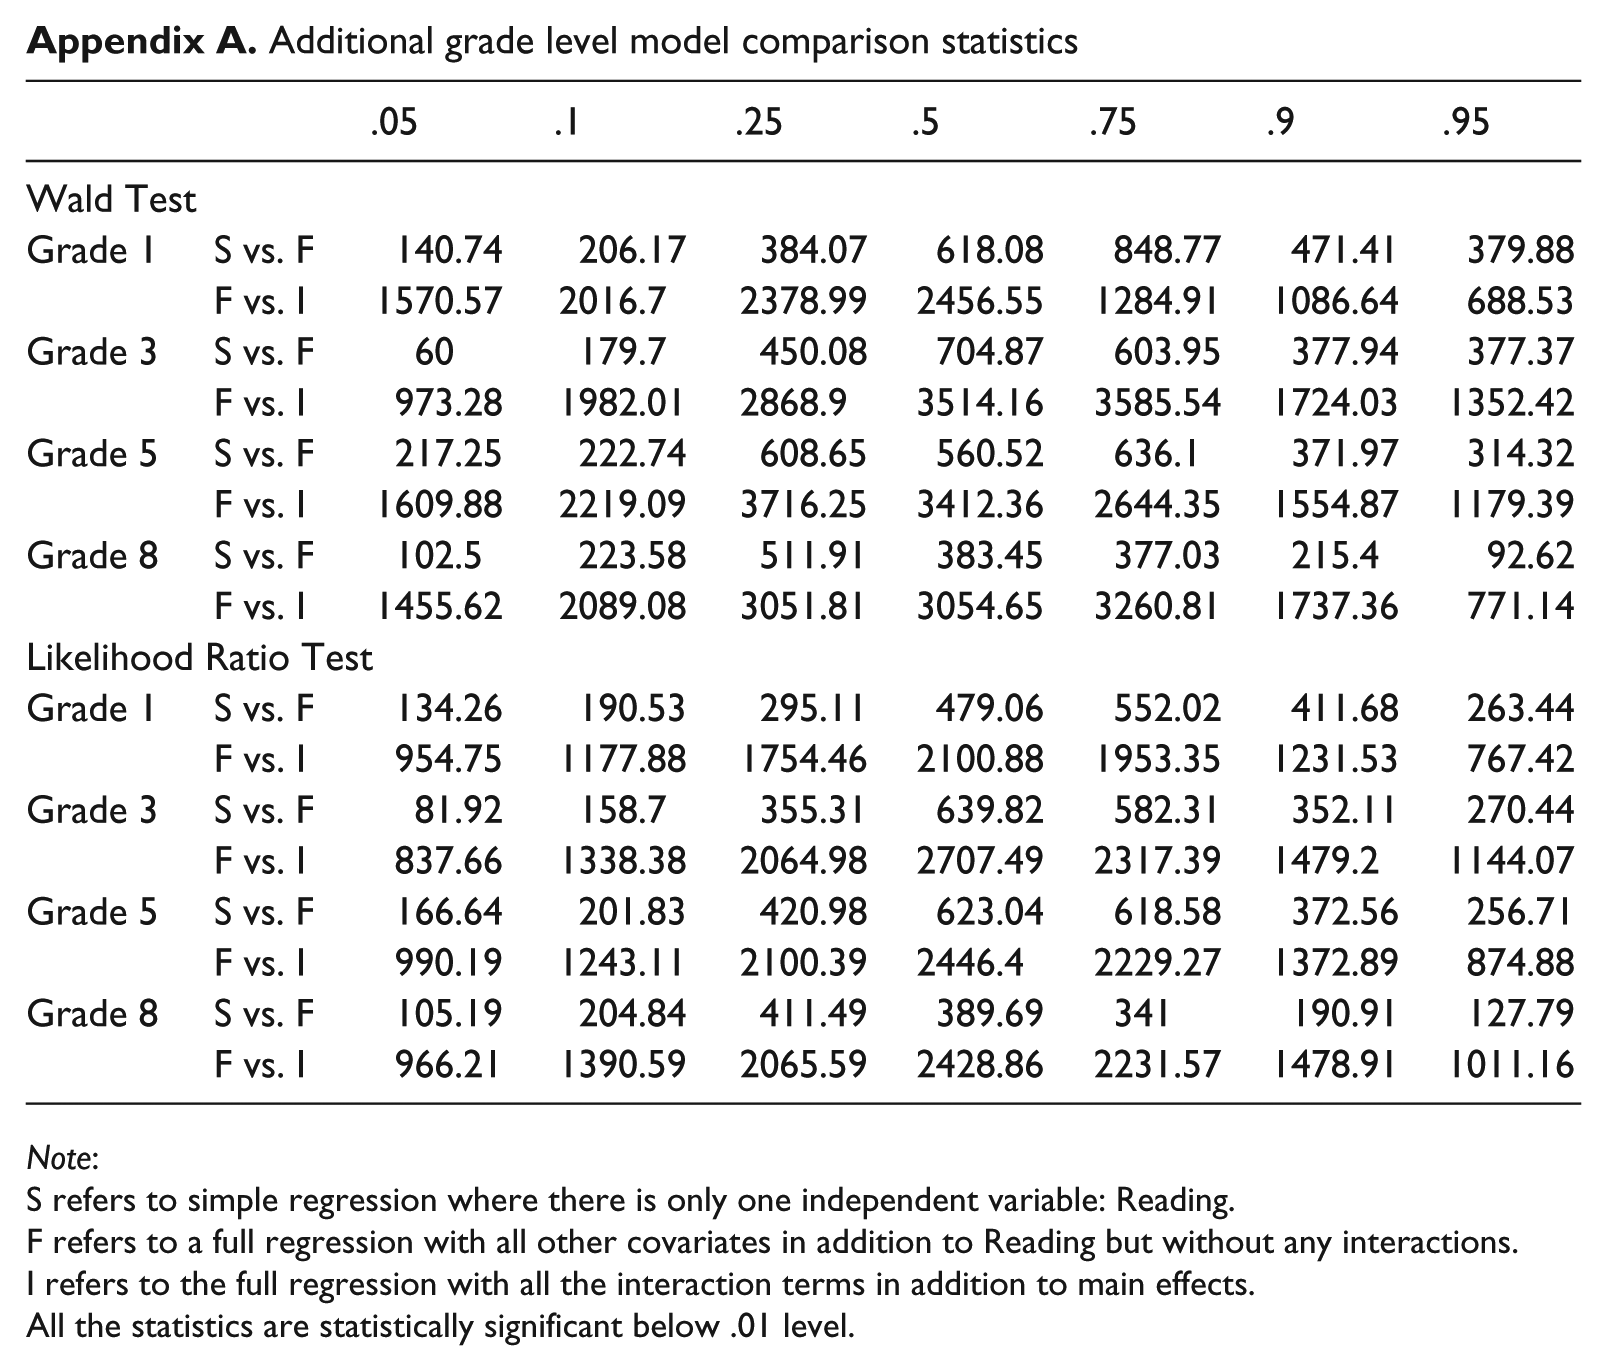
Table 2 reports the R2 for the LMR and the Pseudo-R2 for the QR analyses. The R2 for the simple regression indicates that READING by itself explains 44–54% of the variance in MATH scores at each grade. Adding SES, GENDER, RACE-ETHNICITY, and ELL status helps explain at most an additional 4% of the variance. Adding the interaction terms between READING and all these covariates explains, at most, an additional 1% of the variance. Pseudo-R2 statistics from QR analyses give the same message. Wald and Likelihood Ratio tests show that all the covariates contribute to the math score variance with statistical significance (Appendix A). This finding is observed in all grades examined in the study and will be discussed accordingly.
R2 for LMR and Pseudo-R2 for QR analyses.
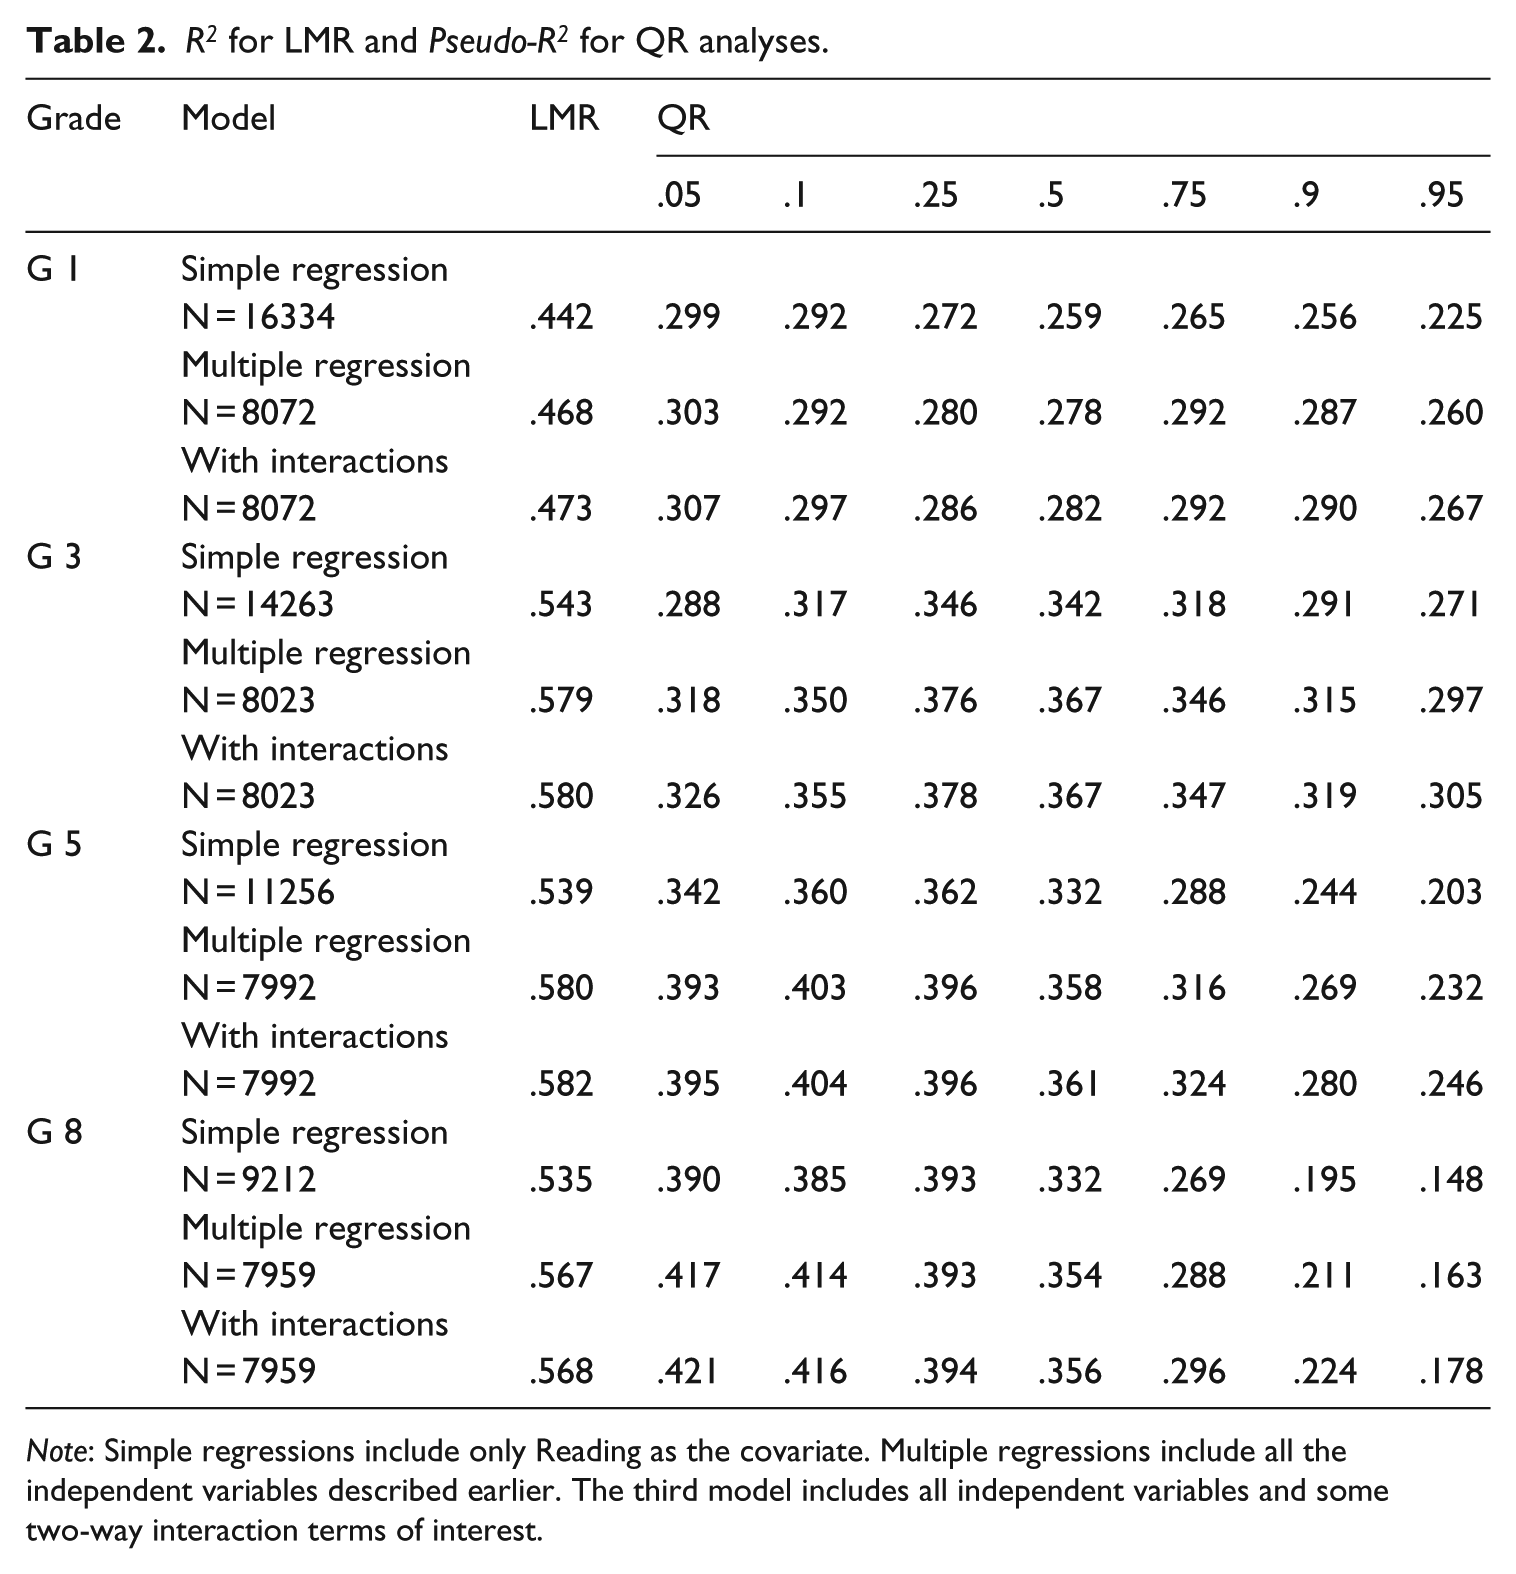
Note: Simple regressions include only Reading as the covariate. Multiple regressions include all the independent variables described earlier. The third model includes all independent variables and some two-way interaction terms of interest.
Table 3 summarizes the results of tests on the equivalence of the slope coefficients across all ability levels. Statistical evidence indicates that the relationship between math and many of the independent variables is not equivalent for students with different math ability within each grade. For example, F statistics for READING for grade 1 is 7.73 (p = .00) which means READING does not predict the math achievement the same way for high ability students (e.g., conditional math ability at the .9 quantile) versus low ability students (e.g., conditional math ability at the .1 quantile). This changing relationship is found between READING and math for other grades as well.
Test of equivalence.
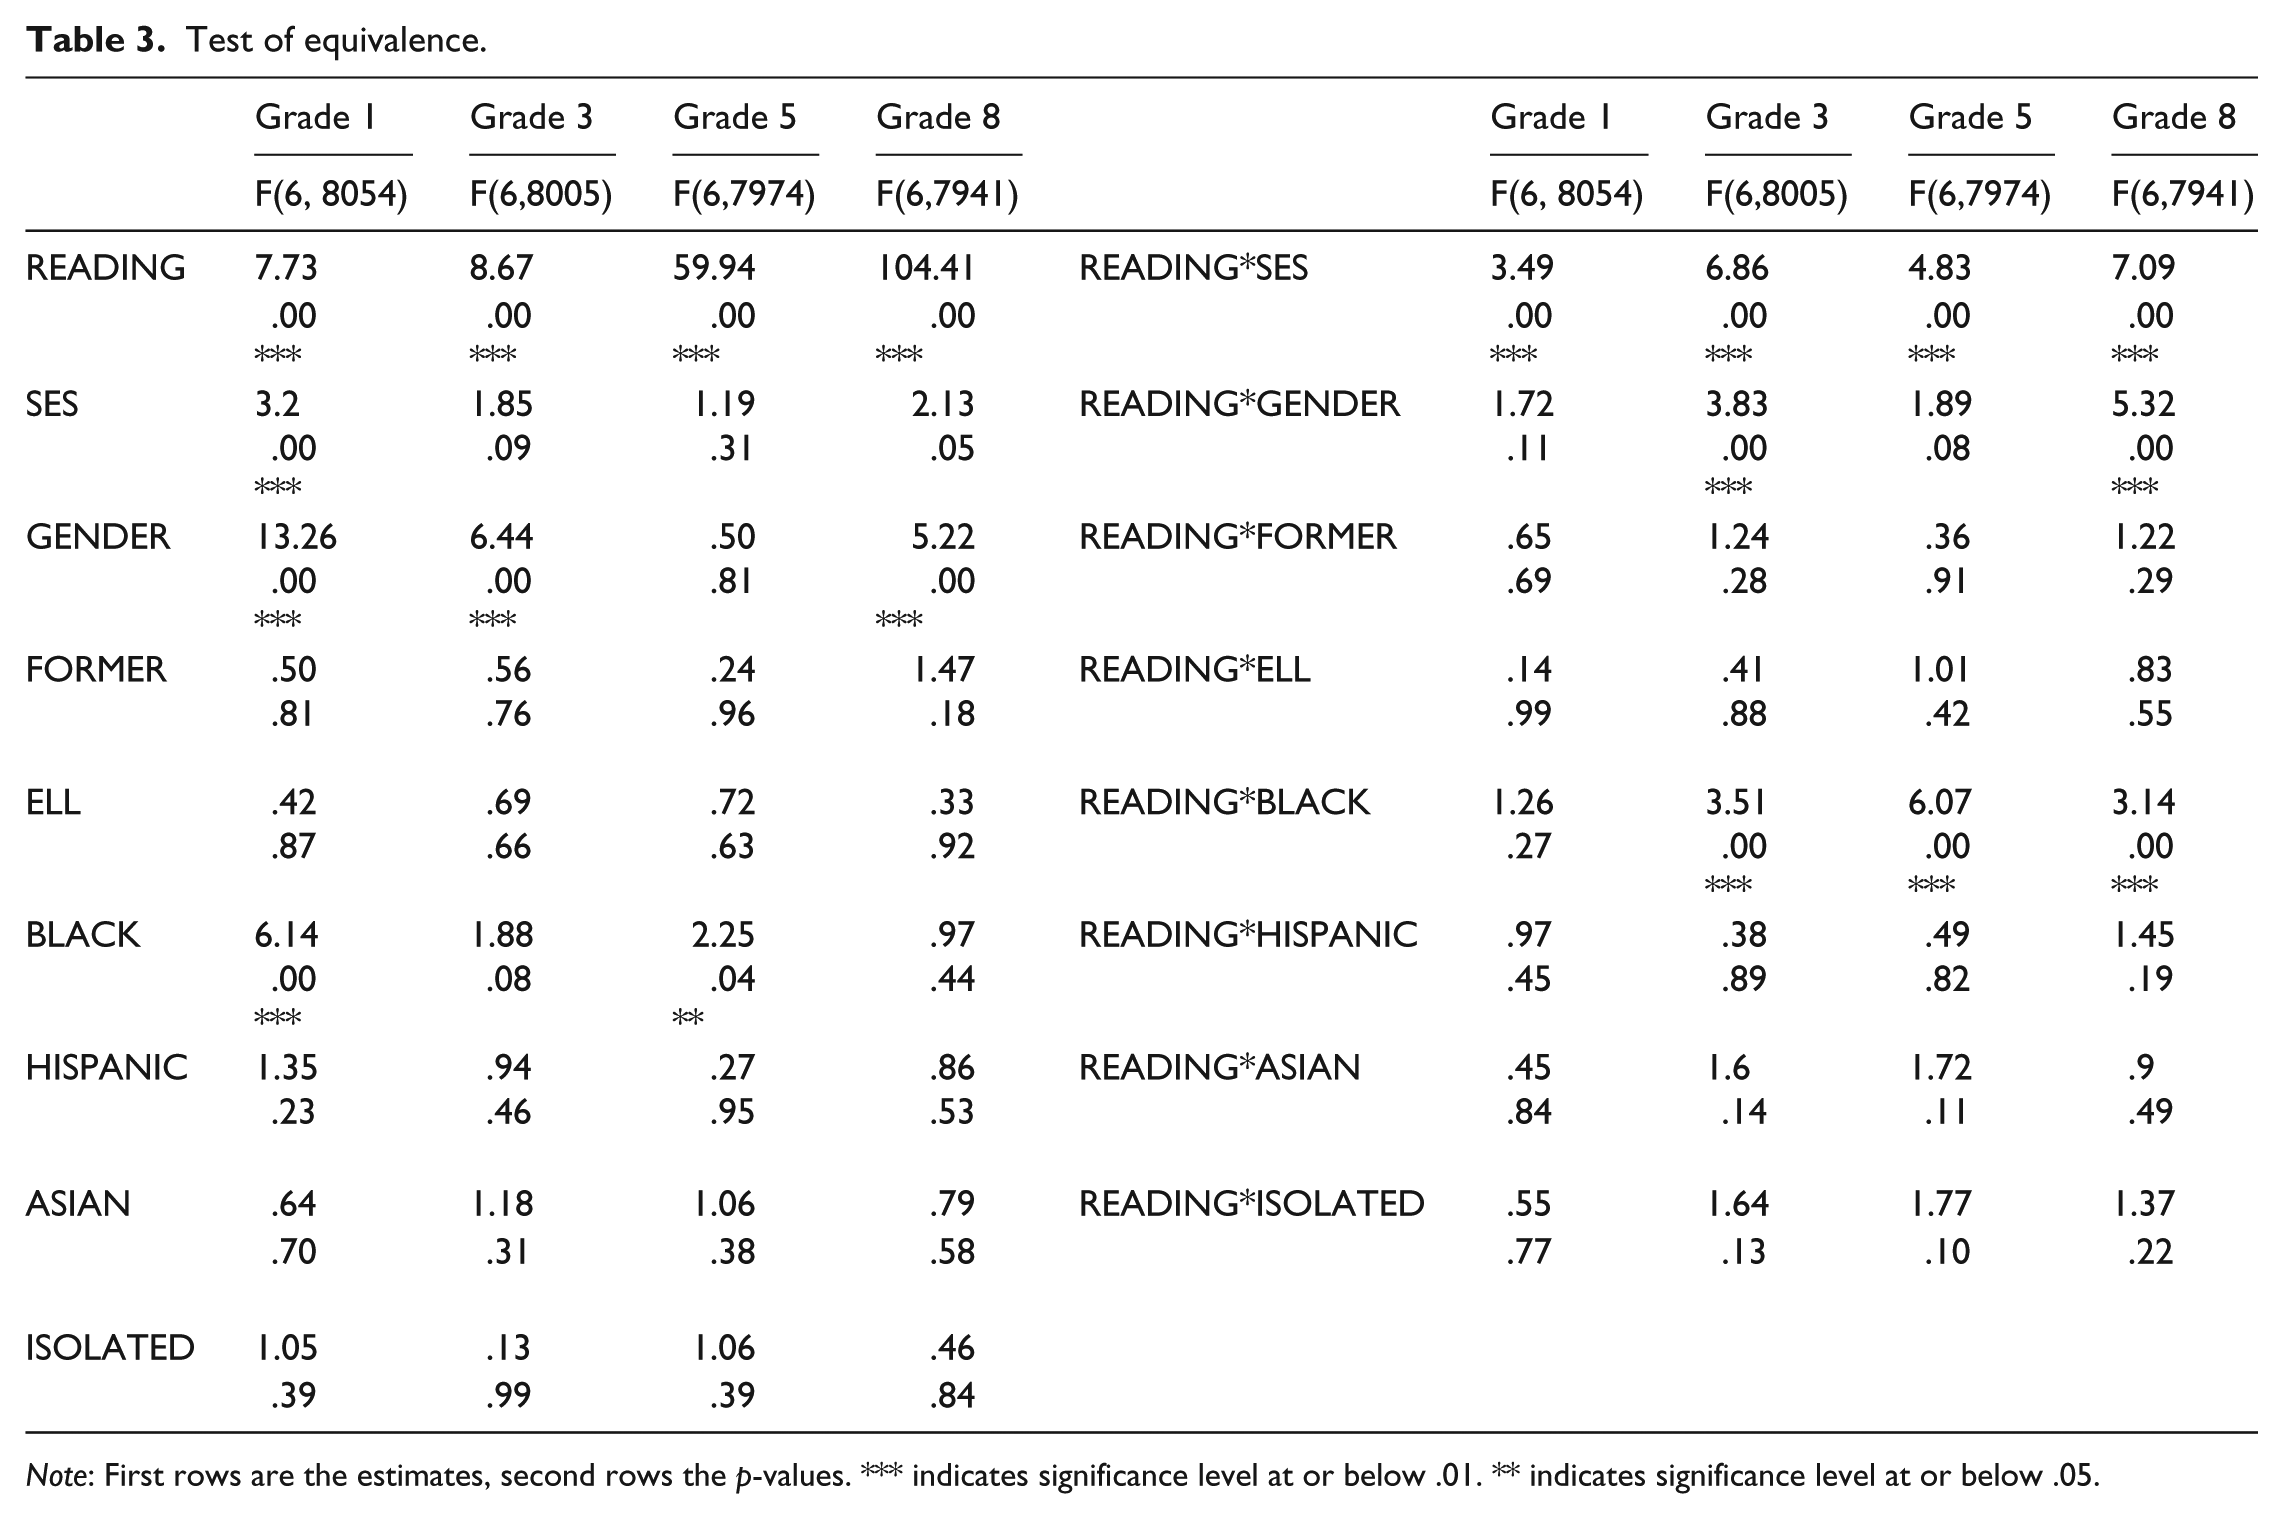
Note: First rows are the estimates, second rows the p-values. *** indicates significance level at or below .01. ** indicates significance level at or below .05.
In order to depict better the pattern of the relationship, individual slope coefficients are plotted with comparable scale ranges at each grade level. 2 These are called “process plot” in the QR literature. Figures 1a–e are the process plots for only the main effects. 3 The x axis represents the corresponding quantile ranges (conditional levels) for each variable. The extreme values below the 5th percentile and above the 95th percentile are not graphed because results tend to be unstable at extremes (SAS, 2008, p. 5361). The y axis represents the intercept or slope coefficient corresponding to each specific variable at each quantile. The black line with the shaded area represents the quantile regression results with the 95% confidence interval (CI). The dotted lines represent the corresponding mean regression results, that is, the slope and its CI. When possible, a horizontal reference line at y = 0 is also graphed in solid black representing the null hypothesis of the slope being 0.
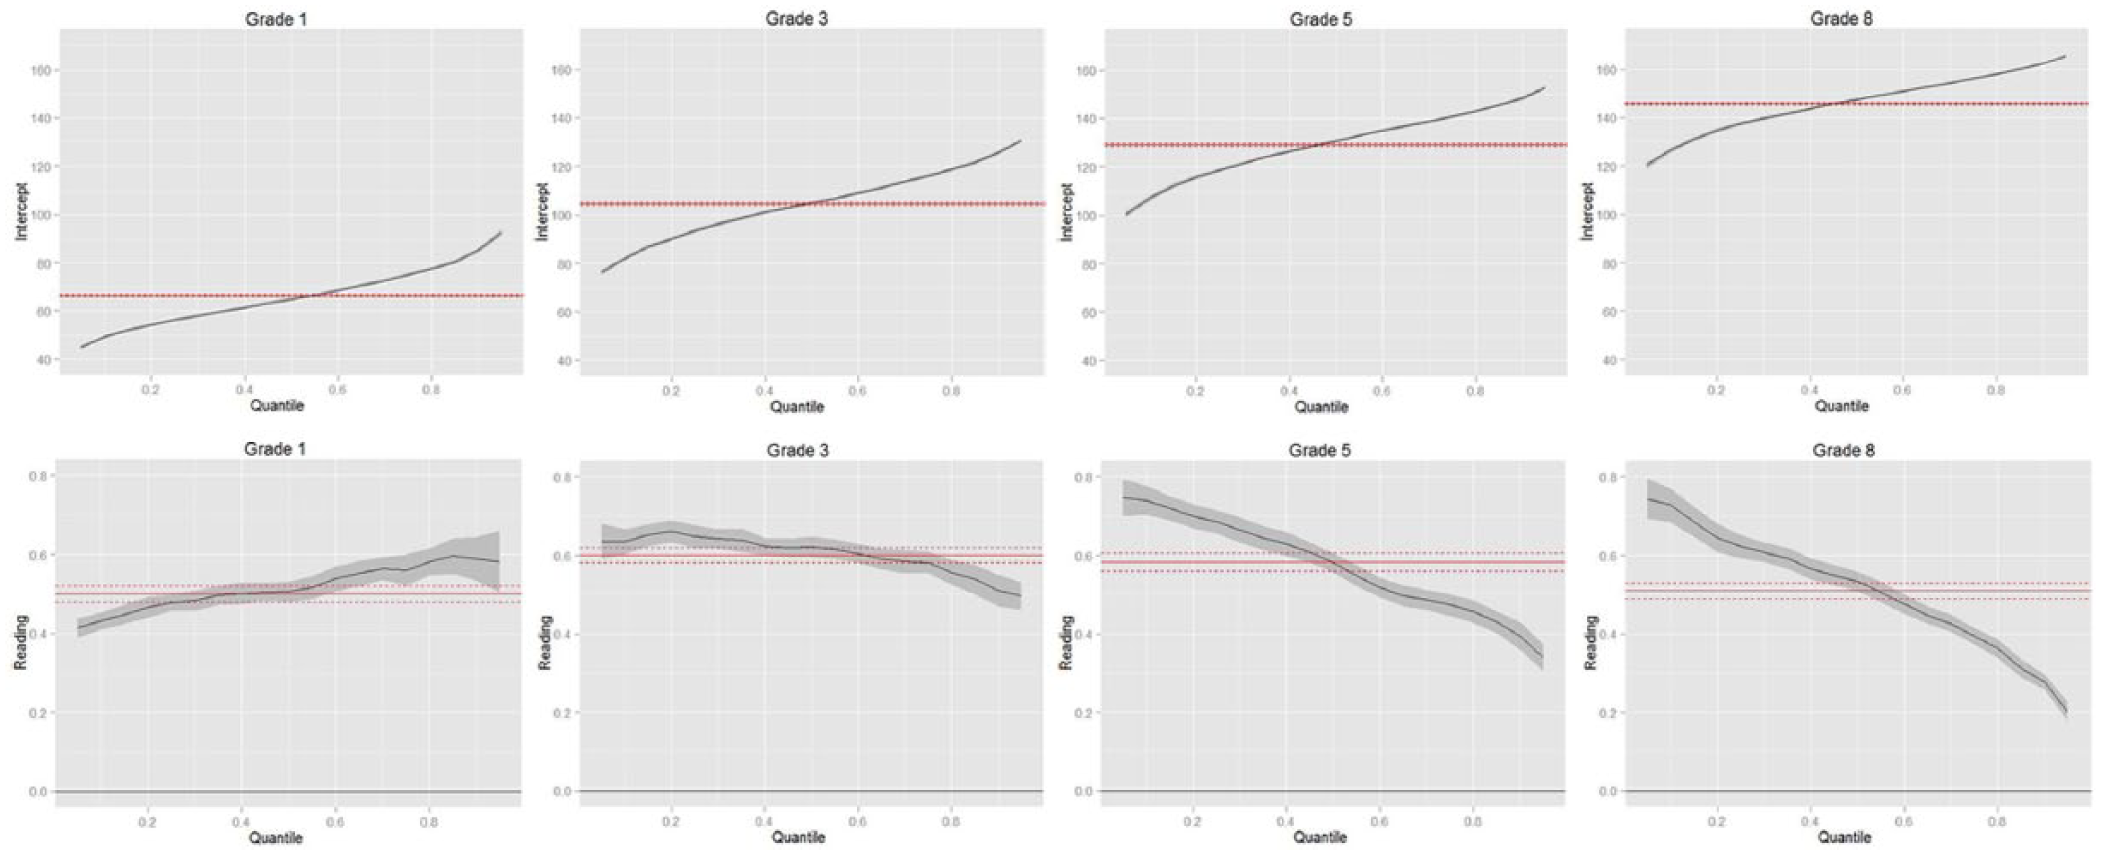
Intercept and main effect for READING.
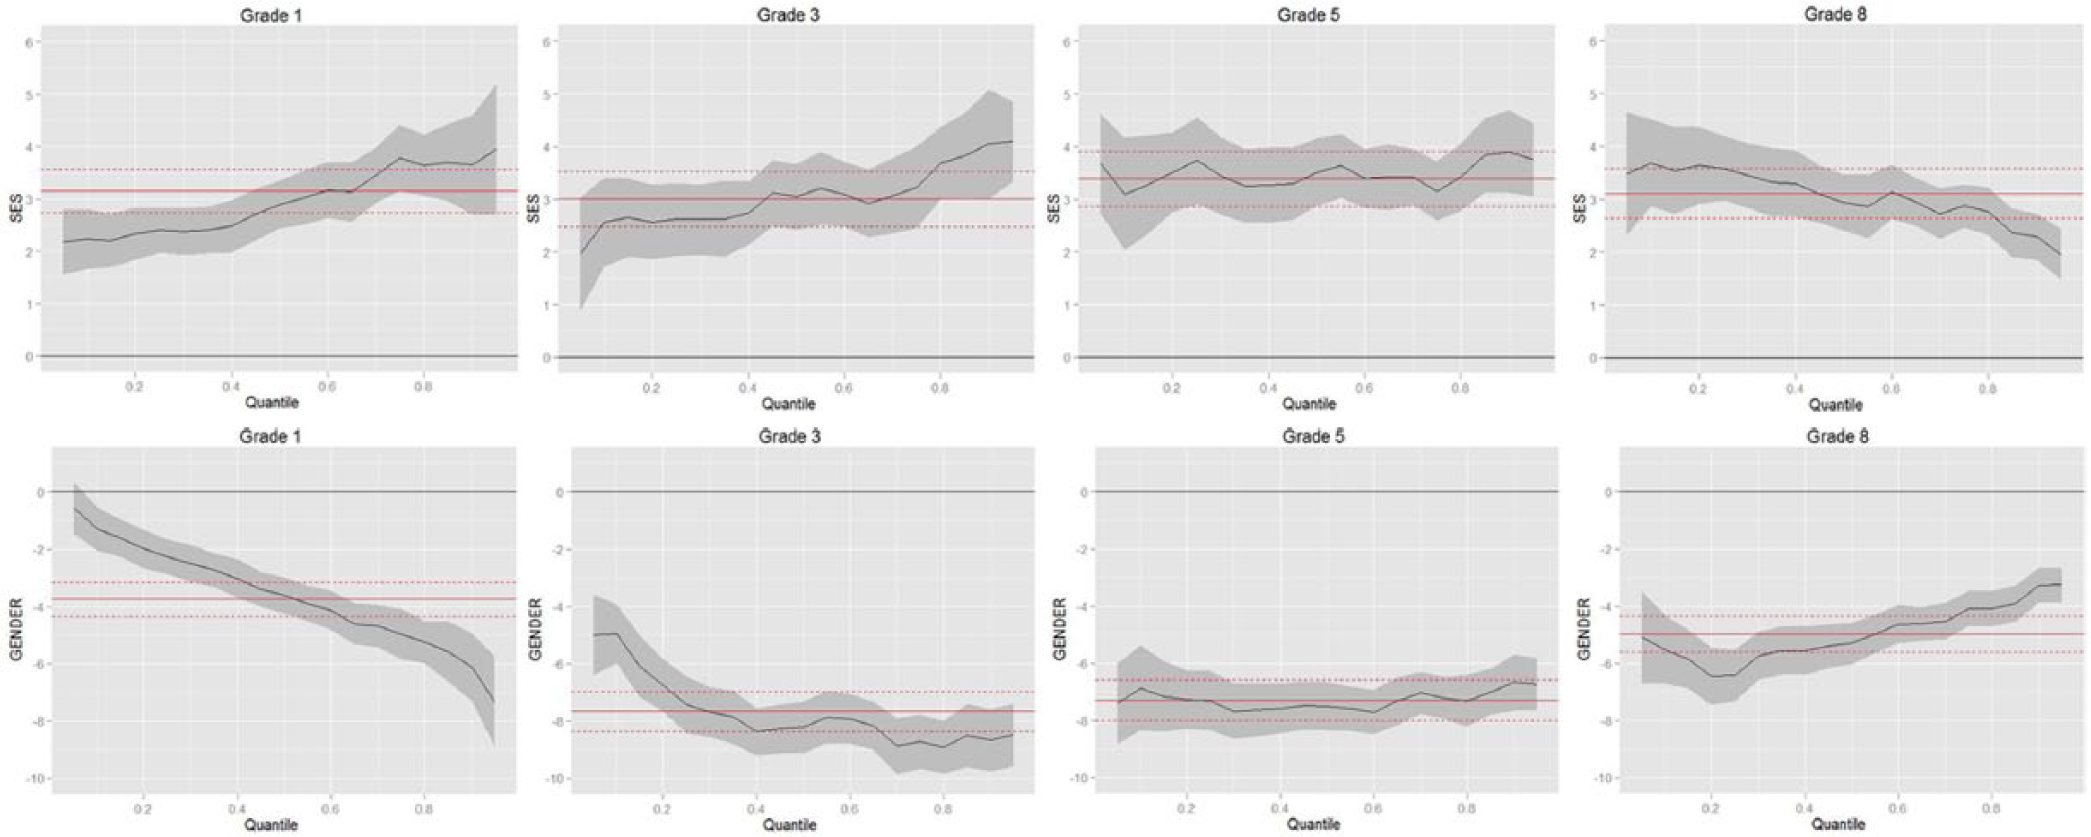
Main effect: SES and GENDER.
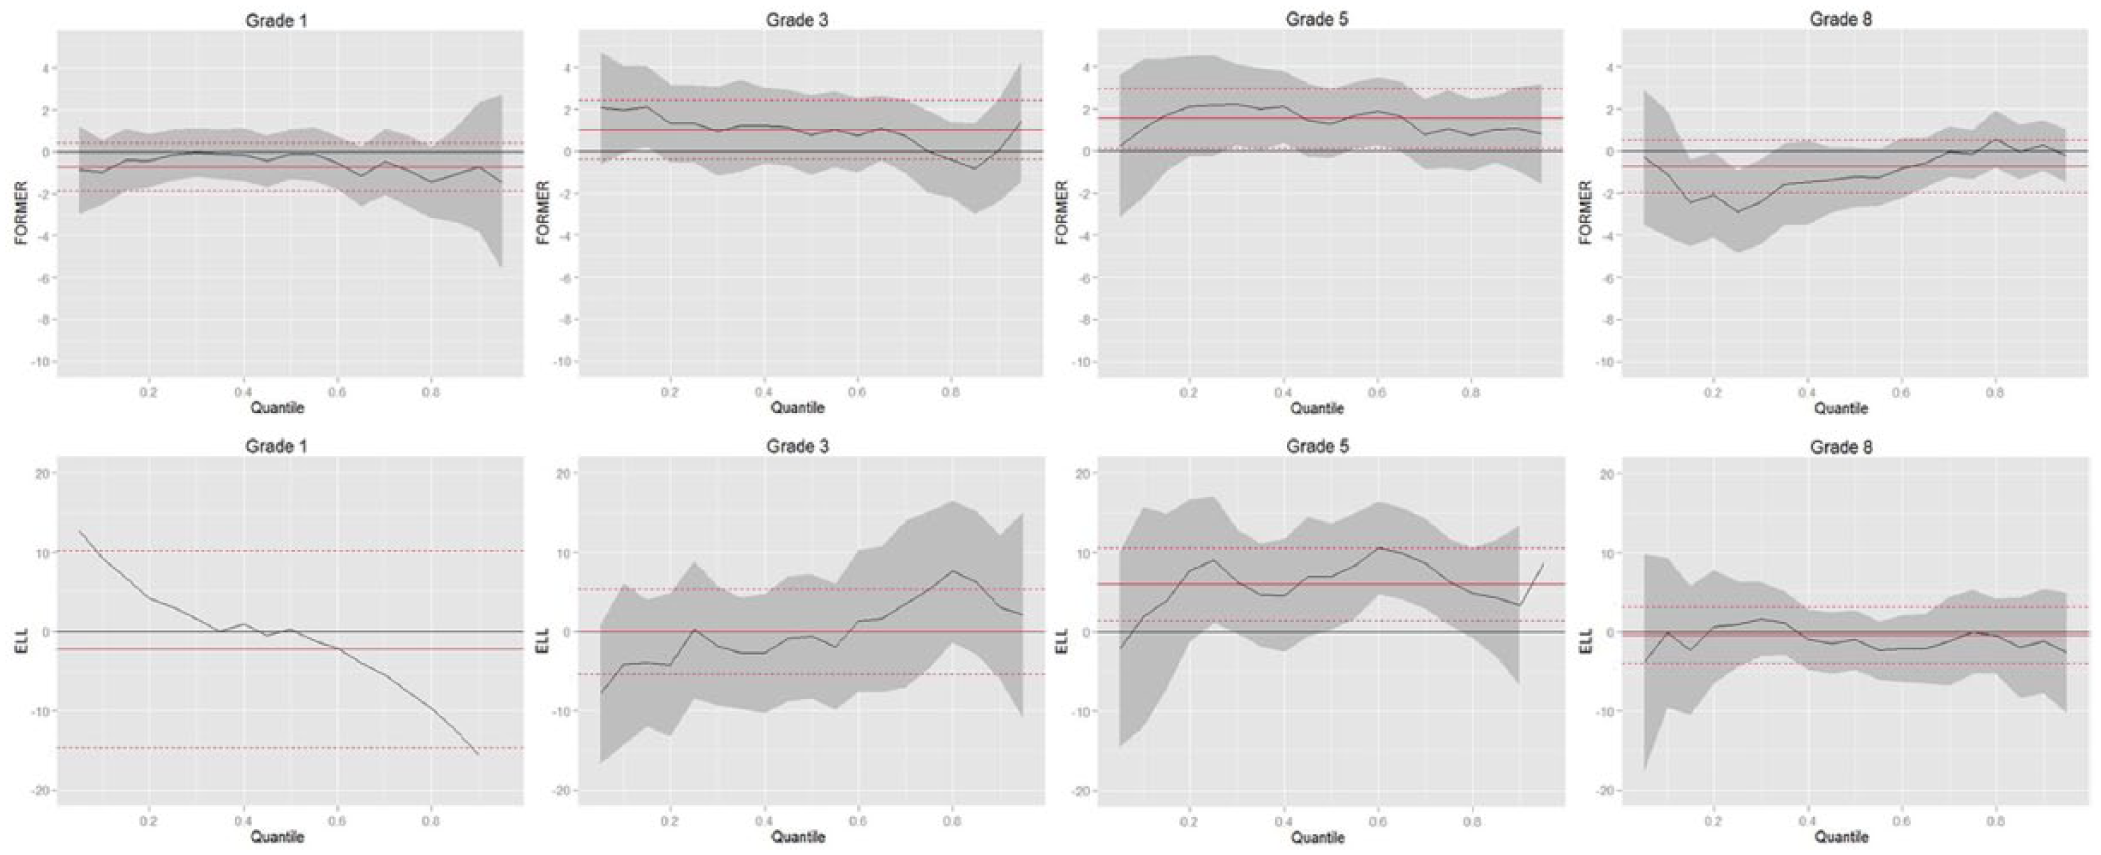
Main effect: Former ELL and ELL.
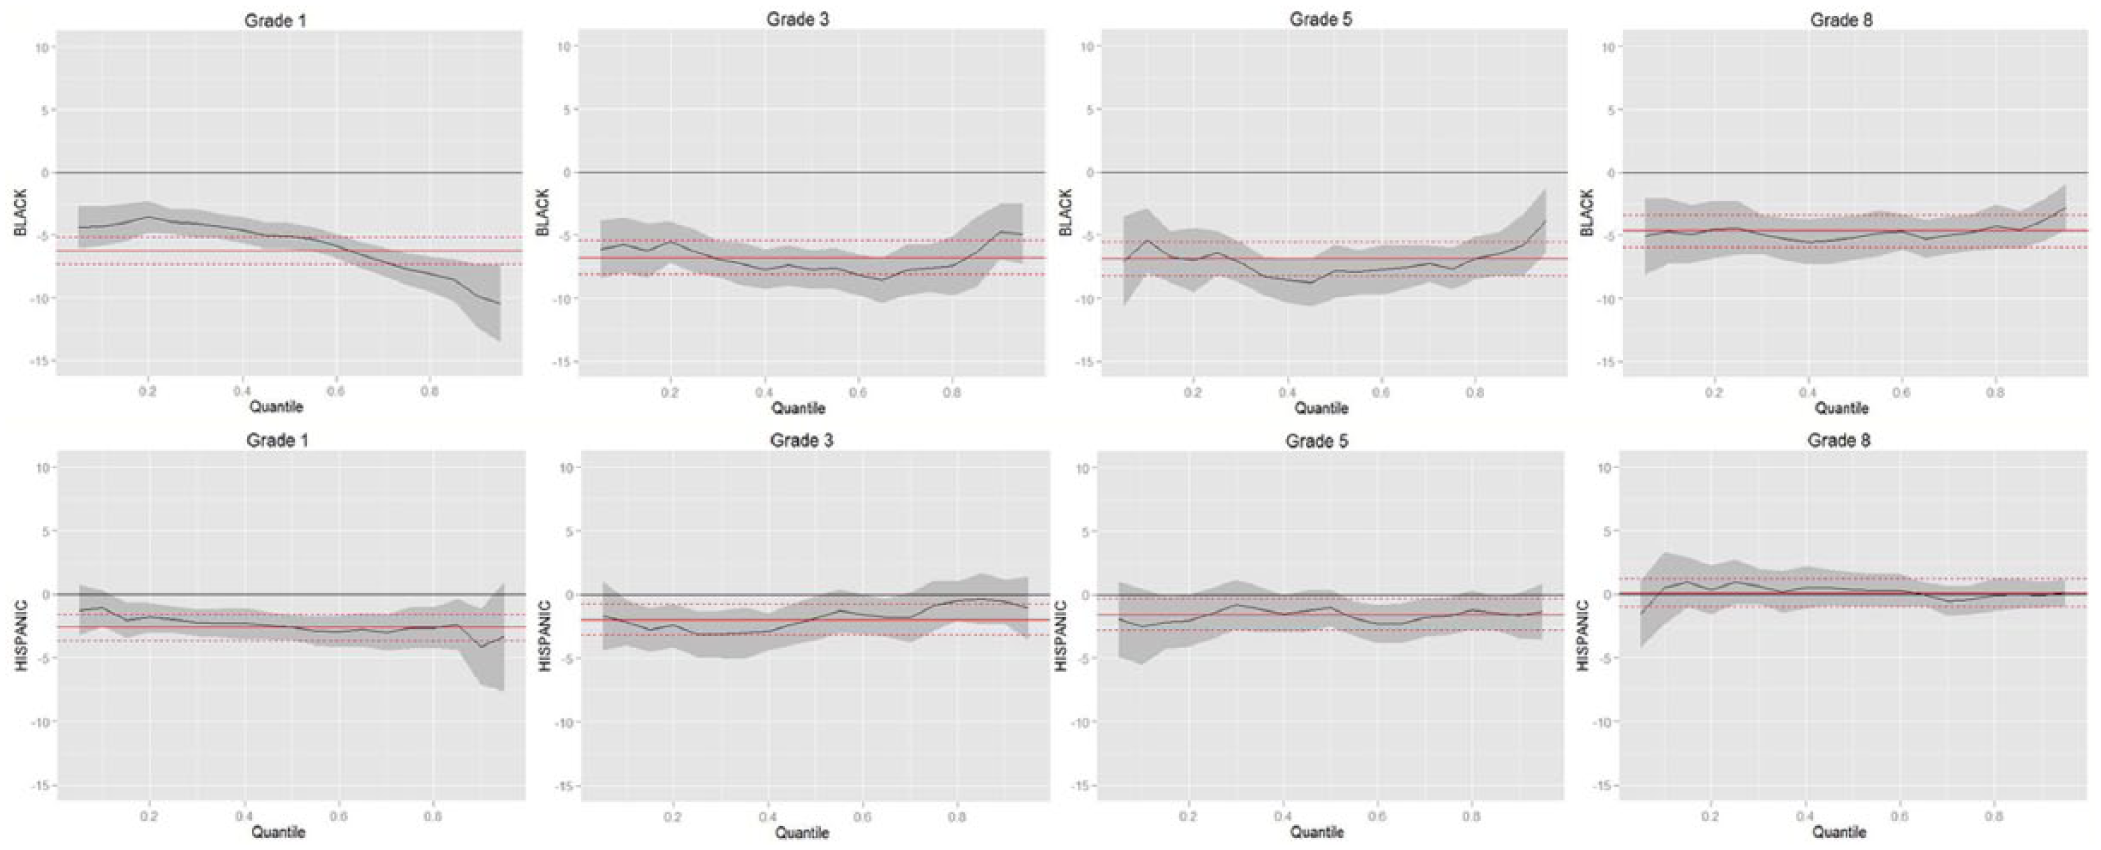
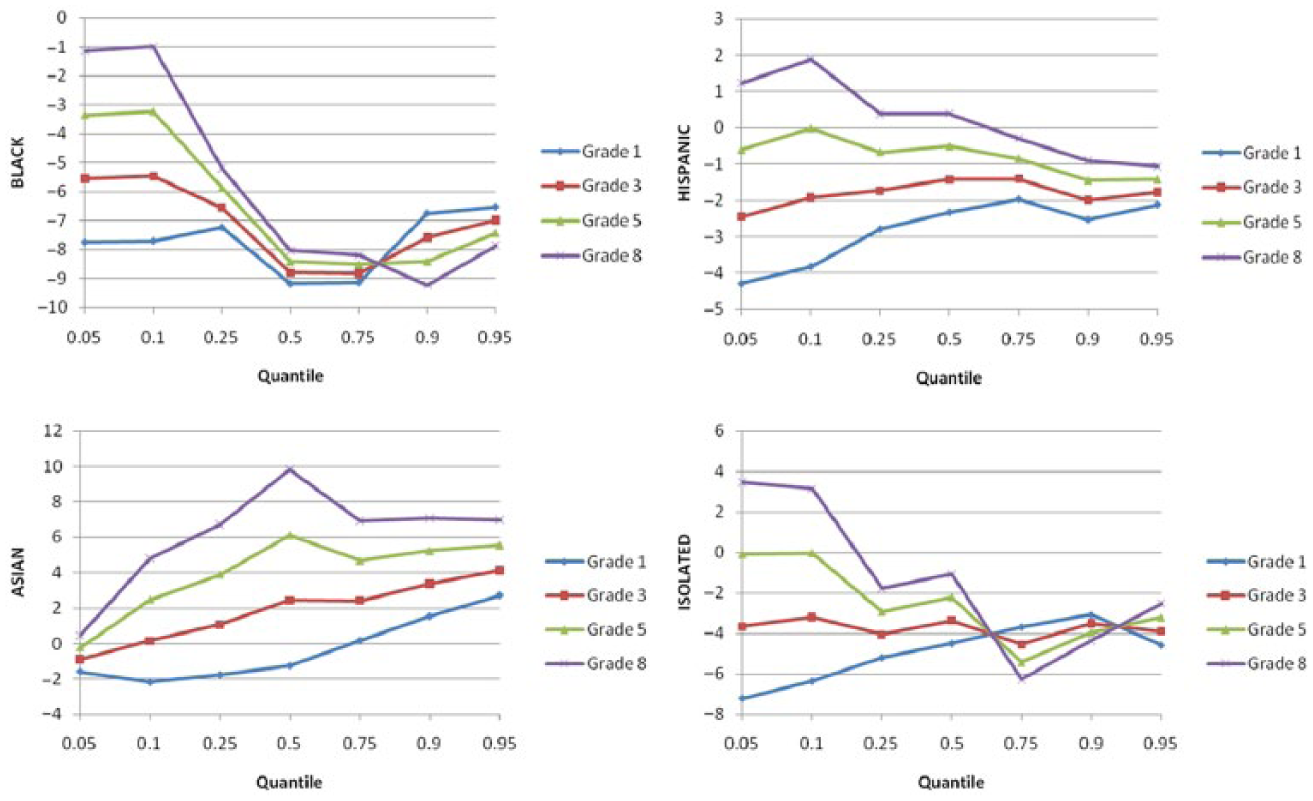
Main effect: BLACK and HISPANIC.

Main effect: ASIAN and ISOLATED.
Several main effects immediately stand out in the graphs. Both READING and SES are positively related to math scores across all quantiles at all grades (slope coefficients being positive and above the reference line). Or, as students’ reading scores or SES status increases, their math scores also increase. Both GENDER and BLACK are negatively related to math scores across all quantiles at all grades (slope coefficients being negative and below the reference line). Or, girls have lower math scores than boys; and black students consistently scored lower than their white counterparts (the reference group). There are significant interactions that moderate the magnitude of these main effects; however, they do not change the general pattern of these effects.
Although LMR (see the dotted lines) detects the statistical significance of the READING, SES, GENDER, and BLACK main effects, the QR analyses reveals more. For example, at grade 1, as students’ math ability increases, the relationship between reading and math scores also increases (Figure 1a). The LMR overestimates this relationship for low math ability students and underestimates it for high math ability students. This trend is reversed from grade 3 to grade 8. At these upper grades, although reading is still strongly and positively related to math scores, the strength of the relationship decreases as students’ math ability increases. At these grades, the LMR underestimates the relationship for low math ability students and overestimates it for high math ability students.
In addition to that, QR also reveals that the dispersion among students with higher math scores is wider than that for students with lower math scores at grade 1. The variance becomes more stable at grade 3 and is larger for low math ability students than for high math ability students at grade 5 and 8. This can be better seen through the relative position of the quantile regression lines in Figure 2 where only READING is modeled as the independent variable: while the lines diverge at high ability levels at grade 1, they converge at grade 5 and 8.
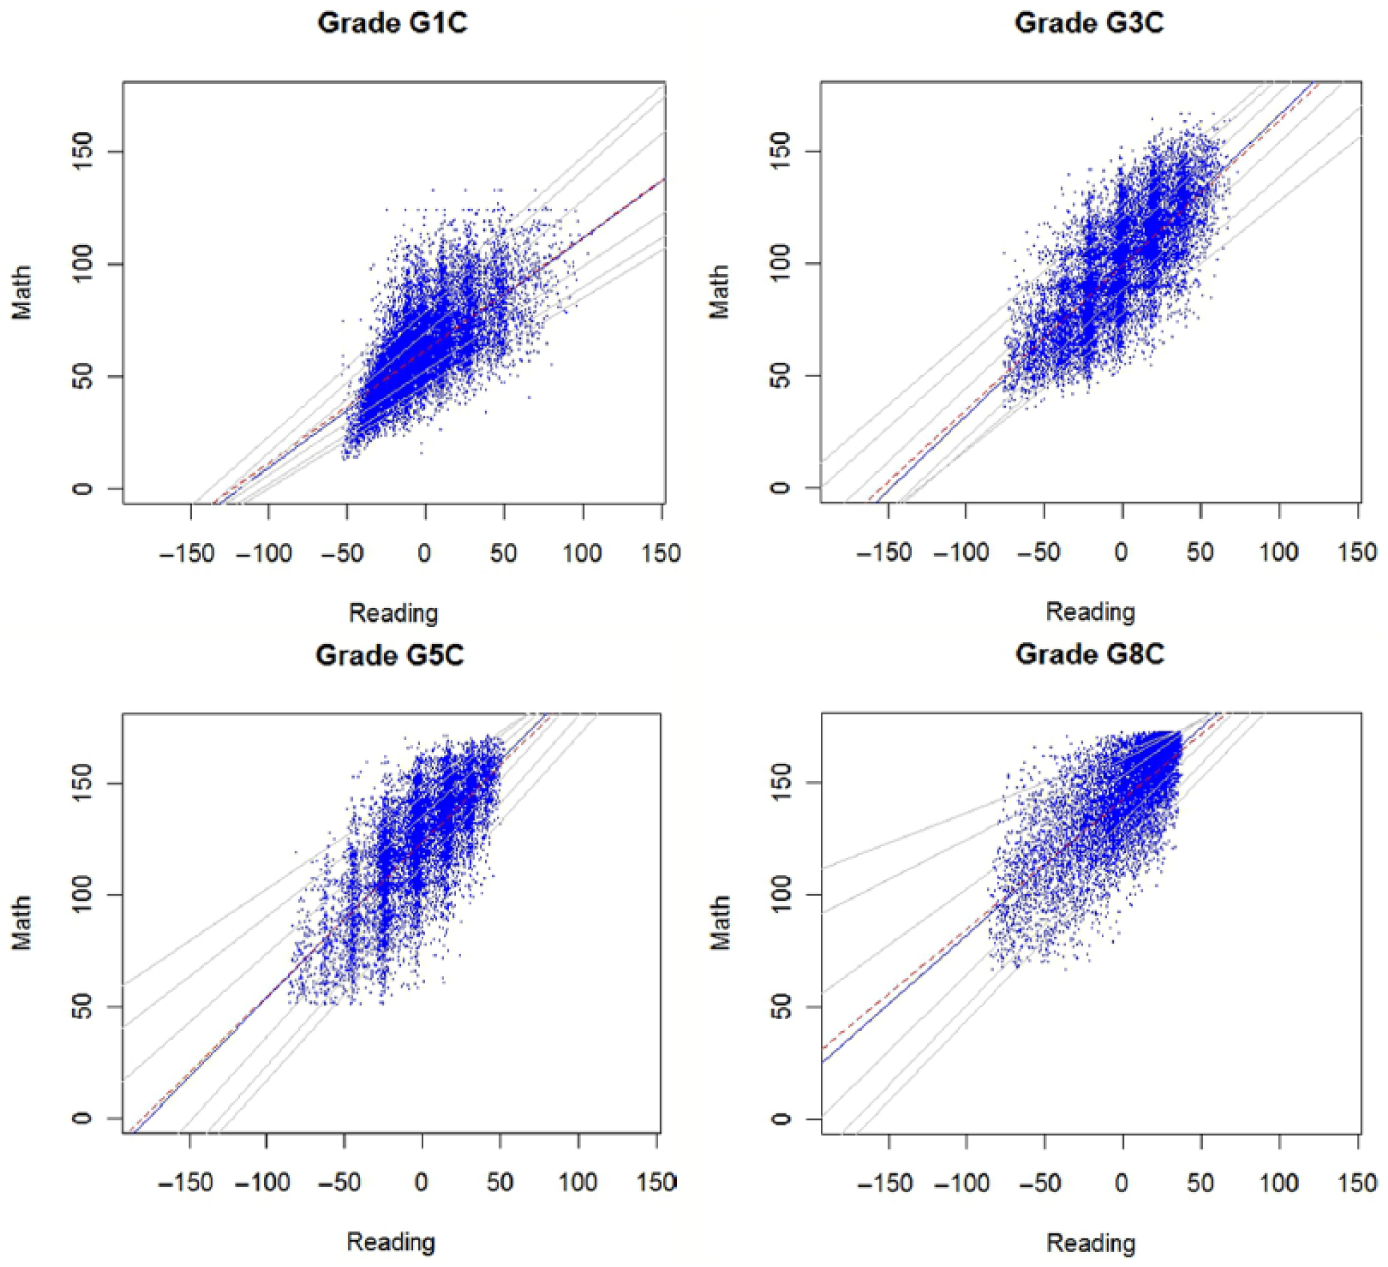
Simple quantile regression plots.
Central to the research questions is the ELL status. However, Figure 1c shows that when READING is controlled, neither Former-ELLs nor ELLs as a group differ from non-ELLs in math achievement at any grade. Although there are some sporadic significant results at some quantiles (CI does not include the reference line), overall they are not significant at most quantiles. In brief, when READING is controlled for, there is little significant difference between the math performance of ELL, former ELL and non-ELL students. This result is different from many previous studies where gap is reported and the gap between these groups is concluded as increasing or decreasing. It seems that it is less the difference between this group membership in math ability, but more the individual level language proficiency, that explains the math achievement gap. In the present data, since ELL status was decided according to an oral screening test, it may also mean that oral language proficiency is not a good indicator of students’ math achievement compared to reading proficiency. In terms of the ethnicity group difference, at grades 3, 5, and 8, when language proficiency is controlled for, the HISPANIC-WHITE and ISOLATED-WHITE gaps are insignificant. When language proficiency is not controlled for, they are significant at most conditional math ability levels. Combined with results from Figure 1d and 1e, this seems to indicate that the low math achievement of the Hispanics and the geographically isolated students (compared to the White students) is related to their language proficiency. The change in statistical significance for the ISOLATED also seems to suggest that although these students are rarely considered ELLs by common definitions, their relatively low reading skills have actually affected their math achievement compared to the WHITE. In contrary to these two groups, Asians do not seem to differ with READING controlled for or not.
Longitudinal model result
The longitudinal model was built based on the grade level models and followed a modified backward elimination procedure. Highway interactions are examined first and the main effects last. Once a term is removed, it is not considered in the following models again. Longitudinal modeling results are similar as in the separate grade level models. However, since all the data is put into the same model, trends across time can be interpreted with more confidence and have been intentionally saved for this section.
Again, READING is strongly and positively related to math achievement at all grades but the long-term relationship follows a concave down shape (Figure 3). READING*TIME is positive at lower quantiles and negative at higher quantiles and the absolute value tends to be larger at higher quantiles than at lower quantiles. This means that the relationship between language and math achievement is not the same across time. While the relationship is getting stronger for lower math ability students, it is getting weaker for higher math ability students over time.

Main effects in the longitudinal model.
Consistent with the grade level model results, the relationship between READING and MATH is unique at grade 1. While the strength of the relationship keeps on increasing as math ability increases until the 75th percentile at this grade, it evidently decreases at all quantiles for all other grades. The climbing relationship at quantiles below .75 at grade 1 may be owing to the fact that more and more math concepts start to rely on language skills to be expressed and understood (Ausubel & Robinson, 1969). Students at this grade are thus more sensitive to the language factor as their math skills expand. However, once some language proficiency threshold is reached, the language impact starts to decrease. The declining relationship at high math ability for students at grade 1 and at all ability levels for later grades may indicate that only some reading skills – closer to the academic language that is specific to the math subject – continue to affect math performance in tests.
SES is strongly and positively related to math achievement and SES*TIME is positive, meaning that the relationship between SES and math continues to increase as students grow. In all, high SES keeps on benefiting students at all math ability levels and across all grades.
As in grade level models, GENDER has negative estimates for all quantiles and at all grades. GENDER*TIME is not significant and has been removed from the final longitudinal model. In sum, girls started first grade with lower math scores than boys and the gap continued throughout later grades. Low math ability students scored similarly low, be it a boy or a girl. However, at higher levels, girls performed even worse than boys in math assessments. This is rather consistent with current literature, such as in Robinson and Lubienski (2011).
Figure 4 plots the slope coefficients for all race-ethnicity groups at all quantiles and across the grades. Although Black students performed significantly lower than White students at all grades, the gap is generally larger for high math ability students than for low math ability students. Thus, while the weaker ones are similarly weak between the two ethnic groups, the stronger ones are more apart in math achievement. Hispanic students are catching up with their White counterparts across time. However, like Black students, they still did not fare as well as the White students at the high end of math score distribution. The same pattern applies to the isolated students. In sum, there exists evidence supporting the schooling effect to close the gaps between low ability students. However, except for the Asian students, there seems to be a ceiling that prevents all minority students from being equal with the white students for high math achievement. This is consistent with previous findings (e.g., Clotfelter, Ladd, & Vigdor, 2009; Singh, 2013, 2015). After language proficiency is controlled, Asian is the only ethnicity group that not only catches up with the White students by grade 3 at most math ability levels (quantiles), but even outperformed the White students at grade 5 and 8 at all quantiles.
Race-ethnicity effect at each grade.
READING*SES*TIME is significant at most quantiles and READING*SES is significant only at higher quantiles. Figure 5 plotted the READING effect at both the mean SES status and one standard deviation above the mean SES at each grade. Clearly, for all grades, higher SES status seems to be able to downplay the language impact to some degree. And this moderating effect of SES increases in magnitude from grade 1 to grade 8. This might be related to a cumulated Matthew effect of high SES on learning and is consistent with previous literature such as by Singh (2013, 2015).

Differential READING effect moderated by SES at each grade.
READING*GENDER*TIME is positive at all quantiles. READING*GENDER is negative and statistically significant at almost all quantiles. Figure 6 plots the changing READING slopes for the two gender groups at each grade. Overall, relationship between language proficiency and math achievement seems to be increasing as students’ math ability increases. However, this trend stops at around the 75th percentile of conditional math distribution. From here on, the relationship between the two started to decrease. More importantly, it varies between gender and grade. At grade 1, this relationship is consistently stronger for boys than for girls. At later grades, this is only true for the lower math ability students; for high math ability students, the relationship between the two is stronger for girls. Despite all these rippling effects, again, language has a consistent and positive relationship with math scores regardless of grade or gender.
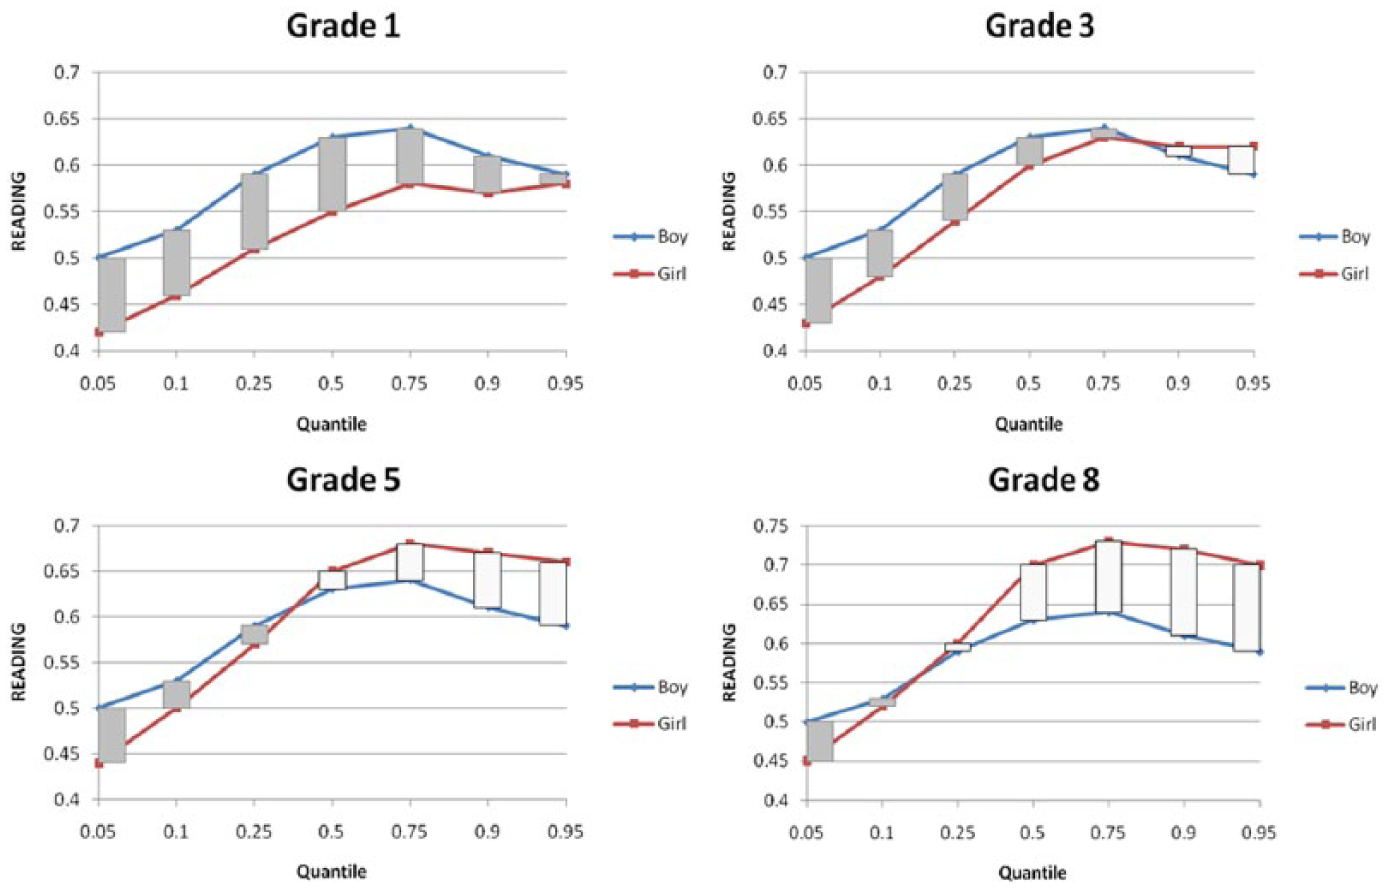
Differential READING effect between gender at each grade.
Three-way and two-way interactions involving race-ethnicity are mostly significant. Figure 7 summarizes the differential relationship between READING and MATH for each race-ethnicity group. Overall, READING correlates positively with MATH for all groups until near the 90th percentile (for BLACK) or 75th percentile (for all other groups including WHITE). After this point, it starts to decrease. Furthermore, the relationship gets stronger as Black and Hispanic students grow, and weakens for the Asian students. There is no statistically significant three-way interaction in the model involving Hispanics based on previous decision during model building. Still, the relationship between language proficiency and math seems stronger for high math ability Hispanics than for low math ability Hispanics.
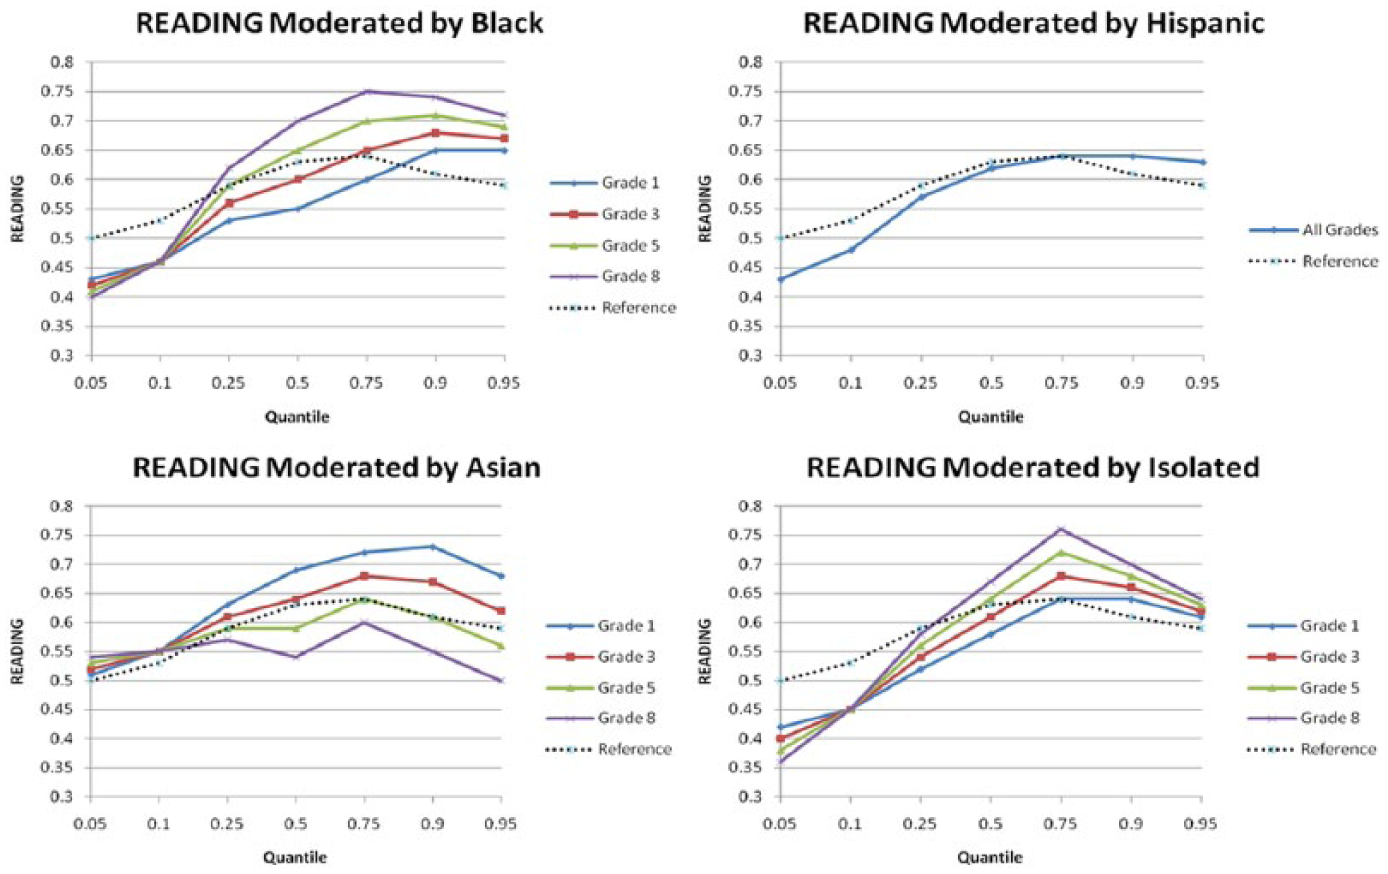
Differential READING effect by race at each grade.
Summary
After individual level language proficiency is controlled, differences between ELLs, former ELLs, and non-ELLs disappear. Also, the reading language proficiency is found to have a consistent and positive relationship with students’ math performance even after all other covariates are taken into consideration. However, this effect is different along the math score distribution. Overall, the relationship is stronger for low math ability students and weaker for high math ability students. These results answered research questions 1 and 2.
The answer to research question 3 is more complicated. In general, the results are consistent with past research on these variables. For example, there are obvious math achievement gaps between race-ethnicity groups. Except for the Asian group that caught up with the White reference group and even outperformed the latter by grade 3, all other race groups are generally at the same level or behind their White peers even after language proficiency is controlled. Girls scored lower than boys at all quantiles within all grades and low SES students consistently performed worse than high SES students in math.
Discussion
As implied earlier, the closing gap between low math ability students with different gender, SES, or ethnicity background seems to provide evidence supporting the effectiveness of schooling for the initially disadvantaged. This is also termed the “bigger fish effect” where “a low starting point provides much room for improvement” (Luyten & Bruggencate, 2011). In this case, it leads to the converging achievement gap between low math ability students. However, the diverging gap among high ability students seems to support a Matthew effect at the same time that for these students, initial educational disadvantage accumulate and consequently lead to a bigger difference in academic achievement later on (Luyten & Bruggencate, 2011; Walberg & Tsai, 1983). For example, there exists a ceiling for most of the minority ethnic groups that prevents them from being equal to their White peers in math achievement, even after language proficiency is taken into consideration.
In order to understand better these arguments and the prevalent strong relationship between language and math despite rippling effects, several terminologies are deemed relevant: the threshold of linguistic competence, Basic Interpersonal Communicative Skills (BICS) versus Cognitive Academic Language Proficiency (CALP), academic language, and mathematical register. Cummins (1979) proposed the “threshold of linguistic competence” for bilingual students. He hypothesized that students may have to master a certain level of language proficiency before language is no longer a barrier for cognitive and academic growth. According to this hypothesis, the decreasing influence of language for high math ability students and students at later grades may be owing to the fact that they have already passed the minimum linguistic threshold; that language no longer poses an extrinsic barrier for math achievement other than what the math discipline itself introduces. The linguistic threshold, however, may be different for different students as this research implies. Cummins (1979, 1999) also proposed the distinction between BICS and CALP. The term “academic language” (Bailey & Butler, 2003) is also prevalent in the measurement field now. Cummins (1972, 1999) believed that BICS can be learned rather quickly within 2 years but CALP and/or the bulk of academic language proficiency is regarded to take a much longer time and continues to affect content learning. Since the ELL status was based on an early oral test in ECLS-K, our research seems to support that distinction and questions the use of a more BICS approach to documenting language proficiency for academic purposes. While academic language did not seem to be well-defined or implemented as of now (Bailey & Butler, 2003; Bailey & Huang, 2011), our results further challenge the measurement of it at different developmental stages.
The “mathematical register” or “math language” as discussed in math education and systemic functional linguistics research tradition (Halliday, 1978; Schleppegrell, 2007; Wakefield, 2000) suggests that language is an intrinsic part of academic disciplines. Language helps with knowledge construction as well as demonstration of knowledge in the content area. Students are thus impacted in terms of math learning and math assessment. It is reasonable to believe, then, that the accumulated disadvantage that students have in language at the start will manifest itself in math performance. In this study, it contributed to the ceiling in math scores.
The issue of double jeopardy from both the learning and testing process extends the meaning of this research beyond the assessment of students and into the teacher preparation and pedagogical tradition for both math and reading. For example, the 2014 interim report by National Council on Teacher Quality (NCTQ, 2014) summarized that there are still many states that have not prepared their teachers well enough. Only 18 states required an adequate assessment of the teachers’ knowledge on reading and only 25 states on math knowledge. The rest of the states either have an inadequate tests or not tests at all on new elementary teachers. Also, for middle schools, there are still 14 states that permit teachers to teach on a K-8 generalist license. NCTQ concluded that these practices indicate that the pedagogy needed to teach later grade content is the same as the early grades, and this situation has not improved much compared to 5 years ago (NCTQ, 2009, 2014). The shifting relationship between language and math revealed in this study challenges that practice again. If teachers are not aware of the varying demand of academic language for subject learning and have not been trained systematically to teach both language and math, their instruction may not enable differential treatments to help students more effectively, especially the linguistically disadvantaged. In this sense, arguments over math as a language (e.g., Wakefield, 2008) or an academic language for math or different genre scholarship (Hyon, 1996) all converge to support the same better instruct (Loeb, Soland, & Fox, 2014).
The persistent relationship between language and math for all groups in this study speak for the relevance of language issues to all students rather than limiting it to the ELL communities. For example, reading seems to explain the relatively low math achievement for students from geographically isolated regions although these students have never been labeled as ELLs. Research on former ELLs recommended continued accommodation for former ELLs in testing (e.g., Cawthon, 2010) and our research extends the discussion to non-ELLs as well. It is only with our growing understanding of the construct under examination that better measurement is possible and standards for universal design and fair testing can be achieved (Standards, 2014). Test scores, especially in high-stakes measures, label students for accountability purposes and play a central role in shaping how students view themselves and how they are viewed by others. Test scores are also relevant for resource allocations which is critical for equitable education (Jennings & Sohn, 2014; Singh, 2015). All these make research on the relationship between language and other content learning and assessment of primary importance for the entire educational system.
Several other demographic factors are related to the academic achievement of students but they are not as influential as language according to the R2 and Pseudo-R2 statistics. Educators cannot manipulate these background factors either. In contrary, both language and math are subjects taught in schools and are thus valid indicators of students’ progress or school effectiveness. Now that there is further evidence for the accumulated, long-lasting, and also differential effects of language on math achievement, to evaluate the academic progress for all students and the educational effectiveness of schools, it may be more appropriate to take into consideration of students’ prior language difference when reporting content area academic achievement. It is the similar thinking concerning prior achievement that makes students’ growth percentile (SGP, Betebenner, 2009) models attractive for reporting. However, although prior math difference is taken into consideration in SGP, this research implies that prior language difference may also need to be considered in SGP-like models when subjects are tested in English.
Results from grade 1 are very different from all other grades. For example, the relationship between language and math is increasing until the 75th percentile of conditional math ability at grade 1 but decreasing at all other grades; the variance of math score distribution is larger at high language proficiency and smaller at low language proficiency at grade 1 but the pattern is the opposite for later grades; the relationship between SES and math keeps on increasing at grade 1 but is quite stable in rate for all later grades; the confidence band for the slope estimate of ELL is too big at grade 1 but much smaller across other grades; and the pattern of change in race-ethnicity gap with or without READING controlled for is different at grade 1 from later grades. The unique patterns for grade 1 seem to suggest that the construct for grade 1 is different from other grades. Academic English for grade 1 may be still impacted more by early age development factors (Beiley& Huang, 2011; McKay, 2000). Finally, vertical scaling may work better if we exclude grade 1 performance.
The READING slope estimates started to decrease at the 75th percentile of conditional math ability at grade 1 and grade 3 for both boys and girls, for students with various SES background and for most race-ethnicity groups. It seems that the 75th percentile is a threshold. It is also starting from this point that students’ math ability seems to be able to compensate for the language influence in math assessment. What makes this percentile so important is not clear but future research may help locate the reasons and help guide instruction and assessment.
As demonstrated, quantile regression provided richer information than mean regression, such as the differential language impact on math achievement depending on the math ability of the students. It also detected various, rather than constant, math achievement gaps related to gender, SES, or race-ethnicity. It is a valuable tool for researchers when differential relationship is expected rather than a simple mean pattern. Quantile regression modeling is straightforward and the accompanying graphic presentation of results is informative. The interpretation, however, is challenging due to the large amount of information that results.
Limitations
In this study, reading is used as a proxy for language proficiency. However, this is only one measure of language proficiency. Other measures of language may be explored in future studies for full understanding of language impact on math. This study indicates that although there is a close relationship between language proficiency and content learning, not all language skills are relevant to math learning at all grades to the same degree. There are actually data on the specific categories of reading skills measured in ECLS-K, however, high variance inflation factor (VIF) values (Kutner, Nachtsheim, Neter, & Li, 2004) for these skills from preliminary analyses discouraged simultaneous modeling of them within the same regression model(s). Although we would like to explore which specific language skills are becoming more or less relevant to which components of math learning and assessment at each developmental stage, it is done better with qualitative analyses and this will have to be saved for future research. Finally, the composition of the cohort of students traced in the ECLS-K data used in this study is not the same as the current population in the United States, thus the coefficient estimates in the study should be interpreted with caution. However, other things being equal, we expect the pattern of relationship discovered in this study to hold true.
Footnotes
Appendix
Additional grade level model comparison statistics
| .05 | .1 | .25 | .5 | .75 | .9 | .95 | ||
|---|---|---|---|---|---|---|---|---|
| Wald Test | ||||||||
| Grade 1 | S vs. F | 140.74 | 206.17 | 384.07 | 618.08 | 848.77 | 471.41 | 379.88 |
| F vs. I | 1570.57 | 2016.7 | 2378.99 | 2456.55 | 1284.91 | 1086.64 | 688.53 | |
| Grade 3 | S vs. F | 60 | 179.7 | 450.08 | 704.87 | 603.95 | 377.94 | 377.37 |
| F vs. I | 973.28 | 1982.01 | 2868.9 | 3514.16 | 3585.54 | 1724.03 | 1352.42 | |
| Grade 5 | S vs. F | 217.25 | 222.74 | 608.65 | 560.52 | 636.1 | 371.97 | 314.32 |
| F vs. I | 1609.88 | 2219.09 | 3716.25 | 3412.36 | 2644.35 | 1554.87 | 1179.39 | |
| Grade 8 | S vs. F | 102.5 | 223.58 | 511.91 | 383.45 | 377.03 | 215.4 | 92.62 |
| F vs. I | 1455.62 | 2089.08 | 3051.81 | 3054.65 | 3260.81 | 1737.36 | 771.14 | |
| Likelihood Ratio Test | ||||||||
| Grade 1 | S vs. F | 134.26 | 190.53 | 295.11 | 479.06 | 552.02 | 411.68 | 263.44 |
| F vs. I | 954.75 | 1177.88 | 1754.46 | 2100.88 | 1953.35 | 1231.53 | 767.42 | |
| Grade 3 | S vs. F | 81.92 | 158.7 | 355.31 | 639.82 | 582.31 | 352.11 | 270.44 |
| F vs. I | 837.66 | 1338.38 | 2064.98 | 2707.49 | 2317.39 | 1479.2 | 1144.07 | |
| Grade 5 | S vs. F | 166.64 | 201.83 | 420.98 | 623.04 | 618.58 | 372.56 | 256.71 |
| F vs. I | 990.19 | 1243.11 | 2100.39 | 2446.4 | 2229.27 | 1372.89 | 874.88 | |
| Grade 8 | S vs. F | 105.19 | 204.84 | 411.49 | 389.69 | 341 | 190.91 | 127.79 |
| F vs. I | 966.21 | 1390.59 | 2065.59 | 2428.86 | 2231.57 | 1478.91 | 1011.16 | |
Note:
S refers to simple regression where there is only one independent variable: Reading.
F refers to a full regression with all other covariates in addition to Reading but without any interactions.
I refers to the full regression with all the interaction terms in addition to main effects.
All the statistics are statistically significant below .01 level.
Declaration of Conflicting Interests
The author(s) declared no potential conflicts of interest with respect to the research, authorship, and/or publication of this article.
Funding
The author(s) disclosed receipt of the following financial support for the research, authorship, and/or publication of this article: This paper is funded by East China Normal University (ECNU, Research Grant # 41300-515491-14100/007). ECNU International Exchange Division has also funded travel for relevant workshop and presentations. The authors would like to thank three anonymous reviewers and Jamal Abedi for their helpful comments. All remaining errors are ours.