



Abstract
In this study, we present the development of individualized feedback for a large-scale listening assessment by combining standard setting and cognitive diagnostic assessment (CDA) approaches. We used the performance data from 3,358 students’ item-level responses to a field test of a national EFL test primarily intended for tertiary-level EFL learners. The results showed that proficiency classifications and subskill mastery classifications were generally of acceptable reliability, and the two kinds of classifications were in alignment with each other at individual and group levels. The outcome of the study is a set of descriptors that describe each test taker’s ability to understand certain level of oral texts and his or her cognitive performance. The current study, by illustrating the feasibility of combining standard setting and CDA approaches to produce individualized feedback, contributes to the enhancement of score reporting and addresses the long-standing criticism that large-scale language assessments fail to provide individualized feedback to link assessment with instruction.
Score reports are increasingly conceived as part of an overall validity argument in justifying the uses of educational assessments (Kane, 2013; Tannenbaum, 2019), as it is through score reports that the intended users make use of assessment results. Despite the importance of score reports in assessment development and use, there has been a paucity of research in this area in language testing.
The available body of research on score reports has centered on the development of bands and band level descriptors by adopting scale anchoring or standard setting methodology (Davies, 2008; Gomez et al., 2007; Papageorgiou, Xi, et al., 2015). Scale anchoring involves identifying exemplar anchor items for each band level and then creating descriptors based on content experts’ judgement on the salient skills needed to correctly respond to those items (Gomez et al., 2007; Sinharay et al., 2011). The scale anchoring method has been applied in language assessment to produce band level descriptors for individual test sections of the TOEFL® iBT (Gomez et al., 2007) and the Test of English for International Communication (TOEIC; Liao, 2010).
In contrast with scale anchoring methods which develop level descriptors based on test items, standard setting is the process of determining one or more cut scores for each band level based on existing descriptors at these distinct levels of a standard or benchmark (Cizek & Bunch, 2007; Kaftandjieva, 2010). Its popularity in language testing can be associated with projects of linking language tests to external proficiency frameworks to enhance the transparency and interpretability of score reports, such as the TOEFL® iBT–Common European Framework of Reference for Languages (CEFR) linking study (Papageorgiou, Tannenbaum et al., 2015; Tannenbaum & Wylie, 2008), IELTS–CEFR linking study (Lim et al., 2013), and Aptis–China’s Standards of English Language Ability (CSE) linking study (O’Sullivan et al., 2020).
Although both scale anchoring and standard setting approaches offer a means to attaching meaning to numeric scores in large-scale language assessments, the qualitative feedback provided by these two approaches remains static for test takers within a particular band level. The descriptors for each band level work best for the typical test taker at each band level (Gomez et al., 2007). The further a test taker’s score departs from the typical test taker, the less fitting the descriptor might be for the individual test taker. In addition, the potential different subskill profiles of individual test takers within a particular band level are not taken into account in the current band level descriptors of large-scale language assessments using these approaches. These large-scale language assessments are thus criticized as providing limited information to facilitate individualized learning and instruction (Hyatt & Brooks, 2009; Kunnan, 2008; Kunnan & Jang, 2009; Sawaki & Koizumi, 2017).
Another stream of research pertaining to score reports has focused on providing test takers with individualized feedback on their test performance (Sawaki & Koizumi, 2017). Among them, cognitive diagnostic assessment (CDA) has attracted the greatest amount of attention from language assessment researchers (Jang et al., 2015; Javidanmehr & Sarab, 2019; Kim, 2011; Lee & Sawaki, 2009; Li et al., 2016; Mirzaei et al., 2020; Xie, 2017; Yi, 2017). Instead of providing continuous scores on a unidimensional scale, CDA breaks down the construct into multidimensional subskills and places individual test takers into distinct subskill profiles (Roberts & Gierl, 2010). In CDA, the item-by-subskill relationship is first specified in a Q-matrix and then tested against real data, which results in diagnostic information about individual test taker’s strengths and weaknesses at subskill level. The diagnostic reports derived from CDA are recently used by large-scale educational assessment programs to provide fine-grained information to individual test takers regarding what they can do and what they need to further improve (Bradshaw & Levy, 2019). However, the feedback presented in CDA research is generally confined to the cognitive performance of individual test takers, with little attention to the criterial features of input materials test takers can understand. According to Harding et al. (2015) and Alderson (2005), even low-level students can correctly respond to questions involving high-level cognitive subskills such as inferencing and summarizing ideas. It is not only the difficulty of the cognitive subskills but also the linguistic features of the text that test takers process that determine their performance on each item (Alderson, 2007). Therefore, providing descriptive information about the criterial features of the task along with pass/fail classifications on cognitive subskills would enable the intended audiences to have a better understanding of test takers’ specific abilities.
Although combining standard setting and CDA approaches presents a plausible way to provide individualized descriptions about each test taker’s ability to process certain levels of written and oral texts (Green, 2018; Powers et al., 2017) and their cognitive strengths and weaknesses while processing (Jang et al., 2015; Kim, 2015), to our knowledge, there has not been any effort in combining the two approaches to provide individualized feedback for test takers in order to facilitate remedial learning and instruction in language assessment research and practice. This is probably owing to the fact that little is known about the relationship between performance-level classification based on standard setting and mastery/non-mastery classification of subskills based on CDA. It is possible that a test taker classified into a higher proficiency level is diagnosed as failing in all subskills and a test taker at a lower proficiency level is identified as mastering all subskills (Liu et al., 2018), given the different scoring and classification techniques of the two approaches. In such cases, it would be difficult to explain the inconsistencies of the two pieces of information to end users. However, test score users need both pieces of information for decision making and resource development for remedial instruction (Jang et al., 2019). For instance, Hyatt and Brooks (2009) reported that 74% of surveyed stakeholders in UK universities believed that admitted English language learner students need additional post-entry language support, yet 64% of these surveyed stakeholders indicated that IELTS score report did not offer such diagnostic information. Our aim for this study, therefore, is to investigate the feasibility of combining standard setting and CDA approaches to provide individualized feedback by focusing on the consistency between the two approaches. We are also part of a larger project to develop score reports with individualized feedback for the National English Testing System (NETS) in China in order to facilitate tailored instruction and learning. The NETS is an English language testing system that is being designed by the National Educational Examinations Authority (NEEA) in China, which is the only educational examinations authority under the Ministry of Education of China that oversees almost all high-stakes education examinations in the country.
Background
Standard setting
Although standard setting has thrived in the field of educational measurement for several decades, its application in language testing is a “relatively late phenomenon” (Kenyon & Römhild, 2013, p. 3). Its emergence as a vital research area in language testing can be associated with the growing interest in linking language tests to external proficiency frameworks such as the CEFR (Lim et al., 2013; Martinyuk, 2010; Papageorgiou, Tannenbaum et al., 2015; Tannenbaum & Wylie, 2008). The relationship between standard setting and linking, however, has raised controversies among language assessment researchers. Some researchers argue that linking tests to external frameworks is a special case of standard setting, as the descriptors of external frameworks can be regarded as performance level descriptors in a standard setting approach (Papageorgiou & Tannenbaum, 2016). Some maintain that standard setting is embedded in linking, which comprises five procedures including familiarization, specification, standardization training, standard setting, and validation (Council of Europe, 2009). We concur with the latter view that linking is a broader concept encompassing standard setting in that level descriptors in linking have meaning outside the assessment while those in standard setting are generally confined to the assessment within a certain context (Kenyon, 2012, Powers et al., 2017).
In addition to the theoretical disputes, a central issue discussed in standard setting is the comparability of cut scores from different standard setting studies (Green, 2018). A variety of standard setting methods have been proposed to determine cut scores, such as the bookmark method, Angoff method, body of work method, and analytical judgement method (Cizek & Bunch, 2007; Kaftandjieva, 2010; Zieky et al., 2008). Even within the same method, as Tannenbaum and Cho (2014) pointed out, “implementation variations and modifications are more the rule than the exception” (p. 235). This makes it difficult to compare cut scores yielded by different standard setting methods (Cizek, 2012; Reckase, 2009). Adding to the complexity, divergent rounding policies may be adopted by different organizations. Cut scores derived from standard setting often involve fractional values, with very few yielding an exact score (Cizek & Bunch, 2007). Rounding the score up or down will automatically influence the resulting cut score for each level (Lim et al., 2013). Furthermore, error estimates and confidence intervals can be calculated in standard setting studies to adjust the cut score (Cizek & Bunch, 2007). The variations in such adjustments also pose a challenge to ensure comparability of cut scores from different standard setting studies.
To validate standard setting results, multiple types of evidence have been provided by the researchers of previous studies in language testing, including quantitative evidence such as inter-panelist reliability, intra-panelist reliability, the correlation coefficient between panelist judgments and empirical item difficulty values (Lim et al., 2013; Martinyuk, 2010; Papageorgiou, Tannenbaum, et al., 2015), and qualitative evidence such as panelists’ decision-making process (Papageorgiou, 2010). However, there is relatively little literature on classification accuracy and consistency to establish the reasonableness of cut scores in language testing, with a few exceptions such as Zhang (2010) and Papageorgiou, Xi, et al. (2015). Classification accuracy refers to the extent to which the level classifications of test takers based on test scores would match those made based on their true scores (Powers et al., 2017). Classification consistency refers to the extent to which the level classifications of test takers agree with each other in two independent administrations of the same test (Powers et al., 2017). These two indices provide important information on the reliability of classification decisions.
Cognitive diagnostic assessment
Compared with traditional tests that simply rank-order candidates, a distinct advantage of CDA is that it can comprehensively analyze the multidimensional cognitive processes in language comprehension, allowing for predictions of candidates’ mastery or non-mastery of discrete subskills or attributes involved in the processes. The main component of CDA is CDM, which is an advanced modeling technique that brings together multidimensional modeling and criterion referenced latent attribute classifications (Rupp et al., 2010). It classifies test takers into different subskill profiles based on test takers’ responses to test items. The number of subskill profiles is determined by the number of attributes involved in answering the items (Jang et al., 2019). For example, if a total of four attributes are required to answer the items in the test, the number of subskill profiles will be at most 16 (24). Each subskill profile represents a multidimensional profile with differential combinations of 0 and 1 (0 indicates non-mastery and 1 indicates mastery of an attribute). By generating fine-grained diagnosis about individual test taker’s strengths and weaknesses on each attribute, CDA offers pedagogically useful information for subsequent remedial learning and instruction (Jang et al., 2015).
Language assessment researchers have become increasingly interested in applying CDA approaches to provide diagnostic feedback (Javidanmehr & Sarab, 2019; Kim, 2011; Lee & Sawaki, 2009; Li et al., 2016; Mirzaei et al., 2020; Xie, 2017; Yi, 2017). For example, researchers at Educational Testing Service (ETS) explored the possibility of employing CDA to provide individualized, tailored feedback to each test taker for the listening and reading sections of TOEFL® iBT (Sawaki et al., 2009). Similarly, Jang et al. (2019) reported efforts to enhance the score reports of the reading section of IELTS through the combination of CDA and scale anchoring.
Although findings from these studies are generally encouraging, a limitation of the previous studies on CDA in language assessment is that they seldom report information on the reliability of diagnosis. The researchers of most studies have argued for accurate identification of individual test taker’s strengths and weaknesses on the grounds of good model-data fit (e.g., Li et al., 2016; Mirzaei et al., 2020; Yi, 2017). Little is known about the reliability of the binary classifications in CDA studies. Such a lack of research on classification reliability is surprising, given the importance of presenting empirical evidence about reliability when individuals are classified into different latent profiles and diagnosis-based decisions are made based on those outcomes. Without sufficient psychometric quality, individual test takers may be misled to wrong classifications and be set to undergo wrong remedial actions (Sinharay et al., 2019). The lack of classification reliability research may be in part attributed to the fact that reliability measures for CDA analyses were not proposed and evaluated until quite recently (Johnson & Sinharay, 2018). However, such reliability measures are now available and can be easily estimated.
One popular measure for evaluating the quality of classification results in CDA is classification accuracy, which can be calculated and reported at the attribute, pattern, and test levels (Ma et al., 2020). Attribute-level classification accuracy can be defined as the percentage of agreement between the observed and expected classifications of test takers in each of the attributes (Wang et al., 2015). Pattern-level classification accuracy provides information about the reliability of inferences made regarding any specific latent subskill profile (Iaconangelo, 2017). Test-level classification accuracy is calculated as the weighted sum of the pattern-level classification accuracy of all latent subskill profiles (Iaconangelo, 2017). More detailed and technical discussions of the procedures for calculating classification accuracy at the attribute, pattern, and test levels can be found in Wang et al. (2015) and Iaconangelo (2017).
Standard setting and CDA
There are similarities and differences between standard setting and CDA. Similar to standard setting, CDA aligns with a standard-based view in that mastery of all subskills is evaluated and pass/fail classification decisions are made (Bradshaw, 2015). Nonetheless, they differ from each other in several ways. First, standard setting is generally used at the skill or overall test level to decide whether a certain performance meets the standard, whereas CDA addresses mastery at the subskill level. Second, standard setting is a strong theoretical approach in which panelist judgments are primarily relied on to determine the cut scores, whereas CDA is a strong statistical approach in which responses to items measuring different attributes are modeled to determine pass/fail classification (Liu et al., 2018).
Combining the two approaches not only provides a promising way to generate individualized qualitative feedback, but also may lead to a better understanding of the nature of specific constructs of language ability. One example, in particular, is that of the construct of listening assessment. It is generally accepted that listening ability is multidimensional; however, there is no agreement on the number and types of underlying cognitive attributes of listening ability, and their relative contribution to listening comprehension (Buck & Tatsuoka, 1998; Yi, 2017). Theorists have proposed different taxonomies of listening subskills, ranging from simple binary classifications (Carroll, 1972) to more detailed lists (Field, 2013; Vandergrift & Goh, 2012). Despite a lack of consensus on the number of listening attributes, previous CDA applications in listening assessment generally defined a total of three to four attributes (e.g., Lee & Sawaki, 2009; Sawaki et al., 2009; Toprak et al., 2019; Yi, 2017), primarily owing to the consideration of a trade-off between the richness of diagnostic information and the stability of such diagnosis (Haberman & von Davier, 2006). The less fine-grained the attributes are defined, the more stable the diagnostic information may be. In addition, there are three recurring listening attributes defined in previous CDA listening research (e.g., Lee & Sawaki, 2009; Sawaki et al., 2009; Toprak et al., 2019; Yi, 2017), including understanding specific information, making inferences, and connecting and synthesizing information. They are also subconstructs operationalized in proficiency frameworks such as the CEFR (Council of Europe, 2001) and diagnostic listening assessments such as DIALANG (Alderson, 2005; Alderson & Huhta, 2005). Combining standard setting and CDA approaches provides a means to understand the relationship between subskill mastery and level classification on general listening proficiency standards.
The compatibility of these two approaches, however, has triggered some debate. Skaggs et al., (2016) demonstrated the feasibility of combining the two approaches by proposing a diagnostic profiles (DP) standard setting method to set performance standards for CDA. In the DP standard setting method, panelists were asked to judge the performance level into which each subskill profile falls. The raw score distributions for each subskill profile were then calculated and weighted in order to decide the final cut scores for the test. The findings showed that the cut score yielded from the DP method was comparable to the Angoff method, but with a higher degree of agreement among panelists. On the other hand, Liu et al. (2018) cast doubt on the appropriacy of providing binary classifications on subskills in addition to a pass/fail decision on overall standards, because discordant scenarios, such as an overall pass diagnosed as failing in all subskills may arise. Liu et al. thus proposed a relative diagnostic profile framework to report an individual’s relative strengths and weaknesses and avoided making absolute decisions on subskills. However, they acknowledged the importance of examining the relationship between the two kinds of classifications in informing future test development.
Research questions
Our aim with this study is to explore the feasibility of combining standard setting and CDA approaches to provide individualized feedback to facilitate score interpretation of a large-scale EFL test. This study is part of a large project to develop score reports for the NETS in China, and we are researchers on that larger project.
The NETS is situated within a national project launched in 2014 that aims to develop a national English testing system, in response to the call for construction of an assessment system of foreign language ability, as stipulated by The Implementation Opinions of the State Council on Deepening the Reform of the Examination and Enrollment System. It is expected that the NETS will provide an objective evaluation of tertiary-level students’ overall English language proficiency in accordance with the China’s Standards of English Language Ability (CSE) and bring a positive washback effect to EFL teaching and learning in the country. The test results are intended to be used to inform decisions in teaching, evaluation, and admission. The score report will include test takers’ performance in each section (i.e., listening, reading, speaking, writing) in the form of numeric scores and band levels, accompanied by individualized qualitative feedback. It is hoped that the individualized qualitative feedback can contribute to the enhancement of meaningfulness and transparency of numeric scores as well as provision of more fine-grained information for remedial learning and instruction. This study specifically focused on the listening test 1 and addressed the following three research questions:
To what extent does standard setting provide reliable classification of students?
To what extent does cognitive diagnostic modeling provide reliable subskill mastery classification of students?
How can standard setting and cognitive diagnostic results be combined to generate individualized qualitative feedback?
Methods
Participants
Panelists
Fifteen panelists (five males and 10 females) served on the standard setting panel. We selected panelists who (a) had experience teaching tertiary-level students, (b) were familiar with the CSE/NETS/standard setting methodology, and (c) were demographically diverse and represented a variety of higher education institutions. All panelists completed a background questionnaire. (A version of the participant background questionnaire, translated into English, is in the Supplement Appendix, with the supplement being found on the Language Testing website, next to the online version of this article.) Seven of the panelists were involved in the development of the CSE. Six of them had standard setting experience prior to participating in our workshop. Three of them were item writers for the NETS. All of them were experienced EFL teachers and had taken one or more of the following roles as national teaching curriculum designers, textbook writers, teacher trainers, and item writers.
Coders
Five content experts in EFL (one male and four females) coded the listening subskills measured by the listening test. We selected coders who (a) were involved in the development of the listening scale of the CSE, and (b) were familiar with CDA approaches. The coders were faculty members or Ph.D. candidates in the Applied Linguistics program and had considerable knowledge in language testing. They all had experience in teaching EFL at tertiary level.
Test takers
We used item-level response data of 3,358 EFL learners at 11 tertiary institutions who participated in one test form of a field test, which was collected in the larger project of developing a national English testing system by the test development team. We are part of the team as well. Most of the EFL learners were expected to be at intermediate and upper-intermediate EFL proficiency levels, approximately B1 and B2, if put in terms of the CEFR. Test takers in the field test were randomly selected within a stratified sampling design that controlled for the following variables: university tier, region, gender, and academic field. The sample was carefully selected to ensure that the distributions of each demographic characteristic in the sample could match those in the target test-taking population as closely as possible. The sample and population percentages showed a close match for all variables, with differences ranging from 0% to 2.6%, 3.1% to 5.3%, 4.0% to 4.0%, and 0.4% to 6.5% respectively for the four sampling variables (i.e., university tier, region, gender, and academic field).
Instrument
The listening test is a 30-minute test that is administered in paper-and-pencil format. It comprises two sections with a total of 25 items. The first section includes 20 four-option multiple-choice items based on six monologues and dialogues. The question for each item is printed on the test paper along with item options. The second section includes five gap-filling items based on one monologue. The recording for the first section is played only once, whereas that for the second section is played twice. Test takers can take notes while they are listening. The topics of the listening test are various, covering personal (e.g., environment around us), educational (e.g., teaching), public (e.g., popular science and modern technology), and professional domains (e.g., professional development).
The listening test is developed with a multi-componential view of listening ability (Field, 2013; Vandergrift, 2007; Vandergrift & Goh, 2012), in accordance with the construct of the listening subscale of the CSE. This view emphasizes that listening involves orchestrating multiple cognitive processes and different sources of knowledge (i.e., both linguistic and non-linguistic) to accomplish certain listening tasks (He & Chen, 2017). The listening attributes measured by the listening test include (1) understanding words and syntactic structures, (2) extracting detailed information, (3) connecting and synthesizing information, (4) making inferences, and (5) recognizing the speaker’s attitude and intention.
Procedure
The present study consisted of three phases. The first phase was a standard setting study, which identified cut scores that represented the just qualified candidates (JQC) for the four proficiency levels (i.e., A, B, C, and D) as specified by the listening test. The second phase was a CDA study, which classified test takers into different latent subskill profiles (e.g., 0000, 0101, and 1111), based on their item-level responses to the listening test and item-attribute relationship specified in the Q-matrix. In phase three, phase one and phase two information was inspected to investigate the feasibility of combining the results from the two approaches in order to present individualized feedback to test takers. The details for each phase are described below.
Phase 1. The standard setting study used a modified Angoff method in which 15 panelists were asked to estimate the probability that a JQC of each performance level would answer an item correctly. After training and discussion of the modified Angoff standard setting method and performance level descriptors, the panelists made two rounds of judgments. In round one, panelists listened to the recording and gave ratings based on the group’s discussion of the knowledge and skills associated with a JQC of each performance level. In round two, panelists could revise their initial ratings after they discussed their rationales for round one ratings and saw the overall mean, frequency and range of the group’s ratings for each item, as well as empirical item difficulty values. The ratings in the second round were used to estimate the cut score for each proficiency level.
Phase 2
The listening attributes defined in the CDA study were developed based on the test specification of the listening test. Attributes 4 (making inferences) and 5 (recognizing the speaker’s attitude and intention) in the test specification were combined to form one attribute titled “making inference” because of construct similarity between the two and the limited number of items measuring each. The four attributes defined for Q-matrix construction included (A1) understanding words and syntactic structures, (A2) extracting detailed information, (A3) making inferences, and (A4) connecting and synthesizing information. After training and discussion of the attributes and item-attribute relationship as illustrated by five sample items, the five coders coded the 25 items on the listening test individually. They were asked to listen to the recording and report their reasoning processes for their item-attribute coding at item level. These verbal protocols were recorded and transcribed. Attributes that were agreed on by three or more coders (60% or higher) to be measured by the item were coded as 1 in the Q-matrix. The number of items coded for each subskill was 4, 22, 6, and 4 respectively. Of the 25 items, we coded 15 items as measuring one subskill, nine items measuring two subskills, and one item measuring three subskills. The average subskill per item was 1.4 (i.e., 36/25 = 1.4), which is quite similar to that (i.e., 1.3) in TOEFL® iBT listening section in Lee and Sawaki (2009) and Yi (2017).
Phase 3. We developed qualitative descriptors on the basis of the performance level descriptors in Phase 1 and cognitive attributes in Phase 2. We first examined, quantitatively, the compatibility of binary subskill classifications with overall proficiency classifications at individual and group levels. We then collaborated with a team of test developers and researchers who participated in Phase 1 and Phase 2 as working group members in developing the qualitative performance descriptors, following three steps: (1) keep the descriptors concerning input materials and leave out the descriptors concerning cognitive performance in performance level descriptions in standard setting; (2) create qualitative descriptors for each subskill in CDA by carefully considering the definition of the attributes in CDA and the descriptors concerning cognitive performance in performance level descriptions in standard setting; (3) generate individualized descriptors by combining CDA-based profiles with standard setting results. We developed the individualized descriptors in accordance with Nicol and Mcfarlane-Dick’s (2006) seven principles of good practice for formative feedback. Specifically, the descriptors were worded to be (1) easy to interpret, (2) motivational to students, and (3) informative to students.
Data analyses
To address Research Question 1, we investigated the classification accuracy and consistency of cut scores for the four proficiency levels yielded from the standard setting study. An array of procedures have been proposed to evaluate classification accuracy and consistency (e.g., Hanson & Brennan, 1990; Livingston & Lewis, 1995; Wainer et al., 2005), among which the Livingston and Lewis (1995) procedure was found to yield relatively more accurate classification results based on simulation studies (Wan et al., 2007) and employed in language assessment studies (Papageorgiou, Xi, et al., 2015; Zhang, 2010). In this study we therefore used the Livingston and Lewis (1995) procedure to estimate classification reliability via the software program BB-CLASS (Brennan, 2004). The Livingston and Lewis (1995) procedure compares the actual observed score distribution with the true score distribution predicted from a four-parameter beta model to calculate classification reliability. More detailed technical discussions of the procedure can be found in Livingston and Lewis (1995) and Brennan (2004). Prior to classification reliability analyses, we conducted Many-Facet Rasch Modeling (MFRM) analysis to establish the reliability of panelists’ ratings.
To address Research Question 2, we examined the classification reliability yielded from the CDA study at the attribute, pattern, and test levels. In this study we employed the “GDINA” package, version 2.7.8 in R (Ma et al., 2020) to run CDA analyses, through which the attribute, pattern, and test level classification accuracy indices were estimated, using approaches proposed by Iaconangelo (2017) and Wang et al. (2015). Prior to classification reliability analyses, we examined model–data fit to establish the adequacy of CDM in fitting the observed responses. Specifically, we utilized a number of models to fit the data, including the generalized deterministic inputs, noisy “and” gate (G-DINA; de la Torre, 2011) model, the deterministic inputs, noisy “and” gate (DINA; Junker & Sijtsma, 2001) model, the additive cognitive diagnostic model (ACDM; de la Torre, 2011), the reduced reparameterized unified model (RRUM; DiBello et al., 2007), and the deterministic input, noisy “or” gate (DINO; Templin & Henson, 2006) model. We evaluated both relative and absolute fit of these models to identify the best model to provide diagnostic classification.
To address Research Question 3, we investigated the relationship between test takers’ classification on general proficiency (i.e., Levels A, B, C, and D) and their diagnostic latent profiles on subskills (e.g., 0001, 0101, 1111) to see if these two pieces of information could be combined to produce individualized feedback. We performed analyses at the individual and group levels. At the individual level, we examined the number of test takers classified into each latent pattern across proficiency levels to see whether there was any discordant scenario, such as a highest proficiency level (Level A) student classified as a non-master of all attributes (i.e., 0000) or a lowest proficiency level (Level D) student classified as a master of all attributes (i.e., 1111). At the group level, we compared the mean attribute mastery probabilities across the four proficiency levels to see whether the mastery probability of all the attributes increases by proficiency level. Finally, we integrated CDA-based subskill profiles with standard setting results to generate individualized descriptors for individual test takers.
Results
Standard setting analyses
We carried out a three-facet MFRM analysis on the rating data in the second round of standard setting, with panelists, test items, and levels as facets. The results showed that the severity values ranged from −1.22 to 1.33, suggesting that none of the panelists were too severe or lenient. Thirteen out of the 15 panelists were consistent in assigning ratings, as evidenced in the infit and outfit mean square values within the range of 0.5 to 1.5 (Linacre, 2002). Two panelists had infit and outfit mean square values above 1.5, indicating significant variability of these panelists’ ratings from the specified model. However, their values were below 2, in a range where the overall results would not be largely distorted (Linacre, 2002). We thus removed these two misfitting panelists from follow-up analyses and used the ratings of the remaining 13 panelists to estimate cut scores for each level.
Based on the cut scores, we classified the 3,358 test takers who participated in the field test into four levels. Table 1 presents the overall reliability of classifying test takers into four proficiency levels for the listening test. The overall classification accuracy was 0.81, indicating that 81% of the test takers would be placed into the correct level according to their observed and true scores. The overall classification consistency estimate was 0.73, suggesting that 73% of the test takers would be placed into the same level if two parallel test forms were administered. Kappa assesses the level of exact agreement after removing the number of exact agreement as expected by chance (Papageorgiou, Xi, et al., 2015). Kappa coefficient varies from −1 to 1, with values below 0.40 indicating low agreement, between 0.40 and 0.75 indicating acceptable agreement, and above 0.75 indicating high agreement (Fleiss, 1981). The Kappa coefficient was 0.46, suggesting that the proportion of exact agreement after correction for chance is acceptable.
Overall classification reliability for the listening test.

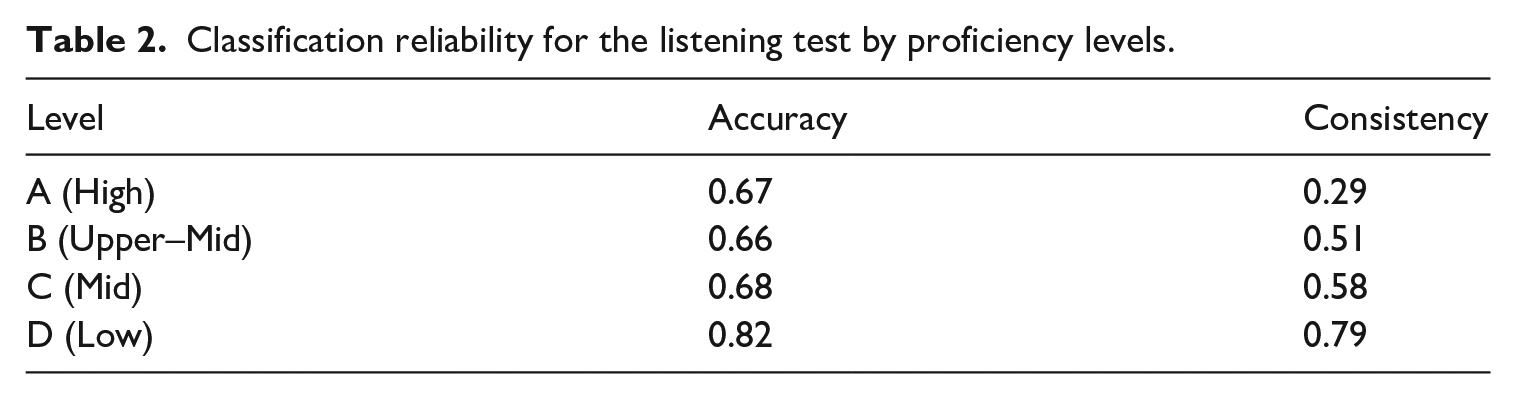
Table 2 shows the classification accuracy and consistency estimates for each proficiency level. As can be seen from Table 2, the classification accuracy and consistency estimates for three of the four proficiency levels were similar, with the exception of the highest proficiency level (Level A), which had a classification consistency estimate of 0.29 and seemed to be comparatively low.
Classification reliability for the listening test by proficiency levels.
CDA analyses
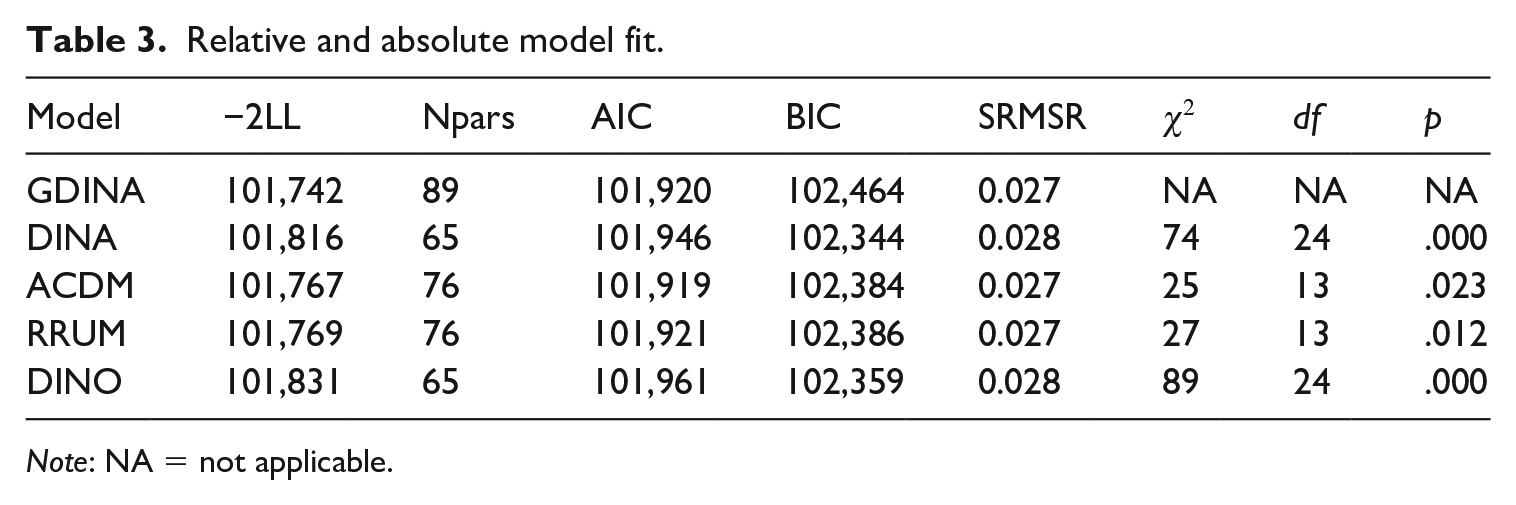
We fit five different models to the data, including the saturated G-DINA model, two non-compensatory models (i.e., DINA and RRUM), and two compensatory models (i.e., ACDM and DINO). Table 3 summarizes the results for absolute and relative fit of the models. All models had SRMSR (standardized root mean square root of squared residuals; Maydeu-Olivares & Joe, 2014) values smaller than 0.05, indicating acceptable absolute fit of all the five models. In terms of relative model fit, the G-DINA model was the best fitting model, as it had the lowest −2LL (−2 log-likelihood; Neyman & Pearson, 1992) value, followed by ACDM, RRUM, DINA and DINO. However, ACDM had the lowest AIC (Akaike’s information Criterion; Akaike, 1987) value and DINA had the lowest BIC (Bayesian information criterion; Schwarz, 1978) value, suggesting that these two reduced models provided viable alternatives when model complexity was taken into consideration. We then ran a series of likelihood ratio tests to examine whether there was significant difference in fit between the saturated G-DINA model and each nested model. As shown in the last three columns of Table 3, the saturated G-DINA model fit the data significantly better than the four nested models. Thus, we selected the G-DINA model as the final model for follow-up diagnostic analyses.
Relative and absolute model fit.
Note: NA = not applicable.
Table 4 displays the mastery probability of each attribute and the classification accuracy at attribute level. The mastery probability ranged from 0.34 to 0.51. That is, approximately 34% of the test takers mastered details, indicating it was the most difficult attribute; about 51% of the test takers mastered inferences, making it the easiest attribute. The classification accuracy estimates for all the attributes were relatively high, all above 0.70, indicating that test takers could be accurately classified as masters or non-masters at the attribute level.
Mastery statistics and classification accuracy at attribute level.

At the pattern level, we classified test takers in this study into 16 latent classes (24). For space considerations, we only present the five most frequent patterns in Table 5. As shown in Table 5, the subskill profile 0010 had the highest probability (i.e., 20.9%), indicating that 20.9% of the test takers were predicted as a member of this latent class. They are expected to be a master of Attribute 3 (making inferences), and a non-master of Attribute 1 (understanding words and syntactic structures), Attribute 2 (extracting detailed information), and Attribute 4 (connecting and synthesizing information). The classification accuracy of the five most frequent subskill profiles 2 is generally acceptable, ranging from 0.63 to 0.94, with an exception for the subskill profile 0000. The classification accuracy for the overall test was 0.61, suggesting that the test had a 61% probability of classifying a randomly selected test taker into his/her true latent class.
Classification accuracy at pattern and test levels.

Consistency between standard setting and CDA analyses
We compared the consistency between the results yielded by the two methods at individual and group levels. At the individual level, the number of test takers classified into each latent pattern for all the four proficiency levels was summarized in Table 6. Table 6 shows that test takers classified into subskill profile 0000 were Level C and D students, whereas those classified into subskill profile 1111 were Level A, B, and C students. Put another way, none of the high proficiency group students (i.e., Level A) were identified as a non-master of the four attributes, and none of the low proficiency group students (i.e., Level D) were classified as a master of all the four attributes. This suggests that the two pieces of classification information could be combined to form a consistent score report for test takers. However, it is possible that a test taker at a higher proficiency level is identified as having more failed attributes than a test taker at a lower proficiency level. For instance, Level A students were classified as a master of at least three attributes (i.e., 1101, 1111), as indicated by Table 6, while the number of attributes mastered by Level B students ranged from one to four (e.g., 0100, 0101, 1101, 1111). That is, it is possible that a Level A student was classified as mastering three attributes while a level B student mastering four attributes. The proportion of students who showed such a discordant pattern was 13.9%. This is understandable when the two test takers got scores close to the cut score, as the two pieces of information stemmed from different scoring and classification methods.
Number of test takers classified into each pattern for four proficiency groups.
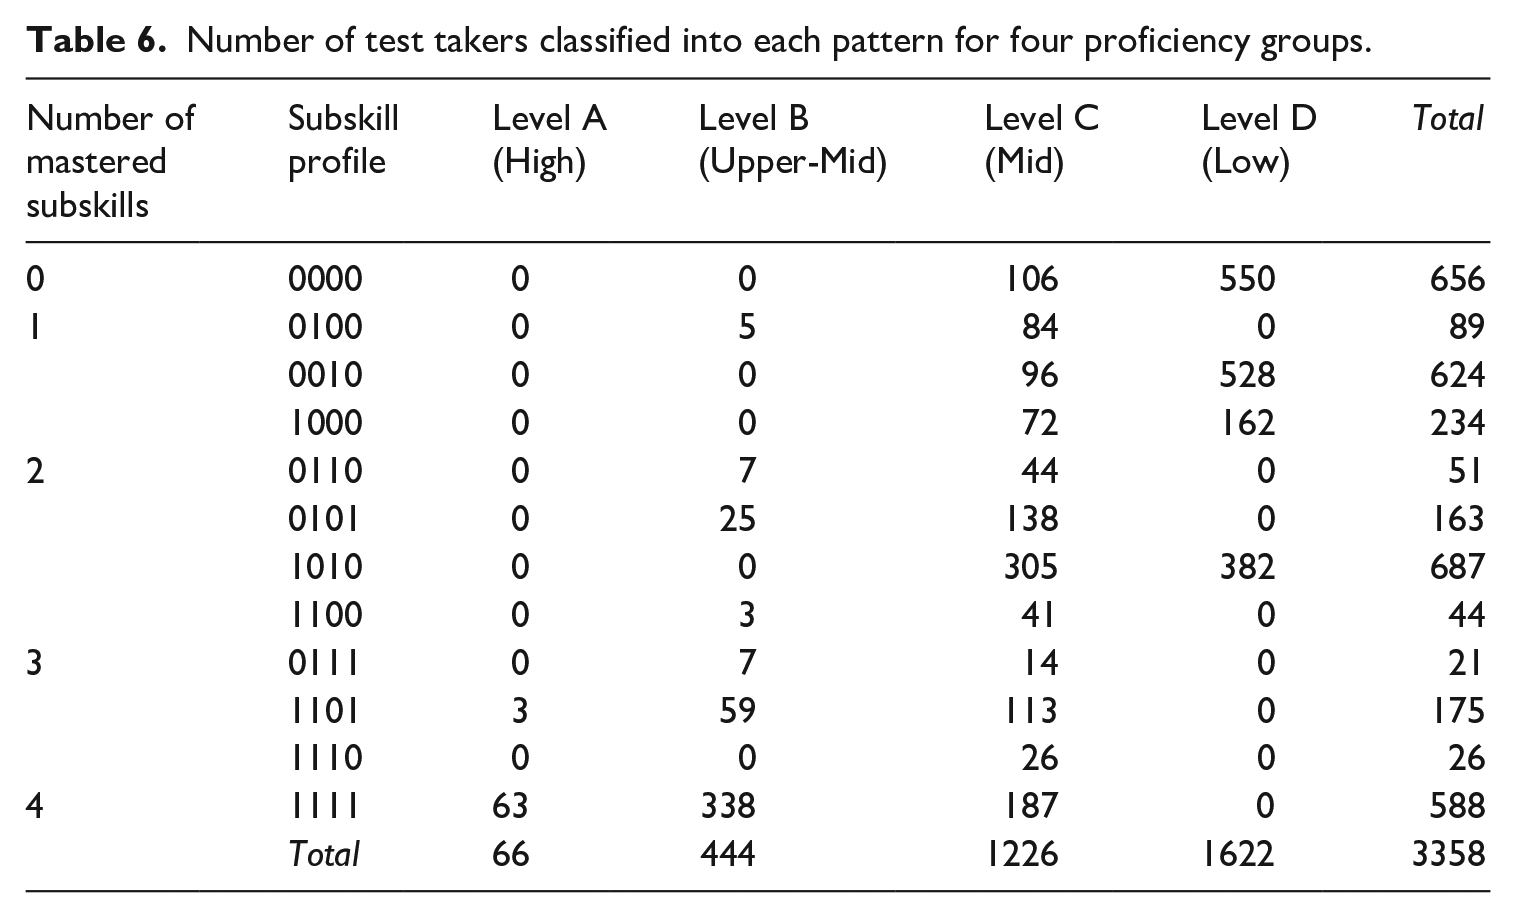
At the group level, the average probability of a pass on each attribute for all test takers at the four proficiency levels is presented in Figure 1. The uppermost line in Figure 1 describes the mean probabilities of all test takers at Level A, the second line Level B, the third line Level C, and the bottom line Level D. The probabilities for the first two lines, Levels A and B, were all well above 0.5. As pointed out by Rupp et al. (2010), an attribute mastery probability equal to or greater than 0.5 is statistically classified as mastery of that attribute, while a probability less than 0.5 is non-mastery. This indicates that, on average, test takers classified at the high and upper-middle levels have mastered all the four attributes. The probabilities for Level C was balanced on each attribute, generally above 0.5, with the exception of Attribute 4, which manifested a mastery probability of below 0.5. Level C is the level that is expected to be achieved by passers of the test. This result, therefore, is expected as passers should have an average probability of a pass on most attributes. The bottom line for Level D was quite uneven, with probabilities below 0.5 for three attributes. In addition, the figure shows that the mean mastery probability generally increases monotonically by proficiency level for all attributes, with the exception of Attribute 3 (making inferences) at Level C and D. The probability of a pass on Attribute 3 for Level D was 0.53, slightly higher than 0.51, the probability for Level C. These results indicate that overall, the standard setting and CDA classifications agree with each other at the group level.

Average probability of a pass on each attribute for four proficiency groups.
We then integrated the CDA-based subskill profiles with standard setting results to generate individualized descriptors for each test taker. We developed the individualized qualitative descriptors primarily on the basis of the performance level descriptors, and secondarily with reference to the CSE and test specification. The descriptors illustrate the typical overall performance for test takers in each band level and each test taker’s individualized performance on listening subskills. (See templates to generate individualized qualitative descriptors in this paper’s Supplement Table 1, which is available online at Language Testing.) Two examples are given below to provide a general picture of the individualized descriptors for test takers. For instance, a test taker classified into Level B (Upper-Mid) based on standard setting results, and a subskill profile 1100 based on CDA results receives a report that reads as follows: You can understand oral texts (e.g., lectures, interviews) about general topics delivered at a normal speed. While listening,
you display a good understanding of the vocabulary and grammatical structures.
you can extract detailed and key information.
To further develop your listening ability,
practice connecting and synthesizing information from different parts of a text.
try making appropriate inferences on the basis of that information, too.
A test taker classified into Level A (High) with a subskill profile 1101 receives a report that reads as follows: You can understand oral texts (e.g., lectures, interviews, news) about general topics delivered at a normal speed, even when the text is linguistically somewhat complex. While listening,
you display a good understanding of the vocabulary and grammatical structures.
you can extract detailed and key information.
you can connect and synthesize information from different parts of a text.
To further develop your listening ability,
try making appropriate inferences on the basis of detailed information.
Discussion
We first investigated the classification reliability of standard setting results and then the classification reliability of CDA analyses. After establishing the classification reliability of the results yielded from the two approaches, we explored how the two pieces of information can be combined to generate individualized qualitative feedback. The standard setting results indicated that the classification reliability for three of the four proficiency levels was acceptable, with the exception of the highest proficiency level (Level A). The CDA results showed that the classification reliability of attributes and the most common subskill profiles was satisfactory, the exception being the less frequent subskill profiles. Most importantly, proficiency classifications and subskill mastery classifications were found to agree with each other at individual and group levels, indicating that standard setting and CDA approaches could be combined to produce individualized feedback.
Proficiency classification reliability
With regard to proficiency level, the classification accuracy in this study ranged from 0.66 to 0.82, and the classification consistency from 0.51 to 0.79, with the exception of 0.29 at the highest level (Level A). There does not seem to be a “rule of thumb” for acceptable classification accuracy and consistency estimates (Powers et al., 2017; Young & Yoon, 1998). However, our results are comparable to those reported for high-stakes English language assessments in previous studies, such as the TOEFL Junior Comprehensive overall score levels (Papageorgiou, Xi, et al., 2015), the WIDA ACCESS proficiency levels (Center for Applied Linguistics, 2019), and the TOEFL ITP® section score levels (Powers et al., 2017). For instance, the classification accuracy for the TOEFL ITP® listening score levels ranged from 0.69 to 0.86, and their classification consistency from 0.56 to 0.79, if the highest level was excluded, which had a classification accuracy estimate of 0.00 and consistency estimate of 0.26. Therefore, it can be reasonably concluded that the classification reliability in our study is generally acceptable, except for the highest proficiency level. One plausible explanation for the low classification reliability for the highest proficiency level, similar to the study conducted by Powers et al. (2017), might be that estimation tended to be unstable owing to the relative paucity of data at this level, as only 2% of the test takers (66/3,358) were classified at Level A and 36 test takers just reached the cut score. It has been well documented that classification reliability estimates could be influenced by the number of test takers at that level (Center for Applied Linguistics, 2019), and the number of test takers with scores close to the cut score (Emons et al., 2007). Thus, caution must be taken when making high-stakes decisions with regard to Level A. That said, the proficiency classification for the vast majority of test takers (98%) is satisfactory, indicating that proficiency classifications are generally of sufficient psychometric quality.
Attribute classification reliability
The classification accuracy for the four attributes in CDA analyses were all above 0.70, suggesting that the test could reliably identify test takers’ strengths and weaknesses at the attribute level. This indicates that CDA may provide a viable alternative to reporting more fine-grained information for formative purposes, when the number of items per attribute is not large enough to produce reliable subscores at the attribute level. As pointed out by Sinharay (2010), the number of items may need to reach 20 for a subscore to be an accurate measure of a test taker’s ability in that attribute. However, most high-stakes EFL listening tests comprise fewer than 40 items owing to the time constraint and the prevention of test taker fatigue. For instance, TOEFL iBT listening section was composed of 34 listening items measuring three major listening subskills (Lee & Sawaki, 2009) and shortened to 28 listening items in the Shorter TOEFL iBT® Test starting from August 1, 2019. The TOEFL Primary listening section consists of 30 items that assess four communication goals (Choi & Papageorgiou, 2020). It is therefore understandable that previous research on providing subscores has generally produced unsatisfactory results, claiming that subscores are not of adequate quality psychometrically (Papageorgiou & Choi, 2018), and that subscore-based inferences are supported only at group level but not at individual test taker level (Choi & Papageorgiou, 2020). This study has demonstrated that CDA analyses, by using a smaller number of latent scale points in estimation than item response theory (IRT) analyses (Templin & Bradshaw, 2013), provide acceptable classification reliability and thus the possibility to meet the substantial demand from test users on more detailed information.
It should be pointed out, however, the classification accuracy for the less frequent subskill profiles at the pattern level does not seem encouraging. This result is in line with findings from previous research (Iaconangelo, 2017) that accurate classification of test takers into less frequent latent classes remains challenging, probably owing to the scarcity of data for those patterns. Consequently, this may have led to the finding that the classification accuracy at the test level was only moderate (i.e., 0.61), as the classification accuracy estimate at the test level is highly contingent upon the classification accuracy of all subskill profiles (Iaconangelo, 2017). The finding is partially in alignment with previous CDA research on TOEFL® iBT listening assessment (Lee & Sawaki, 2009) that reported a cross-form classification reliability of 0.796. Nonetheless, the reliability in Lee and Sawaki (2009) was calculated as adjacent agreement between the number of subskills mastered by each test taker across forms (i.e., the results matched for all or all but one skill), which is a less stringent criterion than that in the present study. Currently there is a lack of agreed guidelines on what values of classification accuracy can be considered large enough for a given test in CDA analysis (Sinharay & Johnson, 2019), it is therefore up to researchers and practitioners to decide the credibility of diagnostic results by weighing different sources of information. Overall, the results of this study showed that CDA can make reliable mastery/non-mastery classifications at attribute level, and can reliably classify test takers into the most common subskill profiles, we thus concluded that the diagnostic information derived from CDA analyses can be used for low-stakes formative decisions.
Another interesting finding of the present study is that none of the test takers were placed into the four subskill profiles of 0001, 1001, 0011, and 1011, thereby reducing the classification accuracy estimates of the four subskill profiles at pattern level to be almost 0. The lack of the four subskill profiles indicates that mastering the subskill of extracting detailed information might be a prerequisite to mastering the subskill of connecting and synthesizing information. This hypothesis, however, is rather speculative. It diverges from the assumption of compensatory CDMs (e.g., Yi, 2017), non-compensatory CDMs (e.g., Aryadoust, 2018; Buck & Tatsuoka, 1998; Sawaki et al., 2009), as well as saturated CDMs (e.g., Toprak et al., 2019) employed in previous CDM listening studies and the present study. The attributes in these models are hypothesized to be correlated by default, which implies that mastering one subskill does not require the mastery of another (Liu, 2018). However, if attribute hierarchy is present for the listening attributes, CDMs that can account for such type of dependent relationship may provide a better alternative for diagnostic classification, such as the attribute hierarchy method (Leighton et al., 2004) and the hierarchical diagnostic classification model (Templin & Bradshaw, 2014). Future research is warranted to examine whether the listening subskills can be hypothesized as sequentially ordered and whether modelling the potential hierarchical structure could lead to higher classification reliability at attribute, pattern, and test levels.
Individualized feedback
The finding that standard setting and CDA results were aligned with each other at individual and group levels indicates that the two pieces of information can be combined to produce individualized feedback for test takers. Based on standard setting results, numeric scores can be converted to level descriptors, through which test takers’ ability to process a certain level of input materials can be described (Green, 2018; Powers et al., 2017). Based on CDA results, diagnostic information can be provided about what each individual test taker can do from a cognitive perspective (Jang et al., 2015; Kim, 2015). Drawing on the merits of each method, the integrated approach can provide individualized feedback, which would be neither too general to link assessment with remedial teaching and learning (Papageorgiou, Xi, et al., 2015), nor too fine-grained to prevent actionable plan for teachers and students (Sawaki & Koizumi, 2017).
We extend previous test feedback research on large-scale language assessments that developed band-level descriptors for a typical student’s skills at each band level (e.g., Jang et al., 2019; Papageorgiou et al., 2015; Powers et al., 2017). To maximize educational outcomes from large-scale assessments, we attempted to provide additional, individualized feedback about the specific abilities of each test taker at different band levels for the listening section of a large-scale national EFL test. The descriptors we developed in the present study are intended to be used for formative purposes, that is, to inform remedial learning and instruction. According to Nicol and Mcfarlane-Dick (2006), good formative feedback should be easy to interpret, motivational, and informative.
To facilitate test score users’ interpretations about what the classifications mean, we translated the diagnostic results into qualitative descriptors with as few technical words as possible. Describing the classification results in qualitative terms rather than offering a definitive mastery/non-mastery classification result can help avoid unintended misuse of the diagnostic classification results for high-stakes purposes such as certification. To enhance interpretability, we used the test takers’ native language as the medium of information to ensure that even low proficiency level students can understand the language. We also provided exemplar items for each subskill on the official website of the test to help score users understand what each subskill means.
Additionally, we worded the descriptors positively. Jang et al. (2015) revealed that students’ interpretations and uses of the diagnostic information are mediated by their perceptions, affects, and goal orientations. Therefore, we paid careful attention to ensure that the descriptors were worded to be motivational. We hope that students reading the feedback will be encouraged to continue developing pertinent subskills to improve their EFL listening ability.
Most importantly, we avoided using qualifiers such as “often” and “occasionally” to ensure the informativeness and transparency of the descriptors. As pointed out by North (2000), distinctions between band levels should be real, rather than dependent on such qualifiers. Following the salient features approach in language proficiency frameworks such as CEFR (Council of Europe, 2001), we avoided using relative wording with qualifiers, and used the criterial features of the typical task at each performance level, such as topic and linguistic complexity, to differentiate the typical input materials that test takers at different band levels can process. In addition, we crafted descriptors for different subskill profiles to describe test takers’ individualized performance at the subskill level. By integrating the two pieces of information, we aimed to provide readable and easy-to-understand individualized qualitative descriptors for each test taker. However, the usefulness of the descriptors for guiding remedial learning and instruction will need to be examined in follow-up research after the introduction of the test.
Conclusions
A central issue that has been addressed in this study relates to the criticism that large-scale language assessments fail to provide individualized feedback to effectively link assessment with instruction. We believe that the present study has demonstrated the feasibility of providing test takers such individualized diagnostic information by combining standard setting and CDA approaches. As score reports have been increasingly viewed as part of a test validity argument (O’Leary et al., 2017; Tannenbaum, 2019), this study, by attempting to provide individualized feedback with appropriate details, makes some contribution to the enhancement of score reporting as well as test validity.
In addition, this study represents one of the earliest CDA applications that report classification reliability at the attribute, pattern, and test levels. Investigation of the classification reliability prior to reporting subskill mastery information to test takers is of particular importance because inaccurate and inconsistent diagnosis can lead to misinterpretation of test takers’ subskill profiles and thus faulty remedial decisions (Sinharay et al., 2019). Given that weak classification reliability was found for the less common subskill profiles owing to the scarcity of data, and consequently the test-level classification reliability was only moderate, we believe the individualized feedback generated in this study may be best used for low-stakes decisions such as remedial learning and instruction. All subskill profiles should be of sufficient psychometric quality if CDA classifications are used for high-stakes decisions such as certification.
Further studies in the following three areas are warranted to further investigate the validity of inferences made on the basis of CDA results. First, future research is needed to examine whether a more comparable number of items on each attribute would result in higher diagnostic classification quality. If so, careful attention needs to be paid in future test assembly to ensure a more balanced number of items measuring each attribute. Second, follow-up research could examine whether application of CDMs that can model the potential hierarchical structure of listening subskills would lead to higher classification reliability at attribute, pattern, and test levels. Third, future studies are warranted to collect external data to provide triangulation for the credibility of CDA results. For instance, teacher assessment and self-assessment data can be collected to examine the agreement between CDA classification results and their judgments.
Another limitation of this study pertains to the relative paucity of data at band level A (High), and consequently the low classification consistency at that level. Thus, no high-stakes decisions should be made with regard to Level A. However, given that the classification reliability was satisfactory for the vast majority of test takers (98%), we believe that the low classification consistency at Level A does not invalidate the whole process. It should also be noted that despite low classification consistency at Level A, the classification accuracy at Level A seems to be acceptable (0.67). It needs to be further investigated whether the low classification consistency at Level A is merely a statistical artifact owing to the small number of test takers at that level, or a substantive concern caused by a lack of sufficient items measuring students’ listening proficiency at that level. If the latter is true, the test developers should caution test users of any unintended high-stakes decisions to be made with regard to Level A, and probably recommend test takers to take a higher-level test in the national English testing system, if any high-stakes decision has to be made.
Overall, with the present study, we primarily focused on how standard setting and CDA can be combined to produce reliable classifications to generate individualized feedback from a quantitative perspective. A more important issue is how test stakeholders such as EFL teachers and students perceive and use such individualized feedback. It is far from known what teachers and students would do with such diagnostic feedback and to what extent it could enhance language learning and instruction. This is an important issue that is seriously under-researched in assessment feedback literature (Leighton, 2019) and represents a promising avenue for future research.
Supplemental Material
sj-pdf-1-ltj-10.1177_0265532221995475 – Supplemental material for Developing individualized feedback for listening assessment: Combining standard setting and cognitive diagnostic assessment approaches
Supplemental material, sj-pdf-1-ltj-10.1177_0265532221995475 for Developing individualized feedback for listening assessment: Combining standard setting and cognitive diagnostic assessment approaches by Shangchao Min and Lianzhen He in Language Testing
Footnotes
Declaration of Conflicting Interests
The authors declared no potential conflicts of interest with respect to the research, authorship, and/or publication of this article.
Funding
The authors disclosed receipt of the following financial support for the research, authorship, and/or publication of this article: This work was supported by two National Social Science Foundation projects [19CYY050 and 20BYY107].

Supplemental material
Supplemental material for this article is available online.
Notes
References
Supplementary Material
Please find the following supplemental material available below.
For Open Access articles published under a Creative Commons License, all supplemental material carries the same license as the article it is associated with.
For non-Open Access articles published, all supplemental material carries a non-exclusive license, and permission requests for re-use of supplemental material or any part of supplemental material shall be sent directly to the copyright owner as specified in the copyright notice associated with the article.
