
Abstract
The growth process is revealed by tracing the diachronic paths followed by sixty growth firms over the period from 1994 through 2007. Initial employment size, rather than age, was found to have some bearing on the nature of the growth path. Smaller firms grew more often and with more continuity than larger firms. In the larger firms, growth occurred in relatively large isolated steps with little continuity. These findings have important implications for how this vital process is conceptualized and managed.
Introduction
How do firms grow? This question is beginning to challenge a literature that has so far provided only partial explanations for the amount of growth rather than an understanding of how firms actually grow (Leitch, Hill and Neergard, 2010: 258; McKelvie and Wiklund, 2010: 282). This article addresses directly the question of how firms grow over a period of fourteen years. In doing so, it also makes an original contribution to two emerging streams in the growth literature, viz., the characteristics of faster growing firms (Acs and Mueller, 2008; Acs, Parsons and Tracy, 2008; Parker, Storey and van Witteloostuijn, 2005; Tan Swin Lee, 2007) and the growth paths of post-start-up firms. Research on growth paths has concentrated on new firms (Biga Diambeidou, 2008; Garnsey, 1998; Garnsey and Heffernan, 2005; Garnsey, Stam and Heffernan, 2006) although older firms are both more numerous and less likely to fail (Phillips and Kirchhoff, 1989; Wagner, 1994; Yasuda, 2005). The next section reviews the literature and develops four propositions. The data are then introduced and applied to the propositions. We then conclude and outline the limitations of this study and suggestions for further research.
Literature review
Here we develop the four propositions that will guide this inquiry into how firms grow. There have been very few studies of the actual experiences of growing firms (Blackburn and Brush, 2009; Delmar, Davidsson and Gartner, 2003). The life cycle stages model continues to dominate textbook expositions of small business growth (e.g., Bygrave and Zacharakis, 2008; Hisrich and Peters, 2002; Kuratko and Hodgetts, 2004; Schaper and Volery, 2007; Timmons and Spinelli, 2004). The ontology of this model, that growth is a linear, sequential and deterministic process, has been seriously questioned (Davidsson, Delmar and Wiklund, 2006; Deakins and Freel, 1998; Levie and Lichtenstein, 2010; Phelps, Adams and Bessant, 2007).
An alternative framework used in many applied studies of business growth is Gibrat’s Law (Gibrat, 1931) which posits that changes in firm size over time are random (Geroski, 2005; Sutton, 1997). Hence cross-sectional attempts to ‘explain’ variation in the growth rates of businesses will leave large amounts of unexplained variation, which is generally the case (Dobbs and Hamilton, 2007; Weinzimmer, Nystrom and Freeman, 1998). The consensus seems to be that the growth rates of smaller (newer) firms are inversely related to their initial size but that Gibrat’s Law generally holds for larger (older) firms (Coad, 2007a: 11–14). Even if not random, the idiosyncratic nature of firms’ growth paths means that we are still some way short of a full understanding (Delmar et al., 2003: 211). Commenting on their own exposition of the life cycle model, Timmons and Spinelli (2004: 276) observe that ‘… [if] one actually tracked the progress of most emerging companies, the “curve” would be a ragged and jagged line with many ups and downs …’. The first proposition is about the ‘ragged and jagged’ nature of firm growth paths, or more formally, path stability and growth episodes:
Life cycle models are associated with relatively smooth growth paths whilst the Gibrat model predicts discontinuous patterns. Penrose (1968) is a theory of the growth (path) of established firms that embraces these divergent views. While Penrose does make occasional reference to determinants of ‘continuous growth’ (e.g., at page 215), the Penrosian growth path is largely idiosyncratic (see Penrose, 1968: 213). The essence of Penrose’s model is her firm’s ‘productive opportunity’, i.e., ‘all of the productive possibilities that its “entrepreneurs” see and can take advantage of” (Penrose, 1968: 31). When entrepreneurs are not able to either identify or exploit growth opportunities, then the growth rate will stall. Hence, we can expect discontinuity, even in firms which are intent on growth. Penrose (1968: 208–209) also anticipates step-like growth when it would make sense for a firm to expand in one large capital-intensive step, although such growth need not be reflected in employment growth. There are also systematic influences on the growth path, such as the growth-reinforcing effects of past growth (Penrose, 1968: 99–103), and the non-linear relationship between firm size and growth rate, based on the difficulty of generating sufficient resources to maintain growth in very small and very large firms (Penrose, 1968: 212–213). This leads us to our second proposition which is about the self-reinforcing nature of growth over time, drawing directly on Penrose’s treatment of the economies of growth and the analogous proposition pertaining to new firms in Garnsey et al. (2006: 8):
This has also been tested in larger samples in terms of the serial correlation of growth rates (see Coad, 2007a: 15–18), but results have been mixed (cf. Botazzi and Secchi, 2003; Hart, 2000; Geroski, 2005). It is important to control here for both firm size and growth rate. Coad (2007b) finds that annual growth rates are negatively correlated in small firms but positively related for large firms, with the caveat that extreme rates of growth (or decline) are seldom sustained into the next period.
Penrose suggests (at page 218) that larger firms have many ongoing advantages over smaller, newer firms including a management team that has learnt how to grow, with an accumulating amount of tacit knowledge that enables growth to be sustained (Penrose, 1968: 205–206). On these matters of size and age, Penrose (1968: 205) is quite explicit: There can be little question that in general the larger and older firm has certain advantages over the smaller and newer firm which ease its operating problems and reduce the managerial services required
As the management resources needed by current operations falls, so the quantum available to plan and manage growth increases. A counter argument is also possible. To the extent that very small firms can only get bigger, at least until they reach a minimum viable scale, they may indeed have more growth momentum than larger firms. This increased momentum we expect to be evidenced by more growth episodes and more consecutive growth years, as reported in Garnsey et al. (2006) for new firms. The final proposition draws from the same discussion in Penrose. Older firms will have more experience from past growth to ensure growth paths are smoother than those of younger less experienced firms. Hence our final propositions are:
The data
This study draws on the annual employment histories of 358 businesses for the fourteen years from 1994 through to 2007. All these businesses were located within the same urban area of New Zealand (Christchurch), removing possible effects of location on the growth paths (Gartner and Bhat, 2000; North and Smallbone, 1995). The data were compiled from annual editions of the New Zealand Who’s Who, an annually updated publication that provides detailed information on some 18,000 New Zealand businesses. While this source is not a census of all businesses, it does cover a cross-section of industries and an appendix provides company ownership information by cross-classifying all subsidiary and associate companies to parent companies, and vice versa. Employment data were the only measures of growth available but these tend to be correlated with alternative measures such as sales (Davidsson et al., 2006: 8).
Businesses were classified by sector (Manufacturing, Wholesale/Retail, and Professional and Business Services) and ranked according to their absolute employment size change between these two years. There were 197 ‘growers’, i.e., employing more people in 2007 than in 1994; 102 declined in employment between 1994 and 2007; and the remaining 59 had the same number of employees in each of these years. The detailed analysis reported here focused on the 20 fastest growing businesses in each sector, 60 in total, i.e., those who increased employment by the largest absolute amount between 1994 and 2007. This is not a random sample of firms, not even of all growth firms in the database. The fastest growing firms tend to have the most erratic growth paths (Garnsey and Heffernan, 2005), so by concentrating on this subset of firms, we should maximize the variety of growth paths in the analysis.
In 2007, 52 of the growers (87%) continued to be private limited companies; two were public companies; and the remainder included partnerships and wholly owned branch operations. Fifty-eight of the businesses (97%) gave their Christchurch address as the head office of the business in 2007. Tracking these sixty firms through the years from 1994 to 2007, six of the growers were owned by other organizations for most of this whole period. Two others were subsidiary companies for different periods since 1994 but were listed as independent parent companies in 2007. When these companies were listed as ‘parent’ companies, this was mainly with regard to branches that they had opened within New Zealand or overseas. Two companies were listed during 1994–2007 as parent to other private companies (named in relevant edition of the New Zealand Business Who’s Who ), but this may understate the prevalence of acquisition activity and, more so, assets purchased in trade sales. By 2007, the youngest firms in this sample had been operating for 15 years and the oldest for over 100 years. None of the firms in this study were new start-up ventures. In Table 1 below we summarize the employment changes of these groups of firm, both by sector and by initial employment size (in 1994).
Employment Growth of Firms in Study
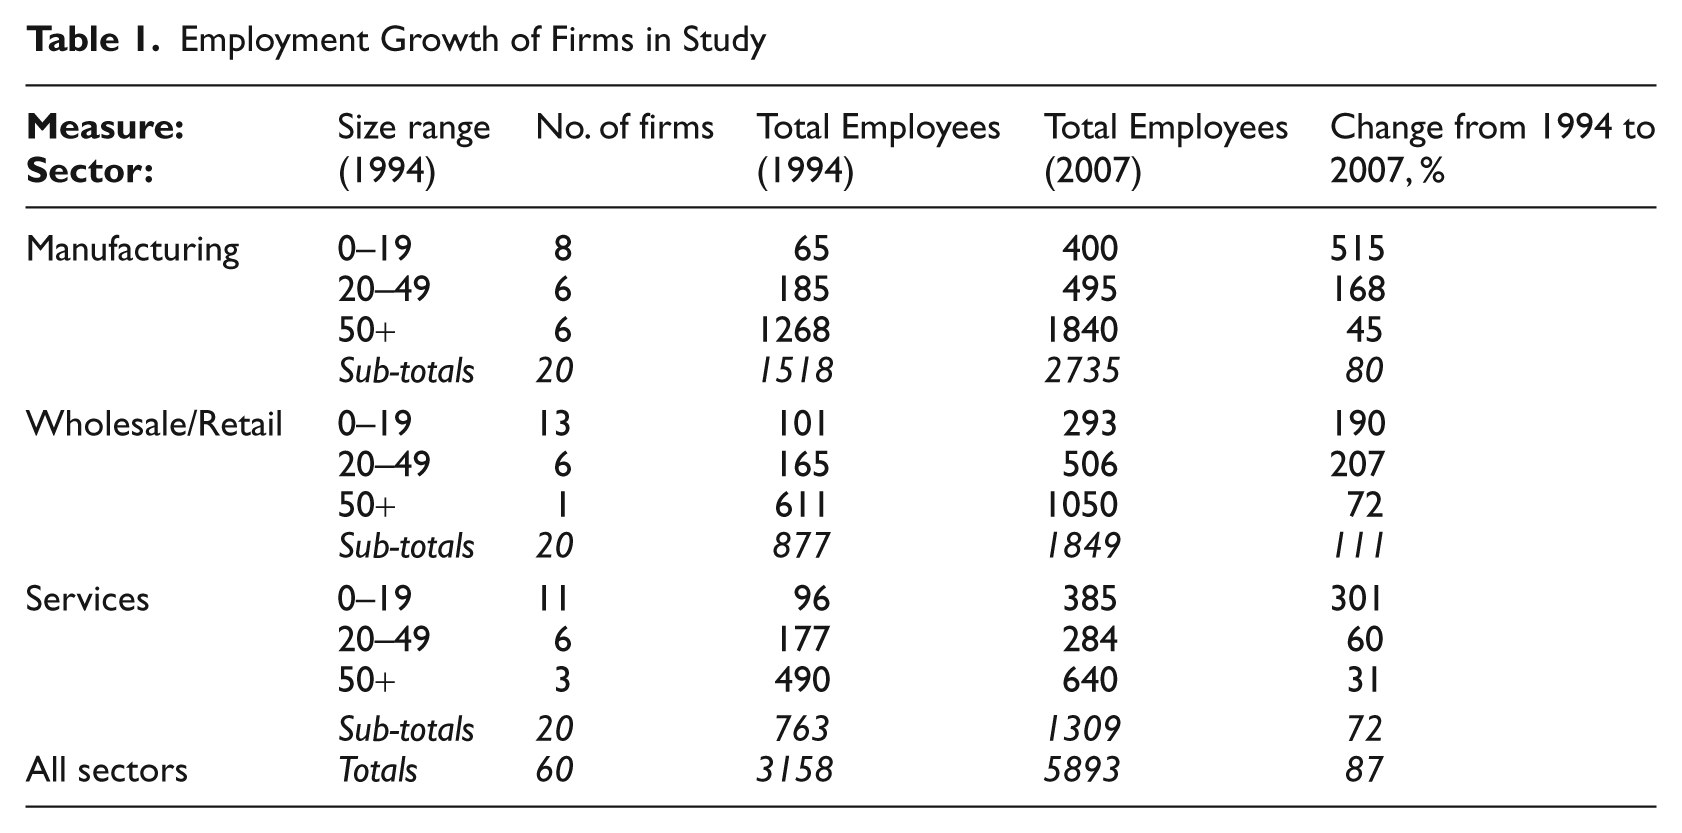
Over 83% of these 60 firms employed fewer than 50 people in 1994, and 60% still had fewer than 50 employees in 2007 hence, by international standards we are investigating growth from the smaller firm perspective (OECD, 2005). The three largest firms employed in 1994, 611, 520 and 370 people: the smallest firms employed five staff in that year. These ‘growers’ increased total employment from 3158 to 5893, an increase of some 87%. Initial size bore the inevitable strong inverse relationship to percentage growth rates.
The growth paths which are the focus of this analysis are idiosyncratic to each firm, somewhat analogous to a ‘fingerprint’. We seek to illustrate this in Figure 1 where we have reproduced the growth paths of three of our manufacturers. Here the ‘small’ manufacturer had seven employees in 1994; the ‘medium’ had 25; and the ‘large’ manufacturer had 500 employees at the beginning of the period. Note that these growth paths are each indexed to 1994=100 to distinguish the growth path from the growth amounts. These three manufacturers grew at different rates and at different times – there was no year between 1994 and 2007 when all three were in a growth phase.
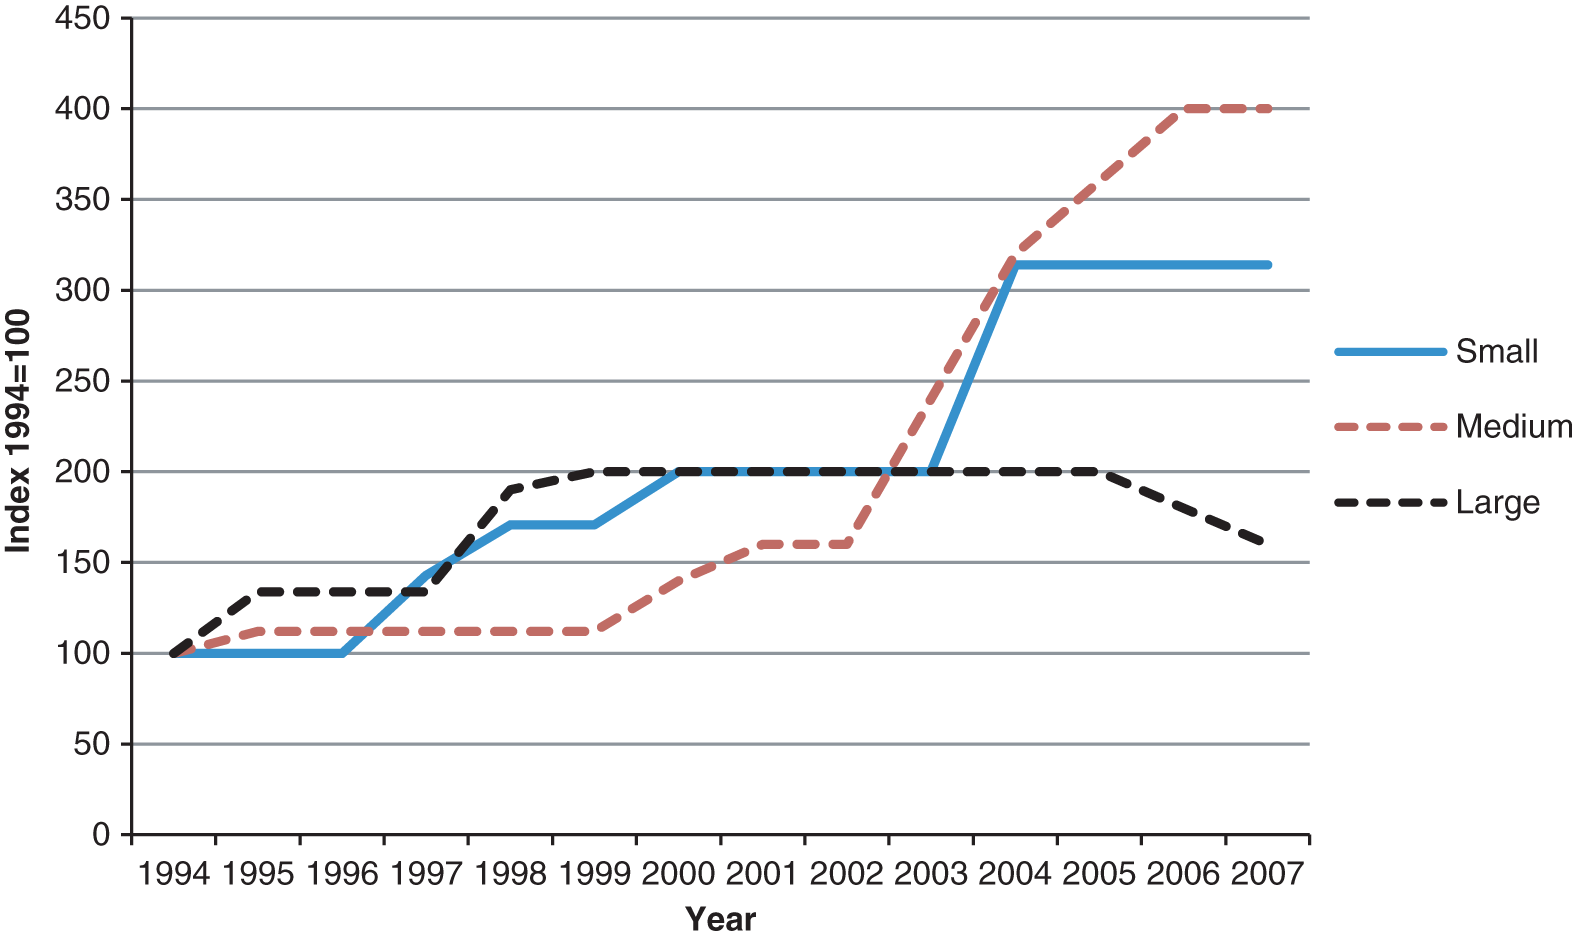
Growth Paths of Three Manufacturers
It is important to be clear on the nature of this selection of firms. First it is a cohort of growth firms who survived to reveal their growth path over fourteen years. Survivor bias is the consequence of having a longer growth period than previous studies (e.g., Delmar et al., 2003: 198; Garnsey et al., 2006: 12). Second, there has been no other censoring of these firms in terms of size or age. The approach of Delmar et al. (2003: 213) of censoring by firm size at the end of the growth period was considered. Among the limitations of their study, they justify the exclusion of all firms that did not have at least 20 employees at the end of their 10-year growth period, on the grounds that any high growth firm should by then have attained this minimum size. This would have culled eight firms (six retailers and two business service providers) from our study. These eight firms increased their combined employment from 54 in 1994 to 109 in 2007, a gain of 55 jobs. In this country (New Zealand), some 85% of businesses have five or fewer employees; the average employment size is seven employees; and most employment growth comes from very small business (Ministry of Economic Development, 1999), so it would be inappropriate to exclude any growing firm on the basis of size.
Our focus is on the diachronic paths revealed by the year-on-year change in employee numbers in these 60 growing firms. The 14 years of annual data generate 13 year-on-year changes in employee number per business, so our analysis is based on the 60 x 13 = 780 annual changes that make up the growth paths of the firms. Data points were coded simply as growth years; plateau (no change) years; and decline years. Only five growth years involved year-on-year increases less than 5%, so our findings are comparable to those for new firms in Garnsey et al. (2006: 12) where annual changes in either direction of less than 5% were coded as non-growth.
Analysis
Propositions 1 and 2: Path stability and growth sequences
In Table 2 we report the path sequences for the 20 growers in each sector. For these growing businesses, non-growth was their most common state, ranging from just over 64% of all years in Professional and Business Services through 69% among manufacturers and approaching 75% in Wholesale/Retail. When they do grow, they tend to do so by relatively large increments on their employment size. This is captured in the row labeled ‘largest growth step’ which gives the mean and range of the largest year-on-year growth increment along the growth path as a percentage of the largest size attained by the business during the fourteen-year time-frame. (This measure is defined as ‘one-shot growth’ by Delmar et al., 2003: 202). The average growth step accounted for between 35% and 43% of the maximum employment achieved, but with a wide range up to over 90% in one case. In absolute terms, of the 2735 jobs created by these 60 firms between 1994 and 2007, 2255 or 82% can be traced to one growth step. It is likely that such large increments will be accompanied by changes in areas such as organizational structure and culture consistent with the punctuated equilibrium interpretation of growth (Romanelli and Tushman, 1994).
Growth Episodes in Growing Businesses
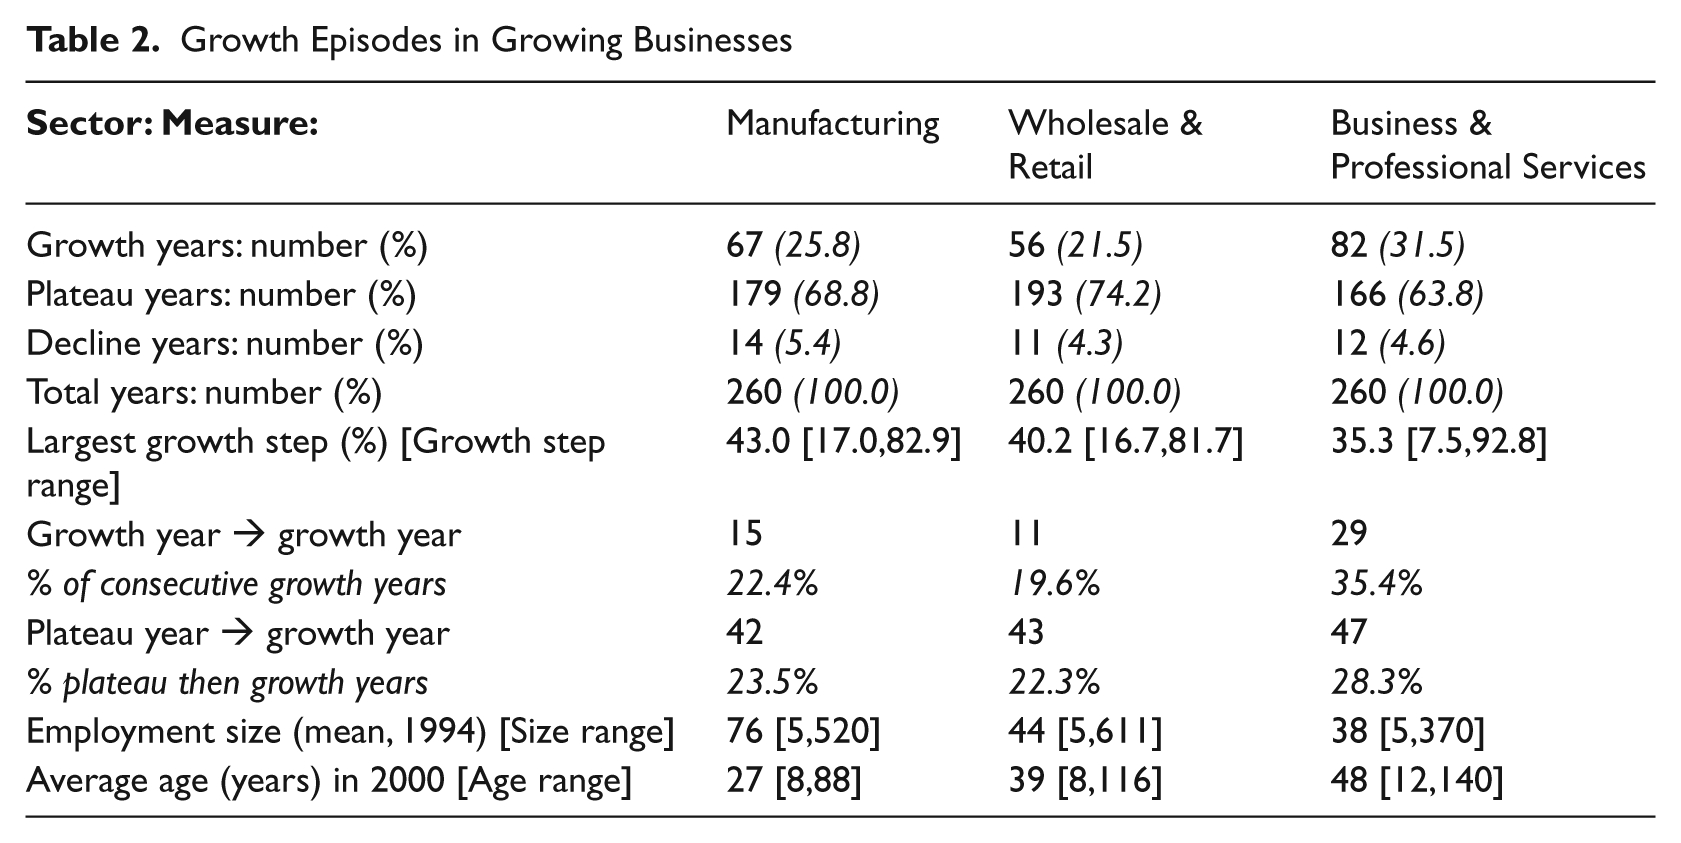
We find the percentage of consecutive growth years to range from around 20% to 35%, depending on sector, compared with 58–59% for new firms from Garnsey et al. (2006). These percentages are in effect the probability of any growth year being followed by another year of employment growth. The frequency of plateau-to-growth transitions is also lower in these firms, with a range of 22–28% compared with 36–52% reported in Garnsey et al. (2006). In reporting these differences it is important to bear in mind the different industry contexts of this study and Garnsey et al. (2006). We might nevertheless, expect new firms that survived to exhibit more consecutive years of growth as they pursued minimum efficient scale. These findings do however, conflict with Penrose’s suggestion that established firms will have more sustained growth. Newness appears to be more influential for the continuity of growth; instances of three years of consecutive growth were very rare. In Professional and Business Services, one growth year in eight (12.0%) was followed by two more years of growth. The frequency of this in Wholesale/Retail was only one in every 56 growth years (1.8%), with Manufacturing lying between these, with an occurrence of less than one in every thirty-four (3.0%). Again, these percentages are just the chances of any growth year being followed by two more consecutive years of growth.
It is apparent that growers in Business and Professional Services sector had more years of growth and the highest probability of consecutive years of growth compared to firms in the other two sectors. While this article is about how firms grow and not about the quantum of growth, we can note that the Business and Professional Services sector was the fastest growing in New Zealand between 1994 and 2007. Total employment (full-time plus part-time) in this sector increased by almost 74.6% from 144,300 in 1994 to 252,000 in 2007 (Department of Statistics, 2009). Over the same period, Wholesale and Retailing employment rose by 44.1% while that in Manufacturing declined by 3.2%. While a more expansive sector may accommodate more growth steps and more continuity of growth from year to year, the same reasoning cannot be extended to the other two sectors, because the Manufacturing growers recorded more growth years and had the higher likelihood of continuity. More refined additional data on intra-sector growth are necessary to progress this particular line of explanation.
The evidence in Table 2 supports Proposition 1 but not Proposition 2. Growth is episodic, comprised of relatively few discrete eruptions from an otherwise fairly flat landscape. Consecutive years of growth are less common than reported in Garnsey et al. (2006) for new firms. Businesses classified as growers over this period spent most of that time not growing.
Proposition 3 and 4: Initial size and age
There is no significant correlation in these data between employment size in 1994 and firm age (r=0.007, prob. 0.956). To assess Proposition 3, we have regrouped the data according to the initial size of these sixty growth companies. A growth path is deemed more ‘continuous’ when it has more consecutive years of growth. If the process is purely Gibrat, consecutive years of growth are possible but purely by chance. The higher the proportion of consecutive growth years, the less likely this is due to random processes. These data are set out in Table 3.
Growers: Initial firm size and growth paths
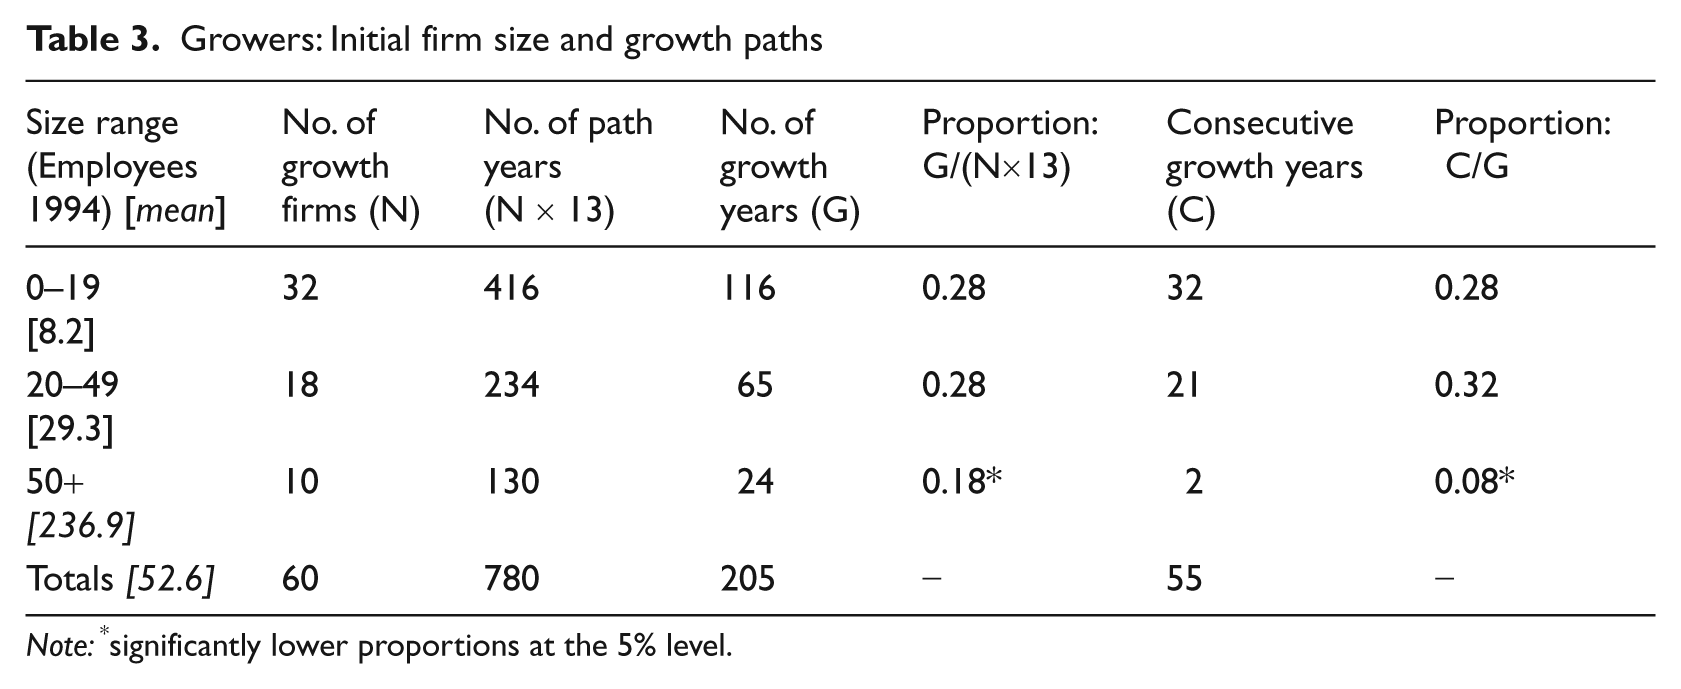
Note: *significantly lower proportions at the 5% level.
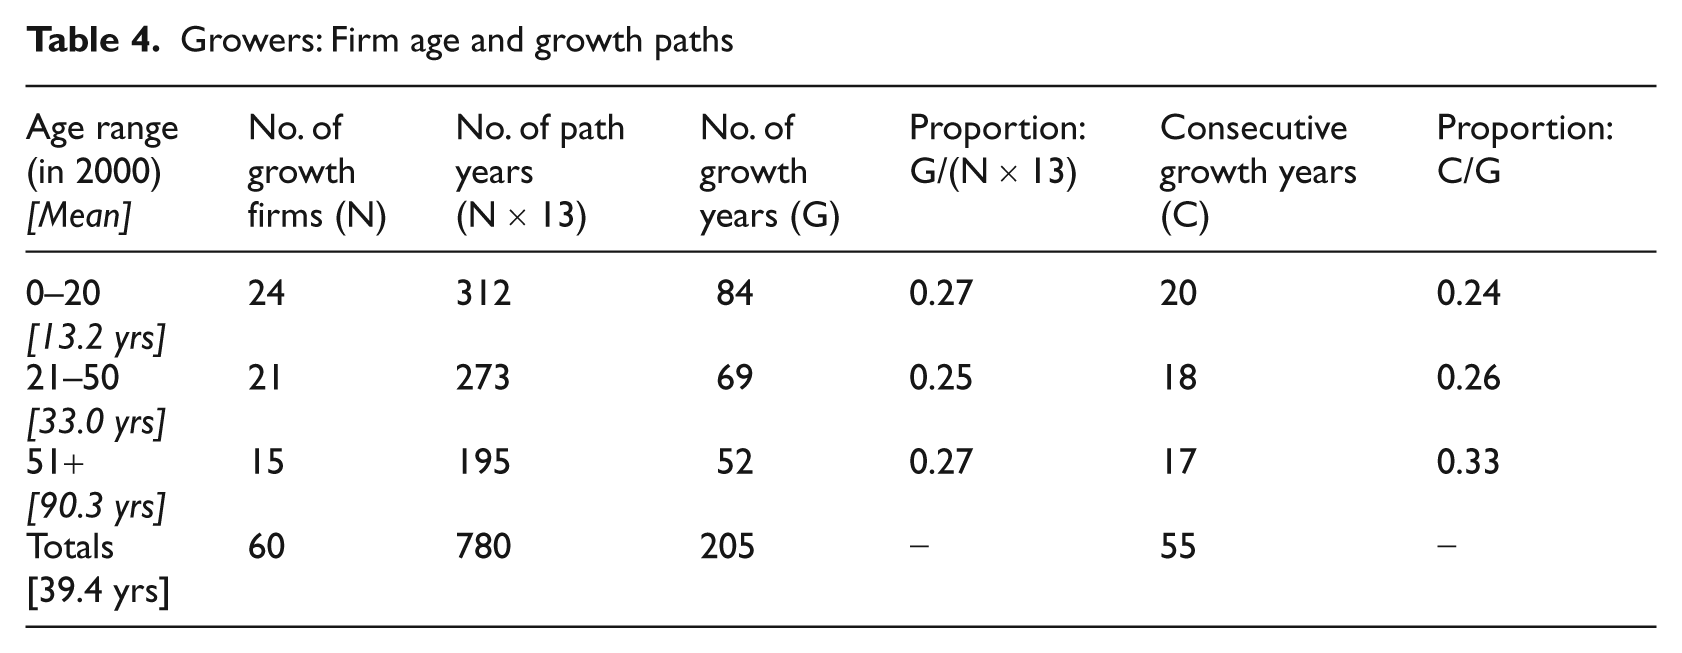
There are two proportions calculated in Table 3 that allow us to test this proposition. First, we have the number of annual growth episodes (G), our primary unit of analysis, as a proportion of all path years (Nx13). These proportions range from 0.28 in the smaller firms to 0.18 in the largest size range, this difference in proportions being significant. Smaller firms grow more often than larger firms, but do they grow with more continuity? We test this using the proportion C/G in Table 3 which is the likelihood of any growth year being followed by a consecutive year of growth. Once again, testing the differences in the C/G proportions, we can conclude that the group of largest firms has a proportion of consecutive growth years that is significantly lower than that in either of the smaller size groupings. Thus, we reject proposition 3: the growth paths of firms do reflect the initial size of the firm but it is smaller firms which grow more often and with more continuity. An analysis similar to that in Table 3 was carried out to test proposition 4 and these results are in Table 4. There were no significant age-related differences in the growth paths of these firms. There is one important caveat to add. While larger firms have fewer growth episodes, their growth steps are proportionately larger than those of smaller firms. Some 62.7% of all employment growth between 1994 and 2007 in the 0–19 size range was due to one growth step, compared with 86.5% and 93.6% respectively in the 20–49 and 50+ groupings.
Growers: Firm age and growth paths
Conclusions
The growth paths of post-start-up firms appear to be neither continuous nor random, echoing the findings for new firms from Garnsey et al. (2006: 18) and Biga Diambeidou (2008). However, in this post-start-up group of firms, we find that firm age had no bearing on the growth suggesting that any effects of newness do erode. The growth paths of these growing firms are markedly episodic, involving relatively few but large increments. Consecutive years of growth were observed but these were less frequent than has been reported for new firms. Firm size matters for the growth path: smaller firms grow with more continuity than larger firms. The marked contrast between how these firms grew and what business owners and mentors would expect from any stages model adds urgency to the call for more work on how firms grow. These growing firms spent most of their time not growing and then grew in one or two relatively large steps. There is no suggestion here of an incremental staged approach or, indeed, of growth reinforcing growth in the manner envisaged in Penrose’s theory. Growth in the manner revealed here must place great stress on a management team that is often small and lacking experience of managing growth.
These findings confirm the need for new conceptualizations of firm growth, indeed of firm development more generally. While we have not found support for some aspects of the Penrose model, there remains much in this work that remains germane to a contemporary understanding of the growth process in the smaller firm context. As discussed earlier, the growth path of the Penrose firm results from the interaction of its resource base, including entrepreneurial decision-making, and a set of new opportunities some of which are perceived as profitable – hence the firm’s ‘productive opportunity’ (Penrose, 1968: 31). Some individual must then make the strategic decisions that adequate resources are available and to which opportunity they will be devoted in order to create most value. This rendition of the core of the Penrose model, with its interplay among perceived opportunities, resources, and strategy, resonates with key elements of the dynamic states model proposed by Levie and Lichtenstein (2010) to displace traditional stage theories. In this new model of firm development, i.e., growth, shrinkage or no change in state, is driven from the ‘opportunity tension’ within the firm, the ‘perception (co-creation) of an untapped market potential and the commitment to act on that potential by creating value’ (Levie and Lichtenstein, 2010: 333). Thus, we have growth stemming from the perception of a new opportunity to create value; the strategic decision to commit to that opportunity and not others; and the application of the necessary resources. When the current market opportunity is static or shrinking, the dynamic states model would allow the firm to plateau or get smaller, developments that fit less readily into the Penrose growth model.
Having developed these insights into how firms actually grow, including the significance of one major growth episode, we would encourage more qualitative research investigating why firms grow in this way and the implications for managing growth. It is also important to recognize that, following Levie and Lichtenstein (2010), growth is only one phase in the development path of firms and we do need to conceptualize how this emerges from periods of stability or decline. Finally there are some limitations of this study to note and suggestions for further research. Employment data are less than ideal, giving at best an indirect measure of business growth. The use of annual observations is also problematic as there may be intra-period fluctuations that will not be captured. It would be interesting to repeat this study comparing sales growth paths with those for employment, and then relating changes in profitability to subsequent fluctuations along the growth paths.
Footnotes
Acknowledgements
The author would like to thank the Editor and the anonymous referees for their insightful and constructive comments. All the usual disclaimers apply.
Robert T. Hamilton is Professor of Management at the University of Canterbury, Christchurch, New Zealand. His research interests are in the dynamics of firm development and the international performance of industries.