
Abstract
This article explores how individual entrepreneurial orientation dimensions influence the relationship between competitive strategy and firm performance. The findings show the different impacts of individual entrepreneurial orientation dimensions on competitive strategy and the effects of cost leadership and differentiation on performance. Innovativeness is related most highly to differentiation strategy. Risk-taking and competitive aggressiveness are negatively associated with both differentiation and cost leadership strategies. Both differentiation and cost leadership strategies are positively related to performance. This study refines our understanding of the effects of entrepreneurial orientation on small firm performance.
Keywords
Introduction
Firm survival is lowest when firms are small and young; thus, the development of effective business strategies is critical for the continuity of the business (Thornhill and Amit, 2003). Strategic entrepreneurship deals with the creation of competitive advantage through the identification of new opportunities (Ireland et al., 2003). Entrepreneurial orientation (EO) is understood as the strategy-making processes, structures and behaviours of firms characterised by innovativeness, proactiveness, risk-taking, competitive aggressiveness and autonomy, facilitating the pursuit of opportunities (Lumpkin and Dess, 1996; Lumpkin et al., 2009). In general, research indicates a positive impact of EO on firm performance, but associated analyses suggest that the EO–performance relationship is mediated or moderated by diverse variables (Messersmith and Wales, 2011; Rauch et al., 2009; Wales et al., 2011a). Research on mediators is still rare and there is ‘little understanding of the causal mechanisms of how or why EO affects other variables’ (Wales et al., 2011a: 12).
Competitive strategy explores how a firm operates (Schendel and Hofer, 1979) in order to increase firm performance (Porter, 1980). Both EO and competitive strategy are strategic business unit-level concepts (Covin and Lumpkin, 2011): the former being the strategy-making-process and the latter describing the content. In this sense, competitive strategy adds content to EO and channels it (similar to how boxing training and tactics channels a boxer’s aggressiveness). In other words, EO would not be sufficient for firm performance without a competitive strategy (Ireland et al., 2003).
Consequently, a question arises as to how EO and competitive strategies are related. It has been suggested that competitive strategy mediates the EO–performance relationship: competitive strategy ‘is an intermediate variable between EO and performance, in the sense that firms with a greater entrepreneurial orientation will tend to develop certain types of strategies’ and will influence performance differently (Moreno and Casillas, 2008: 510). Therefore, the relationship between EO and competitive strategy is key to understanding small firm performance (Lumpkin and Dess, 1996; Wales et al., 2011a). Both EO and competitive strategies have their own inner logic; they are distinct theoretical constructs (Lumpkin and Dess, 1996) and their conceptual separation should help to advance the understanding of the transformation of EO into firm performance (Wales et al., 2011a). Since usually differentiation and cost leadership are described as opposing logics (Porter, 1985), it is illogical to assume that a universal EO has an impact on these two types of competitive advantage in a similar manner. Thus, an empirical approach with EO as a multidimensional concept, which specifically addresses how the individual EO dimensions impact (positively or negatively) these two types of competitive strategy, is appropriate (Wales et al., 2011a). Meta-analysis (Rauch et al., 2009) and an extensive review (Wales et al., 2011a) of EO research concludes that research has focused on the direct EO–performance link and less on indirect effects and the relationship of EO with other variables. Accordingly, the aim of the present study is to understand how individual EO dimensions influence the competitive strategy–performance relationship in small firms.
We follow research that links strategic orientation with strategic content (Dess et al., 1997): that is, EO with competitive strategy and focus on business-level performance as a strategic outcome variable. Studying strategy content (the generic strategies) with strategy-making processes (EO) seems to be a logical choice of enquiry; EO is the basis to create and implement competitive strategies, so studying EO and competitive strategy is a promising research endeavour (Rauch et al., 2009; Wales et al., 2011a). It has been argued that EO research might be affected by a strong survival bias; variables such as risk-taking and competitive aggressiveness can favour growth, but arguably are related to firm failure (Rauch et al., 2009). To address these issues, we include both surviving and failed small firms.
The present study contributes to theory in two critical ways. First, it contributes to the emerging field of strategic entrepreneurship by integrating two core concepts: entrepreneurial orientation and competitive strategy. Second, it views EO as a construct that has an impact on other performance-influencing variables. The assessment of EO with five independent dimensions provides deeper insights into how each dimension affects competitive strategy directly and firm performance indirectly.
The article is structured as follows. First, it reviews the relevant literature for EO and competitive strategy before developing hypotheses on how the different EO dimensions are mediated by competitive strategy. Next, it describes the research design of the empirical study. Thereafter, the results of the study are presented, followed by discussion of the research, which concludes with the limitations of the study and suggestions for future research.
Theory and hypotheses
Entrepreneurial orientation
In line with the literature, we define EO as the processes, structures and behaviours of firms characterised by innovativeness, proactiveness, risk-taking, competitive aggressiveness and autonomy (Lumpkin and Dess, 1996; Lumpkin et al., 2009). EO is now afforded five dimensions (Lumpkin and Dess, 1996):
innovativeness – supporting and encouraging new ideas as well as experimentation and creativity;
risk-taking;
proactiveness – exploiting first-mover advantages and anticipating future events;
competitive aggressiveness – the intensity of a firm’s efforts to outperform competitors, ambitious market share goal-setting or aggressive actions such as price cutting; and
autonomy – independent decision-making.
While there is no single agreed definition of EO, it is commonly regarded as firm-level entrepreneurship (Covin and Wales, 2011) focused on opportunity recognition and exploitation: ‘more precisely, EO is a strategic business unit (SBU) level phenomenon where the “unit” can range from a non-diversified small to medium-sized enterprise (SME) to a single business unit of a multi-business firm’ (Covin and Lumpkin, 2011: 857). EO can be considered to be the specific manner in which firms act upon opportunities (Miller, 1983), or as activities that lead to new entry (Lumpkin and Dess, 1996).
It has been recommended that measurement models of EO (aggregate versus independent) should derive from research objectives, and there is no single best approach for EO research (Covin and Wales, 2011; Wales et al., 2011a). We follow Lumpkin and Dess’s conceptualisation of EO based on five independent dimensions which are distinct theoretical constructs that do not empirically need to covariate (Covin and Wales, 2011; Lumpkin and Dess, 1996). This approach has the advantage of allowing different values for EO dimensions and for investigation of individual EO dimensions on outcome variables (Casillas and Moreno, 2010; Pérez-Luño et al., 2011). Therefore, the effective contributions of each single dimension can be explored (Hughes and Morgan, 2007; Wales et al., 2011a). Since we are interested in the EO–competitive strategy–performance relationship by using the two different logics of competitive advantage, it is important to understand how individual EO dimensions are mediated.
Interestingly, while Lumpkin and Dess’s (1996) conceptualisation is cited more frequently than that of Covin and Slevin (1991), it is less tested but emerging as a critical research approach (Wales et al., 2011a). We choose to use all five dimensions and include competitive aggressiveness and autonomy. Entrepreneurial firms wishing to improve their position need to outpace competitors (Lumpkin and Dess, 1996); thus, competitive aggressiveness influences how competitive strategies are implemented. Autonomy is associated positively with the emergence of entrepreneurial activities, the creation of an entrepreneurial environment and opportunity search and exploitation behaviours (see Lumpkin et al., 2009). In understanding EO as a form of firm-level entrepreneurship, the inclusion of autonomy adds an important organisational variable needed for implementing a competitive strategy. Accordingly, it has been argued that EO influences firm performance when firms strategically acquire, develop and leverage resources for opportunity exploitation in order to develop a competitive strategy for gaining competitive advantage (Ireland et al., 2003). Therefore, EO should be linked to the concept of competitive strategy.
Generic strategies and small firm performance
It is widely assumed that there is a clear link between strategy, firm performance and competitive advantage to generate above-average returns (Porter, 1980). While various frameworks are available to classify firm strategies (e.g. Chrisman et al., 1988; Miles and Snow, 1978), the Porter model is widely accepted (Allen et al., 2006; Chaganti et al., 2002). Porter proposed four competitive strategies: broad cost leadership, broad differentiation, cost focus and differentiation focus. Cost leadership or differentiation defines the dominant logic of a competitive strategy: they are the strategic weapons, while focus defines the product or market scope (Chrisman et al., 1988; Grant, 1998). Focus is not a standalone strategy and cannot be a source of competitive advantage: ‘Narrow focus in and of itself is not sufficient for above-average performance’ (Porter, 1985: 15). As such, there is a tendency to recognise two main sources of competitive advantage, with cost leadership – reaching lower costs than competitors and differentiation – creating more value for the customer than the average firm. The firm offers a (perceived) superior product at an above-average price while having an average cost structure (Porter, 1985). According to Porter, the two logics of differentiation and cost leadership are incompatible. So, while the scope of decision-making remains an important dimension for competitive strategy, competitive weapons are of greatest importance (Chrisman et al., 1988).
As such, arguably we can reduce the study of competitive strategy (also for the sake of brevity) to these two competitive logics (e.g. Torgovicky et al., 2005): i.e. differentiation and cost leadership, especially if the competitive strategy is related to other strategic elements of firm behaviour. Moreover, the focus on small firms might reduce the dimensionality naturally (i.e. more focused than broad). The purity of a competitive strategy is linked to increased performance, while mixed strategies show inferior results (Thornhill and White, 2007). However, the link between the purity of a firm’s strategy and firm performance has been confirmed for established firms, but not yet for small firms.
Differentiation means to fulfil customer needs in a unique way so, to realise superior value include product design, quality, range and type of features or after-sales support, etc. (Allen et al., 2006; Chaganti et al., 2002; Grant, 1998). Differentiation, especially if based on speed, customer service and flexibility, is an option for entrepreneurial firms to compete (Bidhé, 2000; Mosakowski, 1993, Tsokas et al., 2001). Compared to cost leadership, it is more variable than fixed cost-based, reducing necessary upfront investment (Grant, 1998). Prior research has shown that differentiation corresponds more to the innovative approach and characteristics of entrepreneurial firms (Sandberg and Hofer, 1987; Teal and Hofer, 2003; Tsokas et al., 2001). Cost leadership requires substantial financial resources (partially needed to invest in fixed assets); it is based on process innovation, learning curve benefits, economies of scale and design for manufacturing (Allen et al., 2006; Chaganti et al., 2002; Grant, 1998). Generally, cost leadership seems to be less appropriate for small firms, given resource constraints. However, research has shown that cost leadership can be a successful strategy for entrepreneurial firms, especially in the case of late entry when low-cost designs are available (Dowling and McGee, 1994). Thus, both generic strategies should enhance firm performance. The development of one effective strategy is essential for the performance of small firms (Borch et al., 1999; Thornhill and Amit, 2003), leading to the base hypotheses: H0a: Differentiation strategy is positively associated with small firm performance. H0b: Cost leadership strategy is positively associated with small firm performance.
Entrepreneurial orientation and firm strategy in small firms
Both competitive strategy and EO are distinct business unit-level concepts (Covin and Lumpkin, 2011); the implementation of a specific competitive strategy (be it cost leadership or differentiation) requires different and specific resources and competencies. As already stated, EO is understood as the processes, structures and behaviours of firms that are characterised by innovativeness, proactiveness, risk-taking, competitive aggressiveness and autonomy (Lumpkin and Dess, 1996). We adopt the position that competitive strategy mediates the EO–performance relationship (Moreno and Casillas, 2008). Since it is reasonable to assume that there is no perfect fit between EO and competitive strategy and that the two concepts are not substitutes, it is important to understand how dimensions of EO influence which type of competitive advantage. Accordingly, we consider that the five dimensions can vary independently of one another (Lumpkin and Dess, 2001): there are different ‘mixes’ of EO and different dimensions of EO have differential impacts on the two types of generic strategies.
A general question concerning the relationship between the EO dimensions and competitive strategy is the temporal aspect of the two constructs. It could be argued that the effects of EO are short-lived or only a quick fix to become successful (Wiklund and Shepherd, 2011). The understanding of EO as processes, structures and behaviours generally indicates the long-term nature of EO as requiring substantial and consistent resource commitments (Covin and Slevin, 1991). Evidence suggests that the effects of EO are not short-lived but long-term (Wiklund, 1999; Zahra and Covin, 1995), and so need a long-term orientation for establishment and effect. While cycling is theoretically possible (Wales et al., 2011b), the manifestation of EO is indicated by sustained patterns of behaviour over a relevant period of time. Similarly, firms usually adhere to their competitive strategies over time: the long-term orientation is the nature of strategy reinforced by resource commitments that are not easily reversible (Grant, 1998) and by the search for long-term, above-average performance (Porter, 1980, 1985). Resource constraints might reinforce the strategic lock-in of small firms, so if both EO and competitive strategies are long-term, the relationship between the two constructs becomes vital for understanding firm performance.
Innovativeness and its relationship to differentiation and cost leadership
Innovativeness is characterised by a strong R&D emphasis, technological leadership, the introduction of new products and the degree of changes in product or service lines (Covin and Wales, 2011). The innovativeness measure is biased towards product innovation even if process innovation is not explicitly excluded; changes in products might lead to changes in processes, but the original Covin and Slevin (1989) scale has a strong product innovation focus. Differentiation (Porter, 1980, 1985) is about creating products and services that are perceived as unique by customers; this strategy is based strongly on product innovation and marketing activities (Miller, 1988). Moreover, product innovation, along with differentiation, requires marketing orientation, which itself is associated with EO (Keh et al., 2007; Tsokas et al., 2001). Thus, differentiation requires innovation capabilities, leading to new products that increase the value to the customer, justifying price premiums (Porter, 1980, 1985, 1996). Product innovation is considered to be one of the main driving forces of differentiation by creating uniqueness in customers’ eyes (Grant, 1998). A firm’s innovation practice will differ according to its competitive strategy, and there is a strong association between product innovation and differentiation (Blumentritt and Danis, 2006). If we assume that small businesses have a lower inclination for innovation (Ruyan et al., 2008), then comparatively, more innovativeness will enhance the differentiation strategy of small firms.
Innovativeness can be used to create differentiation advantage through uniqueness. While the introduction of low-cost designs for existing product categories requires some form of innovation (Dowling and McGee, 1994), cost leadership is focused on process innovation (Porter, 1985). Generally, cost leaders are characterised by lower levels of research and development (R&D) expenditure (Grant, 1998). Cost leadership implies cost minimisation in R&D (Miller and Friesen, 1986, Porter, 1980). In this sense, cost leadership is about reducing the R&D intensity of a firm (understood as the ratio of R&D expenditures to sales) which, in turn, is an indicator of the strategic importance of innovation (O’Brian et al., 2003). While higher R&D expenditure does not lead automatically to higher innovativeness, ‘firms that invest in R&D at a much higher rate than their competitors are most likely trying to compete on the basis of innovativeness’ (O’Brian, 2003: 419). As such, while innovativeness should be an important feature of firm performance and independent of competitive strategy, it is reasonable to assume that small firms with a cost leadership strategy tend to be at the lower end of the innovativeness scale. This brings industry-average products through more efficient product design or processes to market. The resource constraints of small firms require strong priority-setting for investments, leading to trade-offs. Cost leadership strategy is a more capital-intensive strategy necessitating only minimum innovativeness. Greater innovativeness will be detrimental to the cost leadership strategy in small firms, which leads us to our first hypothesis: H1: Innovativeness is positively associated with a differentiation strategy in small firms. H1b: Innovativeness is negatively associated with a cost leadership strategy in small firms.
Proactiveness and its relationship with differentiation and cost leadership
Uniqueness offers first-mover advantages, the extent of which depends on the timeliness of actions. Proactiveness anticipates competitive moves and maintains first-mover advantage; it is an important factor for differentiation. Innovation as a driver of uniqueness requires proactive behaviour (Blumentritt and Danis, 2006). Small firms that differentiate and focus on innovation have strong interests in anticipating the competition in order to achieve sustained performance (Freeman and Engel, 2007). Since proactiveness is supposed to increase first-mover advantages (Hughes and Morgan, 2007), it should sustain differentiation. Small and resource-constrained firms in particular have an interest in exploiting time advantages (Bidhé, 2000).
Dowling and McGee (1994) suggest that cost leadership adopted by small firms, through the introduction of low cost designs, is more successful for late entrants. Low-cost designs require less market uncertainty (Lieberman and Montgomery, 1988); implementation of low-cost production, sourcing, distribution or service systems in order to maximise efficiencies require stable and standardised processes, reducing the firm’s flexibility. Late entry allows learning from previous mistakes and re-engineering of products for more efficient production. Proactiveness deals with anticipation and creating future demand, pre-empting competition and favouring uniqueness; it is less about efficiently fulfilling existing demand (Hughes and Morgan, 2007). For example, research shows that the dominance of the cost leadership strategy (and the lack of differentiation strategies) adopted by Japanese firms is associated with the traditional late entry of Japanese firms and a lack of proactiveness (Allen et al., 2006). This leads us to our second hypothesis: H2a: Proactiveness is positively associated with a differentiation strategy in small firms. H2b: Proactiveness is negatively associated with a cost leadership strategy in small firms.
Autonomy and its relationship to differentiation and cost leadership
Differentiation is strongly driven by customer focus in order to maximise customer satisfaction. A necessary condition for customer orientation is autonomy (Slater and Narver, 1995), which refers to the freedom of employees to be creative, to develop new ideas and open communication and to be focused upon customer interaction and orientation (Hughes and Morgan, 2007; Lumpkin and Dess, 1996; Lumpkin et al., 2009). Autonomy drives flexibility and creativity (Hughes and Morgan, 2007): flexibility enables firms to react faster to customer needs, while creativity drives innovation and uniqueness. In addition, it allows for discretionary action where solutions are needed (Lumpkin et al., 2009), so autonomy should be positively associated with differentiation in small firms.
As mentioned previously, cost leadership is about realising the lowest cost structure for a comparable offer based on maximising efficiency. A strategy based on efficiency requires a structure that favours controls and responsibility for results through work standards (Brock, 2003). Reduced slack, cost control and workforce monitoring is considered important for the implementation of cost leadership (Grant, 1998). Autonomy, which can promote employee empowerment, can be interpreted as the opposite of tight workforce control. Cost leadership is associated with reduced action freedom, decision-making authority and hence reduced autonomy (Brock, 2003). Small firms are characterised commonly by less formalisation and unsophisticated control systems (Birley and Noburn, 1985, Lechner and Leyronas, 2009), leading to greater autonomy. Cost leadership is strongly associated with a top-down approach, while bottom-up approaches are usually reinforced by autonomy. To implement a cost leadership strategy, autonomy should be reduced. We expect a negative relationship between autonomy and cost leadership in small firms, which leads us to our third hypothesis: H3a: Autonomy is positively associated with a differentiation strategy in small firms. H3b: Autonomy is negatively associated with a cost leadership strategy in small firms.
Competitive aggressiveness and its relationship to differentiation and cost leadership
As mentioned previously, competitive aggressiveness means to outdo competitors: it includes ambitious market share goal-setting or aggressive actions such as price-cutting, outspending competitors in marketing and building larger production capacities (Lumpkin and Dess, 1996). Porter (1980) emphasises how a high market share is a necessary condition for establishing a cost leadership strategy. However, a greater market share does not necessarily create more profitability for a differentiation strategy – especially if aggressive actions are employed that do not necessarily create a higher value perception by customers but increase costs and reduce margins. Clearly, the building of larger production capacities is targeted towards the search for higher scale economies, which is at the heart of a cost leadership strategy. Price competition is contrary to the logic of differentiation based on price premiums. Differentiation tries to avoid direct competition by creating small monopolies through the creation of uniqueness (Dowling and McGee, 1994), and often is related to relatively low market share (Miller and Dess, 1993). Thus competitive aggressiveness is divergent from the differentiation logic in small firms. Economies of scale are key drivers of cost leadership; to exploit scale economies, companies compete more aggressively in the market place to gain market share and sufficient production volume (Blumentritt and Danis, 2006). Greater market share leading to higher production volumes is a conditio sine qua non for cost leadership that also applies to small firms wishing to beat competitors on cost aspects. Thus, competitive aggressiveness is associated positively with cost leadership (Porter, 1985) in small firms, which leads us to our fourth hypothesis: H4a: Competitive aggressiveness is negatively associated with a differentiation strategy in small firms. H4b: Competitive aggressiveness is positively associated with a cost leadership strategy in small firms.
Risk-taking and its relationship to differentiation and cost leadership
Small-firm managers differ in their risk-taking behaviour and perception of affordable loss, which influences entrepreneurial choices (Dew et al., 2009). While the implementation of any strategy is not without risk, an important decision variable for any entrepreneur is potential loss in the event of failure (Miller, 2007). Even if it had been advocated that differentiation is more sustainable and less risky than cost leadership (i.e. with a lower outcome variance), as cost leadership is more vulnerable to external shocks it is more reasonable to focus on other risk-taking factors than the probabilities of the riskiness of competitive strategies in general. Our approach follows research (Dew et al., 2009) that breaks down risk into the probability of failure and the cost of failure. Let us consider two similar strategies: if a strategy necessitates €1m in upfront investment and another requires €100,000, then a positive decision concerning the first strategy requires greater risk. Generally, in resource-constrained firms such as small firms, comparatively higher investment has an almost direct effect on the risk of failure, given the higher consumption of available resources (Thornhill and Amit, 2003). Compared to cost leadership, differentiation strategy can be a means for a small firm to control risks, reducing fixed costs and upfront investment. A differentiation strategy comprises a priori less irreversible investments. A refinement logic of customer needs calling for continuous adaptation leads to staged investments and gives a firm more flexibility, and so reducing risk. Risk-taking through high and irreversible resource commitments (Miller, 2007; O’Brien et al., 2003) will be counterproductive for a differentiation strategy.
Cost leadership requires higher upfront investment than differentiation in order to enable economies of scale (Allen et al., 2006; Grant, 1998). The building of high-capacity, standardised output systems reduces the flexibility of a firm and increases strategic lock-in. Higher investment means that the stakes require strategic decision makers to have a higher tolerance level for affordable loss (Dew et al., 2009). Low risk-taking entrepreneurs tend to under-invest (Dew et al., 2009): while this appears to be possible for a differentiation strategy, it is impossible with the requirement of a cost leadership strategy. Therefore, risk-taking should be more important for cost leadership than for differentiation in small firms.
H5a: Risk-taking is negatively associated with a differentiation strategy in small firms. H5b: Risk-taking is positively associated with a cost leadership strategy in small firms.
All the hypothesised relationships, direction and expected impact of generic strategies on performance are shown in Figure 1.
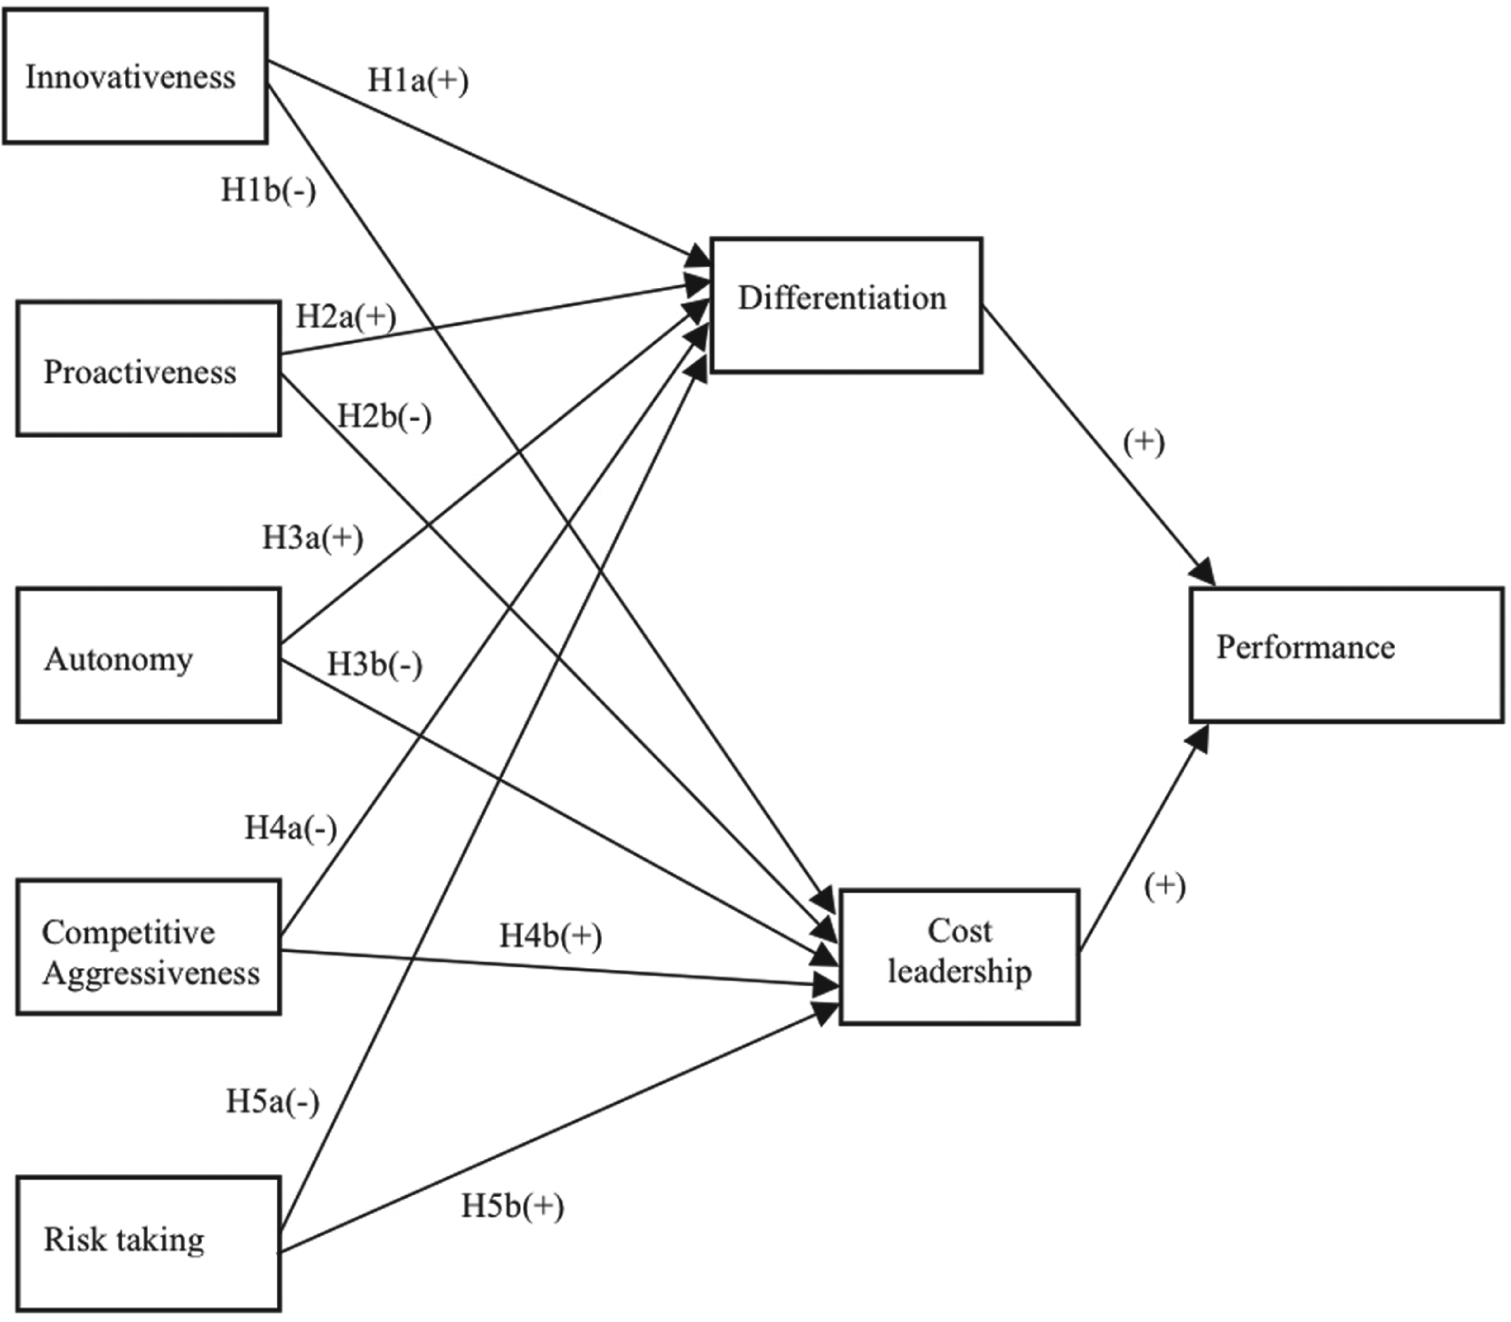
Structural Model (Inner Model).
Method
Sample
The present study is based on a survey of small Icelandic firms. The sample was drawn randomly from the national registry of enterprises and consisted of 335 firms to whom specific surveys were addressed: 153 to bankrupt firms indicated in the registry by a bankruptcy filing and de-registration (47 responses, 35% response rate), and 182 to non-bankrupt enterprises still active at the date when the sample was drawn (70 responses, 385 response rate). This was a postal survey with blind returns, meaning that it was not possible to know the identity of the respondent as a card with the questionnaire response number was posted separately by the respondent to indicate that it had been returned. A different questionnaire was made for each group, reflecting necessary differences in wording and tense to reflect in turn the existing or non-existing state of the firms. Otherwise, all the questions in the two instruments mirrored each other. Non-response bias was analysed through means analysis of the first and last group of respondents (the last group by phone follow-up among non-respondents from the mailing part of the study); there was no significant difference between the groups.
Bankrupt firms needed to have operated for at least three years consecutively over a 10-year period (t1 – t10); non-bankrupt companies needed to have operated for at least three years during the same 10-year period and still exist in the year that the sample was drawn (t10). Bankruptcy was indicated in the registry by a bankruptcy filing and de-registration. Over this 10-year period the ratio of bankruptcies to start-ups was 37.7 percent. All firms in the sample were formed in the 10 years preceding the study and had operated for at least three years before bankruptcy, and non-bankrupt firms were still active when the sample was taken. This sample definition avoids a mortality bias towards very young firms in the critical first three years (Littunen et al., 1998), where small firms are more occupied with entry tactics and establishing initial sales than with developing strategies (Bidhé, 2000; Lechner et al., 2006). Additionally, research has shown a negative relationship between EO and the performance of small firms greater than 10 years old (Ruyan et al., 2008). We focused on the range between more than three and less than 10 years (explaining the relatively high average age and low standard deviation).
Measures
Dependent variable
We used a multidimensional scale for the performance measure that captured the objective, subjective, temporary and relative dimensions of the construct. The reason for multiple measures of the dependent variable comes from criticism of the performance literature which argues for a dichotomous perspective (compare failed versus non-failed, successful versus unsuccessful, etc.), and that different measures should be applied to form a coherent construct. Therefore, we used multiple performance measured on different scales, as this is acceptable in partial least squares (PLS) but not in covariance-based methods (e.g. Florin et al., 2003). Moreover, it is likely that the non-bankrupt firms in the sample varied substantially in terms of financial health and bankrupt firms may have experienced extraordinary events (for example, the death of the entrepreneur). Firm survival requires minimum relative firm performance, implicitly justifying measures that combine failure or survival with relative performance (Wiklund and Shepherd, 2011). Accordingly, performance was measured as a composite measure with three reflective items. The first item, survival, is an objective dichotomous measure (0 = bankrupt and 1 = otherwise) obtained directly from the national registry of firms. The following two items are subjective on a five-point scale, measuring the respondents’ self-evaluation of their business strengths and weaknesses compared to their main competitors in the three years preceding the survey (or the last three years of operations, if bankrupt) following approaches of similar research (Dess et al., 1997; Wiklund and Shepherd, 2011). The first item is relative cash flow and the second item is relative profitability.
Independent variables
For EO we adopted Covin and Slevin’s (1989) measurements for the three dimensions of innovativeness, proactiveness and risk-taking in combination with the recommendations put forward by Lumpkin and Dess (1996). We developed the measurements for competitive aggressiveness from Lumpkin and Dess (2001), and for autonomy from Hornsby et al. (2002). Given the method chosen (PLS), scale differences were not an issue. PLS is also particularly appropriate for latent constructs such as EO (Covin and Lumpkin, 2011). The meta-analysis shows that the EO construct is fairly robust concerning potential cultural biases and different scale formats (Rauch et al., 2009).
Competitive strategy was measured through two constructs, differentiation and cost leadership, composed of subjective items, all on a five-point scale. The decision-makers were asked to assess the relative position of their firm vis-à-vis their competitors (Dess et al., 1997). For differentiation, the items were quality advantage and image; for cost leadership, price competitiveness, strength in costs and wage level.
Controls were included by firm age (in years) and firm size (number of employees) as typical controls for small firms, as well as education and the entrepreneur’s age (Stam and Elfring, 2008). Increasing firm size and age are associated with decreasing mortality risk (Thornhill and Amit, 2003). Education is considered a general measure of human capital and linked to lower mortality risk (Thornhill and Amit, 2003). Education was measured categorically, ranging from low to high (lower than college, college, trade or technical to non-university and university). Relatively little research has examined gender (Kalleberg and Leight, 1991): studies have shown women to be more risk-averse than men (Jianakoplos and Bernasek, 1998) and possibly less prone to failure when starting companies. In addition, EO research found that women operating small businesses tended to show higher EO but with no differential effect on firm performance (Runyan et al., 2006).
The firms in this study did not come from industries characterised by long periods of irrelevant sales (such as biotechnology). Over this 10-year period the ratio of bankruptcies to start-ups was 37.7 percent, and we did not observe large deviations from the mean bankruptcy ratio. The sample was not biased by industry as no single industry was overly represented. In addition to the control variables included in the model, an ad hoc test for industry segments was run to see if industry would matter in the model. However, this was not the case. As the coefficient for industry was weak, -.08 (t = 1.298), allowing us to rule out that sector is significant.
Procedure
We used PLS path modelling to carry out the hypothesis testing: a causal-predictive method that is appropriate for limited theoretical knowledge (see e.g. Moreno and Casillas, 2008 for EO research). PLS path models consist formally of two blocks of linear equations: the inner model and the outer model. The inner model defines the relationships between unobserved or latent variables. The outer model defines the relationships between a latent variable and its observed or manifest variables (items). The outer model corresponds to the measurement model and the inner model to the structural model. All path coefficients are considered simultaneously, allowing analysis of direct, indirect and spurious relationships and the estimation of multiple individual item loadings in the context of a theoretically specified model rather than in isolation, so avoiding biased and inconsistent parameter estimates for equations. Unobservable variables can be measured by indicators (items). The method is suitable for revealing associations that might not appear with standard regression or covariance-based structural equation modelling methods (Wilcox, 1998). The study selected PLS (see Chin, 1995, 1998; Chin and Newsted, 1999) due to a smaller sample size than recommended for covariate-based structural equation modelling methods (Marsh et al., 1998), and the study’s use of several different measurement scales. PLS does not assume that variables have been measured free of errors (Fornell and Bookstein, 1982).
Covin and Wales (2011) argue that EO dimensions are theoretically distinct and might be empirically distinct; consequently, they propose various measurement approaches for EO. In essence, we can distinguish between formative and reflective measurement approaches for latent, unobservable constructs such EO. ‘Formative’ means that the explanatory indicators create the latent construct, while ‘reflective’ means that the latent construct produces its observable measurements (Fornell and Bookstein, 1982). The difference between the two approaches is that reflective measurements are thematic and thus interchangeable (with high internal consistency), while formative measurements each contribute – possibly to a different degree – to the latent construct. The use of these approaches is highly dependent on the research goals, even if formative measurement approaches pose more challenges (Covin and Wales, 2011). All the items in the measurement model (outer model) were reflective and accounted for observed variances. A reflective construct implies that the observed indicators (items) are being caused by an underlying construct (Fornell and Bookstein, 1982): in the present case, the five independent EO dimensions. As such, a reflective measurement approach was used for the individual EO dimensions (through items) and a formative approach for their consequences. This approach mirrors the recommendations brought forward by Covin and Wales (2011) and by Covin and Lumpkin (2011) for EO measurement models.
Results
Measurement model and structural model
For PLS, first the reliability and validity of the measurement model (outer model) needed to be assessed. Table 1 lists the variable means, average variance extracted (AVE), composite scale reliabilities (C.R.) and correlations among the latent variables. The composite scale reliability exceeded the recommended minimum of .70 (range .70 to .86) (Fornell and Larcker, 1981). Convergent validity (AVE) exceeds the accepted minimum (.50) in all cases (range .54 to .75) (Fornell and Larcker, 1981). To test discriminant validity the square-root of AVE was used. The cross-loadings test (Chin, 1998) was used to examine whether the manifest variables loaded higher on their associated latent variable than any other latent variable. The results demonstrate good discriminant validity according to both above mentioned tests.
Composite reliabilities and correlations a .
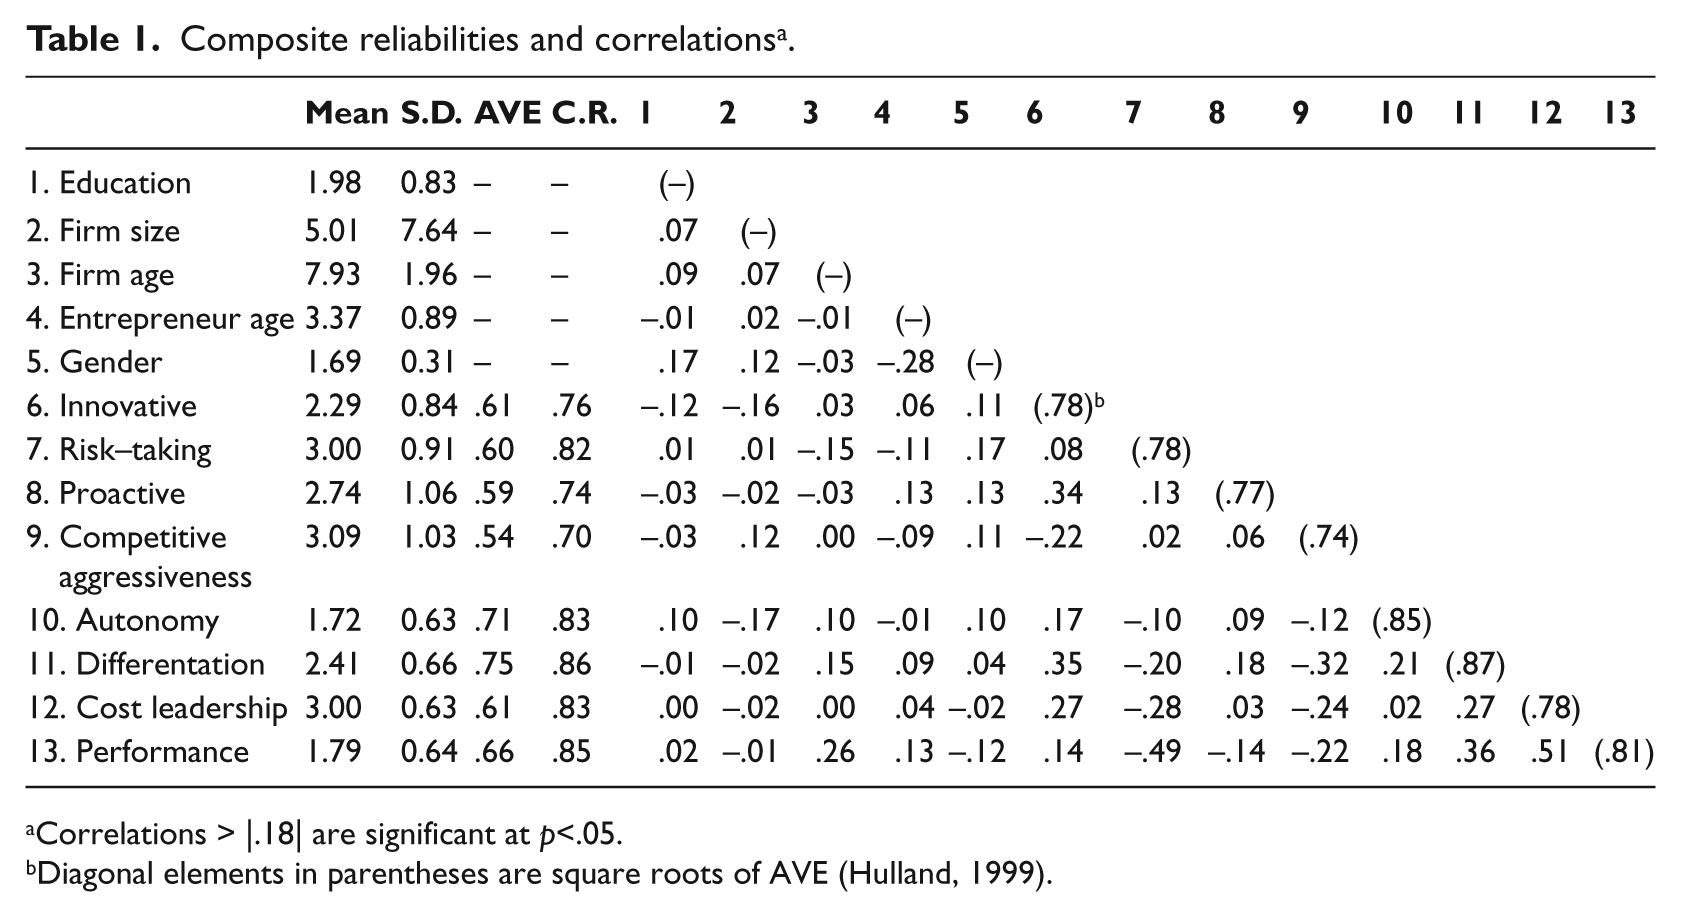
Correlations > |.18| are significant at p<.05.
Diagonal elements in parentheses are square roots of AVE (Hulland, 1999).
Obtaining the measures of the predictors and the criteria variable from the same sources is likely to cause common method bias (Podsakoff et al., 2003). In the present study the dependent variable was composed of three items, one of which, survival, was collected separately from the key informants, directly from archival resources. However, we still had reason to believe that constructs derived from the same block of questions in the instrument might be subject to common method bias. To determine whether this was the case, a procedure suggested by Liang et al. (2007) for partial least squares was followed, based on a common method factor (Podsakoff et al., 2003; Williams et al., 2003). The common method includes all the principal indicators of the model constructs. Then, separate constructs for all indicators were specified with paths to the method factor and variances explained were calculated for both the substantive and the method loadings (see Appendix). The average variance explained by the substantive indicators was 0.632 and the average variance by the method indicators was 0.003. Only one method factor loading was significant, and the ratio between the method and the substantive variance was very high at 189, so it was concluded that common method bias was not a concern for this study.
The structural model (inner model) needed to be assessed in PLS as it does not directly generate an overall goodness of fit index for the structural (inner) model; one primarily assesses model validity by examining the variance explained and the structural paths. The R2 for the latent variables in the model ranged from .16 to .37 and was comparable to values typically reported in performance research using PLS (e.g. Fornell et al., 1990). PLS is a non-parametric estimation procedure and, strictly speaking, does not allow significance testing based on statistical distributions; hence bootstrapping was used (i.e. sampling with a replacement method) (Efron, 1979; Efron and Tibshirani, 1993) to extract t-values to ascertain the significance of the parameter estimates.
Effect size comparisons are another means of evaluating the structural model. Tennenhaus et al. (2005) developed a global effect size measure applicable to PLS path modelling, defined as the geometric mean of the average communality and average R2 for the endogenous constructs. Wetzels et al. (2009) proposed baseline values for global effect size (where small = .1, medium = .25, and large = .36). For the full model a value of .48 was obtained (see Table 2), which exceeded the base value for large effect sizes of R2, indicating good performance of the structural model.
Path coefficients from partial least squares.
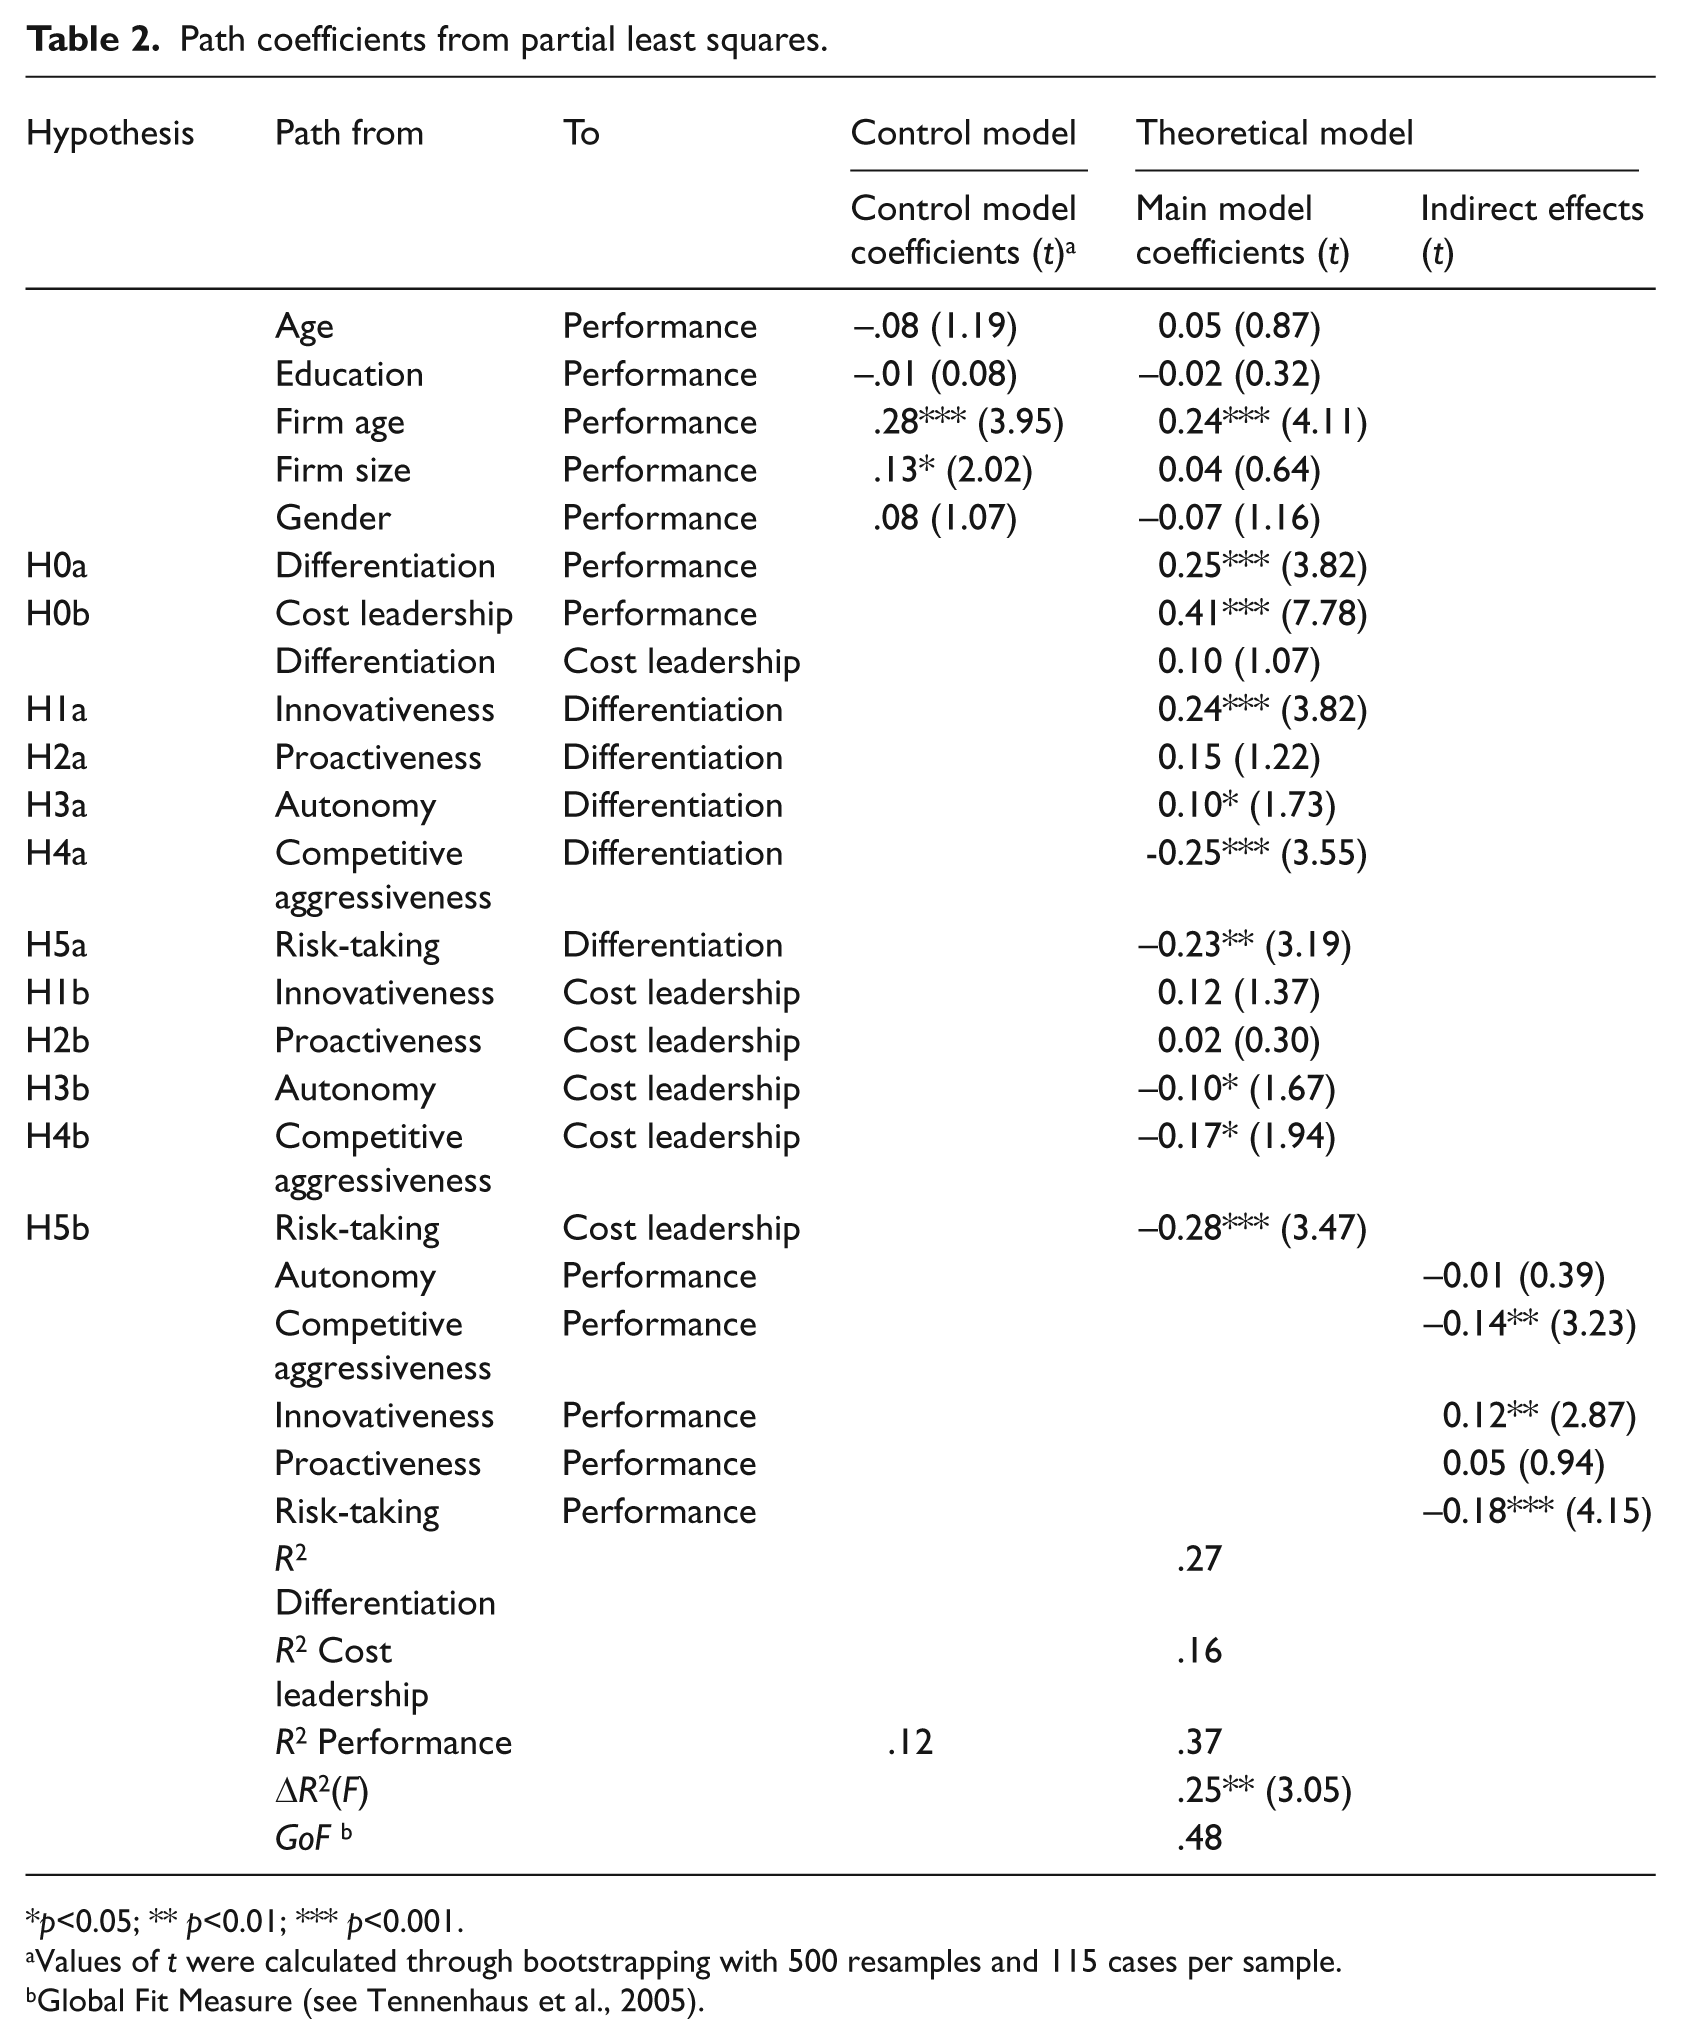
p<0.05; ** p<0.01; *** p<0.001.
Values of t were calculated through bootstrapping with 500 resamples and 115 cases per sample.
Global Fit Measure (see Tennenhaus et al., 2005).
Hypothesis testing
A series of hypotheses were tested, from which we can conclude that the overall model is significant with a relatively high explanatory power (R 2 = .37). As expected, both differentiation (β = .25, p<.001) and cost leadership (β = .41, p<.001) have a positive and significant influence on firm performance, confirming H0a and H0b. This result confirms research on the strategy–performance link. To some extent the study confirms other strategy research in finding cost leadership to be a stronger performance driver, despite theoretical arguments favouring differentiation strategies for small firms (Dowling and McGee, 1994). We also explored the relationship between cost leadership and differentiation; we wanted to understand if there were significant influences of one strategy on the other. The non-significant path relationship between differentiation and cost leadership suggests that the two competitive strategies are distinct constructs. Based on our findings, pure strategies work for small firms (Thornhill and White, 2007).
Concerning our EO competitive strategy hypotheses, we can state the following: innovativeness (β = .24, p < .001) has a positive and significant influence on differentiation. Proactiveness has no significant influence on differentiation (β = .15, ns). Autonomy has a positive significant influence on differentiation (β = .10, p<.05). Competitive aggressiveness has a negative significant influence on differentiation (β = – .25, p<.001). Risk-taking has a negative and significant influence on differentiation (β = – .25, p<.01). Almost all the results are as expected: H1a, H3a, H4a and H5 are supported, but not H2a.
Innovativeness has a positive but non-significant influence on cost leadership (β = .12, ns). Proactiveness has no significant influence on cost leadership (β = .02, ns). Autonomy has a significant negative influence on cost leadership (β = – .10, p<.05). Contrary to our expectations, competitive aggressiveness (β = -.17, p<.05) and risk-taking (β = -.28, p<.001) have a negative and significant influence on cost leadership. Thus, only H3b is supported, and H1b, H2b, H4b and H5b are not supported.
Entrepreneurial orientation–performance effects
The data were explored in more depth by estimating the effects of all the EO dimensions on performance. The effect of innovativeness (β = .12, p<.01) is positive and significant on performance, while risk-taking (β = -.18, p<.001) and competitive aggressiveness (β = -.14, p<.01) are significant but negative. The performance effects of autonomy (β = – .01, ns) and proactiveness (β = .05, ns) are non-significant.
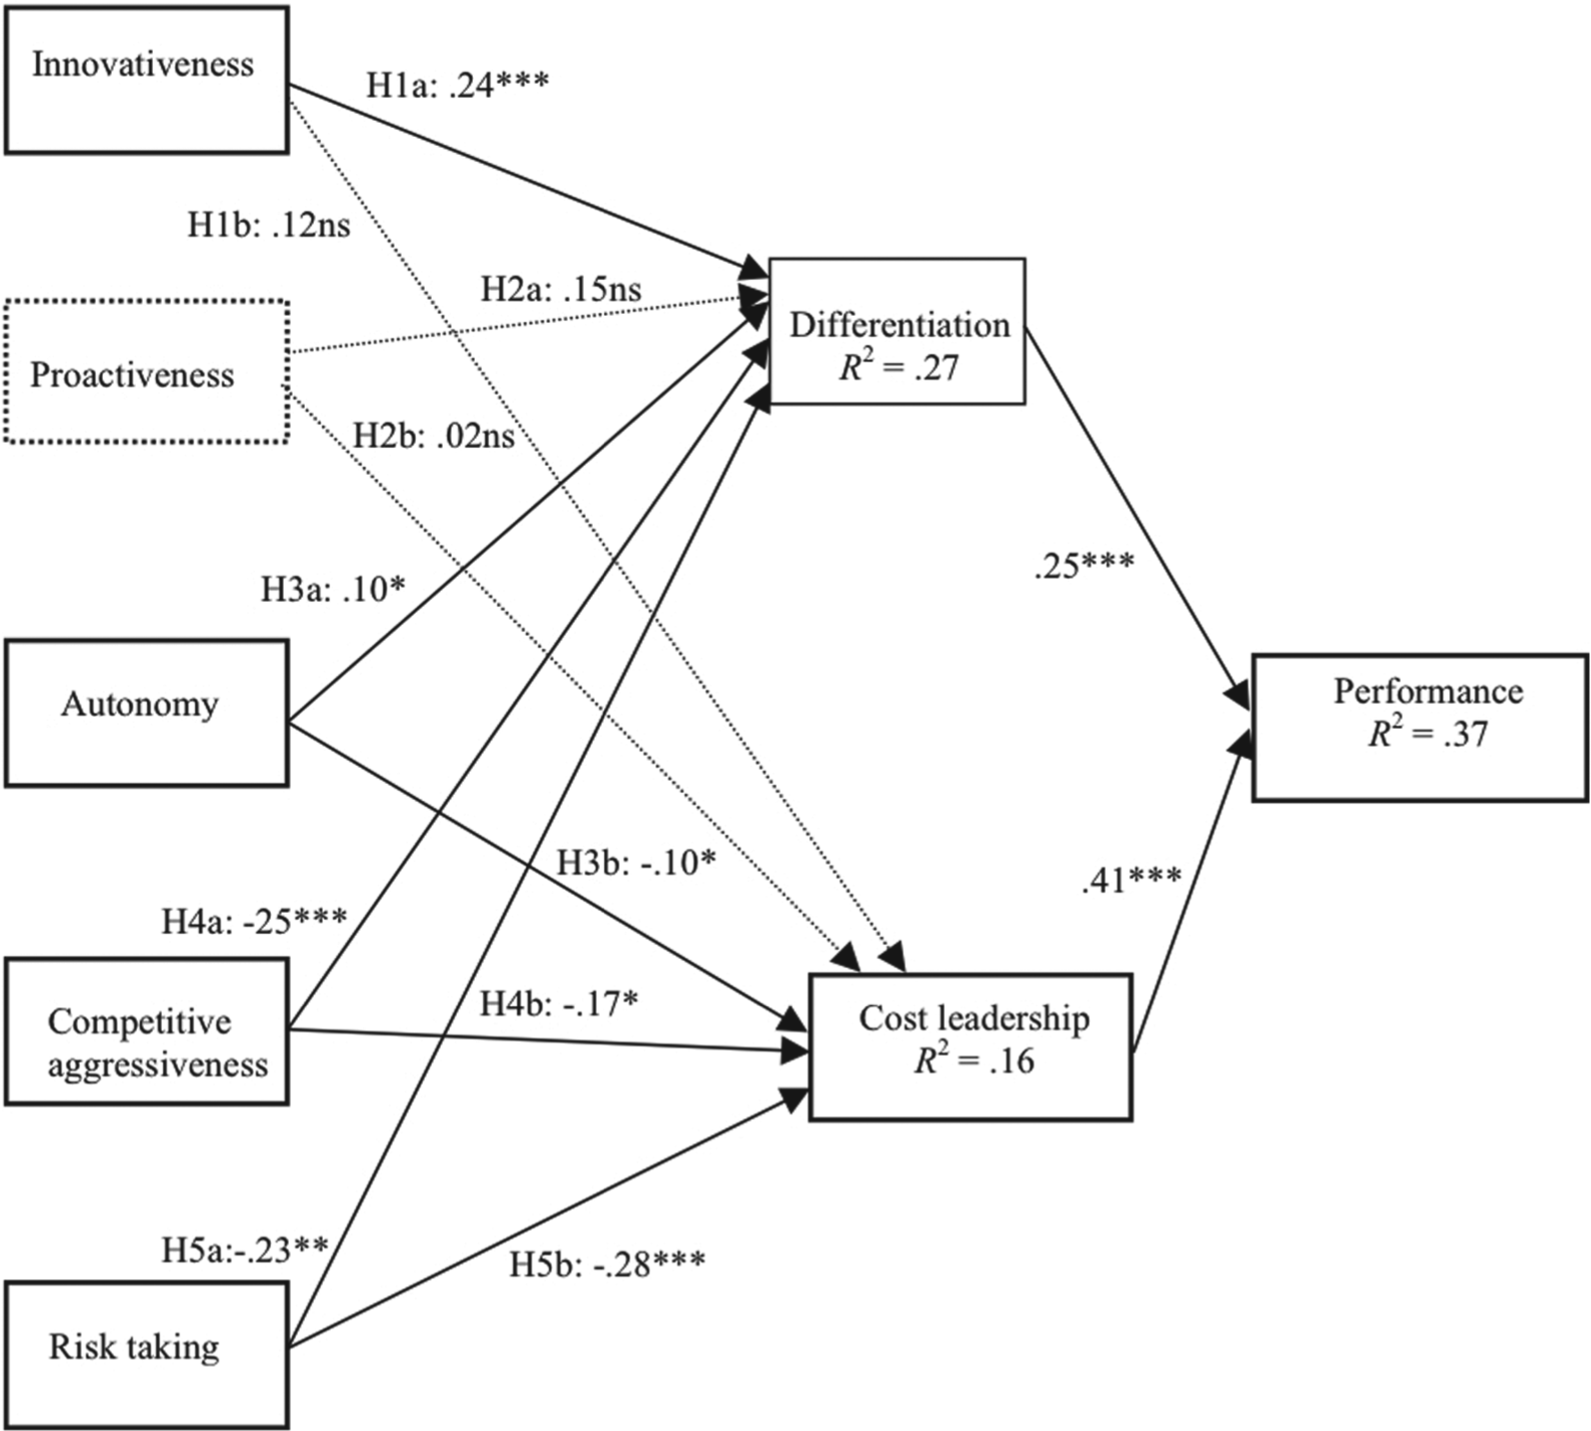
Empirical Model.
Differential entrepreneurial orientation effects on competitive strategies for failed or surviving firms
A theoretical model was developed concerning the relationship between the EO dimensions and competitive strategies, proposing the influences that the individual EO dimensions had on differentiation or cost leadership. In particular for differentiation, the theoretical model appears to be largely confirmed; however, the results might be confounded by including both failed and surviving firms, i.e. that failures or survivors might exhibit different EO levels (on the individual dimensions) and consequently implement competitive strategies with a different EO configuration. In order to explore these differences, a split analysis of the EO dimensions was run on the two competitive strategies for failures and survivors. The sample was split into two groups (one with survivors and one with failed firms), and we analysed whether the EO effects on the two competitive strategies were different for failed and surviving firms; we only investigated the relationship between the individual EO dimensions and the two competitive strategies, and not firm performance effects (which is achieved somehow by the sample split). The results are shown in Table 3.
Post-hoc analysis of differences between bankrupt and non-bankrupt firms.
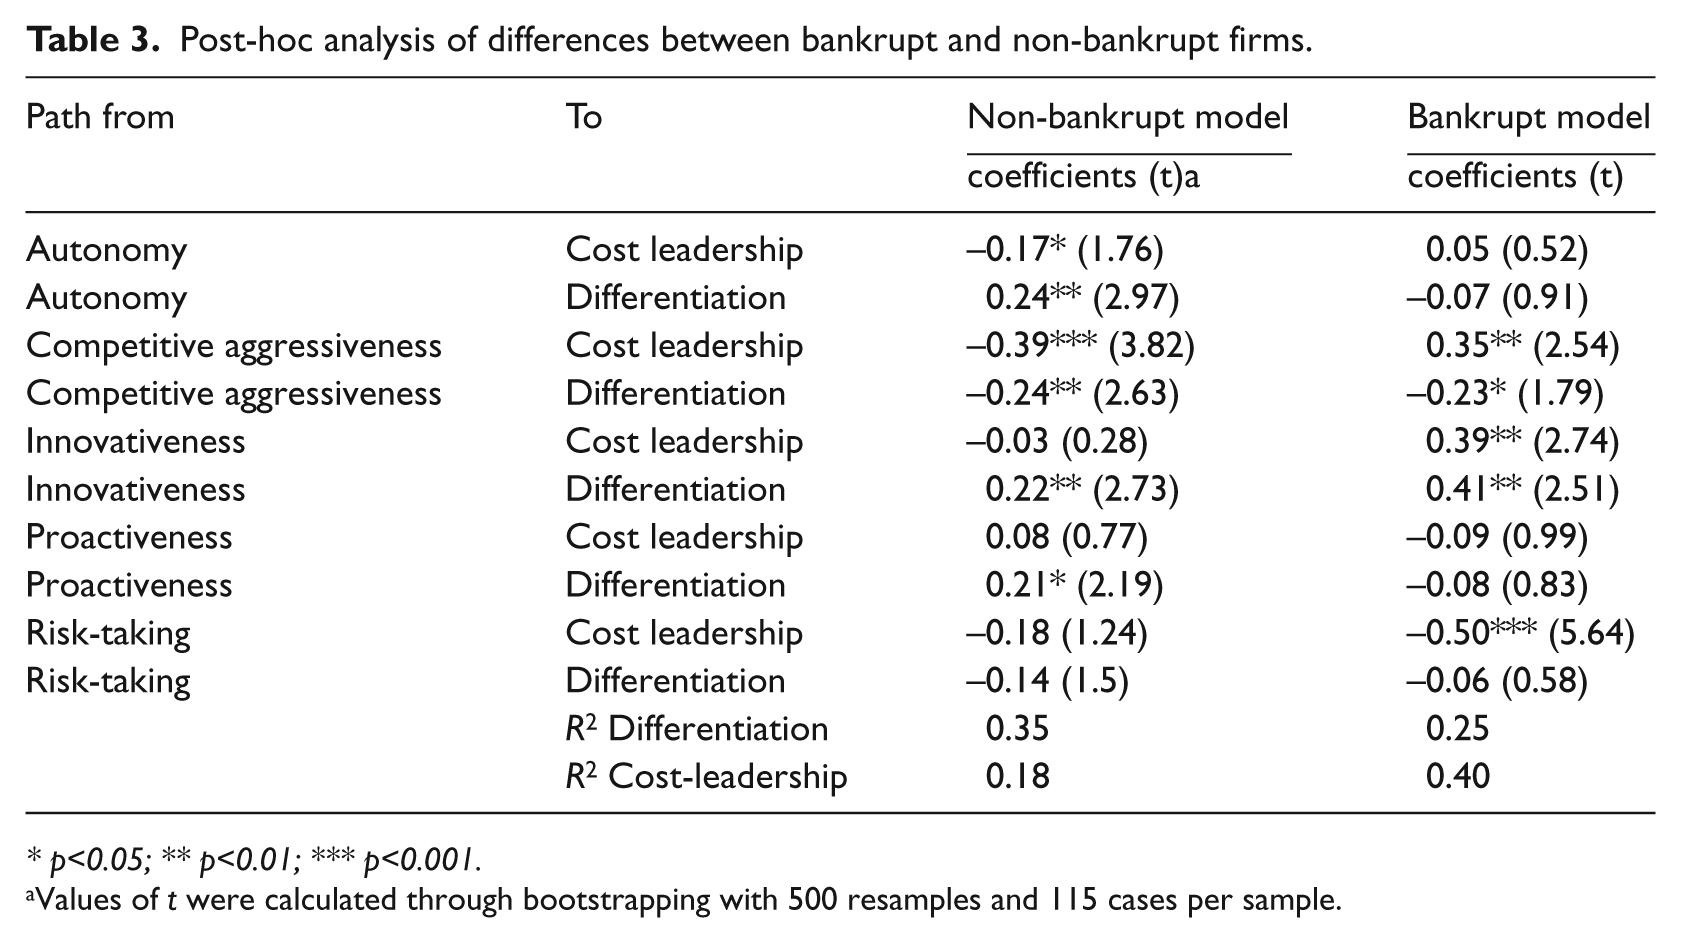
p<0.05; ** p<0.01; *** p<0.001.
For survivors, the EO dimensions are associated with differentiation as proposed in the theoretical model (with only risk-taking not being significantly associated). Failures had an even higher association between innovativeness and differentiation than survivors, but negative even if not significant relationships between autonomy and proactiveness with differentiation.
Concerning cost leadership, failures had high positive values on innovativeness and high negative values on risk-taking, contrary to the theoretical model. In addition, they had high positive values on competitive aggressiveness, while survivors had negative values on competitive aggressiveness. If we take a global perspective and summarise the individual dimensions in a global EO construct, it could be said that survivors generally showed a negative association between the EO dimensions and cost leadership, and a more positive association between the EO dimensions and differentiation while for failures, the opposite was observed. This could indicate that EO (as a global construct) is more beneficial for differentiation than cost leadership.
Discussion
The present study investigated the role of individual EO dimensions on competitive strategy and the effects of competitive strategy on firm performance. The performance effects of competitive strategy found in the present study were substantially higher than the average effects of research on direct EO–performance effects (Rauch et al., 2009; Wales et al., 2011a). Competitive strategy matters for small firms and both differentiation and cost leadership had a positive impact on performance. Interestingly, cost leadership had a stronger impact than differentiation. We can only speculate on this difference, as differentiation appears to be more appropriate for the characteristics of small firms; as it requires generally lower investments, it is a more readily accessible strategy for small firms, reducing the differential impact on firm performance. When comparing performance effects, competitive strategy was more important than EO–performance effects. In general, research has shown a positive impact of EO on firm performance, but the large variance of EO effects in different studies suggests that the EO–performance relationship is mediated or moderated by a series of unobserved variables (Rauch et al., 2009; Wales et al., 2011a). The results of the present study sustain the view that EO is mediated by strategy (Moreno and Casillas, 2008), and that EO effects need to be considered in combination with other firm-level constructs in order to understand firm performance (Messersmith and Wales, 2011). If the EO–performance relationship is an indirect one – i.e. EO is mediated – then the question arises as to how EO as a theoretical construct has an impact upon the concerned construct. Given that differentiation and cost leadership are described as opposing logics, it appears questionable that EO (having its own inner logic) could have the same impact on both. In the present study, the theoretical question was if the individual dimensions of EO were reinforcing or reducing competitive strategy, which in turn drove firm performance. Theoretically and methodologically we considered EO, even though it has rarely been empirically tested (Wales et al., 2011a), as having five independent dimensions (Lumpkin and Dess, 1996) and investigated the impact of the individual dimensions.
The results show clearly that the individual dimensions of EO influence the two generic competitive strategies differently, echoing other research investigating firm survival or firm performance in general (Messersmith and Wales, 2011). As expected, innovativeness had a significant positive impact on differentiation, but proactiveness had no influence on either of the generic strategies. Autonomy had a significant positive influence on differentiation, but a significant negative influence on cost leadership. Most surprisingly, risk-taking and competitive aggressiveness had a negative and significant influence on both competitive strategies. These bolder behaviours seem not to be effective for the implementation of small firm strategy. In the present study, differentiation is driven by innovativeness and autonomy. As a predominantly variable-cost based strategy that reduces upfront investment, differentiation is less risky than cost leadership. As a consequence, competitive aggressiveness and risk-taking do not accord with differentiation. For cost leadership, we only found partial support for the hypotheses.
Post-hoc analysis of the relationship between the EO dimensions and competitive strategies for failures and survivors suggest that survivors had an EO mix sustaining stronger competitive strategies than failures. Survivors showed globally a higher (positive) EO on differentiation, while failures had globally a higher (positive) EO on cost leadership. These results could indicate that EO might be particularly harmful for small firms in implementing cost leadership, while it is rather more beneficial for implementing differentiation. The findings confirm suggestions that competitive strategy and EO might be distinct concepts acting differently on different measures of performance (Moreno and Casillas, 2008): while some dimensions are beneficial, others can be detrimental to a specific type of competitive strategy.
We investigated firm survival and how EO dimensions act directly on performance. While innovativeness had a positive impact, both risk-taking and competitive aggressiveness had a negative impact on survival. Globally, the effects of the EO dimensions on survival were mixed and negative, so it seems reasonable to argue that EO research exhibits a survivor bias (Rauch et al., 2009). Because of generally difficult access to data, empirical research on failed small firms is still rare (Wiklund and Shepherd, 2011). In particular, the EO dimensions of risk-taking, proactiveness and competitive aggressiveness are a double-edged sword theoretically. Taking more risk naturally increases the risk of failure while being a necessary condition for exploiting untapped opportunities. First-mover advantages and the anticipation of future events (proactiveness) are affected by uncertainty; if an (uncertain) anticipation is correct, it can give a firm an important head-start; if not, it increases the probability of failure. Reducing margins for market share goals either through reducing prices or increasing market expenditure can help to outpace competitors, but depending on the competition, it might simply increase the risk of failure. Market share goals are growth-oriented but not necessarily profit-oriented. Apparently, effectiveness studies (investigating, for example, growth or market share) appear to be more frequent than efficiency studies (investigating, for example, profitability) on EO (Wales et al., 2011a). Building larger production capacities reduces both strategic flexibility and the potential for alternative investments in the event that competitive actions do not work out as desired. With its opportunity exploitation focus, EO seems to maximise the potential upside while not reducing the potential downside.
The additional analysis in this study revealed that survivors generally had a negative association between EO and cost leadership and a positive association between EO and differentiation, while for failures the opposite applied. It appears generally that EO is more beneficial for differentiation than cost leadership. Speed, customer service and flexibility are the advantages of small and young firms (Bidhé, 2000): these three elements can be related to differentiation. Organisational structures based on routine tasks and uniformity, allowing for economies of scale and the implementation of cost leadership strategies, are more typical for organisations lacking EO (Covin and Slevin, 1989). Indeed, the present results suggest that EO with its opportunity focus appears more oriented towards the introduction of new products and opening of new markets than reducing inefficiencies through new sources of supply or new production methods facilitating a competitive strategy of differentiation. The results also sustain the view that entrepreneurs are focused on market positioning, product quality and product innovation (Storey, 1994). Some EO researchers explicitly include the exploitation of target premium markets, which clearly is tied to a differentiation strategy, as an EO outcome (Lumpkin and Dess, 1996; Wiklund and Shepherd, 2005). In this sense, EO might have an inherent differentiation bias. Moreover, survivors have an EO mix impacting stronger competitive strategies than failures.
Conclusion
Implications of the study
For the theory of competitive strategy, the present study reinforces research showing the importance of competitive strategies for small firms (Borch et al., 1999). The research has shown the positive influences of both generic strategies on firm performance. In other words, competitive strategy does matter. The findings confirm assumptions that entrepreneurial behaviour acts through the development of a competitive strategy (Rauch et al., 2009). In addition, it sustains the importance of pursuing one type of competitive strategy to avoid the risk of being stuck in the middle (Thornhill and White, 2007).
Specifically for EO research, there are relevant implications. Research considered the EO–performance relationship as mediated by a firm’s strategy (Moreno and Casillas, 2008). As EO is more or less, effective in different firm environments (Frank et al., 2010), it appears also, more or less effective, in influencing other constructs. For small firm managers, the implications are that competitive strategy matters and that the development of one type of competitive advantage in line with a firm’s resources is a major performance driver. In line with other scholars (see e.g. Covin and Slevin, 1991), we argue that EO needs to be developed over time through consistent investment in resources and thus, constitutes a long-term firm-level orientation. As such, dimensions of EO are channelled through competitive strategy; the EO dimensions did not appear universally beneficial and rather detrimental for cost leadership. Therefore, small firm managers need to carefully develop firm-level behaviour in order to enhance competitive strategy. The practical implication from our study is that being more entrepreneurial is not an objective per se for small firm managers. EO needs to be related to the strategic goals of the firm. This insight is particularly important for small firms often competing in niche markets where potential growth can be limited, but where competitive advantage is essential. Moreover, we found that an essential dimension of EO such as risk-taking, which is often the target of public policy through facilitating access to financing, had a negative impact on both competitive strategies and performance.
Limitations of the study
There are obvious limitations to the study. First, the sample is rather small; large-scale repetition is desirable. Second, there might be cultural biases concerning both strategy implementation and EO (Knight, 1997; Thomas and Mueller, 2000). Research shows that cultural differences exist between countries concerning the preferred choice of competitive strategies (Allen et al., 2006). However, by considering the direct links between the EO dimensions and performance, we found similar results to previous research in different settings (Hughes and Morgan, 2007). Moreover, a meta-analysis demonstrated the robustness of the EO construct across settings (Rauch et al., 2009). The research focus was upon how the individual EO dimensions were associated with small firm strategy, rather than what caused the levels of the EO dimensions. Considering the context of the study, we did not assume strong differences of environmental conditions for the sample firms, but controlled ad hoc for environmental impact through industry controls. A more complex model, including both antecedents and consequences, would be desirable for future research. Third, the measures of innovativeness and risk-taking took a relatively restricted view. Innovativeness focused on product innovation, and while the innovativeness measure in EO research appears to be biased towards product innovation, it does not explicitly exclude process innovation. The risk-taking measure focused on financial risk-taking (Miller, 2007), and alternative measures could be developed for future research. Porter (1985) proposed four competitive strategies based on two dimensions: competitive logic and scope. We focused on only one dimension of Porter’s competitive strategies framework, i.e. differentiation and cost leadership. It could be argued that the sample firms, due to their small size and newness, might concentrate on just serving a niche market. While this assumption would not create any variance in explaining performance, it would be desirable to analyse the four generic strategies. Finally, the focus of the study was on small firms in the age range between three and 10 years; an extension of the age range and comparisons would further advance our understanding of EO and strategy effects.
Suggestions for future research
In this study the EO dimensions do not act uniformly on performance: some appear to be irrelevant, while others are beneficial and still others detrimental for firm performance, in line with most recent research (Casillas and Moreno, 2010; Perez-Luño et al., 2011). This raises important questions in light of EO having been a longstanding concept in entrepreneurial research and associated with early assumptions about entrepreneurship and entrepreneurs. For example, we can pick out risk-taking, which had a negative influence on both generic strategies and performance. Risk-taking has been promoted as one of the characteristics of entrepreneurs, but cognitive research has shown that entrepreneurs do not necessarily differ from non-entrepreneurs in their risk-taking attitude; over-confidence and optimism can change risk perception while risk-taking remains unchanged (Radcliffe and Klein, 2002). In this sense, future research can shed light on the relationship between EO and cognitive biases.
We recommend future research to investigate the different configurations of EO and their relationships with strategy and firm performance. While EO research has made substantial progress in analysing the environmental factors that explain EO, more research is needed to investigate what constructs mediate EO (Wales et al., 2011a). In this study, we used efficiency measurements of performance (including survival). Future EO research could compare (if available) efficiency and effectiveness measurements in order to understand better the differential impact of EO on specific outcome variables. The present research is dedicated to small firms; in this specific setting, more EO might not be effective due to an unfavourable competitive context. Future research should take into account how the competitive context of small firms moderates the EO–performance relationship. For the research on competitive strategy in small firms, the present study has shown how EO dimensions influence competitive strategy. Other factors influencing the implementation of competitive strategies in small firms should be considered in the future, such as the role of the family, the firm’s partner networks or other organisational features.
Final remarks
The present research has addressed issues that, in previous research, had been suggested to advance EO understanding: to analyse the effect of individual EO dimensions on competitive strategy and investigate potential survivor biases. This led to the recommended analysis of indirect effects, the examination of EO as a multidimensional concept and the use of a sample of surviving and failed firms (Rauch et al., 2009; Wales et al., 2011a). The research explored the notion that EO acts through competitive strategy on firm performance (Rauch et al., 2009). First, competitive strategy matters for small firms. Since differentiation and cost leadership have different inner logics, we expected that the individual EO dimensions would impact upon the two competitive strategies differently. The study has confirmed that the EO dimensions do not act uniformly on competitive strategy, and advances our understanding of the relative impact of EO dimensions on specific outcome variables (Wales et al., 2011a). We accounted in this study for surviving and failed firms, and the results suggest that EO might tend to maximise the upside and not reduce the downside for small firms. In addition, the risk of high EO for survival seems to be greater for capital-intensive strategies than cost leadership. As such, this study contributes to research considering the moderators and mediators of EO, and to research endeavours linking strategic process to content.
Footnotes
Appendix
Common method bias analysis.
| Substantive factor loading (R1) | t a | R12 | Method factor loading (R2) | t | R22 | |
|---|---|---|---|---|---|---|
| Autonomy –> AU1 | 0.82 | 33.6 | 0.68 | 0.09 | 1.7 | 0.01 |
| Autonomy –> AU2 | 0.88 | 33.2 | 0.77 | −0.09 | 1.7 | 0.01 |
| Competitive aggressiveness –> CA1 | 0.75 | 4.6 | 0.56 | 0.08 | 0.9 | 0.01 |
| Competitive aggressiveness –> CA2 | 0.73 | 4.8 | 0.54 | −0.07 | 1.2 | 0.01 |
| Cost leadership –> CL1 | 0.84 | 18.8 | 0.7 | −0.01 | 0.1 | 0 |
| Cost leadership –> CL2 | 0.83 | 16.7 | 0.69 | 0.01 | 0.2 | 0 |
| Cost leadership –> CL3 | 0.67 | 6.9 | 0.45 | −0.01 | 0.1 | 0 |
| Differentiation –> DIF1 | 0.84 | 22 | 0.71 | 0.05 | 0.9 | 0 |
| Differentiation –> DIF2 | 0.9 | 23.1 | 0.81 | −0.05 | 0.9 | 0 |
| Innovativeness –> IN1 | 0.8 | 22.2 | 0.63 | −0.04 | 0.5 | 0 |
| Innovativeness –> IN2 | 0.77 | 26.1 | 0.59 | 0.04 | 0.6 | 0 |
| Proactiveness –> PR1 | 0.76 | 7.4 | 0.58 | −0.08 | 1.1 | 0.01 |
| Proactiveness –> PR2 | 0.78 | 8.1 | 0.61 | 0.08 | 1.1 | 0.01 |
| Risk-taking –> RT1 | 0.81 | 16.2 | 0.65 | 0.05 | 0.8 | 0 |
| Risk-taking –> RT2 | 0.77 | 12.4 | 0.59 | 0.01 | 0.1 | 0 |
| Risk-taking –> RT3 | 0.75 | 13.1 | 0.57 | −0.01 | 0.8 | 0 |
| Average | 0.79 | 0.63 | 0 | 0 |
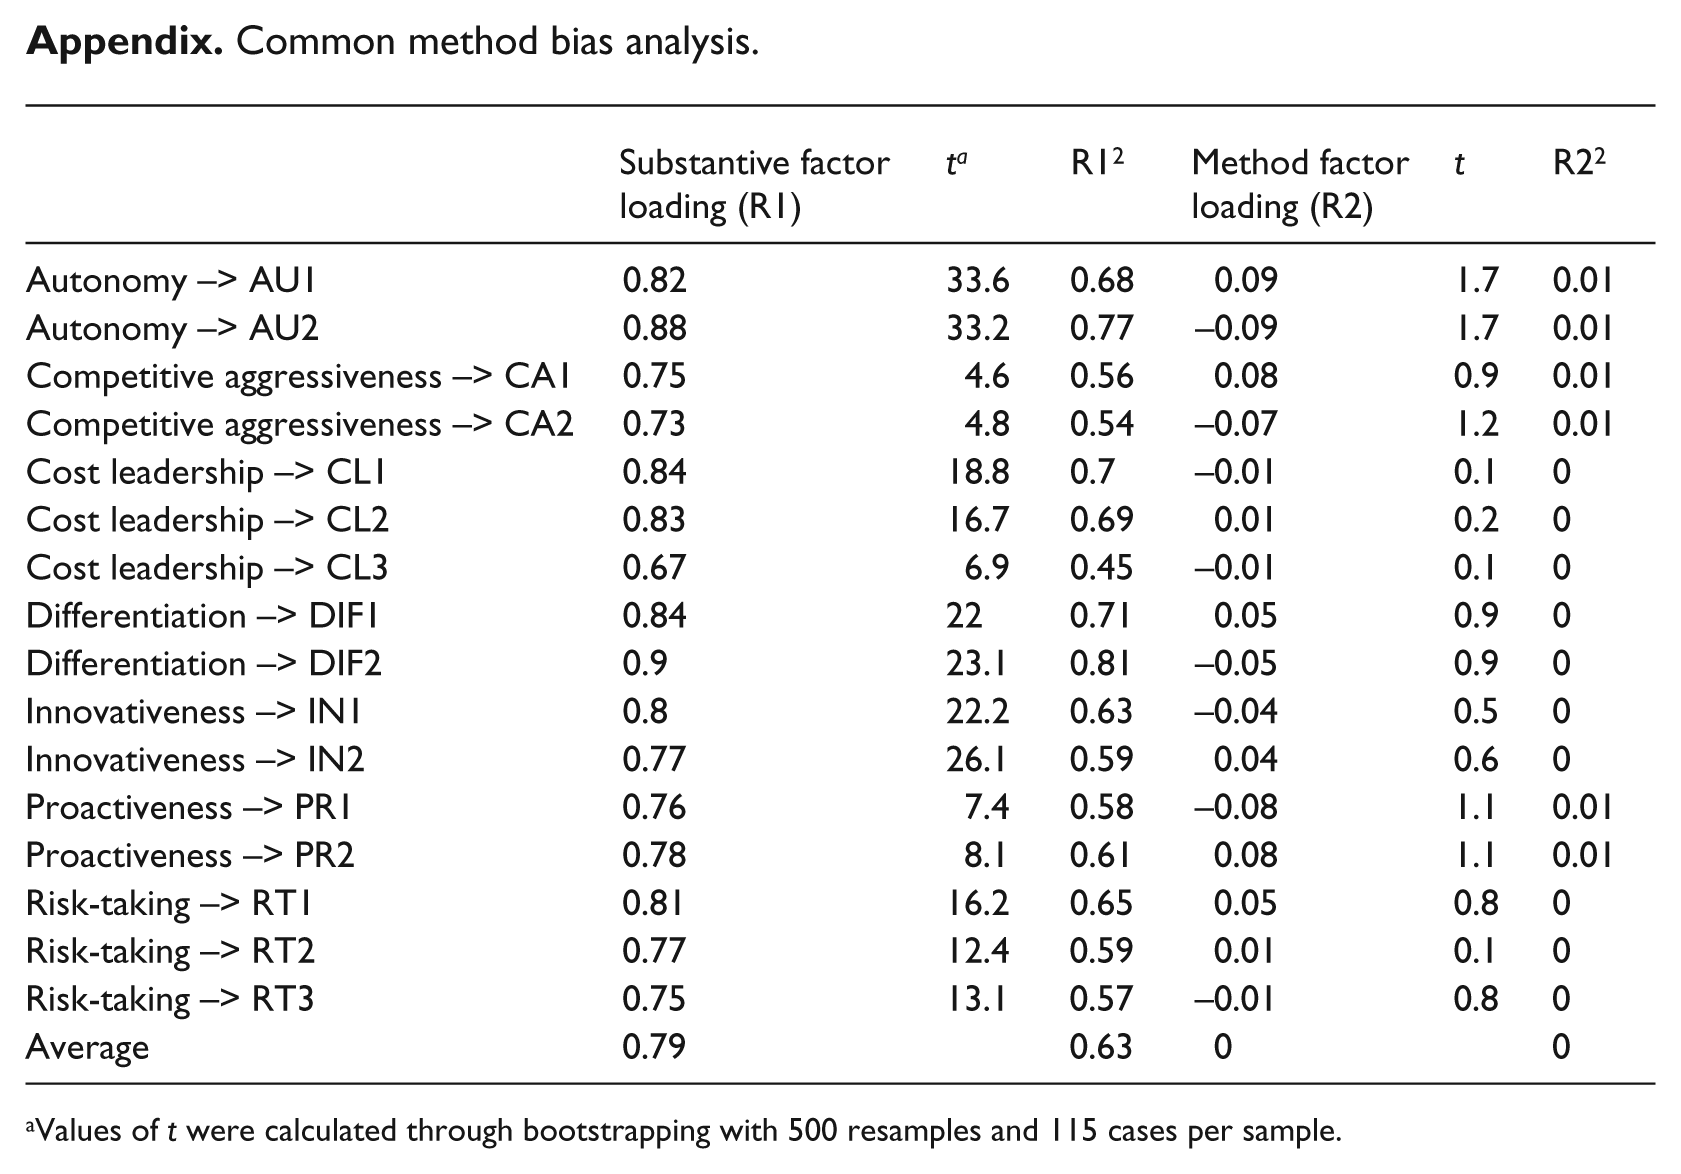
Values of t were calculated through bootstrapping with 500 resamples and 115 cases per sample.
Funding
This research received no specific grant from any funding agency in the public, commercial or not-for-profit sectors.