



Abstract
This article demonstrates that increased inflows of capital into private equity and venture capital funds can influence the investment behaviour of fund managers by increasing staging intensity, increasing amount per financing round, and accelerating speed of capital allocation. These changes do not appear to be related to expectations of improved investment performance. The study extends the work of Gompers and Lerner who interpret these inflows as demand pressure for venture capital securities to drive up prices during periods of high inflows. Using a unique dataset, the study examines the effects of this pressure on investment behaviour.
Introduction
Before the 2008 financial crisis, there were strong indications of an asset price bubble in the private equity (PE) and venture capital (VC) market, given historical boom-and-bust records. In 2005, PE and VC firms invested US$174bn in US-based portfolio companies, which was more than a fourfold increase over 2004 (US$42bn), and a sevenfold increase over 2003 (US$24bn). At the same time, the capital raised by these funds increased from US$28.7bn in 2002 to US$123bn in 2005, according to the National Venture Capital Association (2006). In comparison the Chinese PE market was growing even faster, with a raised volume in 2005 of about US$5bn in the country and US$4bn outside, from a low level of US$325m in 2002 (see Areddy, 2006; Balfour, 2006).
Obviously, more money pouring into PE and VC funds allows them to make faster and larger investments, but if attractive deals are generally scarce, how does an acceleration of the deployment of capital generate better returns? We extend the results of Gompers and Lerner (2000), who argue that demand pressure for attractive investments is driven up during high fund inflow periods, causing an increase in valuations. In particular, this pressure is arguably high in the Chinese PE and VC market, which was not created solely by domestic demand, but also by foreign PE and VC funds diversifying parts of the company portfolio by including Chinese firm. In response to the increase in investment amounts, valuations of PE or VC-financed enterprises increased substantially, causing doubts about their marketable value (see Ahlstrom et al., 2007). This article examines the impact of this demand pressure on investment pressure.
We believe this is the first empirical study to analyse in detail the entire chain of effects of this phenomenon, from the impact of capital streaming into funds on fund managers’ investment behaviour, to how this behaviour influences investment returns. We call it the pressure chain of PE and VC financing, and the specific research questions of this study are as follows: RQ1: How do fund inflows impact staging behaviour and the speed of capital allocation? RQ2: How does a possible change in investment behaviour impact returns?
This empirical study contributes to the understanding of the volatile nature of the PE and VC industry from a behavioural finance perspective. We assert that fund managers experience a higher amount of investment pressure during ‘hot’ times, which we characterise by large inflows of capital from investors. Higher amounts of investment pressure influence fund managers to change their behaviour in three primary ways, highlighted by allocations of capital to portfolio companies:
at an increased rate of intensity;
at higher amounts per financing round; and
at a faster rate.
This study controls for return on investment (ROI) as a possible driver for this change in behaviour, as well as several investment project-related risk factors.
PE and VC fund managers generally act as agents for fund investors (limited partners). In that capacity, they choose which firms to support, how much financial support to offer, and how to time capital injections to maximise investment returns. However, prior to making these decisions, a PE or VC firm must consider how to attract limited partners. One measure of the demand for the PE or VC asset class by limited partners is the amount of capital committed by such partners to new funds each year. In a world without ‘investment pressure’, one would expect fund managers to make capital allocation decisions (e.g. calling previously committed capital from limited partners and investing in portfolio companies) based on one fundamental criterion: what is the optimal amount of capital needed to maximise investment returns for a specific portfolio company, given its particular financial needs or stage of development (for example, does the company need a first round to build a customer base, or a second round to consolidate market share)? However, during ‘hot’ times of increasing fund inflows, we posit that fund managers will consider not only the portfolio company’s needs, but also their own increased chances of raising their next funds after deploying capital into the current fund. This increase in staging intensity is likely to be associated with lower expected performance.
This study uses a unique dataset derived from combining congruent data from Venture Economics (www.venturexpert.com) and CEPRES (www.cepres.com) (as in Krohmer et al., 2009). It analyses detailed information on 1549 financing rounds and 2329 precisely dated cash injections (tranches) of 712 matched PE and VC investments from January 1979 to November 2003. It finds that a 100 percent increase in capital inflows into PE and VC funds is associated with the following: a 76 percent increase in the staging intensity of financing rounds (see Table 2, Model 2); a 102 percent increase in the magnitude of the amount invested at each financing round (Table 3, Model 3); and an 65 percent increase in the relative speed of capital allocation (Table 4, Model 4). It finds that decisions made under higher investment pressure are negatively correlated with fund performance. Furthermore, similar to Krohmer et al. (2009), it finds that an increase in staging intensity correlates with lower returns on investment (see Table 5).
The remainder of this article is structured as follows. The next section reviews related literature on PE and VC funds and how fund managers make decisions the following section describes the empirical approach and predictions, and then describes the data more fully. This is followed by the results and concluding remarks.
Literature review
The positive role of fund managers in allocating VC under imperfect market conditions is explained by Chan (1983); complementing this analysis, Allen (2001) discusses the role of financial intermediaries highlighting their participation on the upside of an investment noting that they tend to have rather limited participation on the downside. Such behaviour creates incentives to support the growth of bubbles instead of actively hindering more intense capital allocation during overheated market periods.
Similarly, other prominent investors have been equally vocal. In Berkshire Hathaway’s 2005 annual report, Warren Buffett (2005: 19) notes: ‘For investors as a whole, returns decrease as motion increases’, criticising fund managers for encouraging a higher amount of market activity to profit from commissions. Research has explored the fundraising phase in the PE and VC industries, but little attention has been afforded to how PE and VC investors allocate the funds raised. Gompers and Lerner (1999) and Cumming et al. (2005a) study the underlying factors that drive fundraising, and provide evidence that it arises from fund managers’ value-added activities (see Dyer and Ross, 2007; Lahti, forthcoming, 2013). Moreover, the cyclical nature of fundraising, as well as the returns of the PE and VC industry, are described by Fenn et al. (1995) and Gompers and Lerner (1999).
So, we note that fundraising and capital allocation decisions occur against the larger backdrop of changing market demand conditions. Research has explored both the macroeconomic context of investment returns, as well as the microeconomic foundations of fund performance. In theoretical studies, Inderst and Mueller (2004) model the effects of capital market characteristics on the value of start-up firms, and shed light on how they impact boom-and-bust periods. Berger and Udell (1998) discuss the impact of the macroeconomic environment on small firm finance whilst in a more recent study, Kaplan and Schoar (2005) find that aggregate industry returns tend to be lower following a boom, with most of the effect driven by the poor performance of new entrants. On a contrary note, Baron et al. (2003) argue that relatively new VCs benefit from the performance improvements associated with increased experience; however, beyond a specific point, further gains in experience are associated with performance reductions.
Cumming and Walz (2010) are among those who previously have studied the risk and return characteristics of PE and VC funds. Other papers examine the mechanisms that connect changes in market demand conditions with specific fund performance measures; empirically, Gompers and Lerner (2000) speculate about the phenomenon of ‘money chasing deals’, and explain that increasing capital contributions to funds can lead to higher valuations of new investments. They argue that exogenous shifts in the demand for securities affect valuations and moreover, that the relationship between increased fundraising and prices does not appear to be attributable to higher perceived investment prospects. Gompers and Lerner (2000) conclude that the regulatory and tax-driven nature of VC fundraising, and the significant difference in investment success rates during ‘hot’ and ‘cold’ fundraising periods, suggest that demand pressure is driven up during periods of high inflows. In line with this argument, we also argue that the higher demand pressure resulting from an increase in fund inflows is associated with fund managers accepting higher deal prices. However, this article marks the first time that an exploration has been conducted to measure precisely how changes in fund managers’ staging and capital allocation decisions impact higher demand pressure and the ROI relationship.
The interaction between the limited lifespan of funds and PE and VC compensation and incentive structures affects how investment decisions are made. PE and VC investment management firms generate their income from annual management fees (usually around 2% of fund volume), and participation in investment returns (usually around 20%). Typically, a certain level of fund total capital – say, 70 percent – must be allocated to portfolio companies before the investment management team is permitted to raise a follow-up fund. Thus, due to their compensation schemes, PE and VC funds have an incentive to allocate capital quickly in order to conduct the next round of fundraising. Investors (limited partners) in the fund do not normally have control over the fund’s speed of investing, and must provide capital when called on by the fund to do so. Gebhardt (2002) analyses the budget constraint of funds in regard to the magnitude of capital. However, its effect on the speed of capital allocation has yet to be explored. The present study controls for Meyer’s (2003) framework, who explains how a fund’s age and budget constraints may influence investment manager behaviour. Ljungquist and Richardson (2003a, 2003b) show that it usually takes several years for a fund to be fully invested, and that existing funds accelerate investment flows and can earn higher returns when the supply of investment opportunities improves. Knigge et al. (2004) find that investment timing has an impact on the performance of VC funds, but surprisingly, that divestment timing has no such impact on returns. Bengtsson and Sensoy (2011) find a relationship between investor experience and the cash flow rights that they are granted in investment contracts. They investigate cash flow from the fund to the portfolio company, but there has been a research gap on how contracts structure cash flow rights between fund investors (limited partners) and the fund vehicle itself (general partner). This study will contribute to closing this gap.
Given the risks associated with potential agency problems and the probability of business failure, fund managers do not typically disburse capital in a single, upfront investment. Instead, they conduct several financing rounds, which can be partitioned further into individual cash injections called ‘tranches’. Thus, tranches will only be allocated if the portfolio company meets a predefined set of performance targets, or milestones. Sahlman (1990) shows how portfolio companies receive capital in stages, based on their specific development needs and the fund manager’s requirements to mitigate information asymmetries and agency problems. Neher (1999) and Wang and Zhou (2004) argue that staging can have a positive impact on performance, as it gives investors a ‘wait and see’ option that can mitigate entrepreneurs’ commitment problems. In an empirical study, Gompers (1995) finds that a greater number of rounds and a higher magnitude of financing per round are positively correlated with companies exiting via IPOs, which typically generate higher ROI. Cornelli and Yosha (2003) however, argue that staged financing creates a conflict of interest between the investor and the entrepreneur, inducing a focus on the next financing round at the expense of long-term performance whilst Hege et al. (2003) find that an increase in the number of financing rounds is related to a decrease in the internal rate of return (IRR). Krohmer et al. (2009) attempt to reconcile these conflicting findings, showing both the positive and negative impacts of staging on performance by arguing that investor motivation for staging drives its impact. Regarding the influence of fund inflows on staging, Gompers (1995) notes two important aspects relating to an increase in capital committed to new venture funds: the duration of financing rounds decreases the following year; and the magnitude of financing per round increases the following year. Our predictions about the impact of investment pressure on staging are consistent with these findings.
Hypotheses
How fund inflows affect staging behaviour
How does a PE or VC fund resolve higher pressure to invest? One way to put more capital to work is to invest at a higher frequency in new and existing portfolio companies, injecting a higher amount of capital into each financing round. Gompers and Lerner (2000) show that during ‘hot’ periods, valuations of new investments tend to rise; this implies that, relative to ‘cold’ periods, funds need to pay a higher price or invest more capital in order to acquire the same level of equity. In addition, funds can choose to invest in a larger number of new companies; however, this may affect long-term results if the larger quantity of investment decisions implies less due diligence, monitoring or support on a per-company basis.
Another option is for funds to inject more capital into companies that they already hold in their portfolios. These companies have passed a certain fund-specific threshold and have been selected as promising candidates; fund managers also tend to be more knowledgeable about their prospects. Since PE and VC firms stagger capital injections in tranches to mitigate information asymmetry and risk, it is plausible that higher investment pressure will affect staging behaviour. This study predicts that an increase in capital inflows will be associated with a higher frequency of financing rounds and a higher magnitude of investment per round, which leads to the first two hypotheses: H1: Fund inflows will positively affect staging intensity. H2: Fund inflows will positively affect average investment amount per financing round.
How fund inflows affect the speed of capital allocation
Every fund has limited amounts of capital, time and effort to allocate to its portfolio companies. We argue that the pattern of resource allocation over a specific period of time depends on demand pressure, as proxied for by the amount of capital committed to new funds on the overall market during the year of the observed investment. If a fund spreads its resources equally over the total investment period, the fund manager can assign each invested dollar a uniform level of concentration and support. However, according to Allen’s (2001) findings, investment managers will accelerate the speed of capital allocation during periods of higher capital inflows into new funds. This is because there is increased investment pressure compared to periods of lower inflows, as well as increased opportunities to raise the next fund more quickly. We measure the speed of capital allocation as follows.
Consider two funds, A and B, both of which invest a total of US$100m into all of their portfolio companies over their funds’ complete lifetime: [TFCOall-PC] = US$100m for both funds. Fund A provides the first capital investment to Portfolio Company i [PCi] in April 2000: with the final distribution occurring two years later in April 2002, after the exit of [PCi]. During this two-year holding period [HPPCi], fund A has a US$60m cash outflow into all its portfolio companies [FCOall-PCi]. Meanwhile, Fund B invests US$50m into all of its portfolio companies during its two-year holding period of April 1992 to April 1994. Given the illustrative example, for fund A, [FCOall-PCi] = US$30m per year, and for fund B, [FCOall-PCi] = US$25m per year. The general measure of each fund’s speed of capital allocation [SCAPCi] in percent per year during the fund’s investment period for [PCi] is simply the ratio of [FCOall-PCi]/[TFCOall-PC]. Using this ratio, it is possible to standardise the measurement across different fund sizes. In this example, the speed of capital allocation [SCAPCi] of fund A during the investment period [PCi] is 30 percent per year, and for Fund B it is 25 percent per year. Furthermore, as a second measurement, this study analyses the relative speed of capital allocation [RSCAPCi] as a means to determine whether a fund’s speed of capital allocation is higher or lower than average during an observed investment. For [RSCAPCi], the lifetime of the fund is taken into consideration.
To illustrate, we build on our prior example and assign fund A a lifespan of 10 years and fund B a lifespan of five years. If each fund allocates its US$100 million of capital in a uniform fashion over its lifespan, fund A would have US$10m to invest in any given year, resulting in a US$10m fund investment ratio (FIR) per year, and fund B would have a $20m FIR per year. Moreover, the relative speed of capital allocation [RSCAPCi] during the observation period for [PCi] is the ratio of [FCOall-PCi]/[FIRPCi]. Using the given hypothetical values in the example, thus we have [RSCAPCi] = 3 (US$30m [FCOall-PCi] divided by US$10m [FIR]) for fund A. Analogously, the relative speed of capital allocation for fund B would be 1.25.
Note that a higher percentage speed of capital allocation per year implies a faster speed of capital allocation for a given fund during a specific company’s holding period. A higher relative speed of capital allocation implies a faster speed of capital within the fund’s lifetime as a ratio compared to the fund’s average capital allocation speed. However, by itself, this does not merit any judgement: there are many reasons why fund managers may deploy capital faster or slower at any given time. A higher or lower speed of capital allocation or relative speed of capital allocation value simply reflects the speed with which a given fund allocates capital during the holding period of a particular portfolio company, relative to fund lifespan and total capital available for investment. The interesting point (illustrated in this article) is that higher demand pressure from limited partners appears to be related to higher speed of capital allocation and relative speed of capital allocation values, but higher speed of capital allocation and relative speed of capital allocation values are not associated with higher ROI. This does not rule out the idea that an increase in expected future cash flows due to, for example, the development of a new product line that can only be produced with a new machine, could lead VC or PE managers to increase capital inflows to an investee company without increasing their level of overall committed capital to the PE/VC industry. 1 On a higher level, we observe that demand is related to staging behaviour and capital deployment, and we believe that additional company-level information could help frame the results.
It seems plausible that periods characterised by low levels of capital inflows will influence fund managers to invest current funds cautiously, in order to avoid running out of capital before the follow-up fund is raised. This implies lower investment pressure, and could signal the need to maintain larger investment reserves for current portfolio companies. However, when high levels of capital need to be committed to new funds, PE and VC firms have an incentive to increase the speed of capital allocation in order to generate better results and reach investment thresholds more quickly. Thus, they can take full advantage of this ‘hot’ period to raise the next fund. This leads to the third hypothesis: H3: Fund inflows will positively affect the speed of capital allocation.
Method
Data
In order to test these hypotheses, data were used similar to that found in Krohmer et al. (2009), who were the first to generate a unique dataset by merging congruent data from Venture Economics (www.thomsonfinancial.com) with content from the CEPRES database (www.CEPRES.de). using Matlab 2007. The data in Venture Economics are provided voluntarily by investment firms and has been used for several studies, including Gompers (1995) and Hege et al. (2003). CEPRES obtains most of its information from due diligence reports, including audited filings of investment firms. Cumming and Walz (2010) and Schmidt (2004) are among those who have used CEPRES data.
Both datasets contain complementary details. For example, Venture Economics provides information on each financing round, while CEPRES 2 provides partially audited and precisely dated information about the cash flows for each financing tranche. Combined, they provide a fuller picture of each investment, and allow precise IRR calculations to be performed. The time span includes ‘hot’ venture capital years within, for example, the technology bubble, as well as the ‘cold’ years after the bubble burst. Therefore, we included a dummy variable ‘Exit/Valuation in Bubble’ in the regressions as an indication of whether a portfolio company was exited between September 1998 and March 2000: in order to control for differences in the investment climate for the VC and PE fund industry (see Gavious and Schwartz, 2011). We are well aware of the fact that the dynamics before the Lehman Brothers collapse and the subsequent financial crisis are not fully comparable to the technology bubble, but we believe that our time span is sufficient to analyze our research questions.
The investments were merged from both databases, provided that they were identical on four levels of identification: name of investment management firm; name of fund; name of portfolio company; and date of initial investment from the fund into the company.
Matching these entries generated a dataset with more than 150 different variables for each investment, allowing the empirical analysis to be performed. Appendix A shows the variables used for the analyses. The merged dataset contains 1747 specific investments, which were reduced further as follows. All unrealised investments were excluded in order to mitigate reporting bias and to ensure that IRR figures were based only on fully or partially realised investments. Valuation bias and estimation errors in unrealised investments were considered only if the q-value was 20 percent or less, based on Kaserer and Diller’s (2004) model:

For this step, the residual net asset value (RNAVT) of partially realised investments as of November 2003 was divided by the absolute sum of the cash flows between the fund and the portfolio company.
In the final step, all cross-fund investments (e.g. two or more follow-up funds of the same investment management firm) in the same portfolio company were excluded, to eliminate double-counting. After these reductions, the sample consists of 712 different investments made by 122 PE and VC funds belonging to 51 different investment management firms. These investments include 1549 financing rounds, with 2329 cash injections (tranches) worldwide, spanning a 24-year period from January 1979 to November 2003. Note that although 712 investment relationships is a small segment of the PE or VC deal universe, we believe that the sample, as used and argued by Krohmer et al. (2009), is comparable to samples used in previous studies focusing on staging, exit decisions and investment manager behaviour. For example, Gompers (1995) examined staging based on a sample of 794 venture capital-backed companies provided by Venture Economics, while Lerner (1994) analysed the exit decisions of venture capitalists in 350 privately held venture-backed biotechnology firms. In a more recent paper, Kaplan and Strömberg (2004) studied the investment analyses of 67 portfolio investments by 11 VC funds. For the deals considered in the present analyses, we have complete information on financing rounds and tranches. However, given the limitations of existing publicly available data and our objective of studying the effect of investment pressure on investment behaviour, we believe this to be a necessary sacrifice.
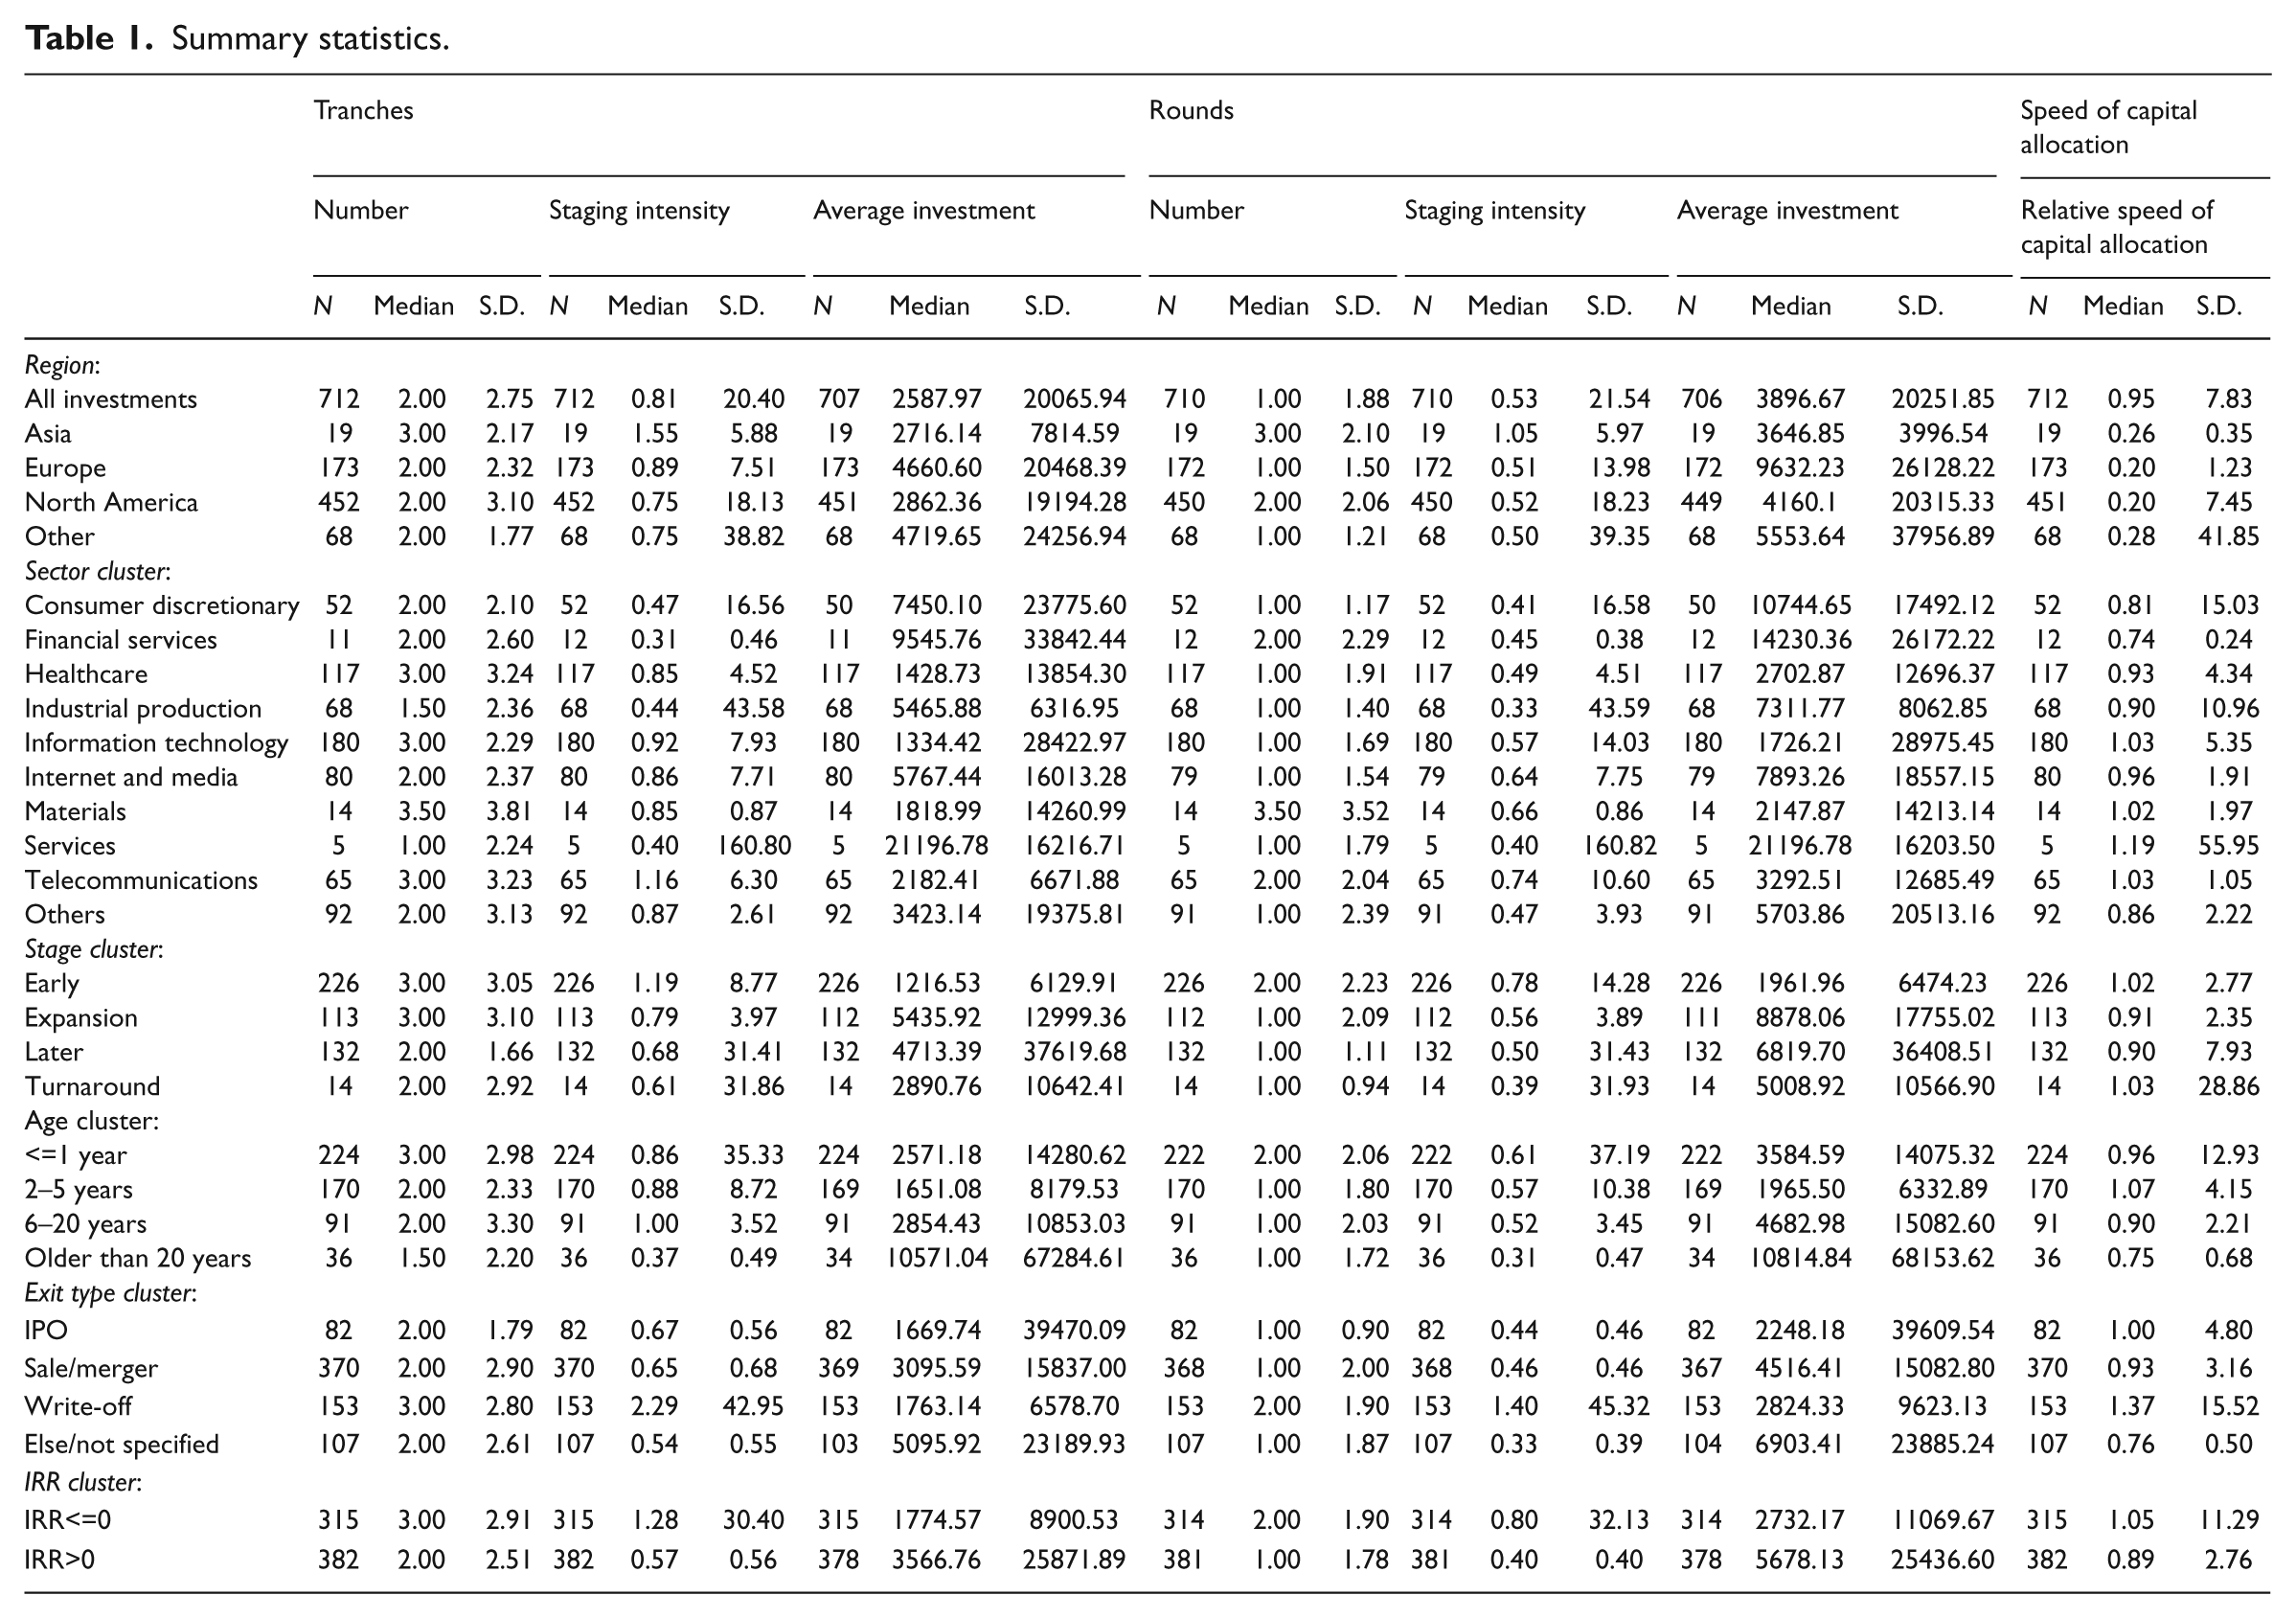
The dataset appears to be representative of the general pool of PE and VC deals because it corresponds with the frequency distribution of key aspects of the market. As Figures 1 to 3 in Appendix B show, the frequency distribution of the beginning and exit investment dates in the sample is similar to industry developments from 1979–2003. The frequency distribution with respect to country of origin is comparable to the size of regional PE and VC markets, as well as to industry distribution. 3 Table 1 provides in Krohmer et al. (2009) summary statistics on the relevant variables analysed in this study, as well as on investments by region (see Cumming et al., 2010 for cross-country differences). The dataset includes 712 investments (one observation is per company, not per investment round) during the period January 1979 to November 2003, merged from the Venture Economics and Cepres databases (for detailed description of the variables, see Appendix A). PE and VC funds can provide the financing of their portfolio companies in several financing rounds, which can be split up further into several cash injections, ‘tranches’. The tables present for each category the number of observations, median and standard deviation. Several sub-clusters are considered for the analyses of structural differences.
Summary statistics.
The level of detail and the accuracy of this article extends the work of previous empirical studies which have explored the determinants and the influence of staging. For example, Gompers’ (1995) study using Venture Economics data focused on IPO exit as a proxy for success. However, in line with Krohmer et al. (2009), we argue that this measurement approach is imprecise, as a highly valued trade sale ultimately may provide higher investment returns than a poorly-priced IPO. Hege et al. (2003) base their performance measurement on a hand-collected questionnaire dataset supplemented by Venture Economics data. Their performance measurement is subject to two types of error: the imprecise proxy of an IPO exit as a success measure; and the incorrect calculation of IRR using financing round information alone, without considering the accuracy of the data on each tranche cash flow from the fund to the company.
However, such tranche cash flow data is not available from Venture Economics. The exact date of cash injections can differ from the date of the financing round, because often rounds are broken up into several injections, referred to as ‘milestone rounds’. Kaplan et al. (2002) identify this weakness and stress the impossibility of accurately measuring milestone round information using Venture Economics data: ‘Milestone rounds, therefore, are problematic because the amount invested at closing and the total amount actually invested at those terms can differ.’ Unlike previous studies, the merged dataset used in the present study provides precise and partially audited information for each financing round, as well as for each cash transaction within each round.
Results
The first regression analyses the determinants of staging of PE and VC investments.
Table 2 presents the results of the OLS regression on the determinants of staging intensity. PE and VC funds can provide the financing to their portfolio companies not only in a single upfront investment, but in several financing rounds, which can be split up further into several cash injections, i.e. tranches. Staging intensity is defined as the number of tranches or rounds divided by total investment duration. The investment duration is the period of time measured in years between the initial cash injection from the fund to the portfolio company, and the final distribution from the company to the fund. The average round or tranche investment is the total investment amount from the fund to the portfolio company, divided by the total number of financing rounds or tranches during the investment duration.
Regression analysis on the determinants of staging on PE and VC investments (staging intensity).

*, **, *** denote significance at the 10%, 5% and 1% levels respectively.
Table 3 presents the results of the OLS regression in the determinants of staging measured by average amount per financing. The different regression models are grouped by two categories: staging intensity of financing rounds and of tranches. PE and VC funds can provide the financing to their portfolio companies not only in a single upfront investment. but rather in several financing round, which can be split up further into several cash injections from the fund to the portfolio company and the final distribution from the company to the fund. The average round or tranche investment is the total investment amount from the fund to the portfolio company divided by the total number of financing round or tranches during the investment duration.
Regression analysis on the determinants of staging of PE and VC investments (average investment).
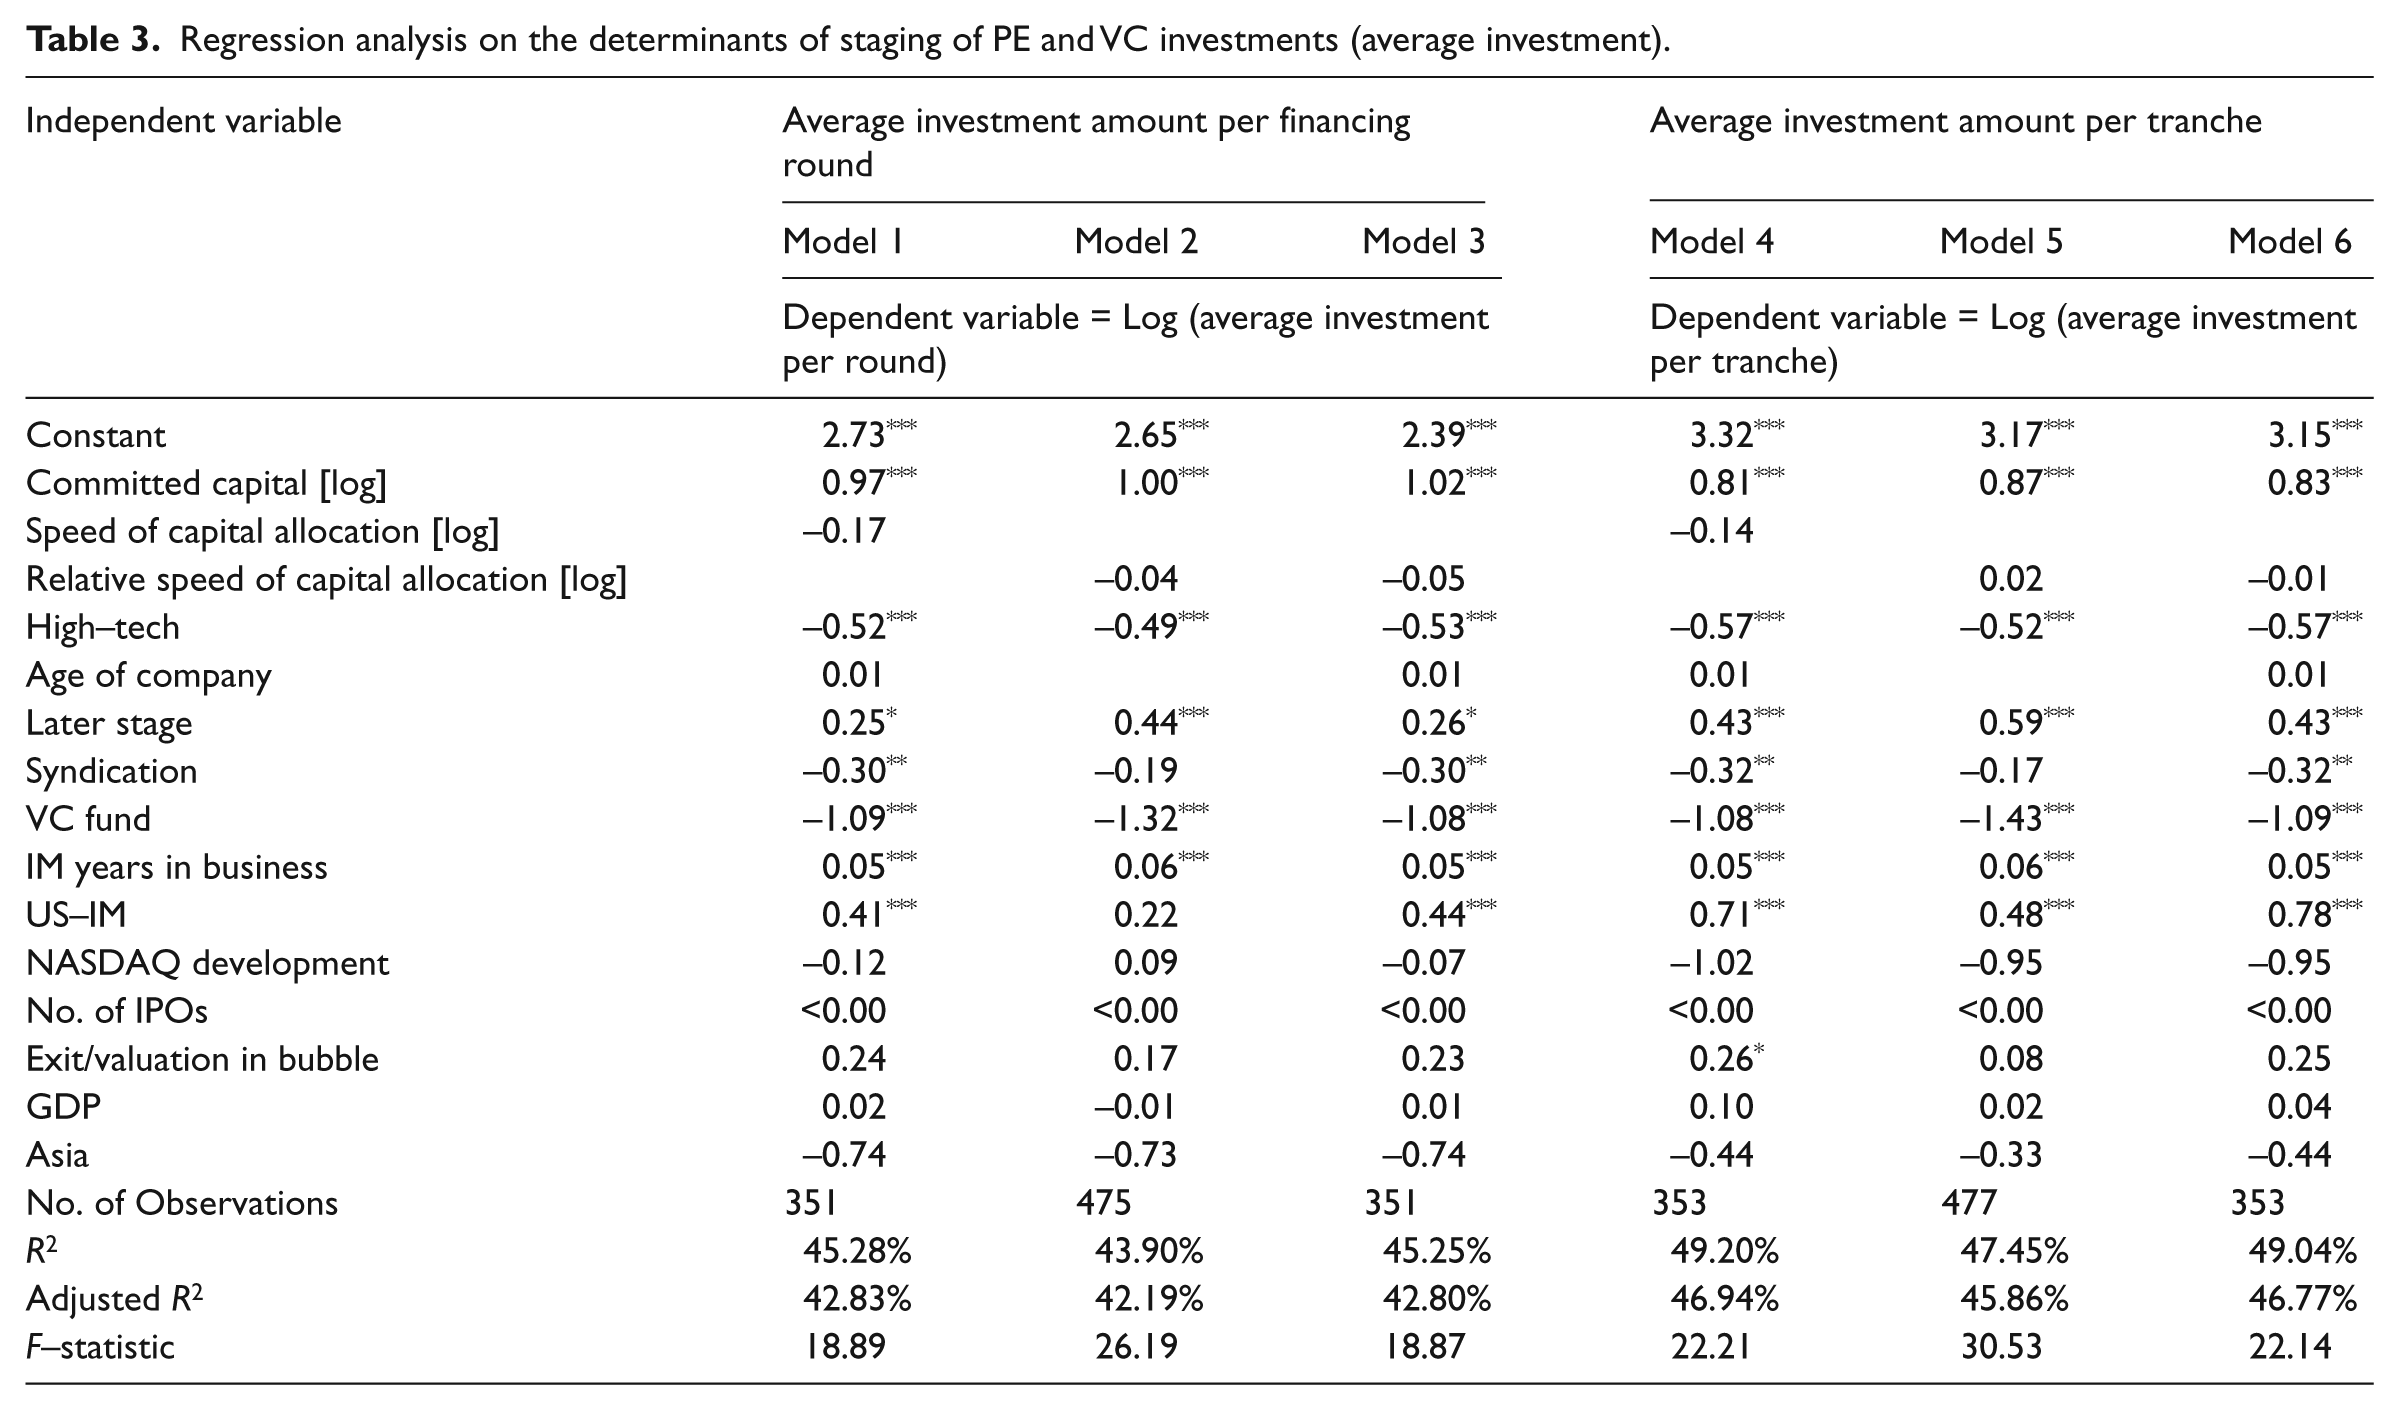
It finds that an increase in fund inflows as measured by committed capital to new PE and VC funds during the year of the observed investment is associated with an increase in staging behaviour. We note an increase in staging intensity, as well as a higher magnitude of capital investment per financing round and tranche. Furthermore, we find that a 100 percent increase in fund inflows is associated with a 76 percent increase in the staging intensity of financing rounds (Table 2, Model 2) and a 102 percent increase in the average amount of investment per financing round (Table 3, Model 3). Interestingly, in Asia a 100 percent increase in fund inflows is associated with an additional 73 percent increase in the staging intensity of financing rounds (Table 2, Model 1). 4
These results appear to support our argument that greater investment pressure on the part of fund managers can influence their staging behaviour, after controlling for firm-specific characteristics such as industry and company age. These results remain robust, even after controlling for factors such as developmental stage and whether the business is associated with the high-technology sector (as shown in Mason 2009), etc., all of which can signal agency problems or specific investment risks of the project, and have been established as important determinants of staging behaviour. The results for H1 and H2 are robust, even after controlling for exogenous market characteristics such as the development of the NASDAQ index or the economic environment (systematic risk), proxied for by gross domestic product (GDP) during the observation period. Furthermore, in an unreported robustness check, the sample was split into 33 percent percentiles which were compared with the highest and lowest IRRs. It was found that the direction of the relationships remain qualitatively stable for all percentiles, but the statistical significance is lower. In addition, the latter can be driven by sample reduction.
The results in Table 4 show that the level of capital committed to new funds positively impacts the relative speed of capital allocation, capturing the increase in speed of capital allocation within funds (see subsection “How fund inflows affect the speed of capital allocation” for the definition). Higher values of committed capital imply that more funds than average are available from limited partners. The study also finds that periods marked by a 100 percent increase in fund inflows are associated with an 68 percent increase in relative speed of capital allocation values at the means (Table 4, Model 4). The results are robust after controlling for several factors specific to the following:
the investment – e.g. the age or the stage;
the fund – e.g. its internal age since inception and/or fraction of financed companies;
the investment management firm – years in business or number of professionals; and
the market (GDP).
Regression analysis on the determinants of the fund’s speed of capital allocation.
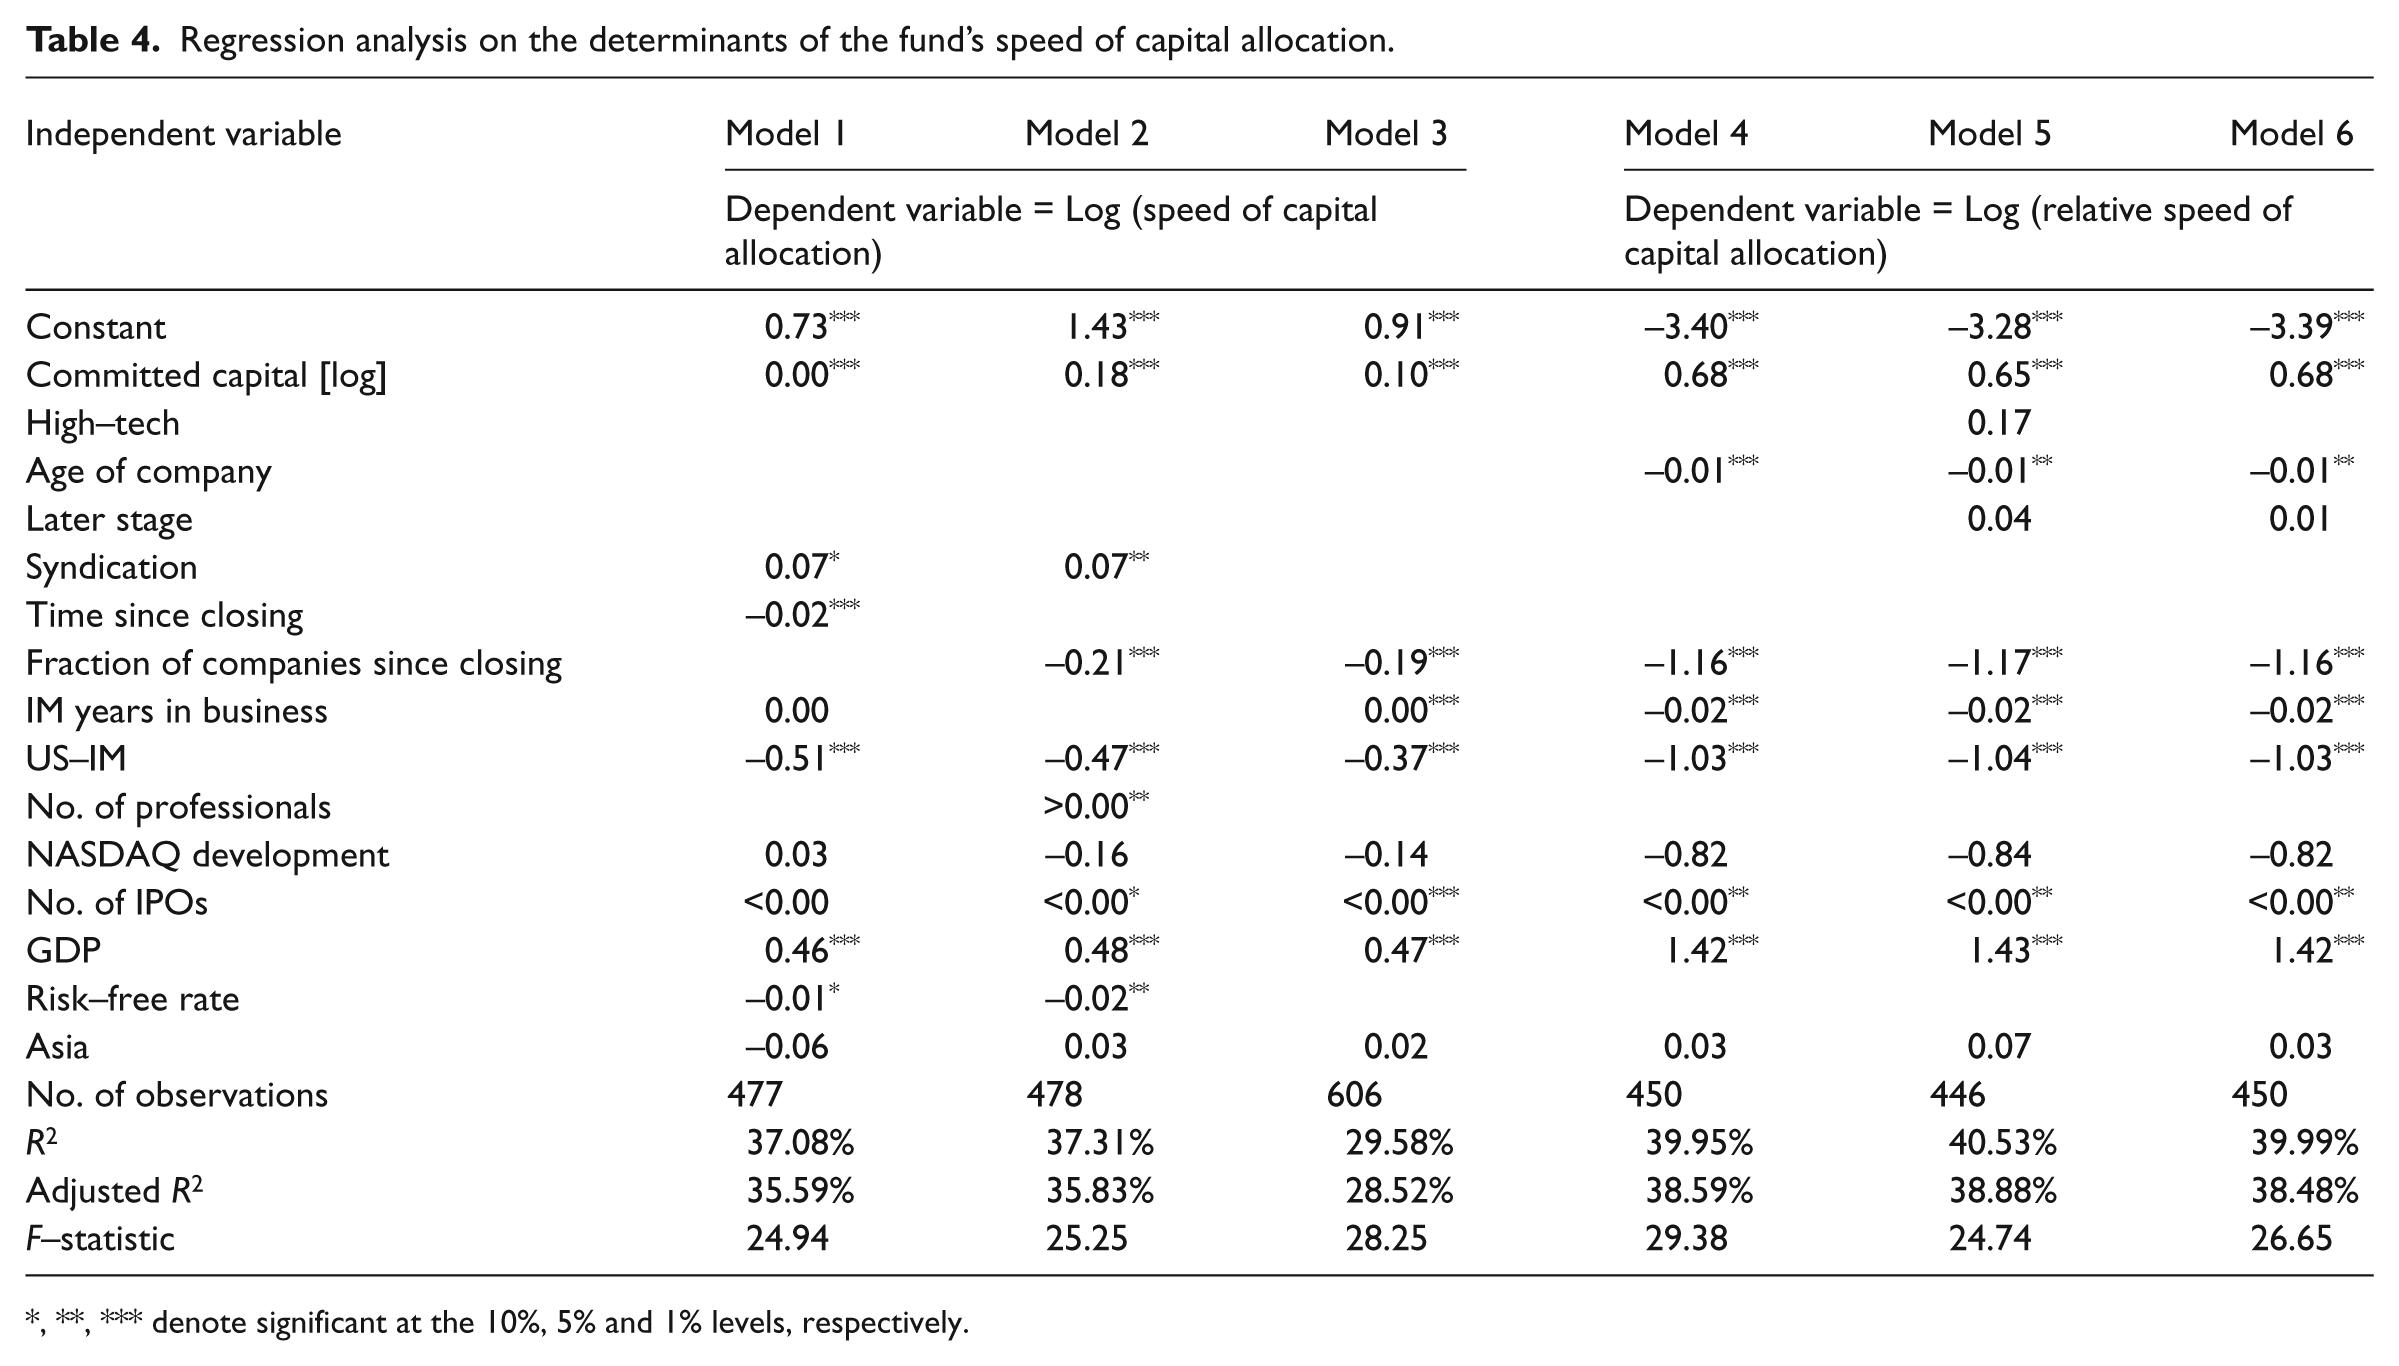
*, **, *** denote significant at the 10%, 5% and 1% levels, respectively.
Also, in an unreported robustness in the style of the previous comparison between percentiles, we find that the results are very much comparable in all percentiles for relative speed of capital allocation, but not for speed of capital allocation.
As a final test, the study controlled for investment pressure or better firm prospects as causes of changes in investment behaviour. In the analyses, fund inflows were treated implicitly as exogenous, and were used as independent variables in the above regressions. We now control for the correctness of this assumption, because fund inflows also could be seen as a response to positive information about PE and VC investments. Such information could lead investment managers to increase staging and accelerate the speed of capital allocation. We must be careful not to imply a causal link between committed capital and staging and capital allocations into PE and VC investments, when actually both are correlated with future firm prospects.
We address this concern by examining in detail the success of these investments. As with Gompers and Lerner (2000), who control for ‘demand pressure or better prospects’, we analyse the ultimate success of the firms funded by PE and VC firms. Gompers and Lerner (2000) suggest that ideally, studies should compare the rate of returns, something that they are not able to do due to missing cash flow data. Instead, they use two proxies: exits via an IPO; or the percentage of investments that either resulted in an IPO, or were acquired for at least twice the valuation of that round. These findings show that increased valuations driven by fund inflows are not related to changes in future prospects.
The comprehensive dataset in the present study enables performance of a precise cash flow-based analysis of the rate of return as the IRR, as it relates to staging, capital allocation and fund inflows. The study specifies an absolute IRR measure based on precise data on the timing and magnitude of the cash flows between each fund and portfolio company. It also performs further analyses on relative IRR measures compared to the performance of a simultaneous investment in a public index (e.g. NASDAQ or MSCI World). 5
Table 5 gives the results of the OLS regression analyses with absolute IRR figures. 6 Using simple OLS models, we find that the data support classical linear regression assumptions, with tests for collinearity and heteroskedasticity returning acceptable levels. The findings confirm the view that increased staging intensity and number per financing tranches, as well as accelerated capital allocations driven by higher fund inflows, are not associated with higher investment returns. Specifically, we find that periods marked by a 100 percent increase in the staging intensity of tranches are associated with a 21 percent decrease in return values at the means (Table 5, Model 2); a 100 percent increase in the number of tranches are related to a 3 percent decrease in returns (Table 5, Model 1); and a 100 percent acceleration of the speed of capital allocation are associated with a 26 percent reduction in return values at the means (Table 5, Model 1). These results help alleviate concerns that shifts in fund inflows and changes in staging intensity or capital allocation are driven by changes in future prospects.
Regression analysis on the determinants of return on investment.
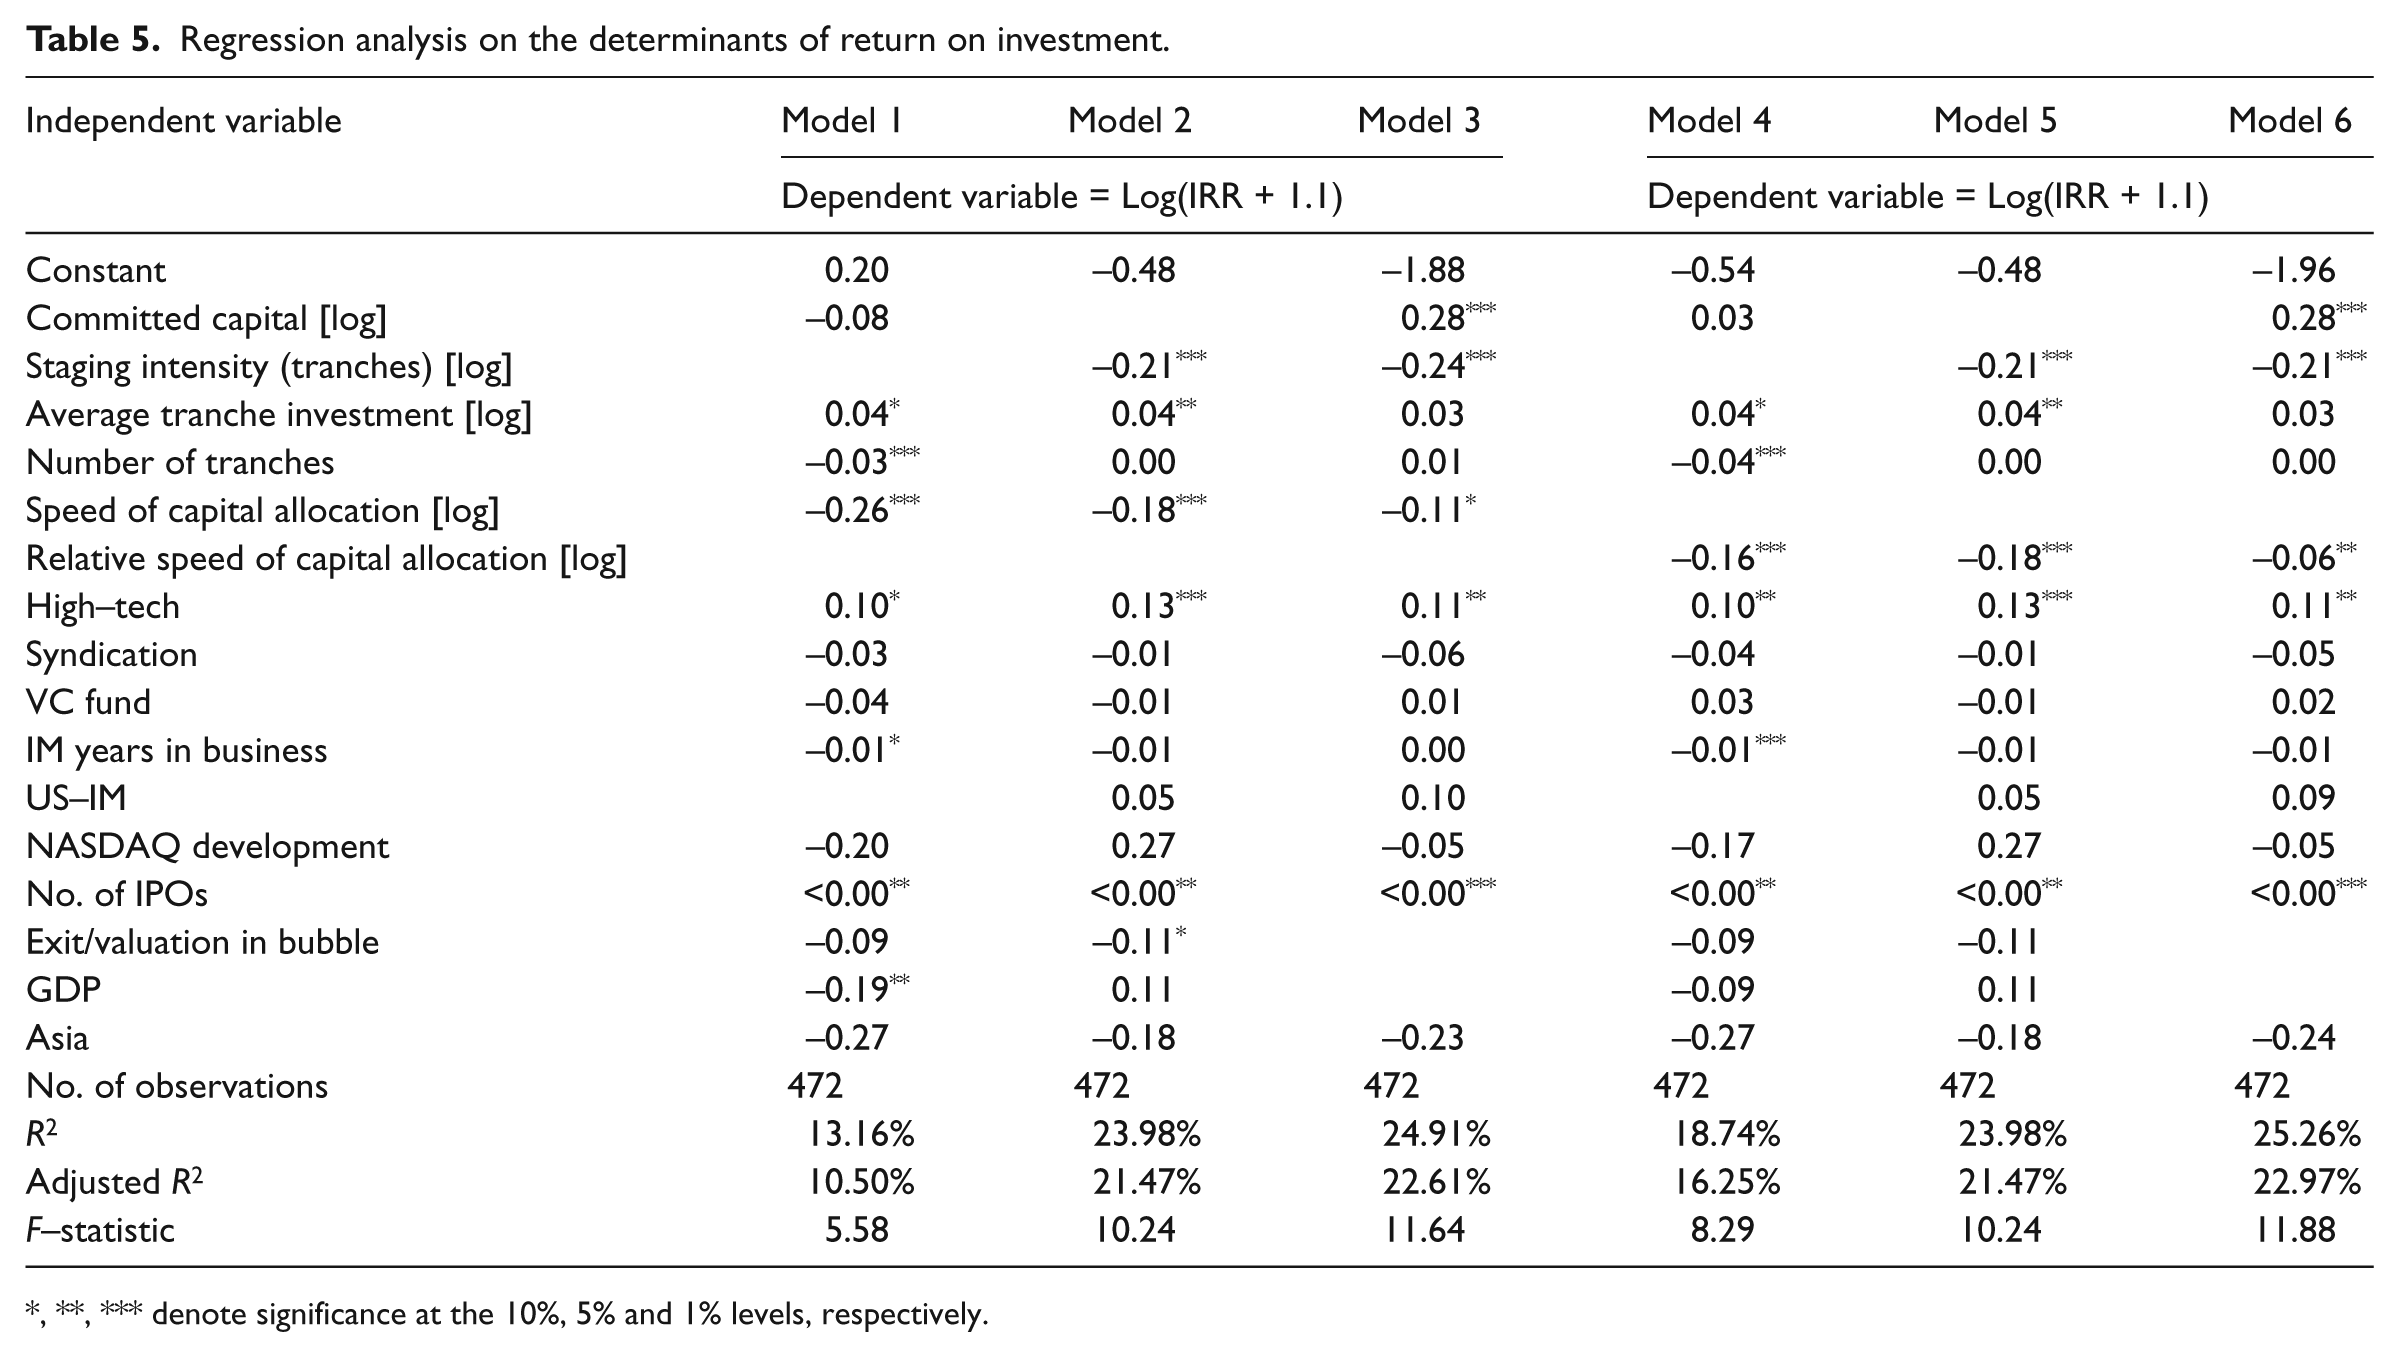
*, **, *** denote significance at the 10%, 5% and 1% levels, respectively.
The negative association between speed of capital allocation and investment returns could also be interpreted as follows. If, under higher investment pressure, a fund allocates disproportionately high amounts of capital (with corresponding commitments of time and effort) during a certain fraction of the fund’s investment period, there may be a shortage of available resources for the portfolio companies during this period (assuming an expected ROI value equal to other opportunities during the fund’s lifetime). This may result in poorer quality decision-making, monitoring and eventually, poorer overall ROI for the investments made during this ‘high-pressure’ investment period.
Conclusion
Suggestions for further research
This study finds strong evidence that a fund’s speed of capital allocation is related to fund inflows (investment pressure), while controlling for several other factors such as company age and GDP. Apparently, this set of control variables is not exclusive. An auspicious possibility for future extension of this study is to analyse the cultural differences in investment behaviour, as shown in Johan and Najar (2011). Future research could investigate this highly interesting angle from a VC and PE funds management team perspective (also management team composition), and for portfolio companies. This study included an Asia dummy variable (see Knight, 1994) as a simple instrument to control for latter effect and GDP, which can be done more precisely with larger dataset (as in Cumming et al., 2010). Another area worth considering for future extensions of the approach set out in this study would be an inclusion of law and economic differences across countries, which are likely to have an impact on investment behaviour (see La Porta et al., 1997, 1998). Furthermore, as more data become available, the rather young but fast-growing PE and VC market in China is a perfectly suitable setting to extend the research questions presented here, and to carve out differences in economic regions with substantial divergent growth rates. A further avenue for future research would be the interactions among company-level information (which also can affect capital flows), such as financing needs, risk and our finding that PE and VC managers’ investment behaviour is driven also by investment pressure. Moreover, investigating how fund characteristics (as shown in Cumming et al., 2005a), as well as investment pressure can affect capital deployment to investees is a promising topic. Finally, a further stimulating extension is to differentiate the type of investments. Arguably, the dynamics for socially responsible investments, as discussed in Cumming and Johan (2007), could differ from other investments.
Limitations of the study
One limitation of this study’s dataset is that it ends in 2003. However, the time span includes ‘hot’ venture capital years within the technology bubble, as well as the ‘cold’ years after the bubble burst. Furthermore, a dummy variable ‘Exit/Valuation in Bubble’ was included, indicating whether a portfolio company was exited between September 1998 and March 2000. Future research could cover an even broader reach in terms of the investment behaviour over different investment cycles, countries and crises.
Final remarks
The results of this study strongly support the view that higher inflows of capital into PE and VC funds are associated with increases in staging intensity, amount per financing round and tranche, speed of capital allocation to portfolio companies and lower returns. The study finds that these changes in investment behaviour are not related to future prospects. Fund managers faced with increased fund inflows tend to adjust their investment behaviour in order to deploy a larger amount of capital into portfolio companies within a shorter period of time. In other words, a fund’s pace of capital allocation is not determined only by exogenous investment opportunities, systematic risk and the portfolio firm’s financing needs (increase in expected future cash flows) for future development, but also by investment pressure. Furthermore, the study found evidence that in developing economies, where PE and VC markets are not yet matured, an increase in fund inflows has a much stronger effects on investment pressure. For example, in countries such as China, the fast-growing demand side, from home country and overseas, can easily create a situation in which large investments are aimed at a limited number of sound investment opportunities. We believe that examining the mechanisms that drive the ‘pressure chain’ of PE and VC financing could help to explain the differences in investment performance during ‘hot’ and ‘cold’ fundraising periods. One of this study’s main contributions is measuring the speed of capital allocation for specific funds into particular portfolio companies; previous papers were prevented from measuring this variable due to insufficient data. During ‘hot’ times, this study found that PE and VC fund managers participate on the upside of asset price bubbles by speeding up capital allocation, intensifying staging behaviour and capitalising on the larger amounts of capital available for investment. However, during ‘cold’ times or downturns, managers may suffer from minimal exposure, as they slow down capital allocation and put relatively less capital at risk. We can interpret this finding to mean that fund managers are simply carrying out their fiduciary duty to maximise returns and minimise risk for investors. However, the present study’s results imply that in fact, a higher speed of capital allocation may not be optimal for investors, given its negative association with investment returns.
For new deals, the data support the view that fund managers could accept higher acquisition costs due to increased valuations: a factor relevant for speed of capital allocation, but not for staging behaviour. For existing portfolio companies, fund managers may increase staging behaviour and tolerate a higher burn rate of capital in specific companies by, for example, increasing marketing costs to achieve higher performance. In some cases, these efforts may be successful and lead to higher ROI; in others, the rush to spend additional capital may imply lower value-added per unit of capital. Because the capital requirements of portfolio companies are driven primarily by underlying factors that are highly specific to their particular stage of development (Sahlman, 1990), high levels of capital allocation speed may imply surplus capital that cannot be put to effective use by the recipient firm, resulting in lower ROI.
The findings remain robust when controlling for the risk factors of the investment project, and they contribute to the ongoing debate over financial market rationality and investor behaviour in the private equity and venture capital markets. Investigating how fund manager behaviour can impact investment returns through the mechanisms of capital allocation speed and staging intensity highlights the importance of determining how to create appropriate incentive structures to align fund managers’ behaviour with their primary role as financial intermediaries. Given existing incentive structures, we believe that fund managers may continue to exacerbate the volatile nature of PE and VC market returns during boom-and-bust periods. However, with the dataset used in this study, we were unable to analyse the recent boom-and-bust period around the Lehman Brothers collapse.
The implications for practitioners include consideration of whether to include cash flow rights in contractual designs between the fund’s investors (limited partners) and the fund itself (general partner). This may mitigate principal–agent problems regarding the speed of capital allocation. One solution could be to limit the dynamic of capital allocations within one year to, for example, a maximum of 30 percent of fund total capital, with a clause allowing for the extension of this limit, if desirable, with investor consent. Such a clause increases in importance for regions, such as Asia, with astonishing growth rates in investment volume.
Footnotes
Appendix A. Description of variables
| Variable | Description | |
|---|---|---|
| Performance measure | IRR [Log(IRR + 1.1)] | The exact IRR based on the investment cash flows from the fund to the portfolio company and return flow from the company to the fund. For the regression analyses we take logs of (IRR + 1.1) to conform to Gaussian assumptions necessary for classical linear regressions and to cover all positive and negative IRR results as well as write-offs |
| Speed of capital allocation measures | Fund’s speed of capital allocation (SCA) [log] | The fund’s speed of capital allocation during the investment period of Portfolio Company i [SCA] is calculated as the fund’s capital outflows to all portfolio companies during the investment period of portfolio company i (in real US$, 2003)* [FCOall-pci] divided by the fund’s accumulated capital outflows during the total fund’s lifetime (in real 2003 US Dollars)* [FCOlifetime] divided by the holding period of Portfolio Company i in years [HPpci]. (For the regression analysis we take logs.) |
| Fund’s relative speed of capital allocation (RSCA) [log] | The fund’s relative speed of capital allocation during the investment period of portfolio company i (RSCA) is calculated as the fund’s capital outflows to all portfolio companies during the investment period of portfolio company i (in real US$, 2003)* [FCOall-pci] divided by the holding period of portfolio company i in years [HPpci] divided by the fund’s accumulated capital outflows during the total fund’s lifetime (in real 2003 US Dollars)* [FCOlifetime] divided by the fund’s lifetime in years [FLT]. (For the regression analysis we take logs.) | |
| Demand measure | Committed capital [log] | Committed capital on the overall market at date of investment (in real US$m, 2003)* (For the regression analysis we take logs.) |
| Staging – related variables | Staging intensity (tranches) [log] | The staging intensity (tranches) is the ratio: number of tranches the fund invested in Portfolio Company i divided by the holding period of Portfolio Company i in years. (For the regression analysis we take logs.) Tranches are cash outflows at CEPRES. Each financing round can include one or more tranches |
| Staging intensity (rounds) [log] | The staging intensity (rounds) is the ratio: number of financing rounds the fund invested in Portfolio Company i divided by the holding period of Portfolio Company i in years. (For the regression analysis we take logs). Financing rounds are reported at Venture Economics | |
| Number of tranches | Number of tranches the fund invested in Portfolio Company i during its holding period | |
| Average tranche investment [log] | The average tranche investment is the total investment amount (in real US$, 2003)* the fund invested into Portfolio Company i divided by the number of tranches of the fund to Portfolio Company i. (For the regression analysis we take logs.) Tranches are as outflows at CEPRES. Each financing round can include one or more tranches. | |
| Average round investment [log] | The average round investment is the total investment amount (in real US$, 2003)* the fund invested into Portfolio Company i divided by the number of financing rounds of the fund to the Portfolio Company i. (For the regression analysis we take logs.) | |
| Control variables | ||
| Portfolio company | High-tech | A dummy variable equal to 1 for companies of the high-tech sector (classified as High Tech when belonging to one of the following CEPRES sector categories: healthcare/lifescience, IT, high-tech, semiconductor, software, internet, telecommunications). |
| Later stage | A dummy variable equal to 1 for later stage companies (classified as later stage (early stage = 0) when belonging to one of the following CEPRES Stage categories: later, MBO/MBI, LBO, public to private, mezzanine, turnaround, recapitalisation). (Early stage categories: seed, start-up, early, expansion.) | |
| Age of company | Age of Portfolio Company i (in years since its founding date) at date of initial investment by the fund | |
| Syndication | Total number of fund investment management firms investing in Portfolio Company i during its lifetime | |
| Asia | A dummy variable equal to 1 if the company is located in Asia | |
| Fund | VC fund | A dummy variable equal to 1 for funds specialised on venture capital |
| Time since closing | Maturity of the fund (in years since its closing date, which marks the end of its fundraising) at date of initial investment of Portfolio Company i | |
| Fraction of companies since closing | The number of portfolio companies that the fund has invested in since its closing date to date of initial investment of Portfolio Company i, divided by the total number of portfolio companies that the fund invested in during the lifetime of the fund. | |
| Fund investment management firm | IM years in business | No. of years the fund investment management firm is in business at time of the initial investment of the fund in Portfolio Company i |
| US-IM | A dummy variable equal to 1 for the fund investment management firm with the main office in the USA | |
| No. of professionals | Number of investment professionals employed by the fund investment management firm | |
| Exit/valuation in bubble | A dummy variable equal to 1, if Portfolio Company i was exited between September 1998 and March 2000, 0 otherwise (if the investments are not fully realised, we consider date of last valuation as exit date) | |
| No. of IPOs | Number of (PE-backed) IPOs one year before date of exit/valuation of Portfolio Company i | |
| Market | Risk-free rate | The short-term interest rate at date of the initial investment of the fund into Portfolio Company i (for US investments: Federal Reserve Bank 1 month treasury bills; for EU investments: the BBA Libor rate) |
| NASDAQ development | NASDAQ development is the variation of the NASDAQ Composite Index between the initial investment date of the fund into Portfolio Company i, versus three-quarters before the initial investment | |
| GDP | The GDP is the average variation of real US gross domestic product per year over the holding period of the fund’s investment into Portfolio Company i |

The inflation adjustment is based on Consumer Price Index (CPI) data for all urban households and all items. Data are derived from the records of the US Department of Labor (www.bls.gov).
Appendix B
Acknowledgements
We are grateful to two anonymous referees for many helpful comments, the special issue editors and Susan Marlow for very useful suggestions. The authors gratefully acknowledge valuable feedback from participants at the 6th Global Conference on Business & Economics, Harvard University, 6th Annual Trans-Atlantic Doctoral Conference, London Business School, ISBJ Special Issue Conference on the Chinese Capital Market 2012 and Brownbag Seminar, Goethe University. Helpful comments were provided by Mark Wahrenburg, Zhenyu Wu, Isabell Welpe, Philipp Krohmer and Victor Calanog. Any errors are the authors’ own.
Funding
This research received no specific grant from any funding agency in the public, commercial or not-for-profit sectors.