
Abstract
This study analyses the relationship between the e-government transformation success in Turkey and the 18 success factors commonly assumed to be the causes of transformation success in the literature. The study uses a quantitative methodology previously developed by the same researchers, which considers transformation success as the dependent variable and the 18 success factors as the independent variables in a relational model and applies correlation, regression and factor analyses to the collected data to search for the probable relationships between these variables. The results of these analyses show that there are significant and positive correlations between the success factors and transformation success, but none of these correlations could be attributed to a cause and effect relationship, as assumed in similar studies. The results also show that classifying similar success factors under common headings to analyze transformation success is not statistically meaningful.
There are significant and positive correlations between success factors and e-government transformation success, but the success factors are not the causes of transformation success.
Introduction
The main idea behind the concept of electronic government (e-government) is to facilitate and improve government services by means of information and communication technologies. As a result, realizing efficient transformation from traditional government to e-government is an important goal for all countries trying to integrate an e-government approach in their administrative systems. Although the main idea seems so simple, its practical implementation is very complex, since the concept of e-government is connected to many different disciplines – technical, social, organizational, political, legal and economic.
This study analyzes the probable success factors that are assumed to be effective in the success of e-government transformation in Turkey. It is a multi-dimensional study considering the connections of the subject with the different disciplines stated above and uses a generic methodology previously developed by the same researchers to collect quantitative data for the intended analyses. Apart from similar studies in the literature, it forms its research sample not only from external stakeholders (people using e-government services) but also from internal stakeholders (people providing e-government services).
Problem statement
The complexity of e-government transformation creates many problems for the implementers, but at the same time makes it attractive to many researchers. As a result, there are a lot of studies dealing with the success of e-government transformation in the literature. Some of these studies focus on trying to find specific solutions to specific problems, while others focus on analyzing the subject from a broader perspective. Although the background, the rationale and the focus of each study are different, all have two significant common characteristics.
The first characteristic is the tendency to do qualitative analyses when the scope is broader and to do quantitative analyses when it is narrower.
The second characteristic is the tendency to collect data only from external stakeholders (people using e-government services), excluding another important group, the internal stakeholders (people providing e-government services).
Both of these characteristics are expected, since it is very hard to collect comparable quantitative data for many different dimensions of the subject concurrently, and it is harder to collect data of internal stakeholders when compared to that of the external ones. However the existence of these two characteristics creates a gap in the literature, limiting the ability to see the big picture about the concept.
This study aims to fill this gap by considering all dimensions of the subject in a quantitative way and by integrating the opinions of internal stakeholders on the analyses as well as those of external ones.
Literature review
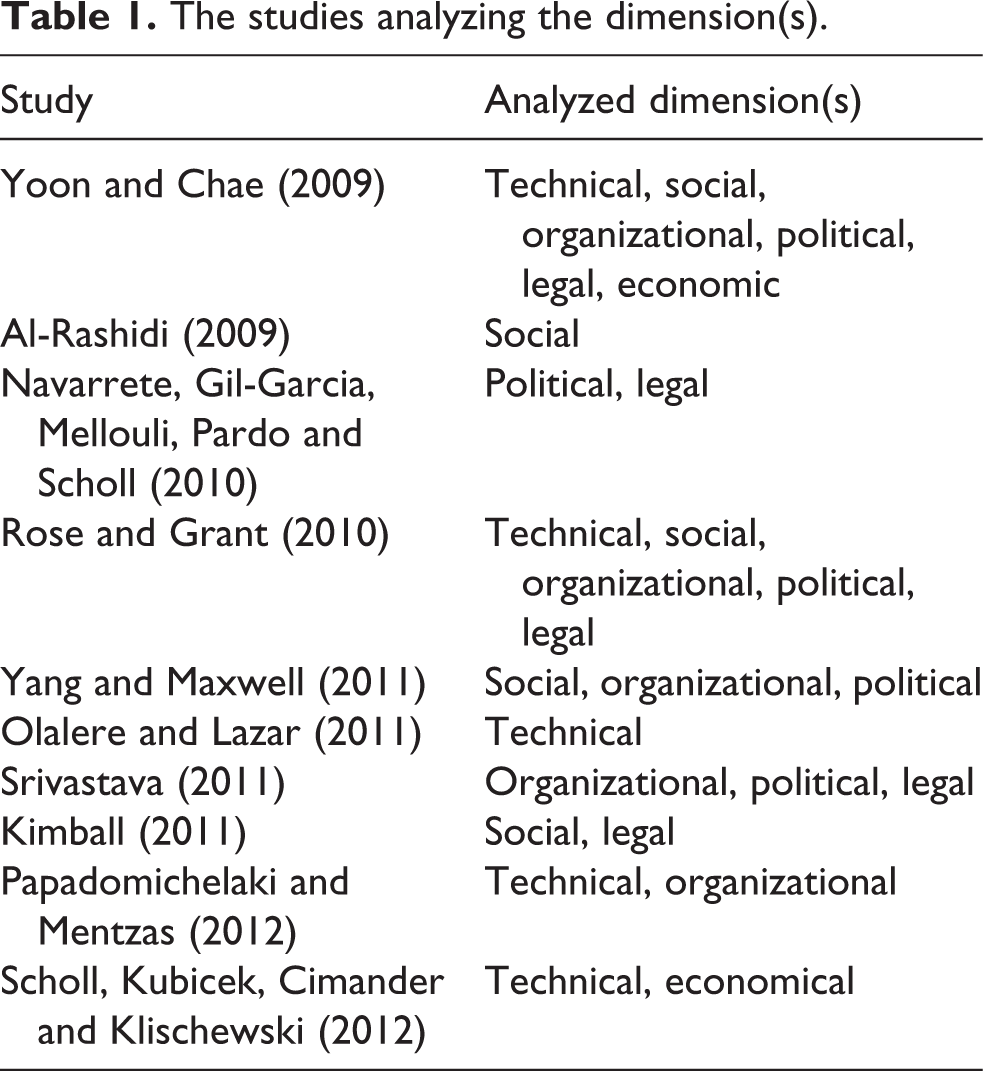
During our literature review, we analyzed 40 studies dealing with success of e-government transformation and classified them under four major categories.
The studies analyzing the dimension(s).
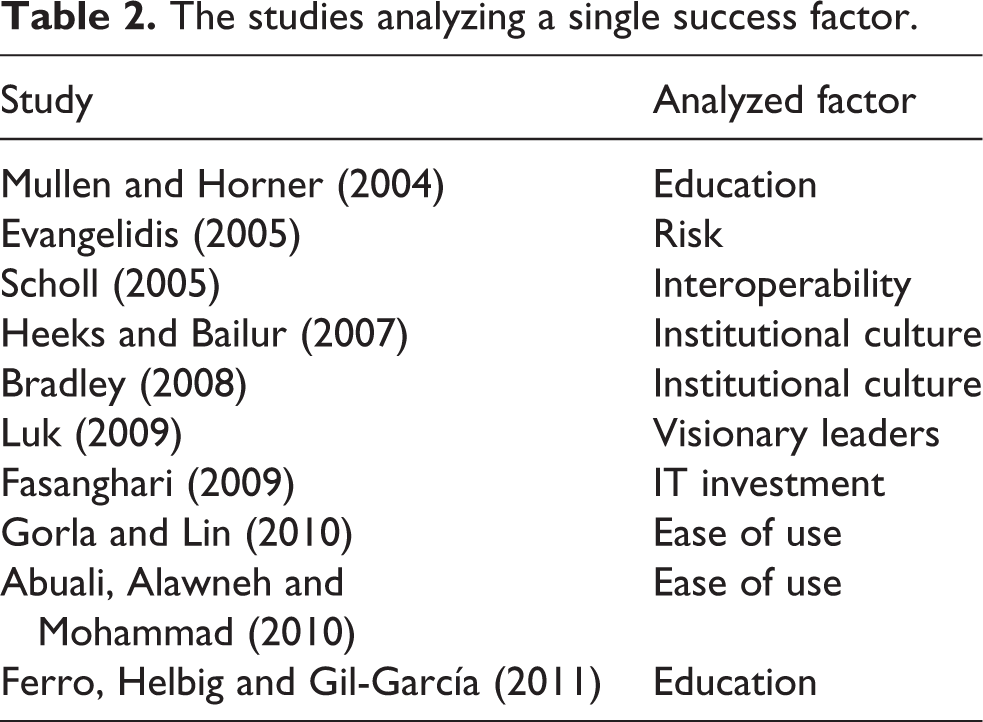
The studies analyzing a single success factor.
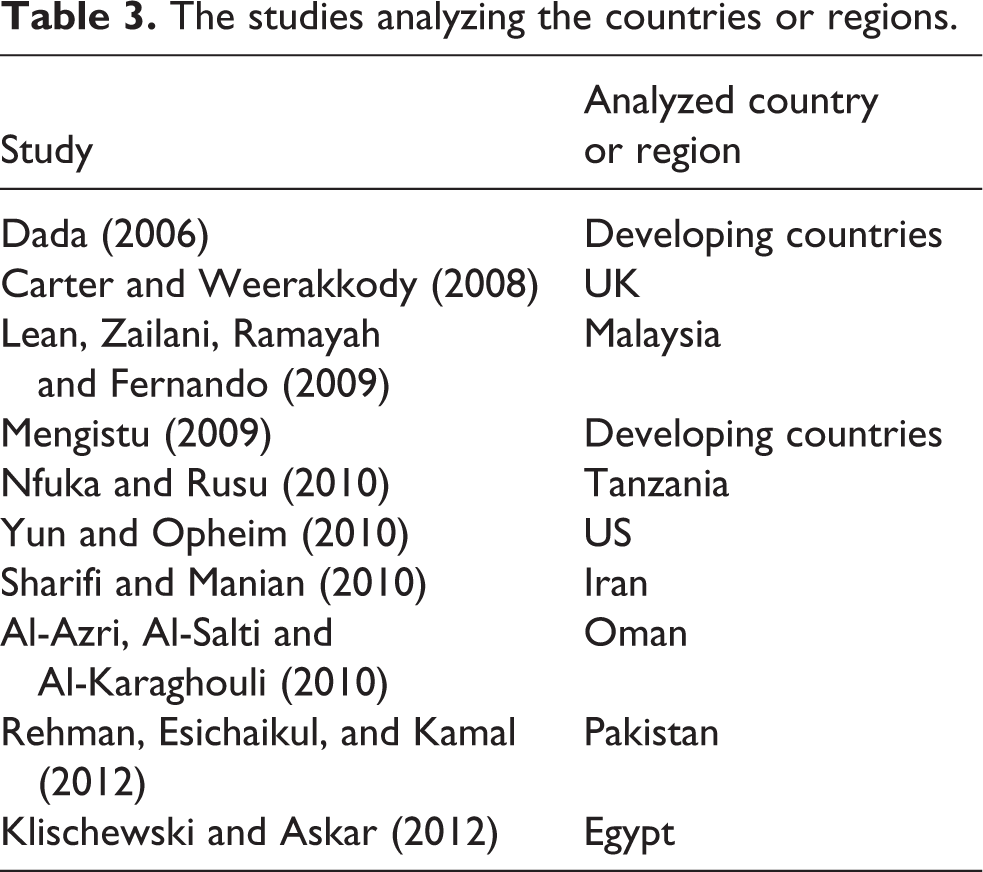
The studies analyzing the countries or regions.
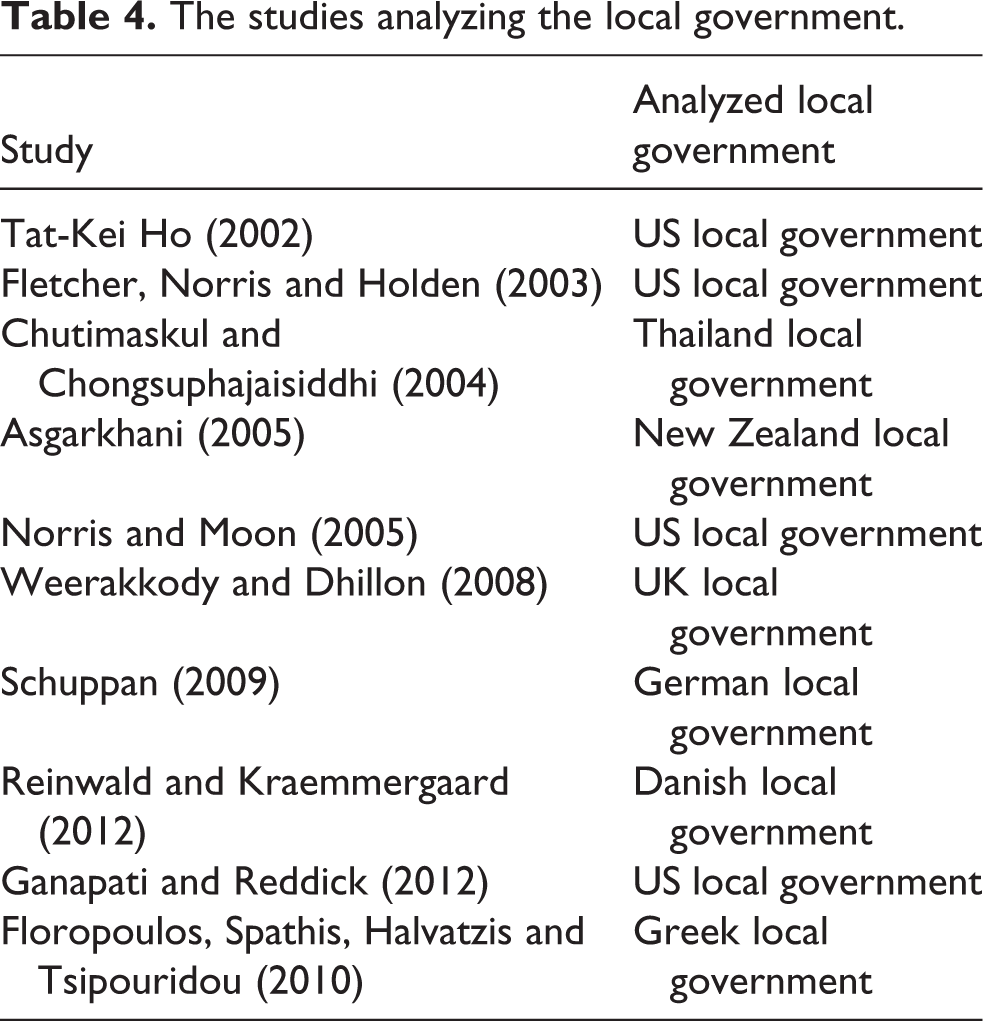
The studies analyzing the local government.
All the studies classified under these four categories assume the existence of a cause-and-effect relationship between success factors and transformation success, either explicitly or in a hidden way, but none of them analyses whether this cause and effect relationship exists in reality. In addition, none of them is multi-dimensional, considering the opinions of both stakeholder groups concurrently. The main reason for these problems is the common tendencies explained in the previous section.
The previous study in brief
The present study uses the survey and the generic methodology previously developed by the same authors, so presenting a brief summary of the previous study is a necessity to form a solid base for the upcoming discussions.
The final dependent variable subcomponents.
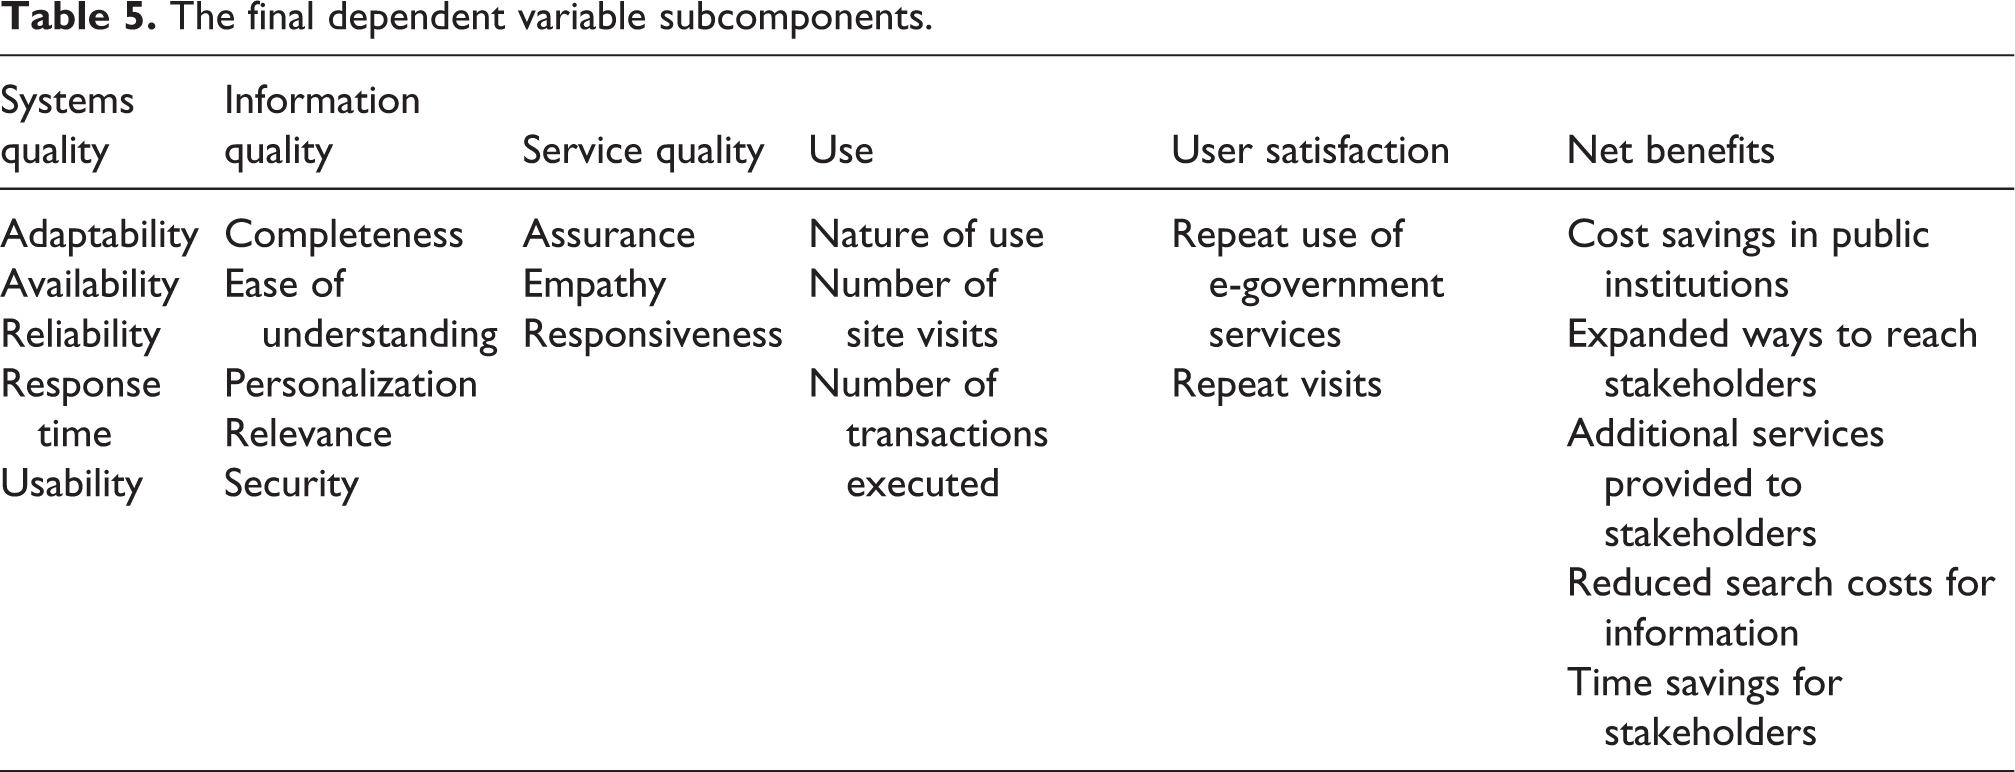
The study presented a weighted average method to calculate a single success score from the subcomponents above. According to this method, a 5-point Likert scale was used to collect the scores of the categories, classifying the subcomponents concurrently with the scores of the subcomponents from the same respondents, and the scores of the categories, were used to calculate the proportions in the weighted average calculation.
The final independent variables.
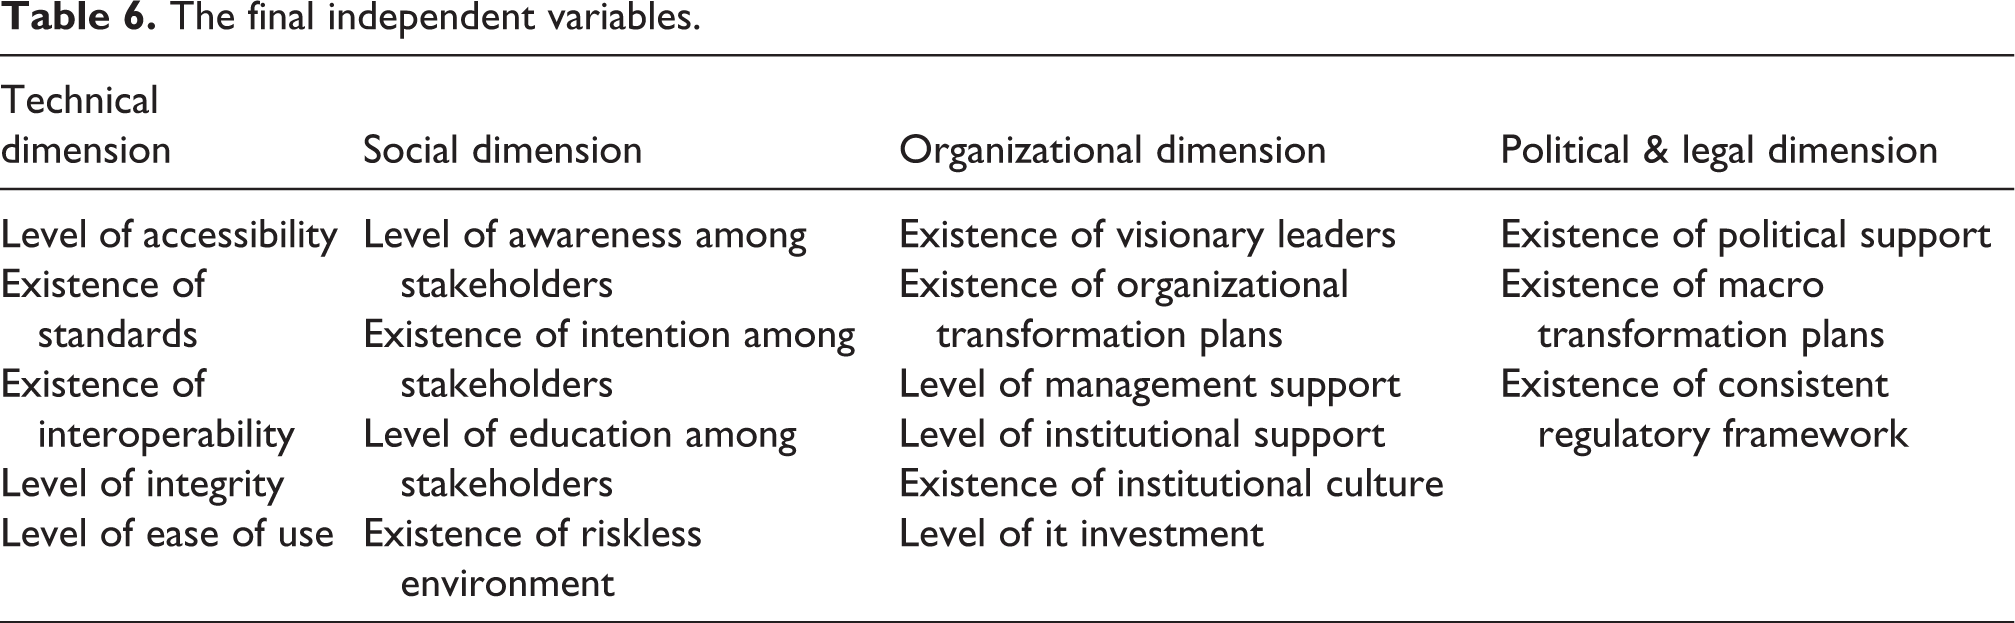
The study used the same 5-point Likert scale to collect the scores of independent variables from each respondent but did not present a calculation method for the scores of independent variables, since the collected scores were directly reflecting the actual opinions of the stakeholders, rather than acting as a subcomponent to form a single variable.
The variables stated in the tables above are the variables of the final survey, which was designed to collect similar quantitative data, not only from the external stakeholders, but also from the internal ones. Before presenting this final survey, the study followed a step-by-step approach including Delphi analyses, content validity tests and construct validity tests, to clarify the variables used in the final survey. For the construct validity tests, it presented a pilot study done in four central and four local Turkish public institutions which analyzed the responses of 43 internal and 41 external stakeholders. It calculated the size of the actual research sample as at least 384 for each stakeholder group to calculate the least sample size for this pilot study. In addition, the study applied a coding scheme for the names of the public institutions to provide anonymity while collecting the data in the pilot study. Figure 1 shows the scopes and the steps of the previous and the present studies to clarify the connection between them. We refer interested readers to Iskender and Özkan (2012) for other details of the previous study.
The previous and the present study.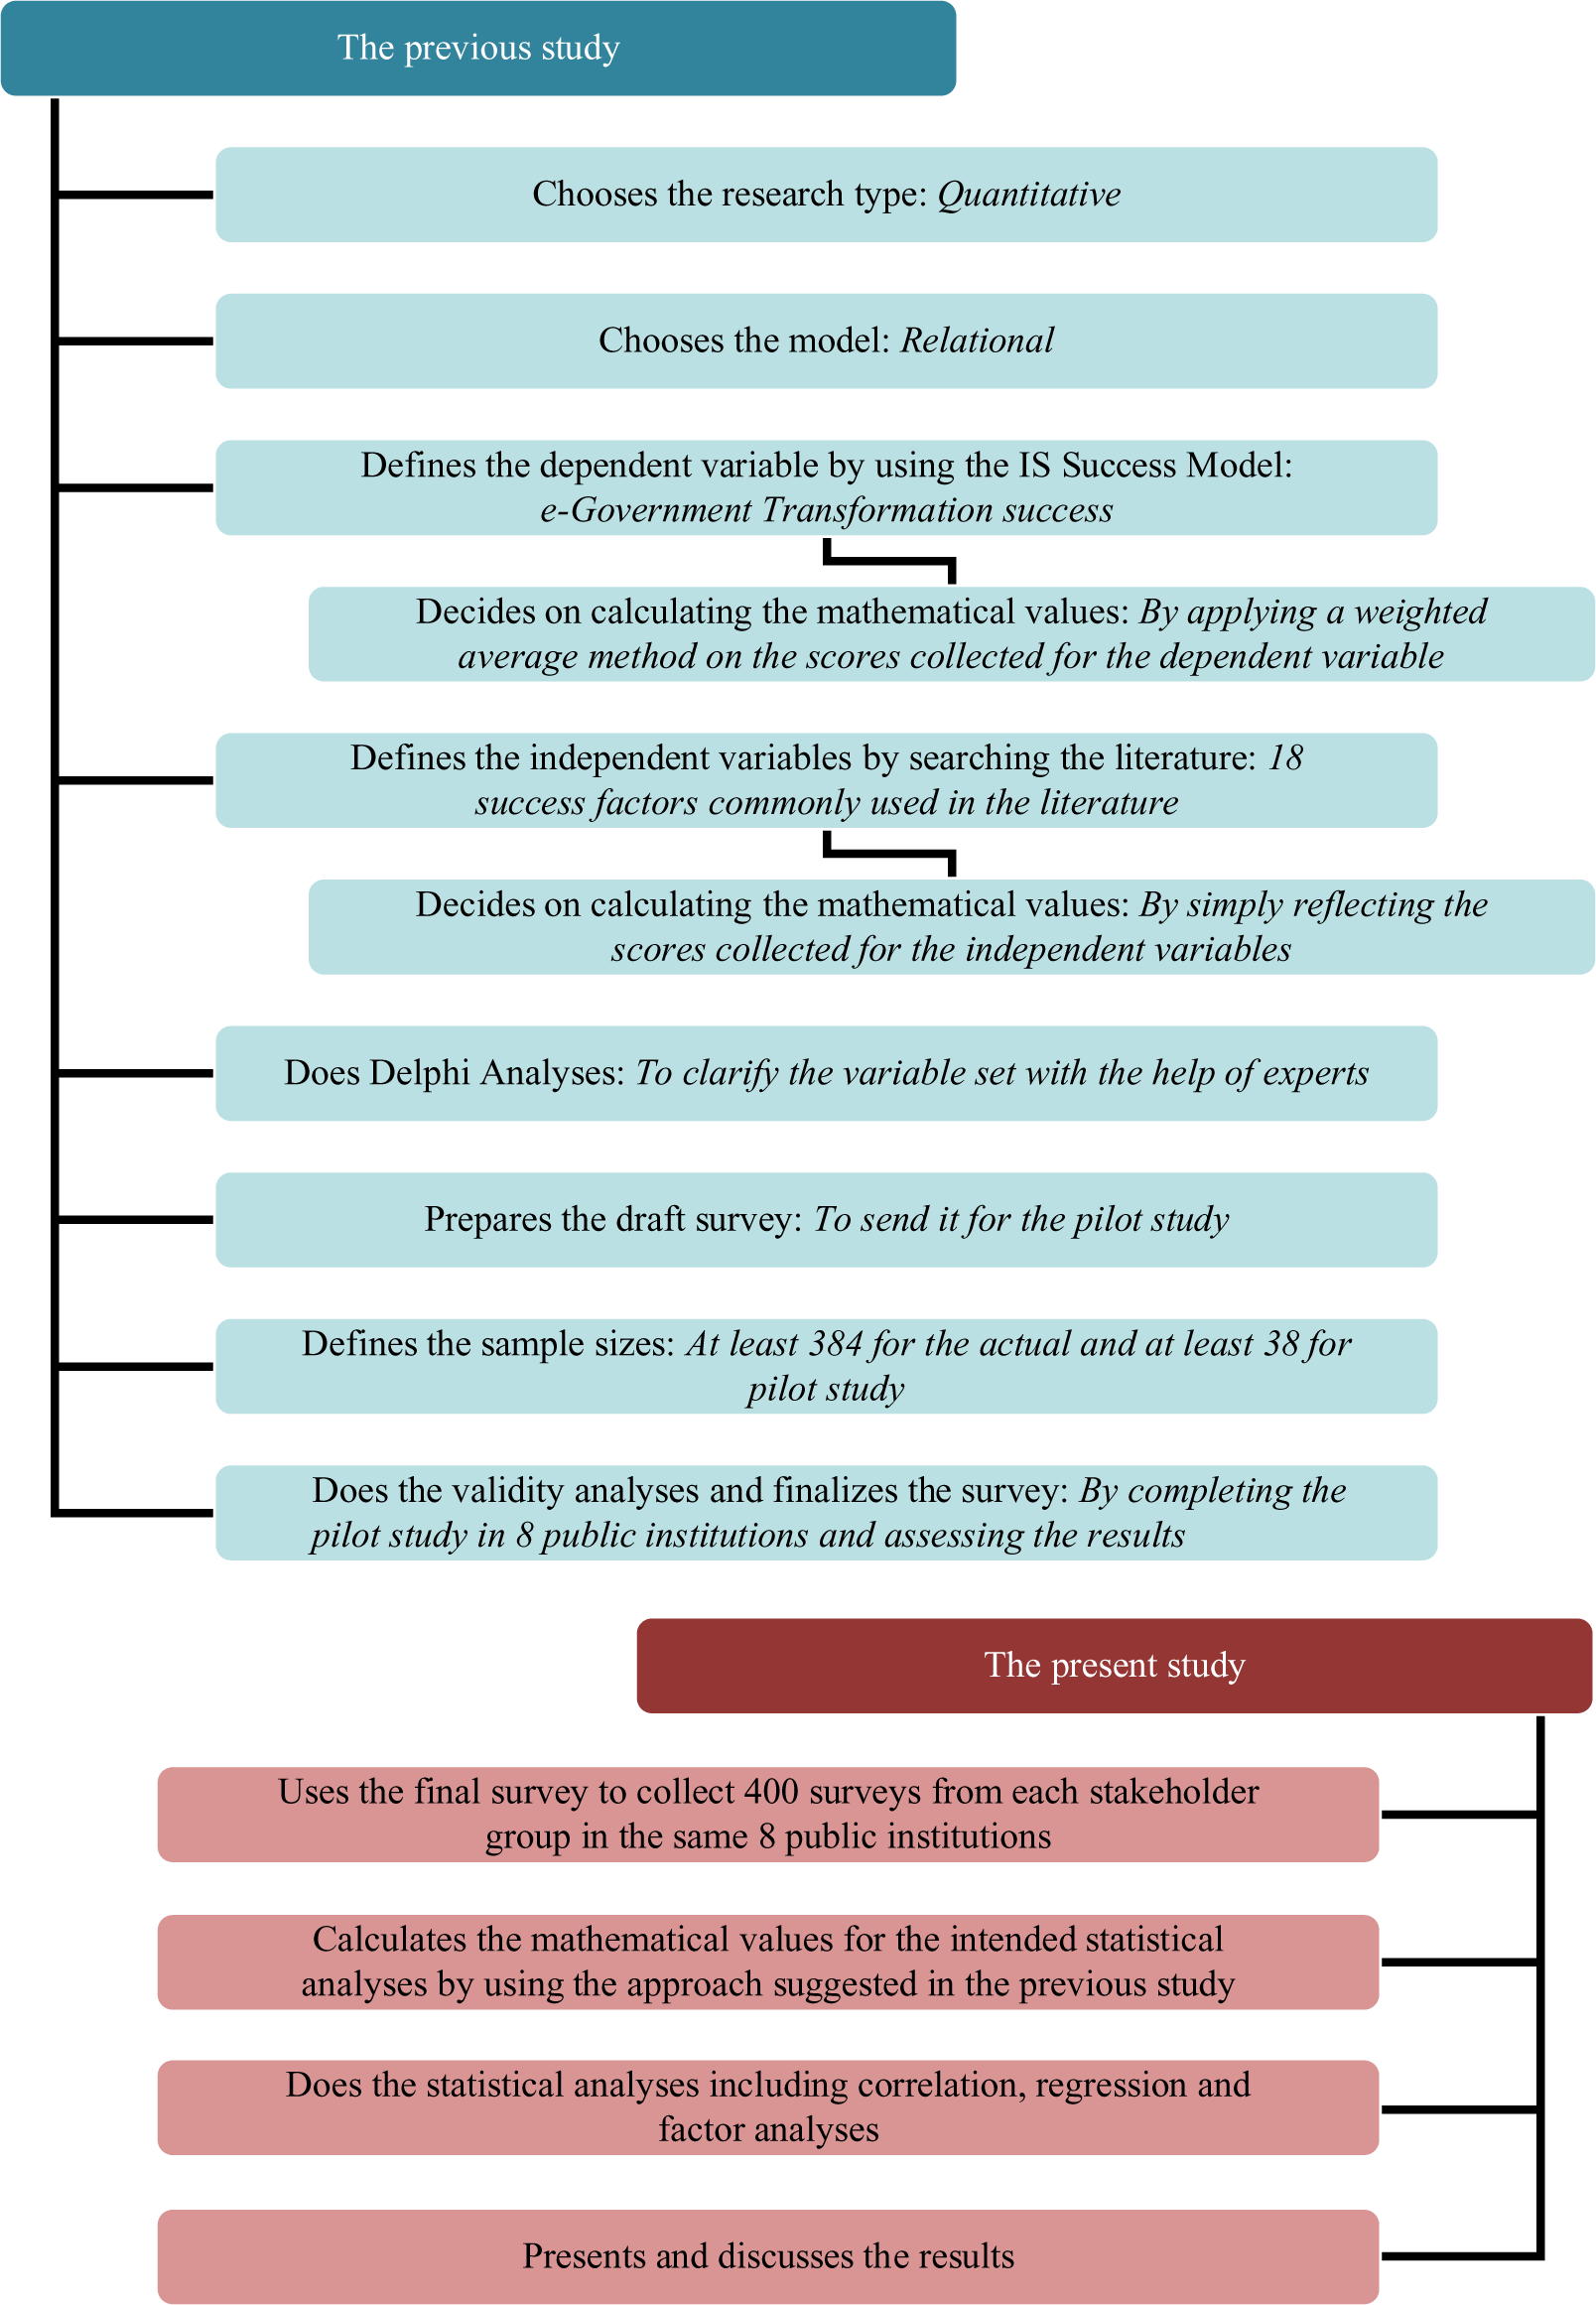
The present study
This study starts from the end of the previous study. As the first step, it uses the survey and the methodology developed in the previous study to collect data from the external and the internal stakeholders of the eight public institutions in which the pilot study of the previous one was done and as the second step, it does statistical analyses on the collected data to assess the probable relationships between the e-government transformation success and the probable success factors effective on it.
Data collection and preparation
With a survey which was applicable to both stakeholder groups concurrently, our first step in this study was to collect the data needed for our analyses. We sent the survey to the contact points in the eight public institutions in which the pilot study was done, and we requested at least 60 surveys to be completed by each stakeholder group in each institution. The main idea behind selecting at least 60 surveys was to provide room for erroneous and incomplete responses, as we aimed to collect at least 50 full and correct surveys to reach the number of at least 400 for each stakeholder group (400 was bigger than the least needed sample size and it was a manageable number).
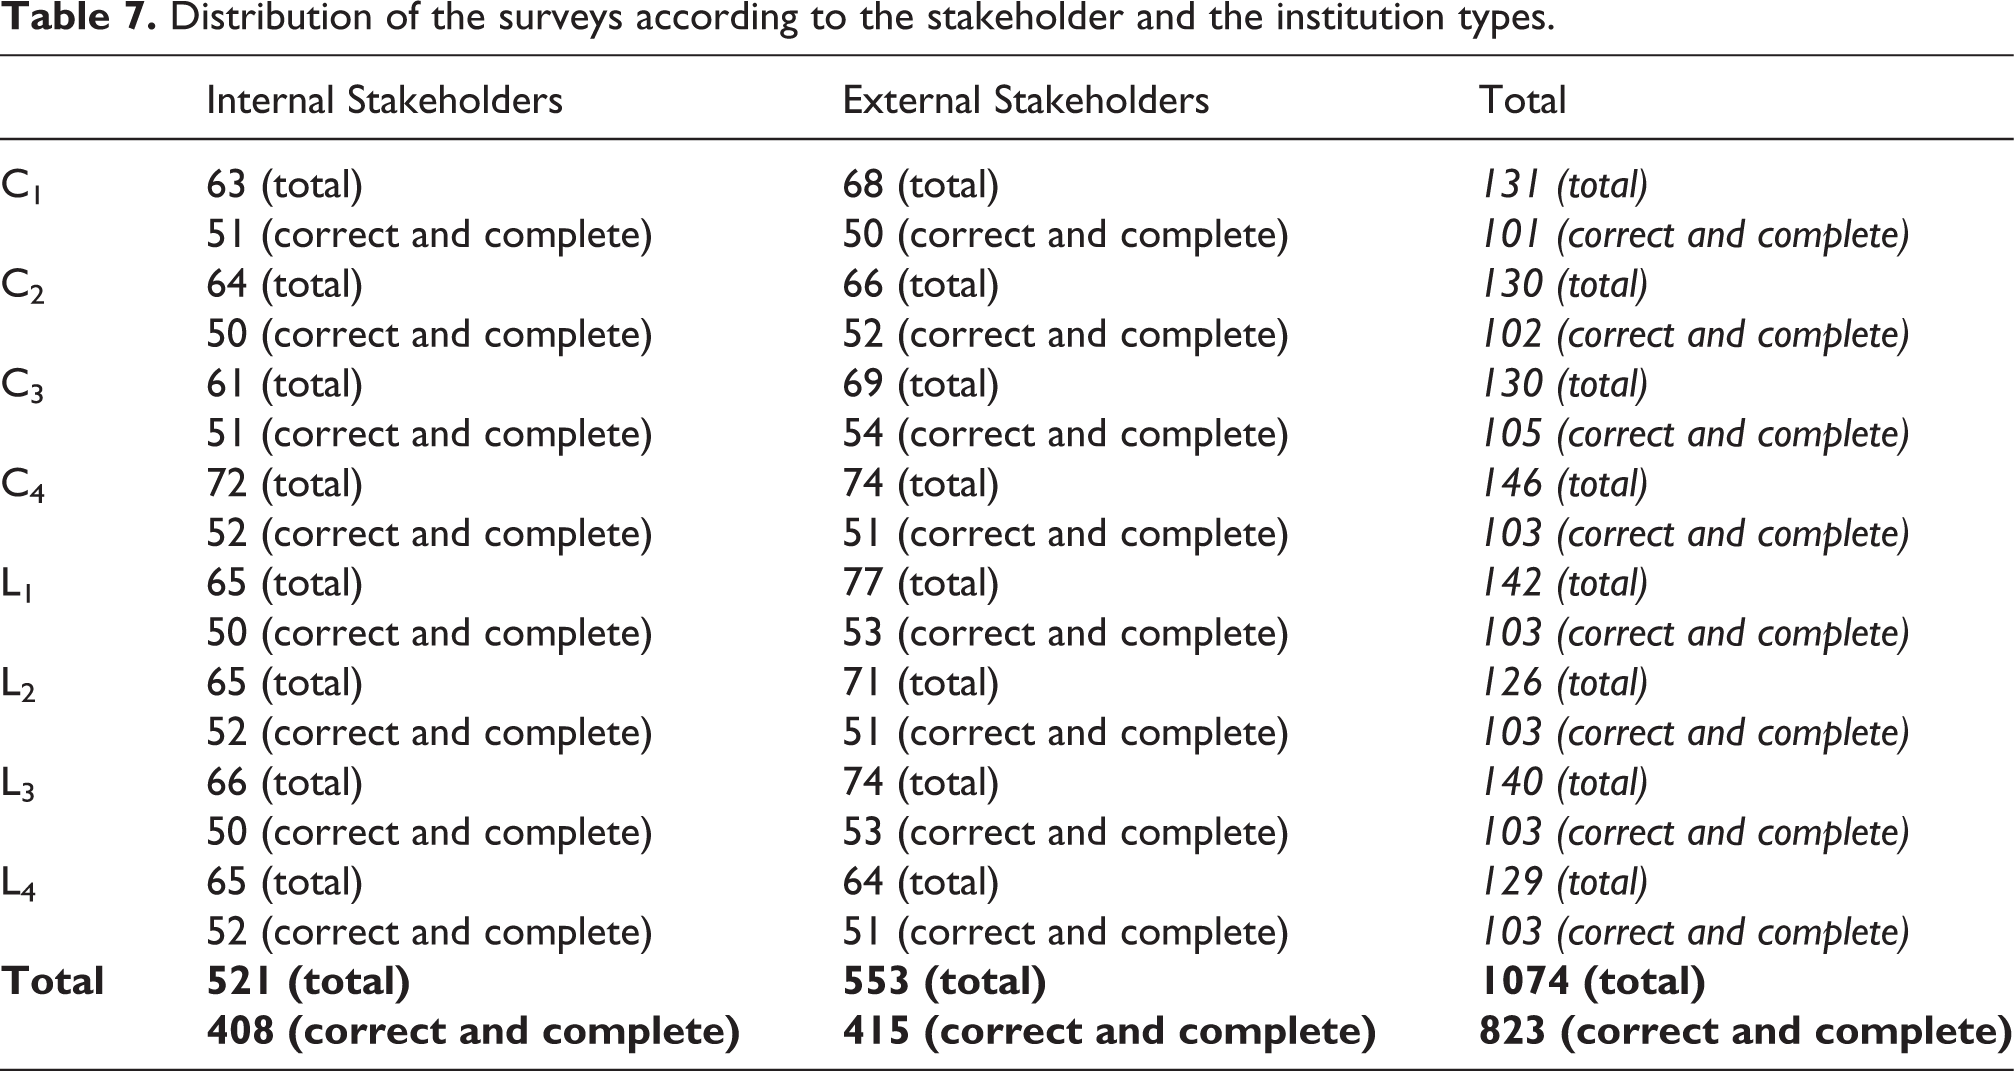
The total number of correct and complete surveys was 823 after the removal of erroneous and incomplete responses from the raw data and eliminating the unusable ones. Of these, 415 (50.4 percent) were the surveys of the external stakeholders while the remaining 408 (49.6 percent) were those of the internal ones. We also classified the surveys according to public institution types; 411 (49.9 percent) of them were the surveys of the central public institutions while the remaining 412 (50.1 percent) were those of the local ones.
Distribution of the surveys according to the stakeholder and the institution types.
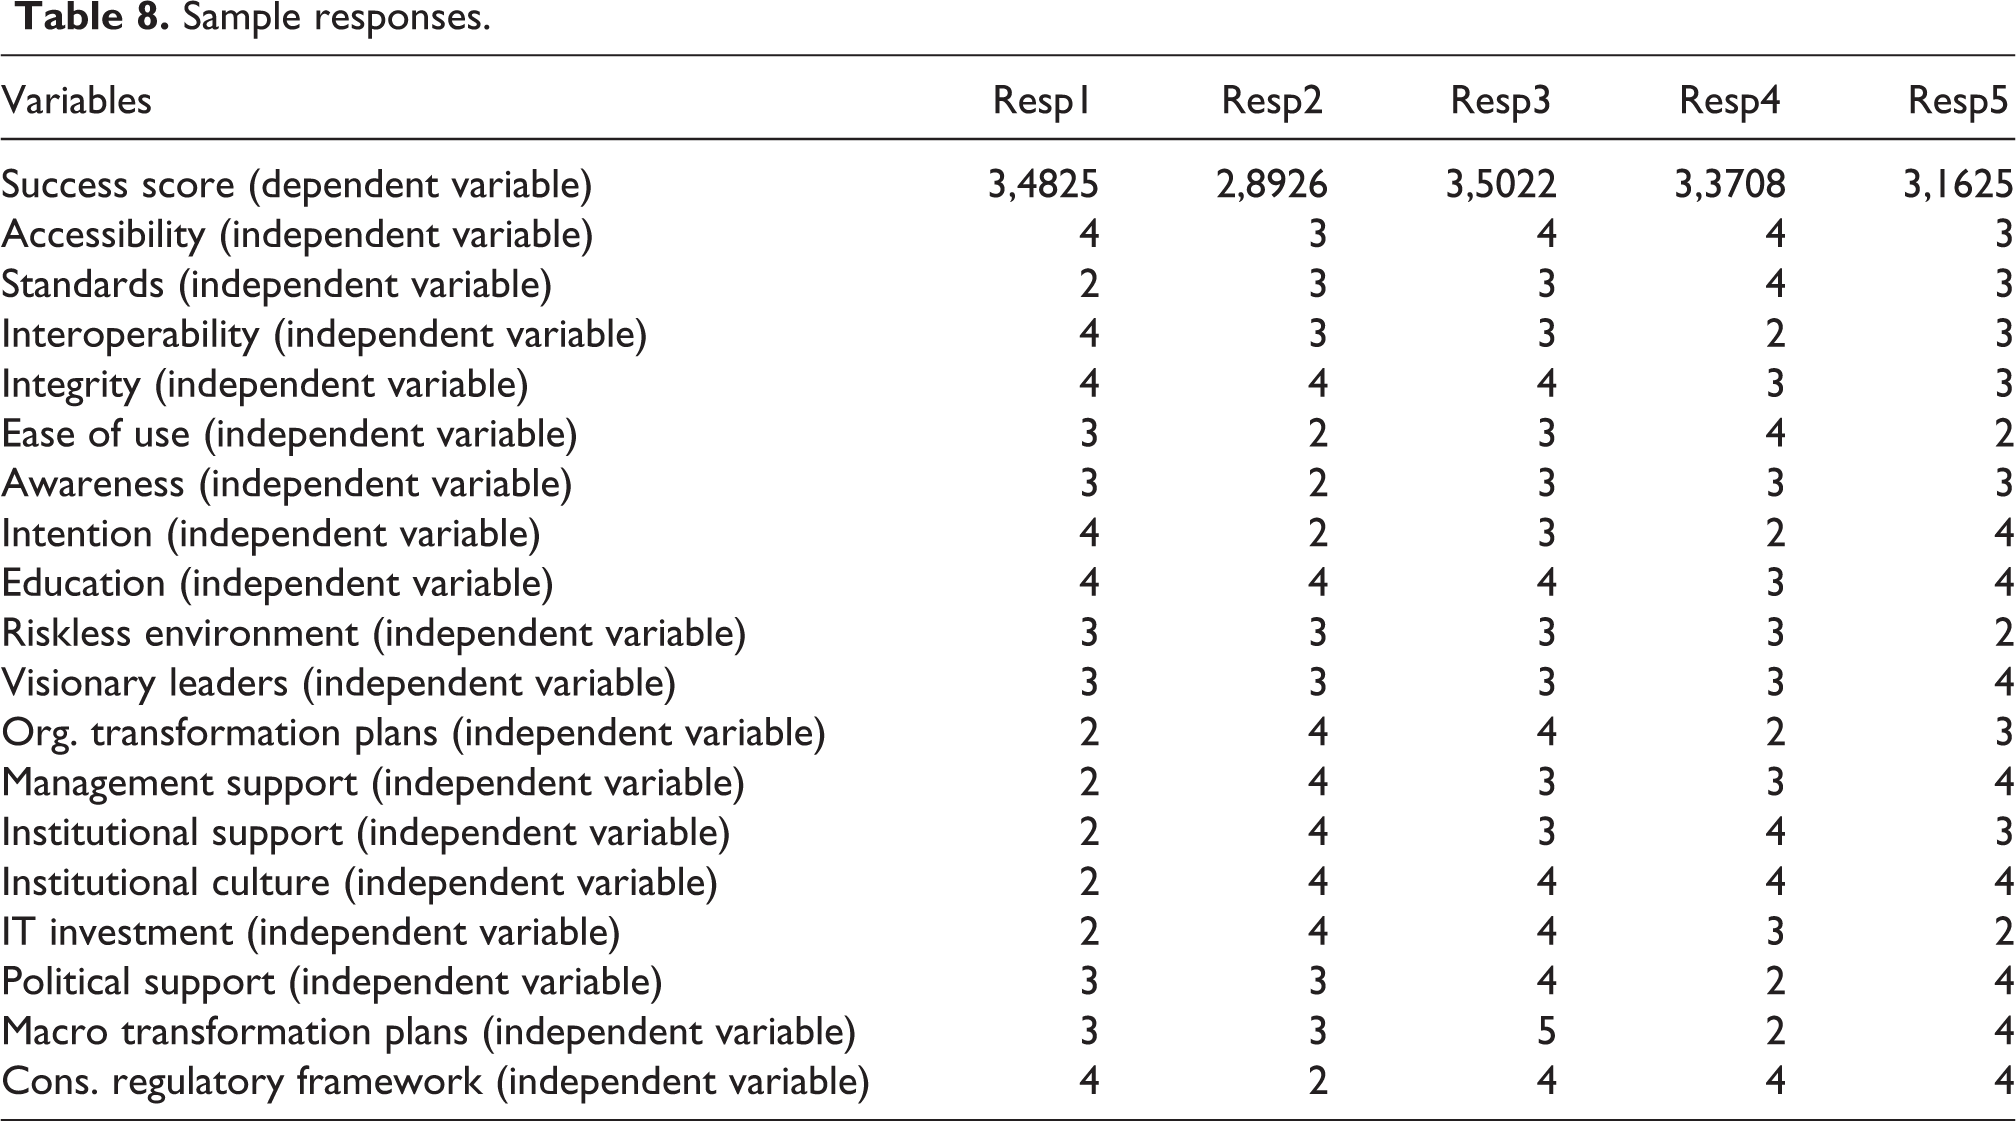
As the survey contains 18 questions for the independent variables, 23 questions for the subcomponents of the dependent variable and 6 questions for the scores of the categories classifying the subcomponents of the dependent variable, we collected 47 responses from each of these 823 surveys summing up to 38,601 responses.
We formed eight data sets by merging this data. These data sets are explained below:
Data Set 1: The responses of external stakeholders in all central public institutions. Data Set 2: The responses of internal stakeholders in all central public institutions. Data Set 3: The responses of external stakeholders in all local public institutions. Data Set 4: The responses of internal stakeholders in all local public institutions. Data Set 5: The responses of all stakeholders in central public institutions. Data Set 6: The responses of all stakeholders in local public institutions. Data Set 7: The responses of all external stakeholders. Data Set 8: The responses of all internal stakeholders.
Sample responses.
Analysis
As the main objective of this study was to analyze the relationship between the e-government transformation success in Turkey and the success factors effective on it by doing a quantitative research, we applied three different types of statistical analyses on the collected data. These were correlation, regression and factor analyses.
We preferred correlation analyses to search the existence of a statistically meaningful relationship between each success factor and the success level. After doing these analyses on each data set, we noticed that all of the independent variables were correlated to the dependent variable significantly and positively.
As there were significant and positive correlations between the dependent and the independent variables of the problem, our next step was to do regression analyses on the collected data to see whether these correlations were cause and effect relationships, as was assumed in the other studies. We were surprised when we did the regression analyses with the same data sets, because p-values were too high and some of the coefficients were too low or even negative in the regression tables. When we searched for the reason for this, we discovered the concept of reciprocal suppression. Reciprocal suppression means the effect of two or more independent variables on each other, which decreases their total effect on the dependent variable. (Pandey and Elliott, 2010). According to these results, there was no cause and effect relationship between any of the independent variables and the dependent variable although there were strong positive correlations between them.
Since we experienced reciprocal suppression when we analyzed the individual effects of the independent variables on the dependent variable, we decided to do factor analyses to form statistically meaningful groups from the independent variables set and check whether there was a cause and effect relationship between any of these subgroups and the dependent variable. Factor analyses were also useful to check the validity of the dimensions identified in the literature review since we would have a chance to compare the widely used dimensions containing the similar independent variables under the common headings with the statistically meaningful subgroups formed from the independent variables set. We were surprised more when we did the factor analyses because the component number in the total variance explained table was one and the component matrix has only one column. The meaning of this was the fact that, it was impossible to create subgroups from the independent variables set.
Discussions and conclusions
Results
According to the analyses done in the previous section, this study has three results and these results are stronger than those of the studies which consider the opinions of only external stakeholders because all of them are valid not only for the external stakeholders but also for the internal ones in both central and local public institutions. The validity of the results in both stakeholder groups provides a better understanding for the researchers who are dealing with e-government transformation and forms a solid base for the future studies.
The 18 success factors gathered from similar studies in the literature are correlated to the e-government transformation success significantly and positively so most of the researchers in the field are dealing with the correct success factors to analyze the subject. Although there are significant and positive correlations between the success factors and e-government transformation success, the success factors are not the causes of the transformation success, so most researchers in the field have incorrect assumptions about the probable relationships between the transformation success and the success factors. The 18 success factors cannot be grouped under statistically meaningful subgroups and as a natural consequence classifying them under common dimensions is not a proper approach to analyze the transformation success. Most researchers in the field are increasing the number of incorrect assumptions by trying to analyze the probable relationships between transformation success and the dimensions containing similar independent variables under common headings.
Contributions
The results presented above prove the existence of positive and significant correlations between success factors and transformation success and create a starting point for future discussions, not only on the existence of cause and effect relationships, but also on the approach of grouping success factors under common dimensions.
Limitations and future research
In addition to its contribution to the literature, the study has a limitation because the results are not universal, since the data used to produce them is that of internal and external stakeholders of the Turkish public institutions. However, this is an advantage rather than a disadvantage, because interested researchers can use the same generic methodology developed in the previous study to do similar studies to this study and discuss the validity of our results by presenting their own results they reached by collecting data from different stakeholder groups in different countries or regions. Another approach might be using our data sets to do different statistical analyses to reach additional results about the situation in Turkey. A third option might be collecting the same type of data from the same sample group after a reasonable time and do the same analyses to see any changes in trends or opinions. In either option, we believe our results will be useful for other multi-dimensional quantitative studies that include the opinions of internal stakeholders in addition to those of external ones.