



Abstract
There is currently a trend for companies to invest in business intelligence (BI) systems to enhance their management decision-making capability. Even though a great deal of attention has been paid to the practical decision-making benefits of BI system adoption, there is still a lack of research to investigate factors that affect users’ intention to continue using BI systems after they had already adopted the systems. Therefore, the aim of the study is to examine post-adoption cognitive beliefs and factors influencing users’ intention to continue using BI systems. This study compares three theoretical models, namely, the Expectation-Confirmation Model of IS Continuance (ECM), the Technology Acceptance Model (TAM), and a synthesized model combining ECM and TAM to examine which model can best explain users’ intentions to continue using BI systems. Survey data collected from 330 respondents in the Taiwanese electronics industry were examined using structural equation modeling. Our findings indicate that the synthesized model was the most parsimonious and had a greater explanatory power than the TAM and ECM models. The results suggest that users’ continuance intention is determined by perceived usefulness and satisfaction. Several implications and limitations of this study are discussed.
Keywords
Introduction
Prior IT studies place much emphasis on users’ initial acceptance and adoption of IT, but there is still a lack of research to investigate factors affecting users’ intention to continue use an IT after they had adopted the technology. While users’ initial acceptance and adoption is regarded as an important first step toward realizing information system (IS) success, long-term viability of an IS and its success eventually depend on its continuous use rather than its initial adoption (Bhattacherjee, 2001). The main reason is because infrequent and ineffective IT usage could lead to unexpected costs and waste of time to develop the IT (Hong et al., 2006). Therefore, users’ post-adoption behavior, which is either to continue or to discontinue use of an IT, is considered as a significant factor affecting IT implementation in an organization (Limayem et al., 2008).
According to Gartner’s IT spending research in 2015, business intelligence (BI) continues to be the top spending priority for chief financial officers (CFOs) in order to facilitate analysis and decision making (Gartner, 2015). BI systems are defined as being “specialized tools for data analysis, query, and reporting that support organizational decision-making” (Elbashir et al., 2008). As Hoelscher (2002) explains, BI is a combination of reporting, data mining, and online analytical processing. Perceived ease of use has already become a critical factor influencing the adoption of BI systems in organizations (Sallam et al., 2011). Perceived ease of use is defined as the extent to which a person believes that using a specific system would be free of effort (Davis, 1989). Understanding the factors influencing BI continuance intention is becoming imperative as more and more organizations adopt BI systems.
The Technology Acceptance Model (TAM) has been widely applied in explaining user acceptance behavior across a broad range of information systems (Lee et al., 2003), such as specialized business systems (e.g., enterprise resource systems (ERP) (Brown et al., 2002; Hsieh and Wang, 2007; Hwang, 2005; Saeed and Abdinnour-Helm, 2008; Saeed et al., 2010)), office systems (e.g., word processing applications (Adams et al., 1992; Davis et al., 1989; Venkatesh and Davis, 1996), spreadsheet applications (Mathieson, 1991; Jackson et al., 1997; Hackbarth et al., 2003)), communication systems (e.g., email (Karahanna and Straub, 1999; Adams et al., 1992; Davis, 1989), mobile commerce (Wu and Wang, 2005; Hong et al., 2006)), and general purpose systems (e.g., personal computers (Igbaria et al., 1995; Agarwal and Prasad, 1999; Taylor and Todd, 1995b) and the Internet (Moon and Kim, 2001; Lederer et al., 2000)). Recently, the Expectation Confirmation Model (ECM) was proposed to describe users’ intention to continue using (continuance) an IS (Bhattacherjee, 2001).
As noted above, prior studies were mainly focused on users’ initial acceptance and adoption of IS, and there is still a lack of research into the factors influencing users to continue use an IS after they had accepted it (Karahanna et al., 1999; Bhattacherjee, 2001; Limayem et al., 2008). Hence, this study synthesizes the TAM and the ECM to propose an integrated model for explaining and predicting users’ continued intention to use BI systems. Based on survey data from 330 respondents in the Taiwanese electronics industry, structural equation modeling (SEM) was employed to assess the research model in terms of overall model fit, explanatory power and path significance.
The rest of this paper is structured as follows. In Section 2, we present a review of literature on BI systems, the TAM and the ECM. Section 3 proposes the research model and develops the hypotheses tested in this study. Section 4 describes the research method. Section 5 presents the data analysis and results, which are discussed in Section 6. Section 7 presents conclusions and implications for practice and research. The final section describes the limitations of this study.
Theoretical background
Business intelligence (BI) system trends
Nowadays, many organizations have already implemented BI systems, considered to be one of the most significant and necessary business software investments for firms. As Hoelscher (2002) explains, business intelligence is a combination of reporting, data mining, and online analytical processing (OLAP). Therefore, BI systems can provide real-time information, create rich and precisely targeted analytics, monitor and manage business processes via dashboards that display key performance indicators, and display current or historical data relative to organizational or individual targets on scorecards. Companies that adopt BI systems can empower their employees’ decision-making capability in a faster and more reliable way. Thus, BI can deliver better business information by offering a powerful grip on organizational data (Chou et al., 2005).
Technology Acceptance Model (TAM)
Adapted from Fishbein and Ajzen’s (1975) Theory of Reasoned Action (TRA), TAM was developed specifically for explaining and predicting user acceptance of information systems (IS) in a pre-adoption situation (Davis et al., 1989; Venkatesh and Davis, 1996). TAM uses TRA as a theoretical basis for specifying causal linkages between two key beliefs (perceived usefulness and perceived ease of use), and users’ attitudes, behavioral intentions, and actual usage behavior. Perceived usefulness is defined as the extent to which a person believes that using a specific system would increase his or her job performance, and perceived ease of use is defined as the extent to which a person believes that using a specific system would be free of effort (Davis, 1989). Both perceived usefulness and perceived ease of use determine attitude towards use, defined as the user’s desirability of his or her using the system (Fishbein and Ajzen, 1975). Perceived ease of use directly affects perceived usefulness. Behavioral intention is directly influenced by attitude towards use and perceived usefulness. Actual usage behavior is affected by behavioral intention. Examples of IS acceptance studies with a pre-adoption situation include the study of Davis et al. (1989) regarding the use of word processing, Szajna’s (1996) work on email systems, Venkatesh and Davis’s (1996) study on graphics systems, and Venkatesh and Morris’s (2000) work on a data and information retrieval system. However, several studies based on TAM have implicitly assumed that continued use is an extension of initial adoption behavior and have applied TAM in post-adoption situations to predict users’ intentions to continue using IS (Taylor and Todd, 1995a; Karahanna et al., 1999; Hsieh and Wang, 2007; Hong et al., 2006). Moreover, TAM has empirically shown its capability in predicting and explaining initial IS usage behavior as well as users’ continuance usage behavior (Legris et al., 2003). Therefore, it seems appropriate to use TAM for assessing IS continuance behavior. In addition, in the revised version of TAM, users’ attitude toward using an IT was excluded from the model because of inconsistent and inconclusive findings for the role of attitude on user intentions (Hong et al., 2006). Hence, we use the subsequent TAM for model comparison.
Expectation-confirmation model of IS continuance (ECM-IS)
While users’ initial acceptance and adoption is regarded as an important first step toward realizing IS success, long-term viability of an IS and its eventual success depend on its continuous use rather than its initial adoption (Bhattacherjee, 2001). Therefore, Bhattacherjee (Bhattacherjee, 2001) proposed and empirically tested an Expectation-Confirmation Model of IS continuance (ECM-IS). The ECM-IS model posits that users’ IS continuance intention is determined primarily by their satisfaction with prior use of the system and perceived usefulness. In addition, user satisfaction is positively influenced by perceived usefulness and confirmation of expectation following actual use. Users’ confirmation of expectation is positively related to their perceived usefulness. The ECM-IS model is based on expectation-confirmation theory (ECT) (Oliver, 1980), which has been widely used to explain and predict consumer satisfaction and repurchase intention in the consumer behavior literature (Oliver, 1980; Oliver, 1993b). The ECT holds that consumers’ intention to repurchase a product or continue service use is primarily determined by their satisfaction with previous use of that product or service (Anderson and Sullivan, 1993; Oliver, 1980; Oliver, 1993a).
Research model and hypotheses
Several studies have attempted to develop and empirically test models of continued IT usage behavior (Bhattacherjee and Premkumar, 2004; Hsu et al., 2004; Hong et al., 2006; Lee, 2010; Al-Debei et al., 2013; Yuan et al., 2014; Sun and Mouakket, 2015). Our study builds on these efforts to increase the understanding of continued BI systems usage behavior. So far, very little research on IT continuance has investigated continuance use in terms of BI systems. Therefore, we synthesize the Technology Acceptance Model (TAM) and the Expectation-Confirmation Model of IS continuance (ECM) to propose an integrated model. Since TAM and ECM focus on different aspects of user perceptions, by combining these two models, the synthesized model may provide a more comprehensive understanding of continued BI usage behavior. Previous studies show evidence that such integration of different perspectives can help to better understand a certain IS phenomenon (Thong et al., 2006; Liao et al., 2007; Sun and Mouakket, 2015; Lee, 2010). Therefore, as indicated in Figure 1, the synthesized model will help bridge the existing gaps between acceptance and continuance streams of BI system usage research. Given the accumulated evidence of the significant impact of perceived ease of use on both IS usage intention and perceived usefulness from prior TAM research, perceived ease of use is included in the ECM. Following the perspective that post-adoption expectation in the ECM consists of users’ beliefs about the attributes possessed by an IS (Bhattacherjee, 2001), the post-adoption expectation in the synthesized model is represented by both perceived usefulness and perceived ease of use.

The synthesized model of ECM and TAM.
The following hypotheses are derived from the TAM:
The ECM proposed by Bhattacherjee (2001) posits that users’ IS continuance intention is determined primarily by their satisfaction with prior use of the system and perceived usefulness. In addition, user satisfaction is positively influenced by perceived usefulness and confirmation of expectation following actual use. Users’ confirmation of expectation is positively related to their perceived usefulness. Thus, the following hypotheses are derived from the ECM:
As another component of post-adoption expectation, perceived ease of use is expected to have a positive effect on user satisfaction (Hong et al., 2006).
Following a similar line of reasoning applied to the relationship between confirmation and perceived usefulness in the ECM, confirmation of expectation is also hypothesized to positively affect perceived ease of use. Confirmation of expectation refers to actual performance meeting the users’ expectations (Bhattacherjee, 2001).
We also compare three theoretical models (ECM, TAM, and the synthesized model combining ECM and TAM) to examine which model can best explain users’ intentions to continue using BI systems.
Method
Instrument development
The items used to operationalize the constructs were mainly adapted from prior research (Bhattacherjee, 2001; Davis et al., 1992). Table 1 lists the scale items used to measure each construct and their reference sources. All scale items were rephrased to relate specifically to the context of BI systems and measured using a 7-point Likert-type scale (from 1 = “strongly disagree” to 7 = “strongly agree”). To ensure the content validity of scales, a pre-test was conducted with five industrial experts and 10 experienced BI users in Taiwan. They were asked to evaluate the clarity of wording and the appropriateness of the items in each scale (See Table 1). All the items measuring the research variables were adapted from prior studies (Bhattacherjee, 2001; Davis et al., 1992). Furthermore, we conducted a pilot study with 30 executives from four Taiwanese electronics companies in order to ensure data reliability. Each participant was asked to complete the questionnaire, evaluate the instrument and comment on its clarity and understandability (Moore and Benbasat, 1991). Cronbach’s alpha coefficient was used to measure the internal consistency of the multi-item scales used in the study. The value of Cronbach’s alpha for each construct was greater than 0.7, indicating satisfactory reliability level above the recommended value of 0.6 (Nunnally, 1978).
Question items used in the study.

Note: *reversed coded.
Subjects and data collection
The study focuses on a single industry, namely the electronics industry, which has been widely recognized as being a key driver of economic growth in its role as a technology enabler for the whole electronics value chain. Taiwan’s electronics industry is divided into seven sectors (semiconductor, photoelectricity, computer and peripheral equipment, electronics, software and Internet, integrated circuit (IC) design, and other electronic industries). Because of the trend of globalization and the impact of cost reduction, electronics companies in Taiwan need to improve the speed of their business process, shorten their time of delivery, and reduce their manufacturing costs to satisfy their customers’ requirements. Taiwanese manufacturers have adopted many IT applications (e.g., BI systems) and electronic commerce systems to enhance their competitiveness in the global market (Chen et al., 2009). Therefore, the electronics industry is likely to be a fruitful ground to address our research objectives.
The sample was drawn from a report published by 2013 Common Wealth Magazine, which lists Taiwan’s top 1,000 manufacturers, including electronics companies ranked by annual revenue. Initial telephone screening interviews were conducted with IS executives or senior managers from the Taiwan electronics companies to confirm that the selected companies are using BI systems. Of these, 552 companies qualified and agreed to participate in the mail survey. A contact person was identified at each company and was asked to distribute the questionnaire to a key end user who has plenty of experience and knowledge in BI systems at any level in an organization. This was done to avoid concern about common respondent bias in survey research. A total of 552 survey packages were sent out. The survey package contained a cover letter, a questionnaire, and a stamped return envelope. A total of 330 completed questionnaires were returned. The response rate was 54.3%. The respondents belonged to different segments and management levels of Taiwan’s electronics industry, as shown in Table 2. The respondents included 170 males (51.5%) and 160 females (48.5%), 59.4% were between 30 and 39 years old, and 88.8% had at least a bachelor’s degree. The distribution of the industry segments in our sample included 28.8% in the photoelectric and optical industry, 27.9% in the semiconductor industry, 15.2% in electronic-related industry, 11.8% in computer and consumer electronics manufacturing industry and 10.3% in integrated circuit (IC) design house. The job positions of respondents included top-level managers (2.4%), middle managers (19.4%), supervisors (14.2%), and professional staff (63.9%). Concerning BI usage experience, those who had accumulated more than 5 years, accounted for about 41.5%. Nearly half (49.7%) of the respondents used BI systems more than 120 minutes per week, while 38.2% reported using BI systems an average of more than 4 times per day.
Respondent demographics.
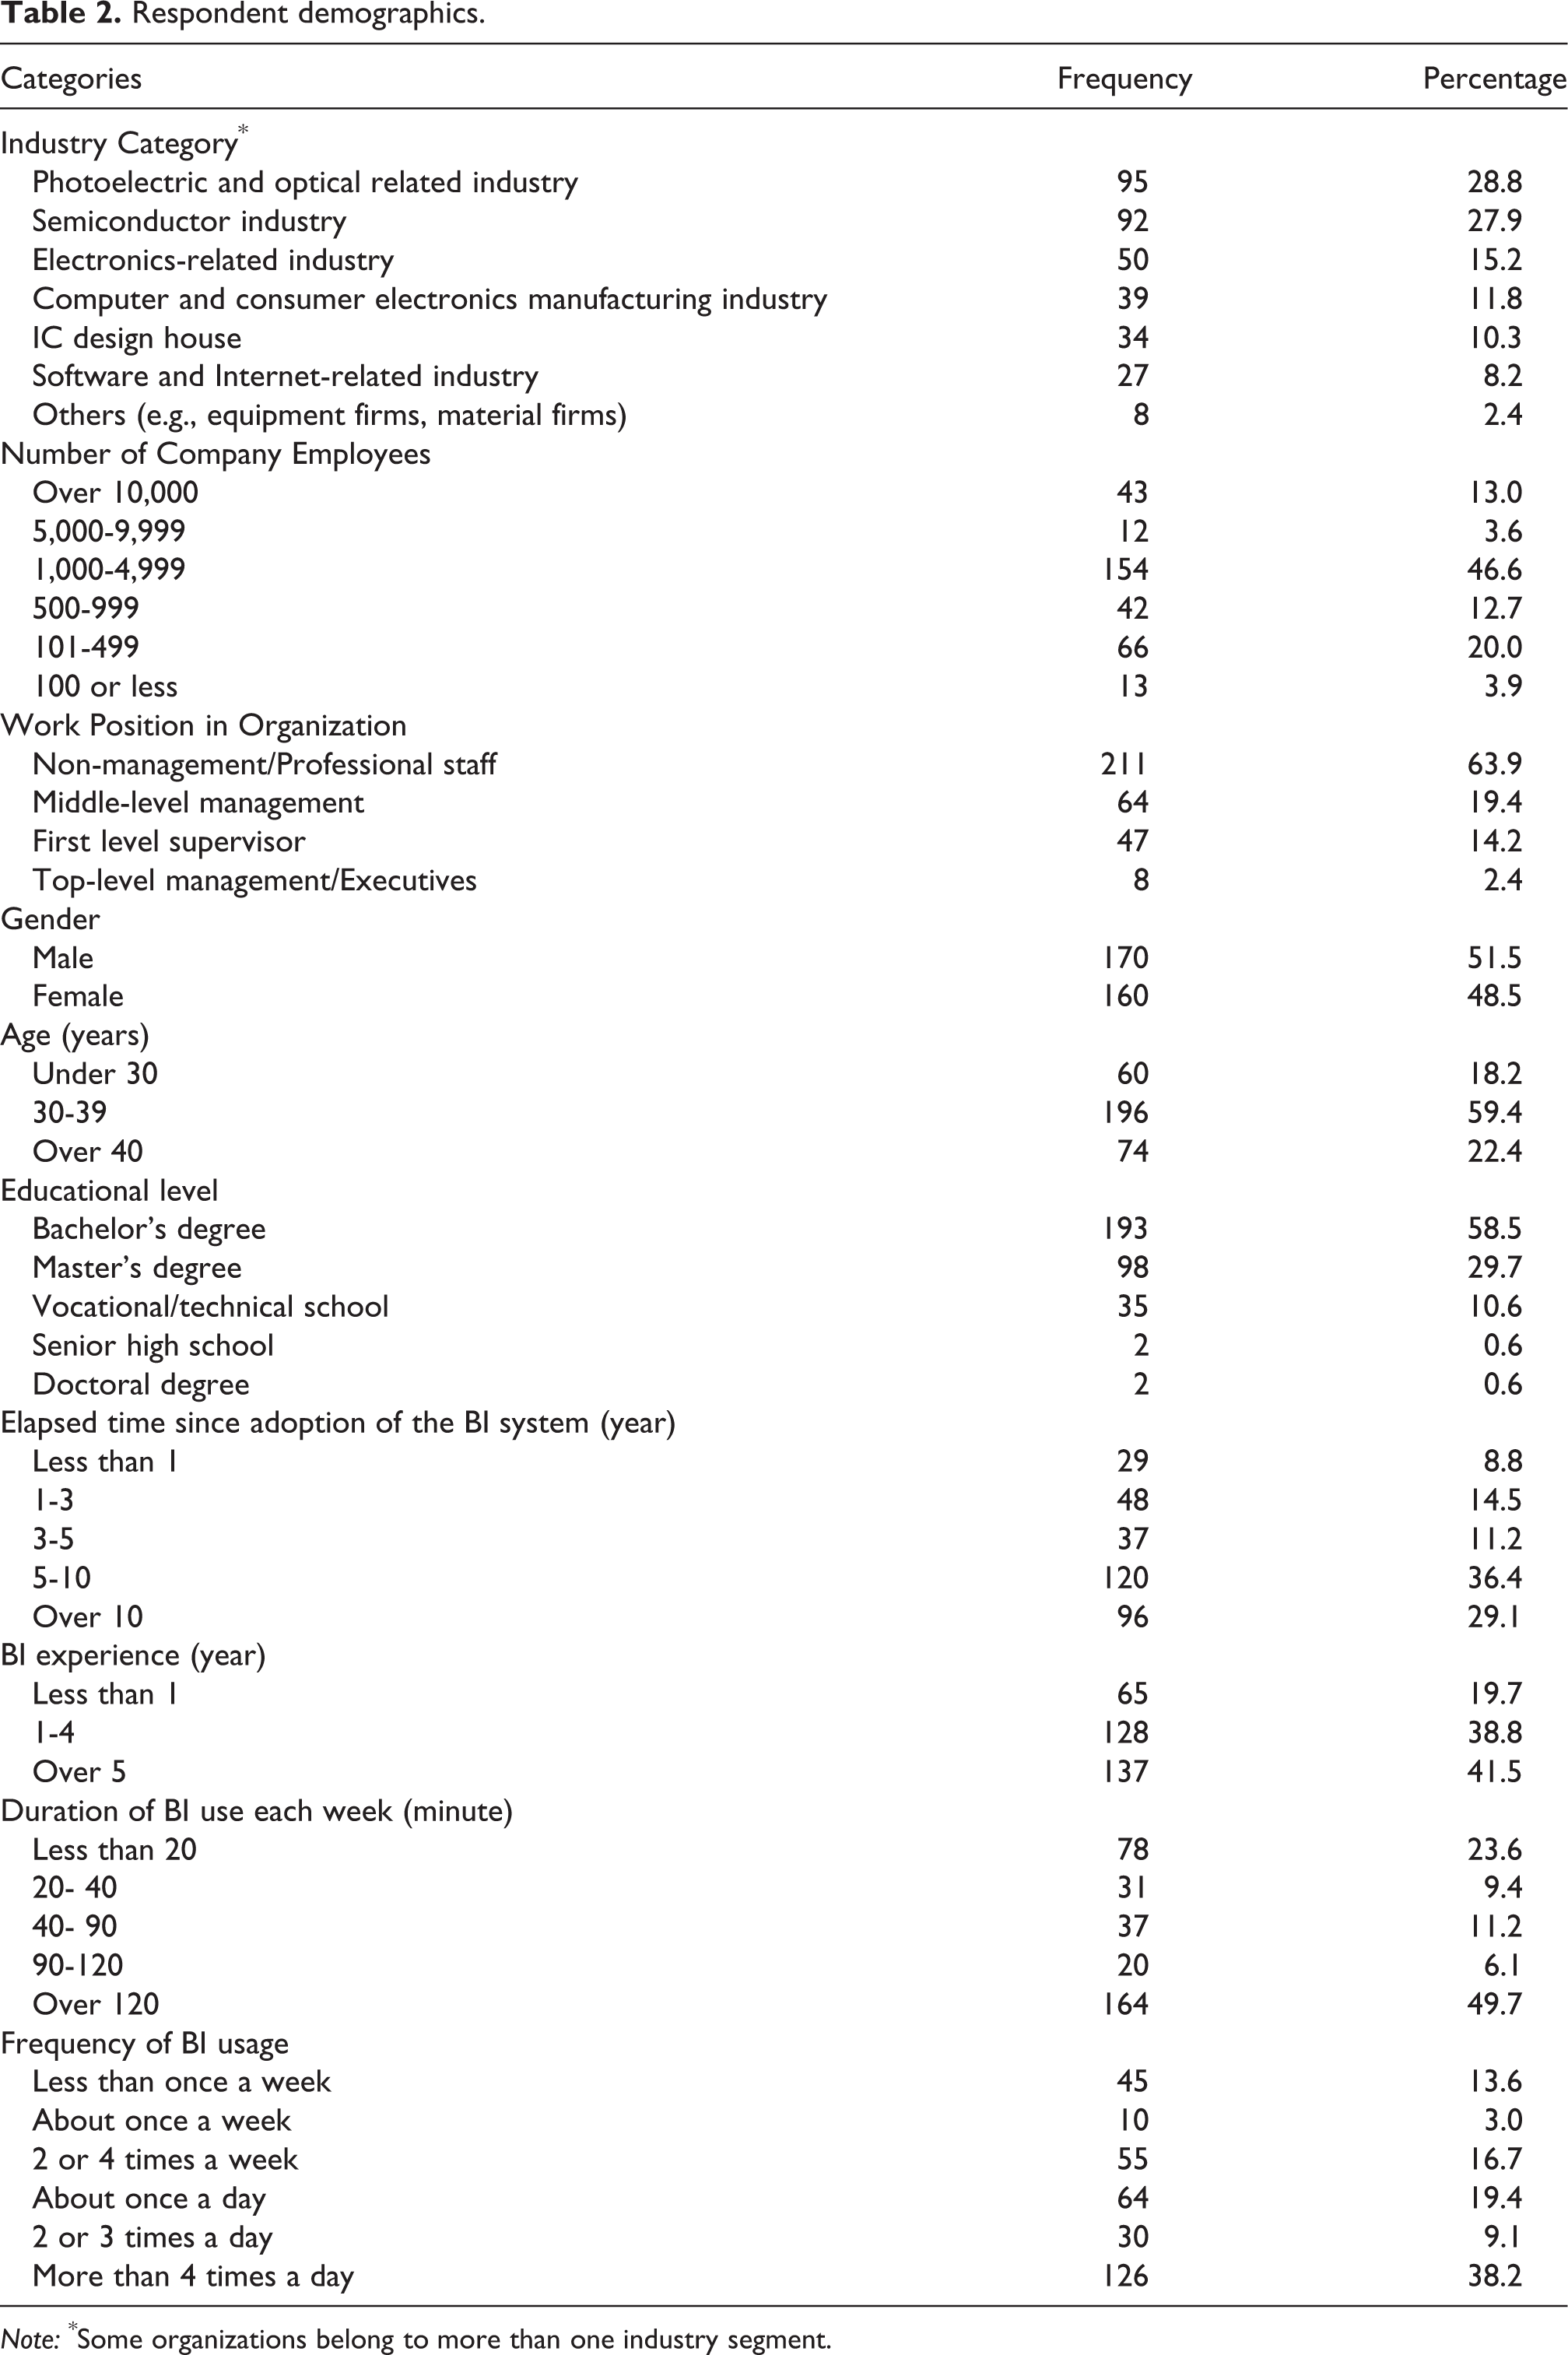
Note: *Some organizations belong to more than one industry segment.
In order to examine the possible presence of non-response bias, we tested for statistically significant differences in the responses of early (184 users) versus late respondents (146 users) (Armstrong and Overton, 1977; Lambert and Harrington, 1990) using gender, work position, industry type and annual revenue. The chi-square (χ2) tests comparing the categories across the two groups revealed no significant differences for gender (χ2 = 3.798, p = 0.051), work position (χ2 = 1.766, p = 0.779), industry type (χ2 = 0.247, p = 0.619), and annual revenue (χ2 = 6.865, p = 0.443). Therefore, there is no significant non-response bias in the study.
Data analysis
The structural equation modeling (SEM) approach was used to examine and compare the three competing theoretical models in this study. A two-step modeling approach, recommended by Anderson and Gerbing (1988) was employed. In the first step, the measurement model was estimated using confirmatory factor analysis (CFA) to test both the reliability and validity of the measurement model. In the second step, structural models were analyzed to examine the overall model fit results of the three competing theoretical models.
Results
Table 3 indicates that the measurement model was first examined through CFA. All model fit indices indicated an adequate model fit. Furthermore, the composite reliability, convergent and discriminant validity were tested to confirm data validity and reliability. As illustrated in Table 3, the composite reliabilities ranged from 0.704 to 0.960. Both the Cronbach’s alpha and the composite reliability estimates clearly indicate evidence of reliability. Hair et al. (2006) suggested that convergent validity should be assessed by factor loading, composite reliability, and average variance extracted (AVE) measures. All factor loadings for all items were statistically significant and were exceeding the recommended level of 0.6 (Chin et al., 1997). Additionally, all composite reliability values exceeded the recommended level of 0.7 (Hair et al., 2006). The AVEs met the recommended minimum threshold of 0.50 (Fornell and Larcker, 1981). Therefore, the measurement model had adequate convergent validity. Finally, we examined discriminant validity of the measurement model. All diagonal elements are greater than their corresponding off-diagonal ones, indicating satisfactory discriminant validity of all the constructs in Table 4 (Fornell and Larcker, 1981). Overall, the measurement model provided a good fit to the data.
Confirmatory factor analysis results.
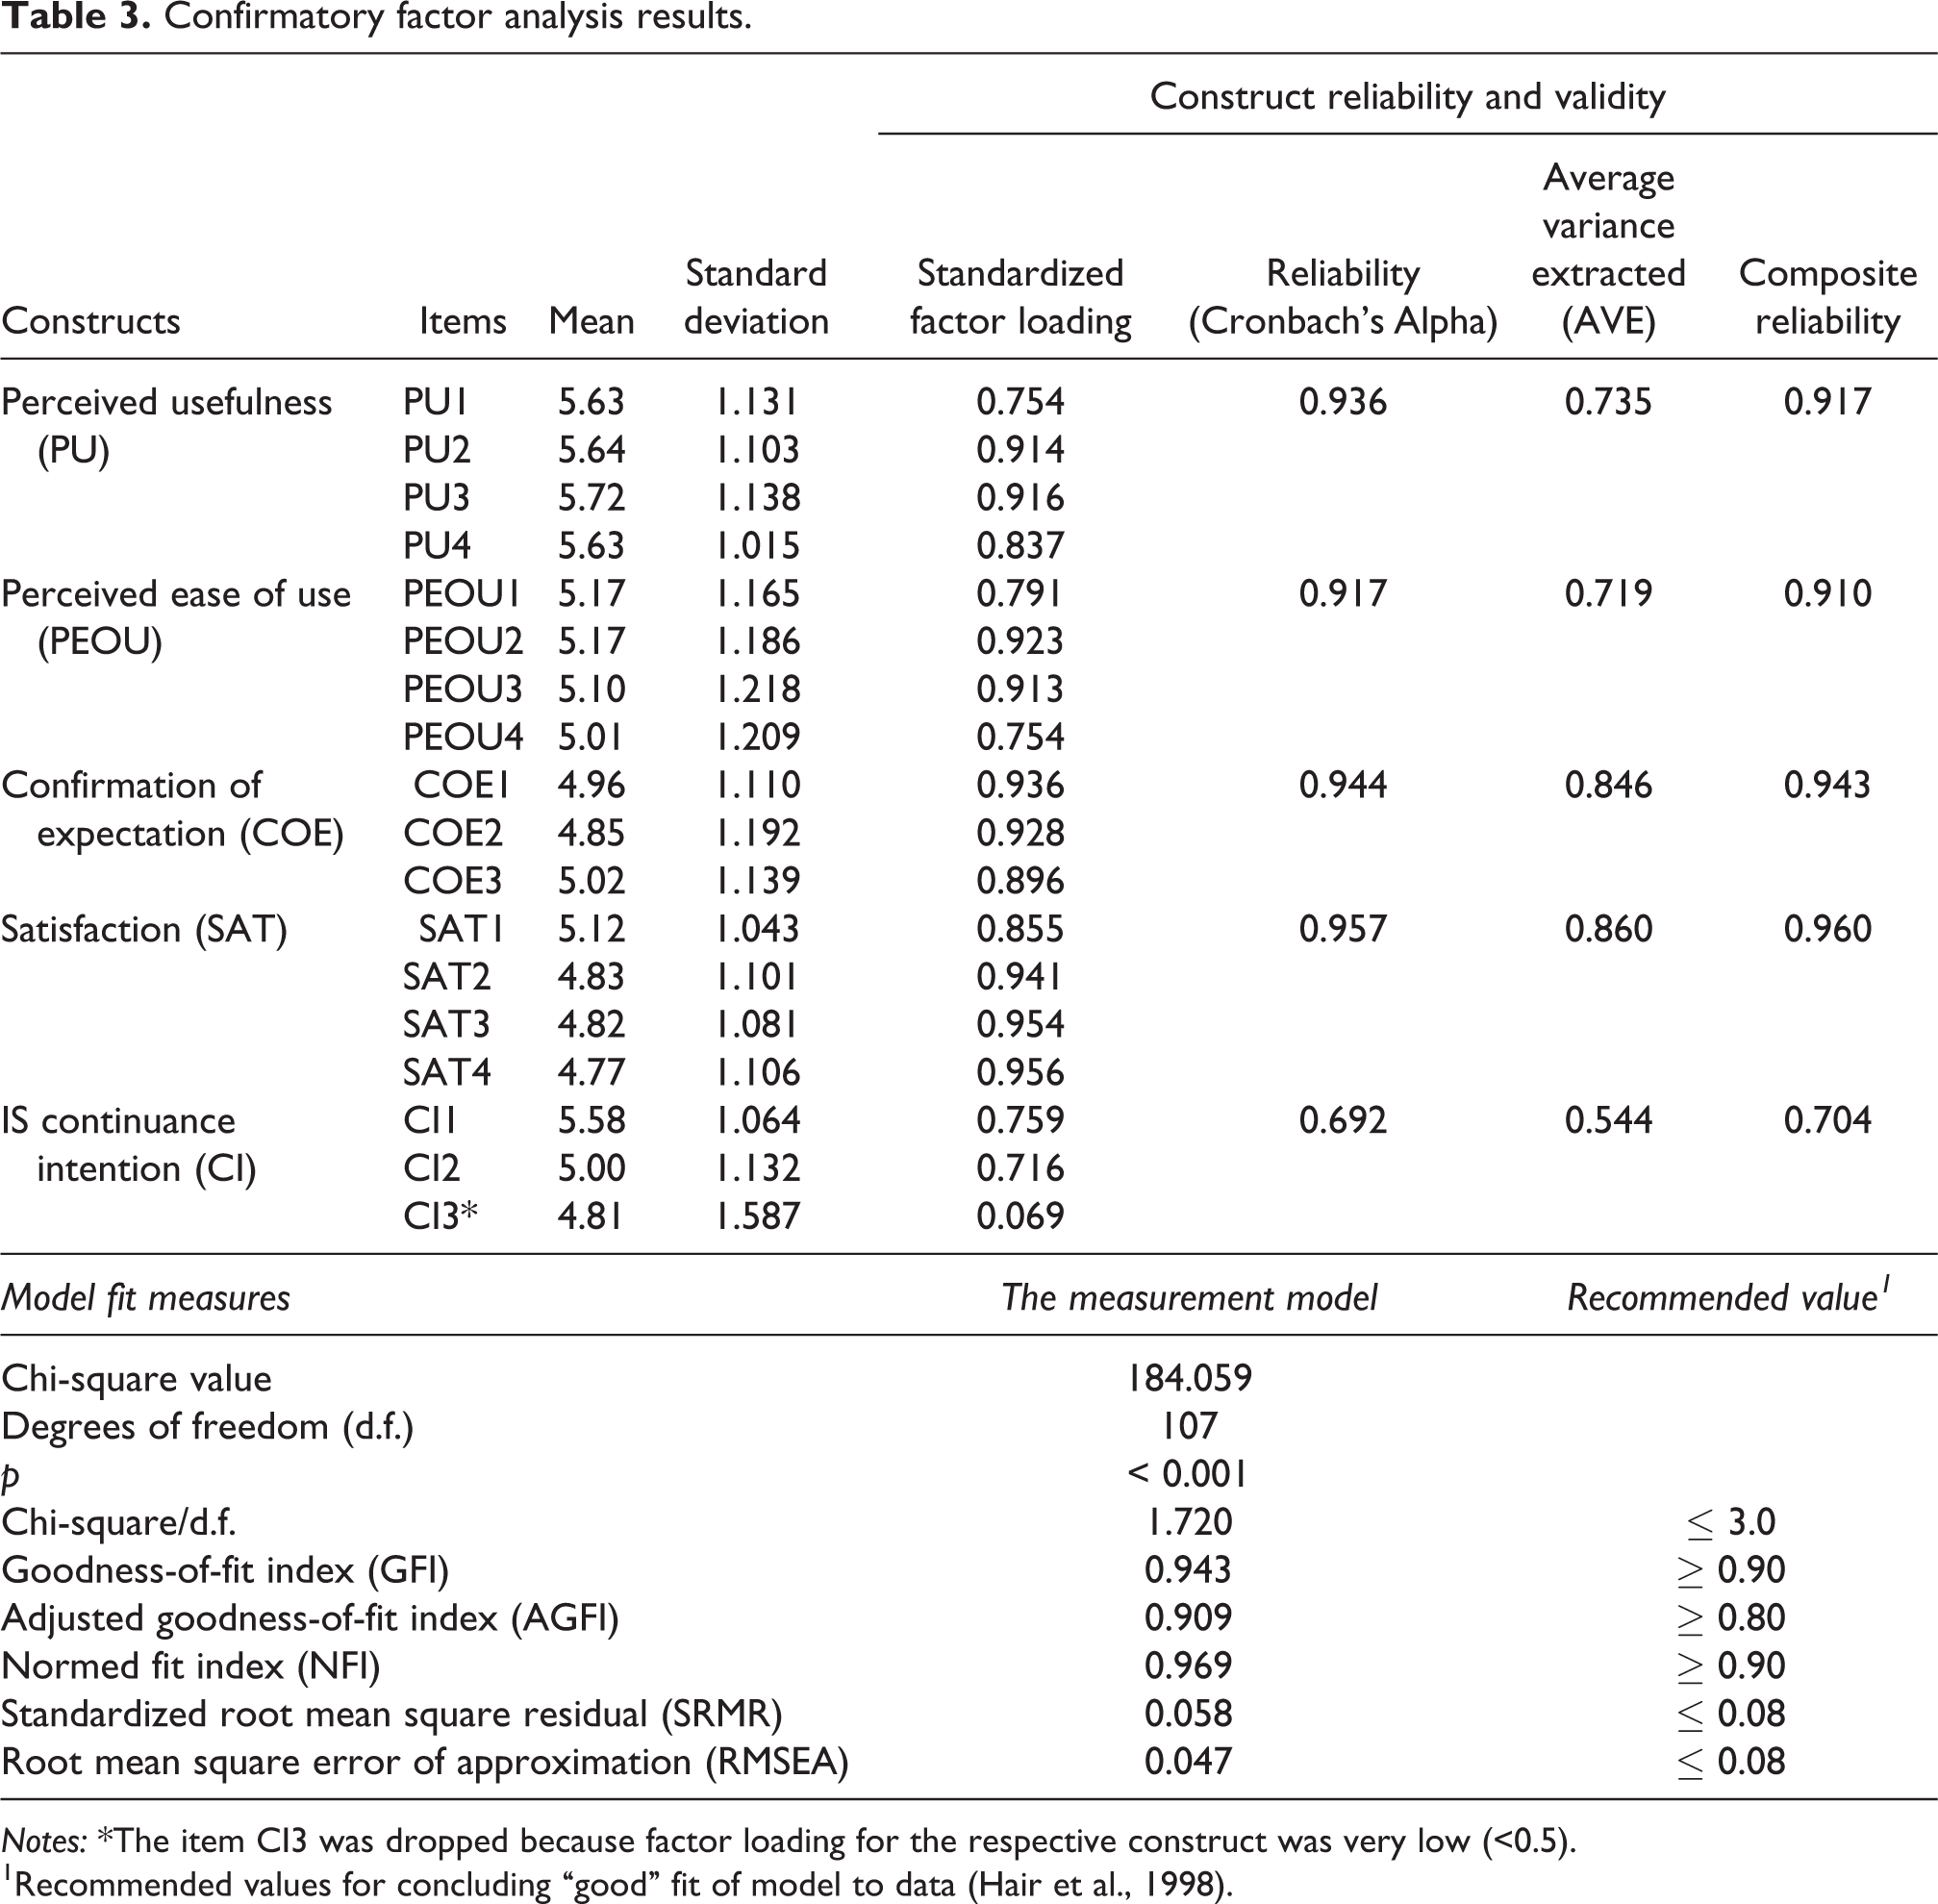
Notes: *The item CI3 was dropped because factor loading for the respective construct was very low (<0.5).
1Recommended values for concluding “good” fit of model to data (Hair et al., 1998).
Discriminant validity.
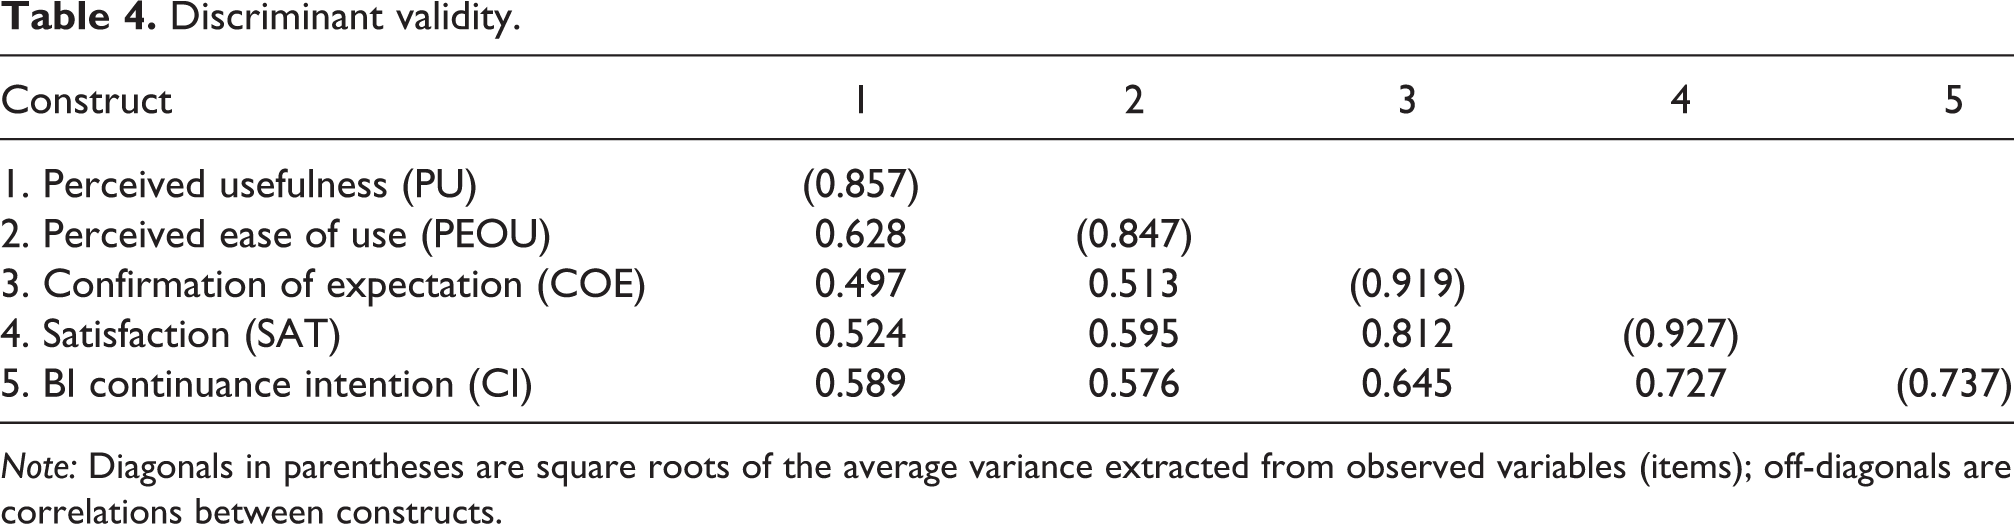
Note: Diagonals in parentheses are square roots of the average variance extracted from observed variables (items); off-diagonals are correlations between constructs.
The three competing models were then independently tested using SEM. The results show that the three structural models provided a good fit to the data. The standardized path coefficients for the TAM are shown in Figure 2. Results indicated that perceived ease of use was a significant determinant of perceived usefulness. Perceived usefulness and perceived ease of use were significant antecedents of an employee’s continuance intention to use BI systems. All hypothesized paths were positive and significant (see Figure 3). Results indicated that users’ BI continuance intention is determined primarily by their satisfaction with prior use of the system and perceived usefulness. User satisfaction is positively influenced by perceived usefulness and confirmation of expectation following actual use. Users’ confirmation of expectation is positively related to their perceived usefulness. The standardized path coefficients for the synthesized model are presented in Figure 4 and Table 5. All the paths among variables were significant as expected, except two paths: the path between BI continuance intention and perceived ease of use (H3) and the path between satisfaction and perceived usefulness (H4). Perceived ease of use had direct positive impact on user satisfaction, whereas perceived usefulness did not.
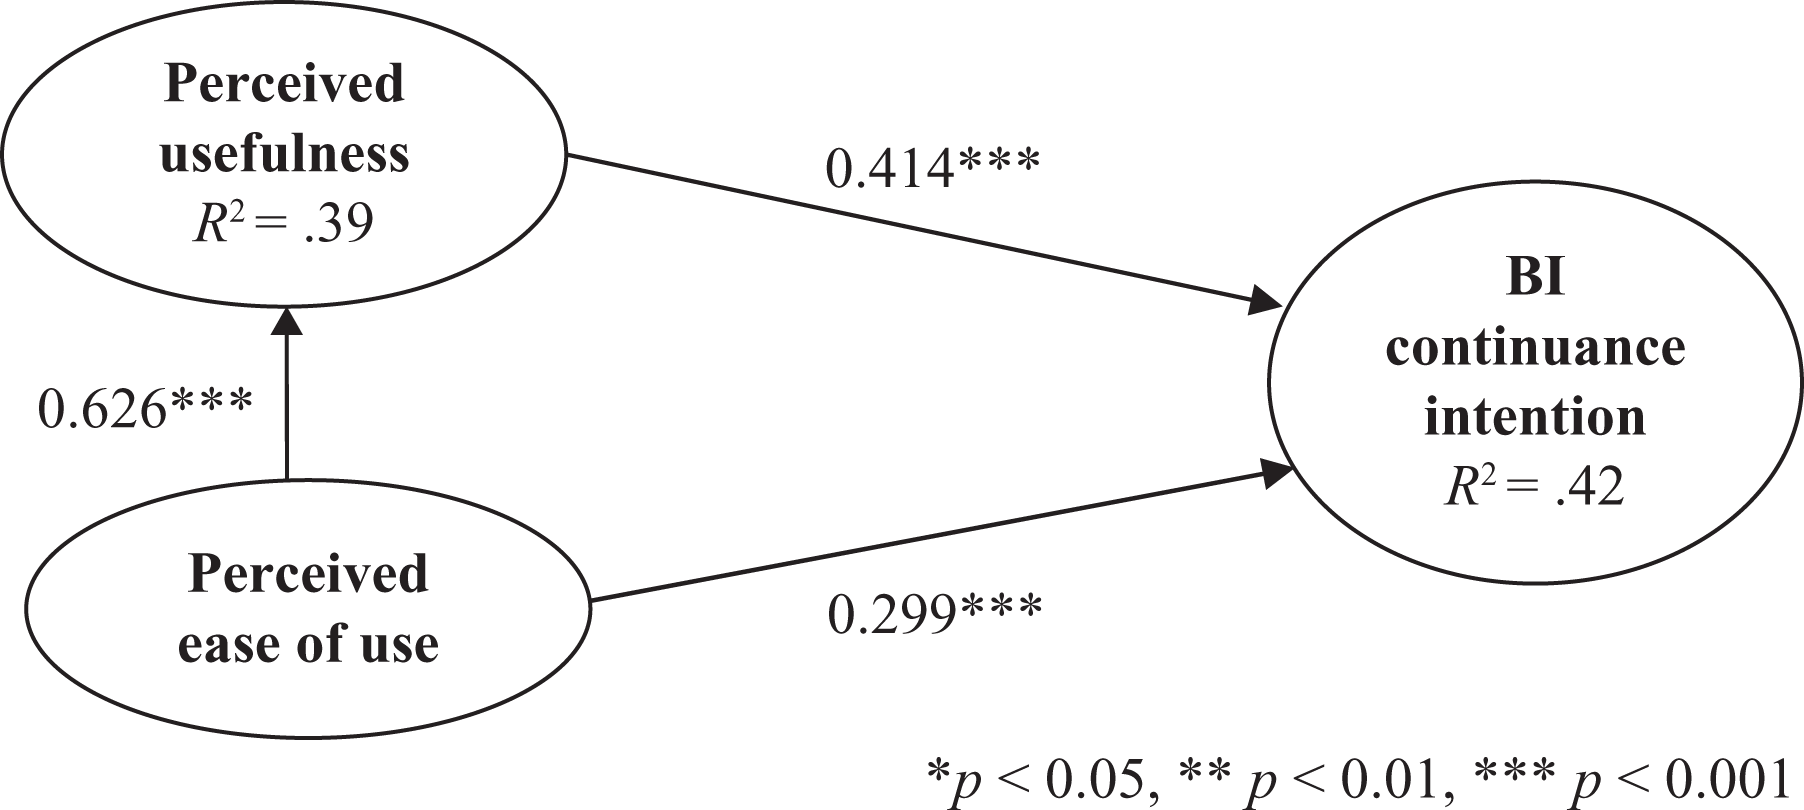
Results of TAM.

Results of ECM.

Results of the synthesized model.
Summary of hypotheses testing.

Note: *p-value < 0.05, **p-value < 0.01, ***p-value < 0.001; ns: not significant.
The comparative results on the explanatory power of BI continuance intention demonstrate that the synthesized model has a better explanation ability (61%) than TAM (42%) and ECM (57%). The amount of variance in perceived usefulness explained by confirmation and perceived ease of use was much higher (41%) than that explained by confirmation alone in ECM (23%), and was almost the same as that explained by perceived ease of use alone in TAM (39%), while 66% of variance in satisfaction was explained in the synthesized model, which is similar to 67% in ECM.
Discussion
Empirical evidence collected in this study indicates that all three models provided comparable and acceptable levels of fit to the data. There were several important findings. First, the comparative results of the explanatory power of BI continuance intention, demonstrate that of the three models, the synthesized model has the best level of explanatory ability as compared with TAM and ECM. The synthesized model also provides better information for understanding the behavior of interest. Second, the synthesized model permits examination of the influences of perceived usefulness and satisfaction simultaneously, thus facilitating a more holistic view of users’ continuance intention. The results indicate that satisfaction is the strongest predictor of users’ BI continuance intention, followed by perceived usefulness. Third, this finding supports the contention in ECM that satisfaction is the critical driver of users’ continued IT usage intention and thus an antidote to IT discontinuance (Bhattacherjee, 2001). Fourth, confirmation also has significant effects on the various post-adoption beliefs (satisfaction, perceived usefulness, and perceived ease of use), supporting the expanded ECM’s argument that users’ various post-adoption beliefs are influenced by their levels of confirmation (Bhattacherjee, 2001). In addition, consistent with Hong et al. (2006), we confirm that confirmation has the primary effect on satisfaction. Fifth, consistent with findings from several prior studies (Venkatesh, 2000; Taylor and Todd, 1995b), users’ perceived usefulness has a positive effect on their intention to continue BI usage. Finally, inconsistent with Hong et al. (2006), perceived ease of use does not have a significant direct effect on BI continuance intention. This is in line with the extant literature, which suggests that perceived ease of use would not have significant direct impact on intention during IT continued usage context (Bhattacherjee, 2001; Venkatesh et al., 2003). A plausible reason for this is that since BI systems are becoming more powerful and easier to use, users may become increasingly competent in using them. In this case, users simply need less training to become familiar with the capabilities of their system. Therefore, BI users place less weight on perceived ease of use. Davis (1989) also reported that, while “the effect of usefulness on usage was significant,” “the effect of ease of use on usage, controlling for usefulness, was non-significant” with the reason that “ease of use operates through usefulness” (p.332). He further suggested that perceived ease of use may actually be a causal antecedent to perceived usefulness, rather than a direct determinant of intention and usage (Davis, 1989).
Theoretical and managerial implications
The findings of the present study have implications for future research. Since there is a lack of prior research to investigate factors that affect users’ intention to continue using BI systems after they have already adopted the systems, this study performs a model comparison among these three models (TAM, ECM and the synthesized model, which is a combination of ECM and TAM) for explaining users’ post-adoption behaviors of BI systems. The SEM analysis showed that all of the three competing models provided a comparable fit to the data. In terms of the ability to explain BI continuance intention, our results showed that the synthesized model has a better explanation ability than TAM and ECM and supports all the hypotheses, except two paths (the path between satisfaction and perceived usefulness and the path between BI continuance intention and perceived ease of use), implying that the combination of TAM and ECM provides a model with a theoretical basis to explain BI system usage behavior in the post-adoption phase. Therefore, in order to understand users’ IT usage behavior, researchers have integrated different models and made the comparison among them for performing research on users’ IT usage behavior (Lee, 2010; Hong et al., 2006). In this study, we contribute to the BI adoption and usage behavior by providing empirical evidence for the comparison of three prospective continued IT usage models. Our results indicate that the synthesized model was the most parsimonious and had a greater explanatory power than the TAM and ECM model. Hence, the synthesized model can provide abundant information to allow a more complete explanation of users’ post-adoption behavior.
The findings of this research also have important practical implications. Our results show that it is essential to increase employees’ perceived usefulness and satisfaction to enhance their intentions to continue to use an IT system (Bhattacherjee, 2001). In order to motivate employees to adopt and use BI systems, top management needs not only to place more emphasis on the usefulness and ease of use of the systems, but also to pay special attention to providing employees with adequate training and support to use the systems effectively. Sufficient training for employees will increase their knowledge and experience with the system, and then may help decrease the levels of computer anxiety (Igbaria, 1993), so that they are more likely to form a positive intention to use it in their work.
Limitations and future research
This study has several limitations. First, this study was conducted in a single industry and therefore the results may not be generalizable to other industries. Further research is needed to determine the applicability of the results of this study to other industries. Second, our empirical study was carried out in Taiwan and the results might not be directly applicable to other countries due to cultural differences. Thus, there is a need to repeat this study in different countries. Third, since this study was focused on a particular technology, it is unknown to what extent our results may be extended to other software systems. Finally, this study presented a cross-sectional research that measures users’ perceptions and intentions at one point in time. However, users’ perceptions may change over time as they gain more experience of using BI systems (Mathieson et al., 2001). Hence, future research should consider conducting a longitudinal approach in order to gain a deeper understanding into IS continuance study.