
Abstract
Media ownership significantly shapes organisational practices and journalistic content. While prior research has established ownership as a key influence on media output, less is known about the prevalence and systemic patterns of different ownership forms across European Union (EU) countries. This study addresses this gap by investigating how EU Member States cluster based on prevailing media ownership types in their news media spheres and how these groupings correspond with broader social, political, economic, and media system characteristics. Five ownership-based clusters emerge, each differing not only in ownership structure but also in contextual indicators such as media literacy, corruption perceptions, and the rule of law. The countries with high public and civil society ownership score high on these indicators, while media literacy is low, the rule of law weak, and corruption high where private individual ownership dominates. The findings contribute to on-going research on media ownership forms and comparative media studies.
Introduction
There is ‘overwhelming evidence that ownership influences journalistic content’ (Theine et al., 2025: 876). The strategic vision of media owners and the resources allocated for its pursuit directly affect how media organisations operate – and, by extension, their journalistic output (Achtenhagen et al., 2018; Reese and Shoemaker, 2016; Sjøvaag and Ohlsson, 2019).
Media scholars increasingly study how ownership structures shape reporting. Media owned by private individuals or families can be used to spread owners’ ideologies and influence politics (Chomsky, 2006; Grossman et al., 2022; Hanretty, 2014; Padovani, 2015). Institutional investors prioritise profit, reduce costs through reducing newsrooms, and can use their media assets for competitive advantage on other markets (Baker, 2009; DesJardine et al., 2023; Peterson and Dunaway, 2023). Independent and financially strong public media align closely with professional standards and normative democratic goals of journalism just as outlets in cooperative journalist–employee ownership (Cushion, 2022; Sanders and van de Vrande, 2025). Outlets owned by civil society organisations (CSOs) often display a stronger public service orientation and produce more investigative content but may also exhibit political instrumentalism (Benson, 2013; Benson et al., 2018; Cagé, 2016; Konieczna, 2018).
The growing body of the literature support the framework suggested by Benson and colleagues (Benson, 2019; Benson et al., 2025). It posits that different media ownership arrangements are associated with distinct institutional logics which are aligned with audience targeting (elite or mass) and funding strategies (advertising, subscriptions, fees, or donations). According to Benson et al. (2025), four forms of media ownership – public/state, private, market (stock-traded companies, equity and investment funds, non-media conglomerates), civil society (non-profits, parties, religious organisations, professional and interest associations) – are linked to different modes of power to shape the content. These are public service orientation, political instrumentalism, and economic instrumentalism. In their study on outlets with different ownership forms in three countries representing liberal (the USA), democratic-corporatist (Sweden), and polarised-pluralist (France) media systems (Hallin and Mancini, 2004), Benson et al. (2025) found regularities in manifestations of these powers to shape content. Specifically, civil society media more often than others provide public service information; public service media (PSM) deliver the most public service reporting for mass-audience, which is also typically targeted by media with market forms of ownership; partisan individual owners more often than others use their outlets for political leverage; and media with market ownership forms tend to report favourably on owners’ business interests, although such mentions are very rare.
Evidence accumulated thus far largely confirms the influence of differing ownership logics on media content (for scoping review, see Theine et al., 2025). However, less is known about the prevalence of different media ownership types on a media system level in different countries beyond divisions into state and private ownership. This knowledge gap is particularly pronounced in the European Union (EU) after a surge in journalist start-ups with alternative ownership between 2012 and 2016 (Sanders and van de Vrande, 2025). This article takes a step in addressing this gap and answers the following research questions:
RQ1: How do EU countries group by prevailing media ownership types in their media systems?
RQ2: In what broader social, political, economic, and media system aspects do these groups differ?
Drawing on the Euromedia Ownership Monitor database, I calculated the relative share of each ownership type per each of 27 EU countries and performed cluster analysis to classify the countries by the prevalence of different media ownership types. Five groups were found that differ also across broader social, economic, and media system indicators.
The remainder of this paper proceeds as follows: I first situate this study within the broader body of comparative media research. I then outline the data and methods used, present and discuss the results, and conclude with the study's practical and theoretical implications.
Situating the study vis-a-vis comparative media scholarship
For a considerable body of comparative media research, the starting point is the typology of media systems by Hallin and Mancini (2004), who categorised ‘western’ countries along dimensions of press market, political parallelism, journalistic professionalism, and the role of state (De la Mata et al., 2024). Their three models include the liberal model (Canada, Ireland, the UK, the USA) with high press reach, low political parallelism, professional journalism, and limited state role; the democratic-corporatist model (Nordic and German-speaking countries, Belgium, the Netherlands) with high press reach, strong professional journalism, political parallelism, and state support; and the polarised-pluralist model (France, Greece, Italy, Portugal, Spain) with low reach, high parallelism, weak professionalisation, and strong state involvement.
Despite some critique, the typology remains influential not for the correctness of country categorisation, but for providing a schema to discuss media systems across different geographies and time or contextualise communication phenomena (Brüggemann et al., 2014). It is still used after many additions and contributions from multiple scholars. Given the focus of this paper, I will discuss main works that tested and refined the typology in European contexts. Fernández-Lombao et al. (2024: 3–5) offer a broader and more succinct overview of the scholarly works engaging with the framework.
Brüggemann et al. (2014) operationalised the dimensions suggested by Hallin and Mancini and presented the first empirical typology. They renamed the press market dimension into inclusiveness of press market, divided the role of the state into three dimensions – press subsidies, state broadcaster, and state regulation (of media ownership) – and suggested indicators to measure the four dimensions. Brüggemann et al. (2014) found four models of media systems. The democratic-corporatist countries split: the Nordic states (Denmark, Finland, Norway, Sweden) formed a Northern cluster; Austria, Germany, and Switzerland, as well as the UK, appeared in the Central cluster; Belgium and the Netherlands were categorised into the Western cluster alongside Ireland and the USA. Most polarised-pluralist countries appeared in the Southern cluster, while Portugal joined the Western cluster. Büchel et al. (2016) analysed the same indicators with qualitative comparative analysis and found more nuances: France and Austria were found to be additional border cases sharing polarised-pluralist features combined with liberal (France) and corporatist (Austria) characteristics.
Herrero et al. (2017) categorised Eastern European countries across Hallin and Mancini's dimensions with addition of foreign ownership. They found three clusters – the Eastern (Bulgaria, Hungary, Romania) with the highest political parallelism, lowest press freedom, weakest public broadcaster, and low professionalisation, the Central (Croatia, Czechia, Poland, Slovenia) with stronger public media and ownership regulation, and the Northern cluster (Estonia, Latvia, Lithuania, Slovakia) with high press freedom, professionalism, and online news use.
Humprecht et al. (2022) revisited the relevance of indicators of comparative media systems’ dimensions in the digital age and added new ones such as online news reach or media freedom. Their cluster analysis found three groups. Two of them comprised countries previously identified as democratic-corporatist and polarised-pluralist. The third group was formed from liberal model countries, polarised-pluralist countries (France, Italy, Portugal), as well as Belgium, Czechia, and Estonia.
While the presence, funding, and reach of public broadcasters contribute to the dimension of the role of state, and market inclusiveness encompasses audience consumption patterns, these typologies omit the production side – ownership structures of media markets. However, before integrating specific ownership dimensions and indicators into existing frameworks, the relationships between ownership configurations and media systems outcomes should be better understood. This work is already underway, with the existing typologies serving as contextual reference categories for interrogating media ownership (e.g. Benson et al., 2025).
Conversely, one could argue that media ownership is rather shaped by the existing dimensions (Reese and Shoemaker, 2016): audience consumption shapes the markets, while state regulation directly affects the national ownership systems (Winseck, 2017). Moreover, when viewed through Benson et al.'s framework, different ownership types could serve as indicators contributing to the state role (public ownership), professionalism (public, civil society ownership), and political parallelism (private ownership), given their theorised capacities to shape journalism.
The proliferation of diverse country groupings across studies reflects the high sensitivity of comparative frameworks to case selection, variable inclusion, and other methodological choices. Given this paper's objective to offer a macro view of ownership patterns across two dozen countries and acknowledging that quantitative approaches cannot ‘describe media systems in their entirety’ (Humprecht et al., 2022: 156), I categorise countries by media ownership patterns as a standalone analysis, separate from other media system indicators. Integrating media ownership into existing frameworks, as well as revisiting the conceptualisation of dimensions and indicators to accommodate ownership structures, represents a logical next step but lies beyond the scope of this paper.
Data and method
This study employs cluster analysis and comparison of means to derive similar groups from the data and examine their similarities and differences. In the cluster analysis, EU countries were grouped according to their similarity in the shares of four ownership forms in opinion shaping media.
Variables and data
The variables for ownership forms per EU country were constructed using the publicly available data from the Euromedia Ownership Monitor (EuroMo, 2023). The database includes ownership information as of 2022 and 2023 of print, broadcast, and online ‘news publications with opinion-shaping relevance’ as defined by their market share and agenda setting potential by research teams in each country (Tomaz, 2024: 503). Therefore, the number of news outlets varies between countries. The smallest number (N = 12) comprises the Irish sample, whereas the German sample of outlets (N = 50) is the biggest. Using this database and, when necessary, open sources such as company reports, websites, and commercial databases such as Orbis and Capital IQ, I have identified ultimate firms at the end of ownership chains and, where applicable, their beneficial owners and further categorised them into one of the four types for each news outlet. For the listed companies, owners with 5% of shares or more were also categorised.
In the cases where information on the number of shares of owners was not available, but the identified owners were of the same type, it was possible to allocate the whole or relevant part of ownership to this specific type. For example, 50% of the Polish online outlet Onet.pl is owned by the Swiss-based Ringier AG, which was owned by the insurance company Schweizerische Mobiliar Genossenschaft (25%, categorised as market ownership) and by three individuals whose total share amounts to 75% but the information on distribution of the shares was not available. In this case, for the part of the outlet owned by Ringier AG: 12.5% of the outlet is in market form of ownership and 37.5% is private ownership.
For each country, an average of shares per ownership type per media sector (print, radio, television (TV), online) was calculated. The results of the calculations are available in the Supplemental materials.
Next, to release assumptions about equal potential ownership influences on the public sphere and circumvent the technological shaping of media sector structures, the final weighted average of each ownership type share was calculated as follows. First, the weights were constructed with country aggregates of the respondents’ answers to the question: ‘Among the following, what media have you used the most to access news in the past 7 days?’ asked within the Flash Eurobarometer survey (European Parliament, 2022). Next, the average shares of different ownership types per sector were multiplied by the shares of respondents using the respective media, and the sum of their products divided by the sum of shares. This final composite weighted average share was used in the analysis. The resulted four continuous variables (values from 0 to 1) representing shares of consumed news media (further called ‘media sphere’) held in four ownership forms – public, private, market, and CSO ownership – were used for cluster analysis. The full table with data for each country, overall means and standard deviations is available in the Supplemental materials.
For comparisons of the groups identified in the cluster analysis, one-way analysis of variance (ANOVA) with additional variables was applied. Table 1 lists the variables and their sources.
Variables and sources used for cluster comparison.
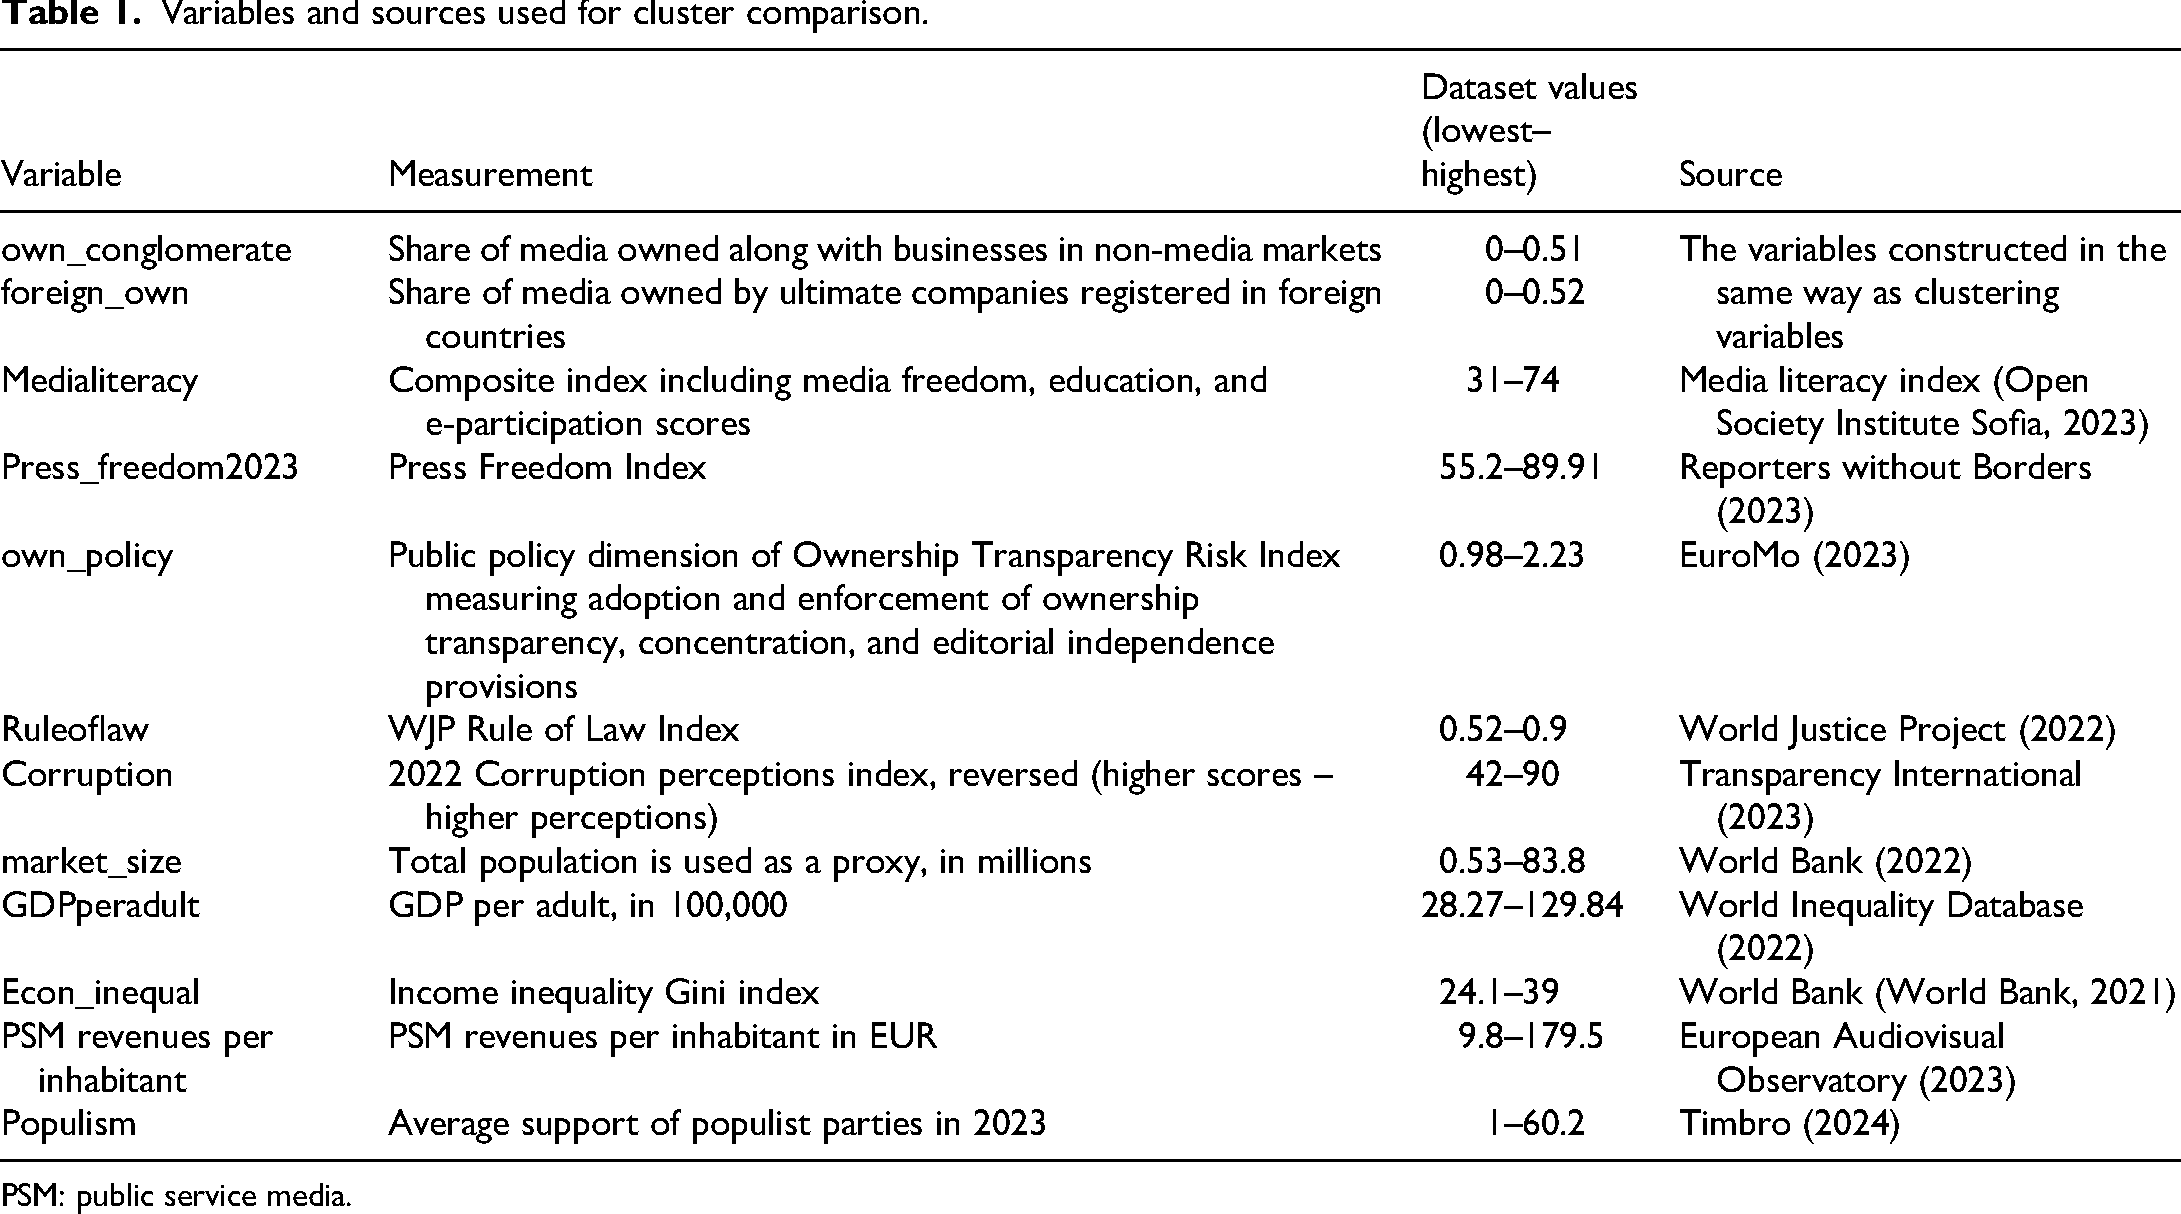
PSM: public service media.
Analytical procedure
Several cluster analysis procedures with different methods were performed to arrive to a final cluster solution. The analysis was performed using IBM SPSS software. First, hierarchical cluster analysis with the nearest neighbour as agglomeration procedure and squared Euclidean distance as a proximity measure was applied to 27 country-cases. Since the most dissimilar objects in the set are merged in the last stages, the method ‘is particularly suitable for detecting outliers in a set of objects’ (Backhaus et al., 2021: 408). Based on the dendrogram and agglomeration schedule available in the Supplemental materials, two countries that were fused in the last stage – Luxembourg and Malta – were excluded from further analysis. Both countries have prominent civil society ownership accounting for more than half of their media spheres: 54% in Luxembourg and 56% in Malta, untypical for other countries. In Malta, the majority owners of the media sphere within this ownership type (73%) are political parties that overall own 41% of the media sphere. When these counties were removed from the sample, the mean CSO ownership fell from 0.11 to 0.07 and standard deviation halved from 0.14 to 0.006.
Next, cluster analysis with the Ward's method and Euclidean distance was applied to 25 remaining cases. This method categorises cases based on the smallest variance increase in the resulting group and produces homogenous groups that tend to be of equal size (Backhaus et al., 2021; Jaeger and Banks, 2023). Based on the dendrogram and the variance increase in the agglomeration schedule (available in the Supplemental materials), a five-cluster solution was optimal. To check the result, I conducted k-means clustering procedure with pre-specified five clusters and set initial cluster centres – variable means of the clusters derived from the Ward's method – as well as with pre-specified 4, 5, and 6 clusters without initial cluster centres setting. In k-means cluster analysis, groups are partitioned from a set based on minimisation of variances of distance to the cluster centres within groups (Jaeger and Banks, 2023). The k-means cluster analysis with five clusters and specified initial cluster centres converged on the same solution as the Ward's algorithm. Without initial centres’ specification, it categorised Bulgaria to a different cluster forming five clusters and created a single-country cluster of Hungary forming six clusters, while the rest remained identical to the Ward's method clustering. With four clusters, the k-means method distributed countries from one of the five clusters between two clusters. It also revealed a very stable cluster comprising Denmark, Germany, the Netherlands, and Sweden that did not change depending on the number of clusters, and a relatively stable cluster of France, Italy, Spain, Poland, and Finland. Bulgaria and Finland are the furthest from their cluster centres in all specifications. The k-means clustering results are available in the Supplemental materials.
Since ‘there is less theory and more ad hockery’ (Jaeger and Banks, 2023: 14) in cluster analysis, the choice of a specific solution is always subjective. I have opted to the Ward's method five cluster solution without Hungary, which is identical to the six k-means cluster solution, and regarded Bulgaria and Finland as border cases. Hungary was excluded since before its removal, the between-group error sum squares exceeded the within-group amount for CSO ownership. The situation with media ownership in Hungary is peculiar with the government's tight grip on media ownership and funding. Out of 21 newspapers in the EuroMo sample, 20 newspapers are owned by the KESMA foundation along with Hír TV channel. After the establishment of KESMA in 2018, ‘[g]overnment-aligned media owners offered their assets to the new foundation free of charge, resulting in the creation of an entity controlling a significant portion of the media market with 476 outlets’ (Nemeth, 2024: 30). Although newspaper consumption is as low as 9%, the total share of CSO ownership after weighing for popularity of media types is still relatively high – 29% compared to 22% in the Netherlands that has the highest CSO ownership after Malta, Luxemburg, and Hungary. The analyses were re-run after removing Hungary from the set, confirming the cluster country memberships with hierarchical and partitioning procedures.
Five clusters with 24 cases were profiled. I have compared significant differences in cluster variables' means and within- and between-group variance and explored if the groups significantly differ on other characteristics using one-way ANOVA with Games–Howell post-hoc test.
While the country groups had significant differences at 95% confidence level in the share of media owned along with other businesses (own_conglomerate, η2 = 0.38), media literacy (η2 = 0.49), ownership policy adoption and implementation (η2 = 0.46), the rule of law (η2 = 0.54), corruption perception (η2 = 0.59), support of populism (η2 = 0.57), and market size (η2 = 0.47), the indicated proportion of the variance explained by the grouping (η2) is likely to be inflated due to a small number of cases in the set and each of the groups. For this reason, the Press Freedom Index, on which group differences were significant at 90% level, was not used in the group profiling.
Finally, I correlated the variables that showed significant differences between groups with ownership variables to examine their relationships.
Findings
The clustering algorithm rendered five groups of four to six EU countries differing by the types of owners that are salient in their media spheres. The clusters differ significantly (p ≤ .001) across all ownership types, and the strongest differentiating variable is the amount of private ownership (F = 73.4) followed by market ownership (F = 30.1), CSO ownership (F = 10.9), and public ownership (F = 10.3).
Table 2 summarises the ownership patterns and the wider contextual characteristics of the country groups with rounded values of clustering and non-clustering variables, followed by a detailed description of each cluster.
Summary of mean (SD) of clustering and non-clustering variables per country group.
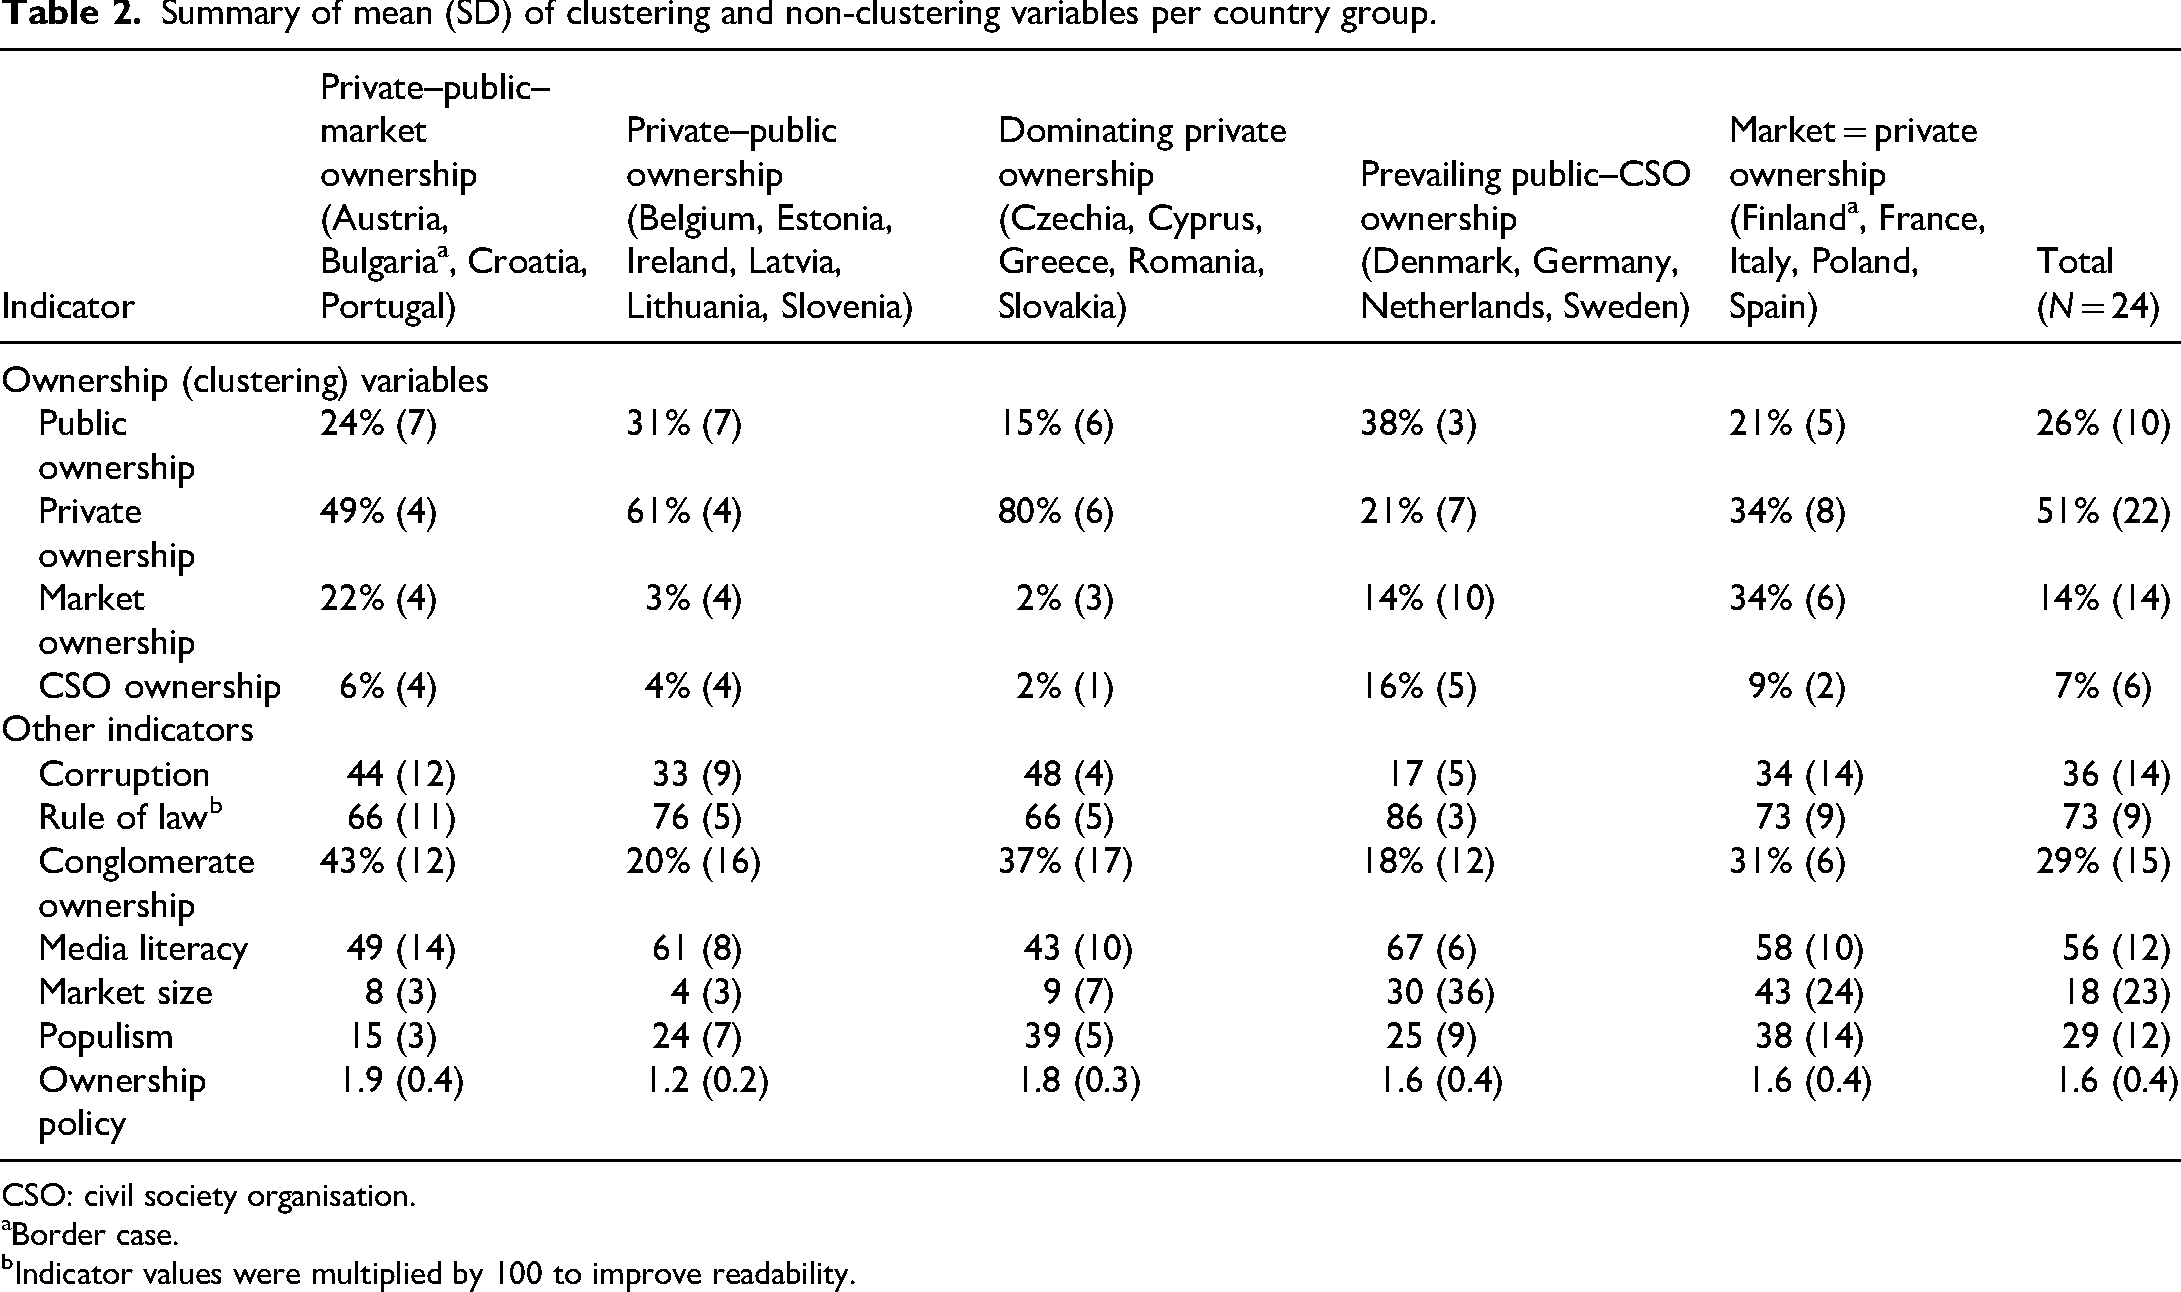
CSO: civil society organisation.
Border case.
Indicator values were multiplied by 100 to improve readability.
Differences in means of ownership types between the clusters and their wider distinctive media, social, political, and economic characteristics provide basis for description of ownership patterns (RQ1) and wider contextual characteristics of country groups (RQ2):
Private ownership balanced by public and market forms. Austria, Croatia, and Portugal as well as Bulgaria as a border case belong to this cluster. Private ownership (49%) prevails in this group having on average twice the number of shares as market (22%) or public forms (24%). CSO ownership is small (6%). Bulgaria is a border case due to the absence of CSO ownership in its media sphere. The rest of the group members have 7–9% of CSO ownership. This group has the highest share of media owned along with businesses in other fields – 43% on average. The cluster has a relatively large corruption score (43.5), but differences between countries within the group is quite tangible with standard deviation of more than 12. This group is the second smallest by country population in the set with average mean of 7.46 million inhabitants. Interestingly, this group has the lowest mean support for populist parties and differs significantly in the levels of populist support from the third group of countries with dominating private ownership. The countries in this group are diverse in media literacy, ownership policy, and the rule of law, since standard deviations of these variables are equal or exceeding the values for the whole set. Private ownership counter-balanced by public ownership. This is the biggest group comprising Belgium, Estonia, Ireland, Latvia, Lithuania, and Slovenia. These countries have more than half of media spheres (61%) owned by individuals and families. A counter-weight for this type of ownership is public ownership with average of 31%. Market ownership form and CSO ownership are highly dispersed. While the most countries in the cluster have marginal shares of these types, 10% of the media sphere in Ireland is owned by stock-traded companies. Lithuania and Slovenia each have 7% and 10% of CSO ownership. This group has higher than 24 countries’ average score in media literacy (61) and the least developed ownership policy scoring on average 1.15. They have a high rule of law score (76) and average corruption scores (33.1). Populism support is slightly below average (24). This group is the smallest by population size with average of 3.9 million inhabitants. Conglomerate ownership levels vary within the group. Compared to the third group with dominating private ownership, this group has significantly higher media literacy, significantly lower levels of populism and corruption, and significantly less elaborated media policies. Dominating private ownership. This group includes Czechia, Cyprus, Greece, Romania, and Slovakia. The average private family ownership of this group amounts to 80%. Public ownership is much less pronounced with 15% of its share in media spheres on average, whereas market and CSO ownership are marginal with 2% on average. This group scores the lowest on media literacy (53). Their ownership policies are elaborate – this group scores the highest among groups on this dimension. They also score relatively low on rule of law (66) and high on corruption (48) indicators. On these dimensions, the group is quite uniform. The countries in this group have diverging levels of conglomerate ownership. The group has significantly lower media literacy and rule of law scores than the group with prevailing public and CSO ownership, significantly higher corruption than the mentioned group and the second group, significantly more elaborate media policy than the second group, and significantly higher populism support than the first two groups. Prevailing public and civil society ownership. This group comprises Denmark, Germany, the Netherlands, and Sweden. It has the highest average share of public ownership (38%) and CSO ownership (16%) among the groups, whereas private ownership share is the lowest compared to other groups (21%). Still, the group is diverse in terms of CSO ownership with relatively high standard deviation (5). The average share of market ownership (14%) corresponds to the overall average. This group has the lowest share of media sphere owners active on other markets – 18% on average and maximum 26% with total sample mean at 29% – and the highest media literacy (67.5). With a mean score of 1.61, their ownership policies are more elaborate than on average in the EU (1.57). The group is uniform in their highest scores in the rule of law (86) and the lowest corruption (17), and slightly lower than average support for populism (24). However, market size reflected in the number of inhabitants is diverse, since the most populated Germany was grouped with much smaller countries such as the Netherlands or Sweden. This contributed to the standard deviation that is much higher than in the total sample. With the highest score on media literacy and the rule of law and the lowest score on corruption, this group differs significantly from the third group of countries where private ownership dominates. Equal market and private ownership. This group comprises Finland, France, Italy, Poland, and Spain, and differs from the rest of the groups by remarkably strong market ownership in the media sphere (34%). Finland has the highest share of this type of ownership across all EU countries (43%) and can be considered a border case. However, without accounting for Finland, the average market ownership share of this group would still be the highest (32%). Private ownership has an equal average share (34%), while the remaining one-third of media spheres is taken by public ownership (21%) and CSO ownership (9%). The group has about average level of owners in media sphere active in other business fields (31%). Ownership policy (1.59) and media literacy (57.8) scores are close the total sample's values. Media literacy score is boosted by the group's border case – Finland that has a much higher index than the rest (74). The group is not distinct on the rest of characteristics – its means and standard deviations for the rule of law, corruption perception, and market size are almost identical to the total sample's values.
Among non-clustering variables, only rule of law, populism support, and corruption had larger between-group differences than within-group differences. Populism support does not correlate with any of the ownership forms. Public media ownership has a moderate positive relationship with media literacy and the rule of law, and a moderate negative relationship with corruption and conglomerate ownership, significant at 99% level (two-tailed test). CSO ownership interacts positively with media literacy and the rule of law, and negatively with corruption. These relationships are weak but significant at 95%. Market ownership has a moderate positive relationship with the market size, significant at 99%. Finally, private ownership negatively correlates with media literacy and the rule of law, and positively with corruption. These relationships are moderate and significant at 99%. The correlation table and plots are available in the Supplemental materials.
Discussion and conclusion
The presented results must be interpreted with several methodological limitations in mind, particularly those affecting the country clustering. The first limitation concerns the construction of national news media spheres from the selected sets of outlets. As Esser and Vliegenthart (2017: 4) note, ‘a fundamental problem in comparative studies… is comparability’. Although the EuroMo project's methodological framework requires that outlet sets be functionally equivalent as relevant sources of news, differences in team selections may still influence results. This risk was mitigated through a shared selection strategy but could not be fully eliminated.
Outlet selection also shaped the composition of media spheres as aggregates of audience-adjusted sectors. In particular, the number of TV channels included affected the relative weight of PSM: a broader selection reduced the PSM share. This largely corresponds to the reality when PSM is among many news TV channels as opposed to having a limited choice of other channels. Yet, strong PSM presence often raises journalistic standards across the media sphere (Benson et al., 2025; Humprecht and Esser, 2018). While most European countries represent dual systems with a significant PSM use, ideally, relative audience shares should be included to weight outlets before sector aggregation (see Aleksevych and Tomaz, 2025). However, missing audience data in some countries (e.g. Slovakia) precluded this approach. Given this, country rankings based on PSM share in the dataset were compared with their rankings by audience percentages from the Digital News Report (Newman et al., 2023), showing substantial alignment. Given that the PSM variable exerted minimal influence on cluster formation, the results can be considered valid despite these limitations.
The five identified country groups enable several key observations. Private family ownership takes the biggest share of media spheres in most cases. In three of the groups comprising 15 out of 24 countries, it is the prevalent form of ownership. In countries where this media ownership type dominates (Czechia, Cyprus, Greece, Romania, Slovakia), media literacy and the rule of law are the weakest, and the perceived corruption is the highest compared to the rest of the groups. Viewing media structures as resultant from regulations (Winseck, 2017), the fact that these countries have relatively highly elaborated media policies signals potential issues with enforcement or quality.
The other two groups of countries where private ownership prevails, it is counter-balanced by public media (Belgium, Estonia, Ireland, Latvia, Lithuania, Slovenia) or public and market forms of ownership together (Austria, Bulgaria, Croatia, Portugal). They score average in other indicators. Of note, conglomerate ownership is the highest in countries with smaller markets possibly due to lower revenues in media markets caused by the rise of global giants or competition from bigger neighbours as is the case in Austria (Sparviero et al., 2024).
In contrast, civil society ownership is the rarest media ownership form accounting for up to one-fifth of media spheres, with exception of the excluded countries – Hungary, Luxembourg, and Malta. In four of the five groups, the average share of CSO ownership is 2–9%. However, countries with the highest share of this form and the strongest public media, namely Denmark, Germany, Netherlands, and Sweden, have the highest media literacy, the strongest rule of law, and the lowest corruption compared to the rest of the countries. This is yet another confirmation that a strong public service orientation in a media sphere aligns with a broader democratic performance of societal systems. The significant contrast on these dimensions with the group where private ownership dominates and the corresponding correlations invite the idea of the reality of ownership logics on the system level and confounding factors that drive public and CSO ownership together with the rule of law, good governance, and media literacy such as democratic maturity or prevailing societal values.
Interestingly, populism support does not significantly correlate with ownership types, despite significant differences between country groups. Rather than being linked to particular ownership forms, populist tendencies appear in countries with diverse ownership structures (e.g. Austria, Hungary, Slovenia) and seem to be connected to relational aspects and ties within media ownership networks (Schnyder et al., 2024). This points to unaccounted confounding factors that distinguish these groups and explain the significant cross-group variations in populism support such as centrality (integration) of ownership networks or political cultures.
Finally, the countries with prevalent market ownership, namely Finland, France, Italy, Poland, and Spain, tend to be average on broader characteristics but larger in market size. The exception within this group is Finland. While being relatively small in size, 43% of Finland's news media sphere is owned by stock-traded companies, however the Finnish PSM is considered to be one of the strongest (Horowitz et al., 2022). Since Finland differs markedly from the group and scores highly on media literacy, the rule of law, and corruption perceptions, it represents a distinct case warranting separate analysis.
The typology has some similarities with media systems by Hallin and Mancini (2004). The countries with the highest share of public and CSO ownership are democratic-corporatist as per their typology. Also, the polarised-pluralist France, Italy, and Spain per Brüggemann et al.'s categorisation (2014) have clustered together by their high share of market ownership. However, Austria and Belgium, categorised previously as democratic-corporatist, have differing ownership structures and are closer to Bulgaria and Croatia, and Estonia, Ireland, Latvia, Lithuania, and Slovenia, respectively. Similarly, Greece and Portugal categorised by Hallin and Mancini into polarised-pluralist countries are closer to Czechia and Austria, respectively.
Despite profound digital disruptions, these media ownership patterns show both alignment with and departure from Hallin and Mancini's typology, with geographically and culturally proximate countries often following divergent ownership trajectories. Private ownership is likely to persist, though its sustainability may increasingly depend on press subsidies or public advertising amid the next artificial intelligence-driven hybridisation cycle (Hallin et al., 2023). In contrast, market ownership may decline as media profitability erodes. Recent developments, such as the Springer family's 2025 buyback of Axel Springer SE shares from KKR and CPP Investments – returning the company to family ownership (Axel Springer SE, 2025) – illustrate this consolidation trend. Alternatively, outlets with high cultural capital may transition to civil society ownership, following the Scandinavian model, or rely on grants and donations.
The influence of media ownership on content is context-dependent and historically contingent (Benson et al., 2025). In the wake of digitalisation and on-going technological change, many media organisations face financial fragility, heightening their vulnerability to commercial and political capture (Nielsen, 2017; Pickard, 2022). Under these conditions, institutional logics of ownership are likely to play a stronger role in shaping the information environment. The typology proposed here could inform future system-level analyses and in-depth examinations of differently institutionalised journalistic practices and their emergent outcomes.
Supplemental Material
sj-docx-1-ejc-10.1177_02673231261429296 - Supplemental material for Towards macrosociology of media ownership: Taxonomy of media ownership patterns in European Union (EU) countries
Supplemental material, sj-docx-1-ejc-10.1177_02673231261429296 for Towards macrosociology of media ownership: Taxonomy of media ownership patterns in European Union (EU) countries by Mariia Aleksevych in European Journal of Communication
Footnotes
Funding
The author received no financial support for the research, authorship, and/or publication of this article.
Declaration of conflicting interests
The author declared no potential conflicts of interest with respect to the research, authorship, and/or publication of this article.
Supplemental material
Supplemental material for this article is available online.