
Abstract
Previous studies have yielded contradictory results on the relationship between perception and production in second language (L2) phonological processing. We re-examine the relationship between the two modalities both within and across processing levels, addressing several issues regarding methodology and statistical analyses. We focus on the perception and production of the French contrast /u/–/y/ by proficient English-speaking late learners of French. In an experiment with a prelexical perception task (ABX discrimination) and both a prelexical and a lexical production task (pseudoword reading and picture naming), we observe a robust link between perception and production within but not across levels. Moreover, using a clustering analysis we provide evidence that good perception is a prerequisite for good production.
I Introduction
One of the difficulties for second language (L2) learners concerns phonological processing. It is well known that L2 sounds are often hard both to perceive and to produce. Yet, L2 learners can improve in both modalities, even though nativelike performance is very rarely achieved (for reviews, see Piske et al., 2001; Sebastián-Gallés, 2005). The possible interaction of perception and production in the acquisition of L2 sounds has been the topic of much research, yet no consensus has so far emerged. The aim of the present article is to shed new light on this issue by means of a study on the perception and production of the French vowel contrast /u/–/y/ by advanced English-speaking learners of French. We consider two questions: First, is performance in perception related to performance in production? Second, is accurate perception a prerequisite for accurate production? As to the first question, we will provide evidence for the hypothesis that perception and production are linked within but not necessarily across processing levels. Indeed, we find that performance on ABX discrimination (a prelexical task) can be predicted by performance in pseudoword reading (also a prelexical task) but not by performance in picture naming (a lexical task). As to the second question, using a clustering analysis on the results of the perception and production tasks, we will show that good perception is indeed a prerequisite for good production. Before introducing the design and hypotheses of our study, we will review previous work and discuss methodological issues that might obscure the true relationship between perception and production in this type of research.
1 Previous research
a Theoretical frameworks
Some major theories of speech learning and processing postulate a relationship between perception and production, explained by the fact that both modalities rely on common underlying mechanisms or representations. For example, in their multicomponent model of working memory, Baddeley and Hitch (1974) introduced the concept of the phonological loop which tightly links perception and production. They defined the phonological loop as a component of working memory that consists of two elements: a phonological store (linked to perception) and an articulatory rehearsal mechanism (linked to production). According to the theory, incoming sequences of sounds are first briefly retained in phonological or acoustic form in the phonological store and are then subvocally repeated by an articulatory rehearsal mechanism, allowing one to refresh the sounds’ decaying memory traces. Baddeley et al. (1998) and Atkins and Baddeley (1998) propose that the cycling of information between the two elements of the phonological loop is used to learn novel phonological forms of new words in the first language (L1) or second language (L2). Furthermore, Jacquemot and Scott (2006) subsequently adapted this theory to speech processing, arguing that the phonological loop arises from the cycling of information between the two buffers (phonological store and subvocal rehearsal mechanism), thus mediating between perception and production. Hence, whether seen as a device of word learning or as an element of the speech processing mechanism, the phonological loop presupposes a close link between perception and production.
A different theory, the Speech Learning Model (SLM; Flege, 1995), proposes that perception and production are linked because they share common underlying representations. In this theory, phonetic categories are long-term mental representations of acoustic features of speech sounds. Therefore, new phonetic categories for L2 sounds can be created by learners only once they are able to discriminate these sounds phonetically. L2 phonetic categories are acquired through the process of ‘equivalence classification’, during which L1 and L2 segments are compared: identical sounds will be learned easily, new sounds will cause more difficulty, and similar sounds will create most perceptual problems and will be very hard to acquire. Importantly, the L2 phonetic categories the learner acquires through perception act as targets that further guide the production of these sounds. Hence, the SLM postulates a close connection between perception and production, relying on the use of common, acoustically based phonetic representations.
Although the above cited theories provide different explanations for the perception–production link, they clearly emphasize that those modalities are not independent. Below we present an overview of psycholinguistic studies aimed at providing empirical evidence for the link between perception and production.
b Psycholinguistic studies
Many studies investigating the relationship between perception and production focused on a possible correlation between the two modalities. Flege and colleagues thus conducted a series of studies on the perception and production of vowels and consonants in a variety of languages and with participants with various levels of L2 proficiency and a number of different L1s (Flege, 1993, 1999; Flege et al. 1997; Flege and Eefting, 1988; Flege and Schmidt, 1995; Schmidt and Flege, 1995). In all of these studies, as well as more recent ones by other researchers (Baker and Trofimovich, 2006; Bettoni-Techio et al., 2007; Hattori and Iverson, 2009, 2010; Jia et al., 2006; Kluge et al., 2007; Zhang and Peng, 2017), a positive correlation between the two modalities was found, most often of modest size. Flege (1999) argued that while the correlation between perception and production might not be strong, it might also be underestimated in these studies due to methodological factors, such as the specific perception and production measures used. However, even when perception and production are correlated, they do not necessarily involve the same representations. For instance, in their study of the perception and production of the English /r/–/l/ distinction by Japanese learners, Hattori and Iverson (2010) found that production accuracy of the relevant acoustic cues does not correlate with perceptual sensitivity to these cues. Other studies, moreover, have failed to obtain a correlation between perception and production altogether. For instance, Peperkamp and Bouchon (2011) tested advanced French learners of English on the /i/–/ɪ/ contrast and found no signs of a correlation. Kartushina and Frauenfelder (2014) also found no correlation between the perception and production of French vowels by intermediate Spanish learners. Other studies have yet reported a correlation between perception and production for only some non-native sounds. For example, Levy (2009) and Levy and Law (2010) investigated the perception and production of three French vowel contrasts, /y/–/u/, /u/–/œ/ and /y/–/œ/, by three groups of American English learners of French, differing in L2 proficiency. Their results showed a correlation between perception and production across all proficiency groups for the /y/–/œ/ contrast, a correlation in all but the experienced learners for the /u/–/œ/ contrast, and no correlation in any of the groups for the /u/–/y/ contrast. Thus, it remains unclear which factors influence the strength and the very occurrence of a correlation between the two modalities.
A second set of studies investigated whether the development in one modality precedes the development in the other. Indeed, a common assumption regarding L2 phonological processing is that learners cannot produce L2 sounds accurately without perceiving them well. In Flege’s (1987, 1995) SLM, the accurate production of L2 sounds depends on their accurate perception: L2 speakers can learn to produce a non-native sound only if they have established in perception a new phonological category for it. Several experimental studies have yielded evidence in favor of this model, in that production lags behind perception. For instance, Flege (1993) found that experienced Taiwanese learners of English perceived the vowel duration cue to coda stop voicing in English as well as native speakers did, but failed to match the duration difference of native speakers in production. Focusing on beginning learners, Nagle (2018) examined the development over the course of one year of the perception and production of the Spanish /p/–/b/ contrast by native English speakers. He found that improvement in perception preceded improvement in the production of Spanish-like voice onset time (VOT) values for /p/ (but no relationship could be established with respect to the production of Spanish-like VOT values for /b/). Casillas (2019) examined the same question in a seven-week immersion program, and also observed that improvement in perception preceded that in production. 1 Some other studies, however, have reported an effect opposite to the one predicted by the SLM, namely that L2 speakers can have accurate production of a non-native contrast despite inaccurate perception. For example, Goto (1971) tested Japanese learners of English on their perception and production of English words containing /r/ and /l/ sounds, and found that even participants who achieved relatively high production accuracy still exhibited poor discrimination. Similar results for the same test case were obtained by Sheldon and Strange (1982). Flege and Eefting (1987) focused on Dutch learners of English, and observed a large increase in VOT during the production of English compared to Dutch voiceless stops but only a small shift in the perceptual boundary between English voiced and voiceless stops. Bohn and Flege (1997), in a study of German L2 speakers’ processing of the English vowel /æ/, also observed better production than perception. Other studies yet have obtained mixed effects, with more accurate perception for some sounds and more accurate production for others. For example, Hao and de Jong (2016) found that Korean learners of English show better perception than production of fricatives, but better production than perception of stops, suggesting that the L2 perception–production link is not monolithic. 2
Finally, the link between perception and production has also been examined in training studies. In conformity with the SLM, several of these studies show that specific perception training can result in improvement not only of the perception of the trained contrast but also of its production (Bradlow et al., 1997; Huensch and Tremblay, 2015; Lee and Lyster, 2016; Lengeris and Hazan, 2010; Motohashi-Saigo and Hardison, 2009; Okuno and Hardison, 2016; Rato and Rauber, 2015; Wong, 2013, 2015; see also the meta-analysis in Sakai and Moorman, 2018). However, while studies using production training are overall rarer, the inverse carry-over effect from production training to perception has been reported as well (Akahane et al., 1998; Kartushina et al., 2015). Moreover, an interference effect of production on perception training has also been observed: when participants overtly repeat the stimuli during perception training, the effect of training on their post-test perception performance is disrupted (Baese-Berk and Samuel, 2016).
To sum up, then, decades of research have not yielded a consensus concerning the relationship between perception and production in L2 speech sound processing. Some of this lack of consensus may be attributed to methodological issues in these studies. We turn to these issues now.
2 Methodological issues
The contradictory findings on the perception–production link might be explained to some extent by the methodological difficulty of assessing and comparing results from perception and production experiments (Elvin et al., 2016; Levy and Law, 2010). For one thing, results might differ even within a given modality, depending on the task. For instance, Mack (1989) compared the perception and production accuracy of early English–French bilinguals and English monolinguals on the English /d–t/ and /i–ɪ/ contrasts. In perception, she found that bilinguals performed differently from monolinguals in identification but not in discrimination. In a similar vein, Díaz et al. (2012) examined Dutch L2 learners’ processing of the English /æ/–/ε/ contrast, and found that a larger performance gap between native and non-native listeners in lexical decision and word identification than in categorization. This is likely due to the fact that different perceptual tasks tap into different processing levels, and are therefore not equally difficult. More specifically, while prelexical processing (e.g. the categorization task) only involves a phonetic analysis, lexical processing (e.g. the lexical decision task) is more complex as it additionally requires mapping the incoming speech signal onto phonological representations stored in memory (Pisoni and Luce, 1987). Thus, tasks that tap into different levels of processing require different skills and involve different amounts of cognitive load (Werker and Logan, 1985; Werker and Tees, 1984).
Furthermore, several tasks seem to involve both perception and production to some extent. On the one hand, as argued by Peperkamp and Bouchon (2011), certain perception tasks might be influenced by production, due to the automatic activation of a perception–production loop (Baddeley et al., 1984; Jacquemot and Scott, 2006). For instance, discrimination tasks require participants to retain stimuli in phonological short-term memory; provided the inter-stimulus interval (ISI) is not too short, this yields automatic covert rehearsal of the stimuli that are subsequently processed by the speech perception module. Similarly, identification leaves enough time for participants to subvocally rehearse the stimuli and process these covert productions before making a decision. On the other hand, production is sometimes assessed in an imitation or a repetition task (e.g. Flege and Eefting, 1988; Flege et al., 1999; Jia et al., 2006; Kartushina and Frauenfelder, 2014; Levy and Law, 2010), both of which arguably contain a perception component. Hao and de Jong (2016) specifically raised the question of whether imitation is a better reflection of production or perception skills. They argued that although at first sight imitation seems to be a production task based on auditory prompts, it can also be viewed as a perception task with a verbal response. Focusing on English learners of Mandarin and Korean learners of English, they found that accuracy in L2 imitation is not always constrained by accuracy in either identification or reading. They concluded that L2 imitation may not involve all the skills required by the perception and the production tasks and probably bypasses some aspect of phonological encoding. Llompart and Reinisch (2019) similarly examined the relationship between imitation and both perception and production in L2 learners. They showed that German learners of English’ ability to imitate a difficult English contrast was related to their perception of this contrast as assessed by an identification task, but not to its production as assessed by a word reading task. These results were interpreted as being largely due to the fact that the imitation and perception tasks were both prelexical, whereas the production task was lexical. Specifically, the authors argued that L2 learners can have inaccurate lexical representations despite having accurate phonetic category representations.
Measuring accuracy in L2 remains problematic even after choosing the most appropriate tasks to test perception and production. Performance in perception typically depends not only on how well the target contrast is perceived, but also on factors such as cognitive control, memory, and attention. Adding a native control contrast provides an individual baseline for performance (e.g. Peperkamp and Bouchon, 2011; Sebastián-Gallés and Baus, 2005), but when an individual accuracy score needs to be computed – as is the case for correlation studies – the question arises as to how this baseline should be taken into account. For example, Peperkamp and Bouchon (2011) carried out linear regressions between the perception and production scores of bilingual participants and included the scores on the control condition in perception as a covariate. They also carried out an additional analysis where they used individual difference scores for perception, defined as the error rate on the experimental contrast minus that on the control contrast. An alternative way to take into account the performance on the control contrast is to include the native participants’ data in the modeling, with native language entered as a fixed effect.
For production tasks, the problem consists in deciding what the dependent measure should be. One possibility is to obtain nativelikeness scores from judgments made by native speakers. But what should these judges listen to? Individual target sounds excised from recordings are often too short to be judged by native speakers, while larger portions might induce a judgment of the overall accent rather than of the target sound’s accuracy. Even when asked to focus only on the target sound, the judges could be biased by the global accent of the L2 speaker, depending on their capacity to abstract away from it (cf. discussion in McCullough, 2013). In addition, providing full words as input might introduce a lexical bias in their judgments.
A different way of evaluating L2 production accuracy is by carrying out acoustic measurements of the recorded stimuli. A common assumption is that a greater acoustic distinctiveness of a non-native contrast implies a better command of L2 (Kartushina and Frauenfelder, 2014; Tsukada et al., 2005). The distinctiveness between two vowels is commonly measured as their acoustic distance in the F1 × F2 vowel space. However, the choice of a measure of acoustic distinctiveness is not straightforward. Many previous studies used the Euclidian distance to estimate the distance between the centroids (means) of the two category distributions in the F1 × F2 acoustic space (e.g. Chandrasekaran, 2010; Lengeris, 2016; Tsukada et al., 2005). This method disregards both duration and formant dynamics, and has the further disadvantage that it does not take into account the shape of the distributions. That is, it ignores information on category variance and overlap. Some recent studies have addressed this problem by using Mahalanobis distance, a unitless measure that captures the distance between a point and a distribution in terms of the number of standard deviations the point is from the distribution’s mean (Mahalanobis, 1936). This metric can be used to estimate the distance between two vowel distributions by summing the individual distances between each exemplar of each category and the distribution of the other category (Kartushina and Frauenfelder, 2014; Renwick and Ladd, 2016). Finally, one more methodological aspect of acoustic measurements concerns the scale used to represent formant frequencies. A simple linear frequency scale does not reflect human perception accurately, as the frequency response of the human ear is somewhat logarithmic (Sawusch, 2005). Moreover, F2 has been shown to contribute more to the identification of vowels than F1 (Delattre et al., 1952). Transforming the Hertz scale into a psycho-acoustical scale such as the Bark or mel scale allows for a more accurate measurement of production accuracy.
Thus, whether evaluating perception or production data, one must consider a range of issues and make non-trivial methodological decisions. This difficulty in assessing performance is even more striking for studies comparing perception and production, as the tasks used to assess each of them might not be of equivalent difficulty for L2 speakers. For instance, the task in one domain might be cognitively more demanding than the task in the other, as when different processing levels are involved. This is often the case, with perception being typically tested with a prelexical task and production with a lexical task. Similarly, target sounds are not always presented in the same phonetic contexts in the perception and production tasks, despite the fact that task difficulty can depend partly on the surrounding sounds (e.g. Levy and Law, 2010; Strange et al., 2001).
II Current study
We address some of the above-mentioned methodological issues in order to obtain more precise and comparable measures for perception and production accuracy, and further investigate the hypothesis that perception and production in L2 phonological processing are related. Our case study concerns the perception and production of the French /u/–/y/ contrast (as in pouce ‘thumb’ – puce ‘flea’) by highly proficient English-speaking late learners of French. The contrast between the vowels /u/ and /y/ has been reported to be one of the most difficult ones for (American) English speakers to perceive (Levy and Strange, 2008) and produce (Levy and Law, 2010).
To assess production, we use both a prelexical and a lexical task (pseudoword reading and picture naming, respectively). Since neither duration nor formant trajectories are important intrinsic aspects of the production of French oral vowels, we assess accuracy by measuring Mahalanobis distance between F1 and F2 midpoint measures in the Bark scale, comparing performance of the late learners to that of a control group of native French speakers. To assess perception, we use a prelexical task (ABX discrimination), and compare performance on the test contrast both to that of a series of control contrasts and to that of the control group of native French speakers. We also manipulate the ISI in this task in order to examine the role of the automatic activation of the perception–production loop when stimuli are coded in phonological short-term memory. That is, we use both a short and a long ISI, with only the latter allowing participants to subvocally rehearse the stimuli and process these covert productions before making a decision.
We evaluate the relation between perception and production both within and across processing levels. Specifically, using mixed-effects modeling, we examine the link between performance on the prelexical perception task and performance in the prelexical production task (within-level comparison) on the one hand, and that in the lexical production task (across-level comparison) on the other hand. We predict a relationship between perception and production for the within-level comparison in the long but not in the short ISI condition, but not necessarily for the across-level comparison.
Additionally, we address the question of whether good perception is a necessary condition for good production, as stated by the SLM. In particular, we use a clustering algorithm to divide the late learners into relatively good and bad perceivers and relatively good and bad producers, based on their performance on each of the tasks. This method allows us to assess the relative performance of the individual learners in perception and production compared to the overall group performance, thus avoiding the problem of task comparability. Following the SLM, we predict that more participants will fall within the clusters of good perceivers and bad producers than within the clusters of bad perceivers and good producers.
III Methods
The experiment consisted of one perception task, i.e. ABX discrimination, and two production tasks, i.e. pseudoword reading and picture naming. In the ABX discrimination task, we tested participants’ perception of the French /u/–/y/ contrast and compared it to their perception of a series of control contrasts, i.e. /a/–/i/, /a/–/e/, /o/–/i/, and /e/–/o/. In order to ensure that the task would be hard enough for our target group of highly proficient L2 learners, we used relatively long, trisyllabic stimuli and made the syllabic position of the experimental contrast vary across trials, such that participants’ attention would not be drawn to one particular syllable position over the course of the experiment.
In the pseudoword reading task, we used the same pseudowords as those in the perception task, thus making it directly comparable to the perception task. As this task used both the same items and tapped into the same, prelexical, processing level as the perception task, it provides the strongest case for testing the hypothesis that perception and production are linked in L2 speech sound processing. Finally, in the picture naming task, we used pictures of objects whose names contain /u/ or /y/ for the test items and pictures of objects whose names do not contain /u/ and /y/ for the filler items.
1 Participants
Nineteen English-speaking late learners of French, 16 women and three men aged between 20 and 35, participated. They were native speakers of American or British English who had started to learn French between the ages of 4 and 27 (mean: 12.9 years). They were all proficient speakers of French, and had been living in France for at least one year (mean: 4.58 years). A questionnaire based on the bilingualism dominance scale (Dunn and Fox Tree, 2009) was used to quantify language dominance. This questionnaire examines frequency and domains of use, age of acquisition, and the age at which they felt comfortable speaking each language. The resulting dominance score can range from –30 to +30, with 0 indicating perfect balance and a score lower than –5 or higher than +5 being interpreted as dominance in French or English, respectively. Individual dominance scores for these participants ranged from +5 to +23 (mean: +17.6); thus, all participants were English-dominant, most of them substantially so. Participants also completed a questionnaire to self-evaluate their speaking, listening, reading, vocabulary and grammar skills in both languages, on scales from 1 to 10. For all aspects, participants scored themselves higher for English (mean: 9.8) than for French (mean: 7.1).
In addition, 11 native French speakers from France, eight women and three men aged between 20 and 29, participated as controls. None of the participants reported a history of speech or language problems. They were all paid a small fee for their participation.
2 Stimuli
For the ABX discrimination task, we created 48 pairs of trisyllabic French CVCVCV pseudowords differing only in a vowel (e.g. /vepuba/–/vepyba/) (the full list of stimuli is provided in Appendix, part A in the supplemental material). For half of the pairs (test), the vowel contrast was /u/–/y/; for the other half (control), it was one of /a/–/i/, /a/–/e/, /o/–/i/, and /e/–/o/. The vowel contrast appeared in either the first, the second, or the third syllable. For the test contrast, the crucial vowels were preceded by an alveolar consonant (/t/, /d/, /n/) in half of the pairs and by a bilabial consonant (/p/, /b/, /m/) in the other half. 3 Three native speakers of French, two women and one man, recorded the stimuli in a soundproof booth, at 16 bits mono with a sampling rate of 44.1 kHz. The mean duration of the stimuli was 686 ms.
For the pseudoword reading task, we used the test pairs from the perception task, i.e. the ones containing the /u/–/y/ contrast. Stimuli were written in appropriate French orthography, e.g. vépouba for /vepuba/ and vépuba for /vepyba/.
For the picture naming task, we selected 120 color pictures of objects, the French names of which were likely to be familiar to all participants. Thirty of these names contained /u/, 30 /y/, and 60 neither of these vowels (the full list of stimuli is provided in Appendix 1, part B in the supplemental material). 4 The lists were matched in terms of number of syllables and frequency.
3 Procedure
a ABX discrimination
Participants were presented in each trial with three trisyllabic items, the first two produced by the two female speakers and the third one by the male speaker. 5 Their task was to determine whether the last item (X) was identical to the first (A) or to the second one (B). There were 192 trials divided over four blocks. In each block, half of the trials featured the test /u/–/y/ contrast, the other half one of the control contrasts (/a/–/i/, /a/–/e/, /o/–/i/, or /e/–/o/). The identity of X and the correct response (A or B) were counterbalanced, and the trials were presented in a pseudo-random order, such that no more than three trials of the same type (test or control) or with the same correct response (A or B) would appear in a row. In each block the ISI was either 150 ms (henceforth: short ISI) or 1,000 ms (long ISI). 6 The ISI block types alternated. Half of the participants started with a short ISI block, the other half with a long ISI block. Participants could take a short break in between blocks.
Each block started with a practice phase of five trials, during which participants received feedback as to whether their responses were correct. In the case of an incorrect response or no response within 2,500 ms of the stimulus offset, the trial was repeated until the correct response was given. During the test phase, participants received no feedback and if they did not respond within 2,500 ms the next trial was presented. A silent interval of 1,000 ms separated the participant’s response or the time-out from the presentation of the next stimulus.
b Pseudoword reading
The 48 items used in the test trials of the discrimination task (half containing /u/, the other half /y/) were embedded in a carrier sentence: Je dis __ deux fois /ʒədi _ døfwa/, ‘I say __ twice’. These sentences were presented on a computer screen in a pseudo-random order, such that no more than three sentences containing items with the same target vowel appeared in a row. Participants were asked to read them as naturally as possible, and to press a button to proceed from one sentence to the next.
c Picture naming 7
The 120 pictures were presented one by one on the screen in a pseudo-random order, such that no more than three objects with the same target vowel in their name appeared in a row. Participants were asked to name the object they saw and to press a button to proceed to the next picture.
IV Results and discussion
We first present the results for the production tasks. We then present together the results for perception and for the relationship between the two modalities, using a single regression model to analyse these aspects simultaneously. 8
1 Production
All recordings were checked for the absence of noise (e.g. coughs, sneezes, etc.), recording failures, and productions that differed from the target (i.e. names that did not correspond to the designated image in naming, and pseudowords produced with erroneous sounds in reading). A total of 1.5% of the recordings were thus discarded.
The waveform and the wideband spectrogram of the production data were visualized, and target vowels were segmented at zero crossings. After segmentation, the mean values of the first two formants (F1 and F2) at the acoustic midpoint of each token were automatically extracted using Praat (Boersma and Weenink, 2013). These formant values were then Bark-transformed. Outliers more than 2.5 standard deviations from the by-talker by-vowel mean were discarded (3.9% of the datapoints). Vowel plot summaries for each participant are shown in Figure 1. 9

Bark-transformed first and second formant frequencies of /u/ and /y/ produced by 19 late learners (top) and 11 native speakers (bottom) in reading.
In order to measure the acoustic distance between the /u/ and /y/ categories we used the Mahalanobis distance metric, which measures the number of standard deviations from a point to the mean of a distribution. For each vowel contrast for each participant, we computed the mean Mahalanobis distance between each token and the distribution of the other category. Thus, for every participant we obtained the mean Mahalanobis distance from each /u/ token to the entire /y/ category and from each /y/ token to the entire /u/ category. Finally, we summed these two distances to obtain an individual measure of the distance between the two categories. A larger distance is indicative of a better separation between the two vowels, and, by hypothesis, of a higher production accuracy. The mean individual distance scores are shown in Figure 2.
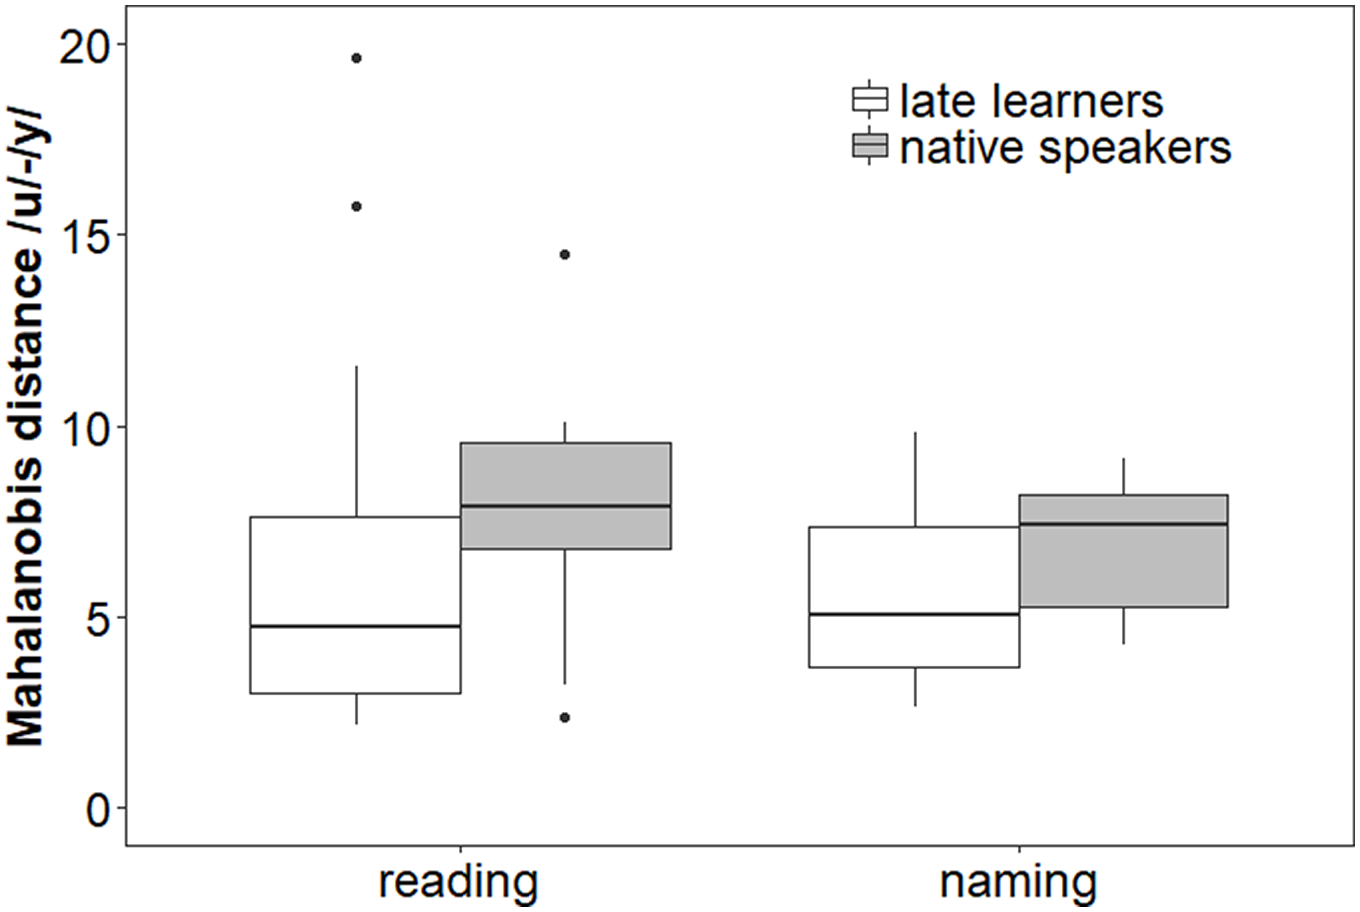
Boxplots of Mahalanobis distance scores between the categories /u/ and /y/ produced by late learners and native speakers in pseudoword reading and picture naming.
Mean Mahalanobis distance scores in the pseudoword reading task for late learners were not significantly different from scores for natives in a Welch t-test (learners: mean = 6.41, SD = 4.78; natives: mean = 7.9, SD = 3.32; t(26.90) = 1.00, p > 0.5, d = 0.34). In picture naming, the difference between the mean production scores of the two groups was not significant either (learners: mean = 5.57, SD = 2.22; natives: mean = 6.87, SD = 1.76; t(25.07) = 1.77, p > 0.5, d = 0.63).
These findings are unexpected, although the numerical trends accord with our expectation that the French participants have more distinct /u/ and /y/ categories than the late learners. One explanation for the lack of a significant difference between the groups might be that the late learners are close to native-like. Their relatively high score on the bilingual dominance scale and their self-evaluations mentioned above, however, suggest otherwise. Alternatively, it might be attributed to differences in speech rate. In particular, if the native French speakers spoke faster than the late learners, this would have caused a reduction of their vowel space, i.e. the displacement of vowels towards the center of the acoustic F1×F2 space (Lindblom, 1963; Nadeu, 2014), and hence a reduced distance between their /u/ and /y/ categories. In order to test this hypothesis, we measured the duration of each target vowel produced by the participants, and carried out Welch t-tests to compare the duration of tokens of native speakers to those of late learners. In both reading and naming, tokens of /u/ and /y/ produced by native speakers were significantly shorter than those produced by late learners (readingnatives: mean = 96 ms, SD = 44 ms; readinglearners: mean = 125 ms, SD = 55 ms; t(24.84) = 3.44, p = 0.002, d = 1.23; namingnatives: mean = 88 ms, SD = 39 ms; naminglearners: mean = 112 ms, SD = 51 ms; t(27.18) = 3.96, p < 0.001, d = 1.26). Thus, the lack of a significant difference between the late learners and the native speakers might indeed be due to the native speakers’ overall fluency, leading to a higher speech rate which likely caused their vowels to become more central overall.
2 Perception and its relationship with production
Figure 3 shows mean accuracy scores in the ABX discrimination task for the late learners and the native speakers, split by ISI condition (short vs. long) and vowel contrast (/u/~/y/ vs. control). Scatter plots of the relationship between performance in the ABX task and that in both production tasks can be found by following the link: http://cognitivetraining.epizy.com/Graphs/Graphs_supplementary_materials.pdf.
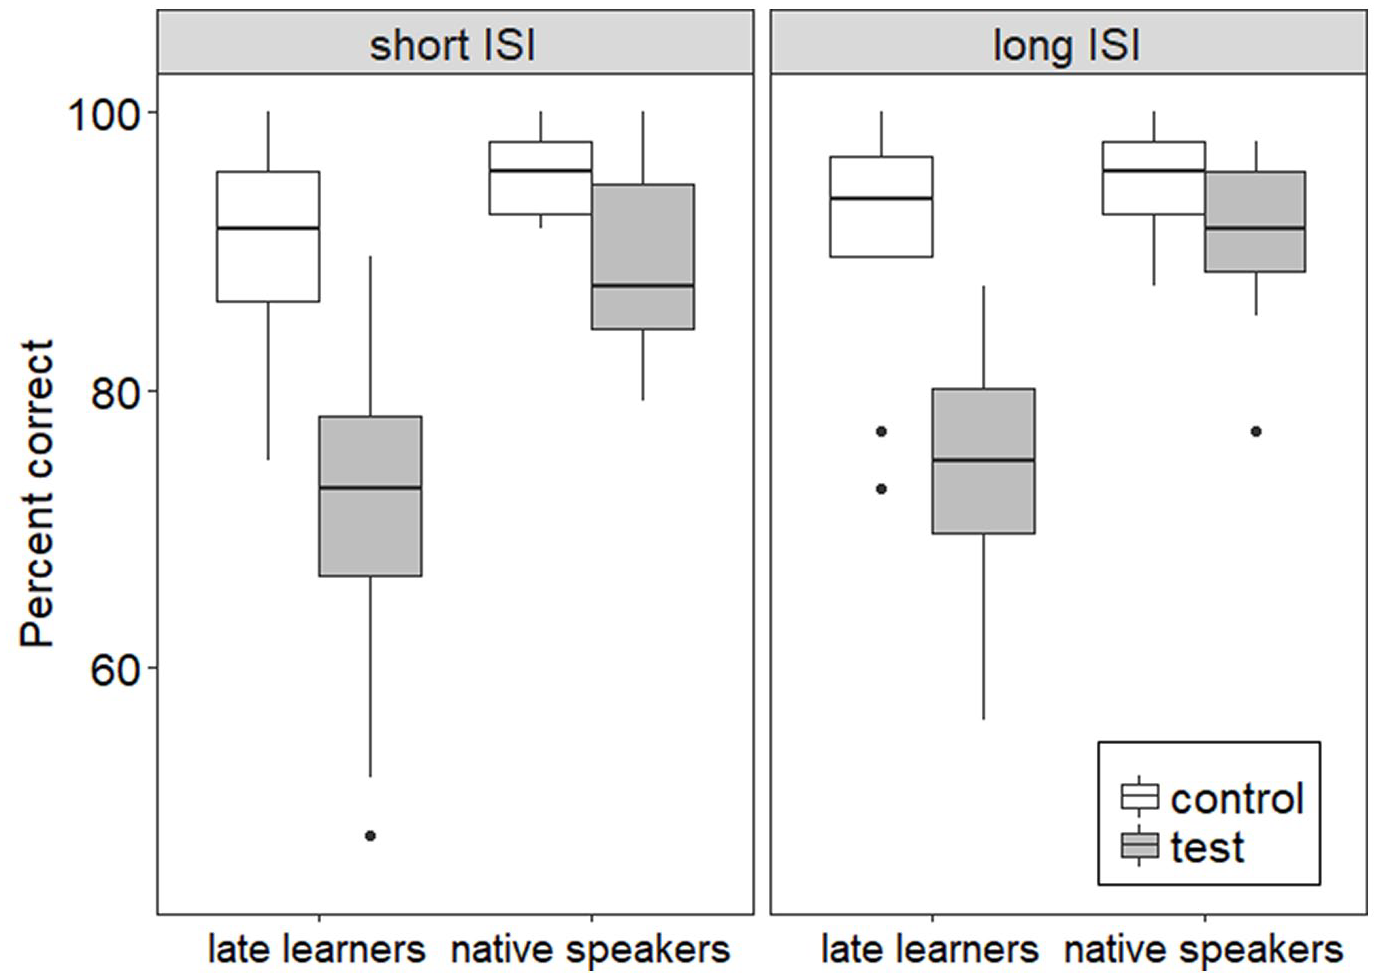
Boxplots of percent correct responses in the ABX discrimination task for late learners and native speakers in the short inter-stimulus interval (ISI) (left panel) and long ISI (right panel) conditions.
We analysed these data using logistic mixed effects regression modeling. Crucially, we included the production scores from the pseudoword reading and the picture naming tasks, respectively, as fixed effects in two separate models. For each model, a significant effect of production score would be evidence for a link between perception and production. The R package lme4 (Bates et al., 2014) was used to carry out these analyses. Effect-size estimates were obtained using the MuMIn package (Barton, 2018).
Our procedure for model construction followed the stepwise algorithm outlined in Turnbull (2017). We started the analysis with a null model that included our binomial dependent variable (ABX Accuracy), and Participants and Items as random intercepts. The predictor variables that we tested were Contrast (test vs. control), Group (late learners vs. native speakers), ISI (short vs. long), and production score (either pseudoword reading score or picture naming score, depending on the model). The three categorical independent variables were contrast-coded. At each step, we tested for each predictor variable not yet present in the model whether the model would improve if it was added. We evaluated each added effect using likelihood-ratio tests. At the end of each step, the effect with the lowest p-value below .05 was added to the model. We then repeated this process with the larger model with the remaining predictor variables until no effects gave a significant model improvement. At each step, if main effects were retained in the model, we tested for an interaction between them.
In the model using pseudoword reading as a measure of production accuracy, the optimal model returned main effects of Reading Accuracy, Contrast, and Group, and an interaction between Contrast and Group (Table 1). Native French participants performed better than late learners (learners: mean = 82.3%, SD = 38.2%; natives: mean = 92.6%, SD = 26.2%) and performance was better on the control contrasts than on the /u/–/y/ test contrast (test: mean = 79.5%, SD = 40.3%; control: mean = 92.6%, SD = 26.1%), but the difference in performance between test and control contrasts was smaller for native speakers than for late learners. An effect of Reading Accuracy was observed, with higher production scores predicting higher perception accuracy. This means that performance in pseudoword reading was a good predictor of discrimination accuracy. Moreover, the absence of an interaction of Reading Accuracy with either Group or Contrast indicates that the relationship between perception and production was not restricted to the native speakers or the test contrast, respectively. 10 Thus, perception and production were linked in both the late learners and the native speakers, and this link held for both the discrimination responses on the /u/–/y/ test contrast and those on the control contrasts. By contrast, the absence of an interaction between ISI and Reading Accuracy in the final model indicates that, contrary to our prediction, this relationship was not modulated by ISI.
Coefficients and log-likelihood comparisons for each retained fixed effect, in the model where the measure of production accuracy was performance in pseudoword reading and the dependent variable was ABX Accuracy.
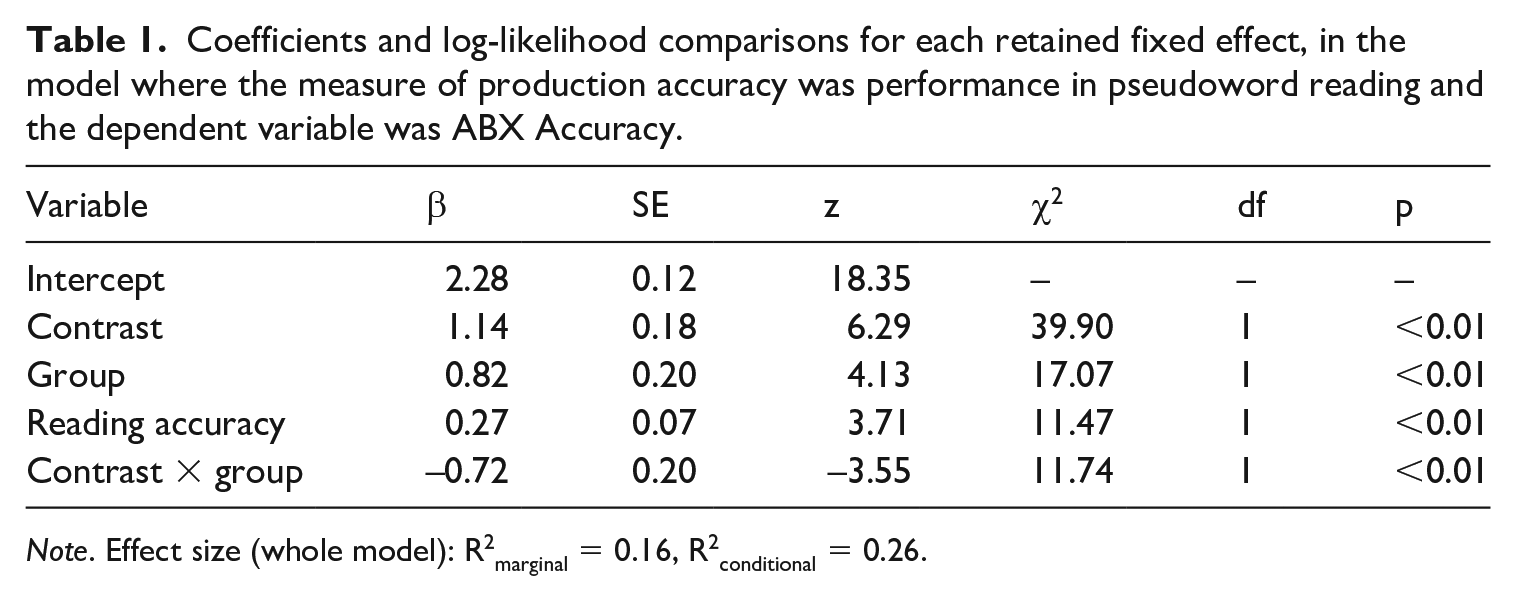
Note. Effect size (whole model): R2marginal = 0.16, R2conditional = 0.26.
In the model using picture naming as a measure of production accuracy, the final model included main effects of Contrast and Group, as well as their interaction (Table 2). Crucially, Naming Accuracy was not retained in the final model. From this we infer that there was no relationship between picture naming and discrimination accuracy. Note that if there was a relationship between the perception and production in the late learners only or for one contrast only we should have observed an interaction between Naming Accuracy and Group or Contrast. 11 Thus, no relationship between perception and production was observed in either the late learners or the native speakers of French, regardless of whether the discrimination responses concerned the test or the control contrasts.
Coefficients and log-likelihood comparisons for each retained fixed effect, in the model where the measure of production accuracy was performance in picture naming and the dependent variable was ABX Accuracy.
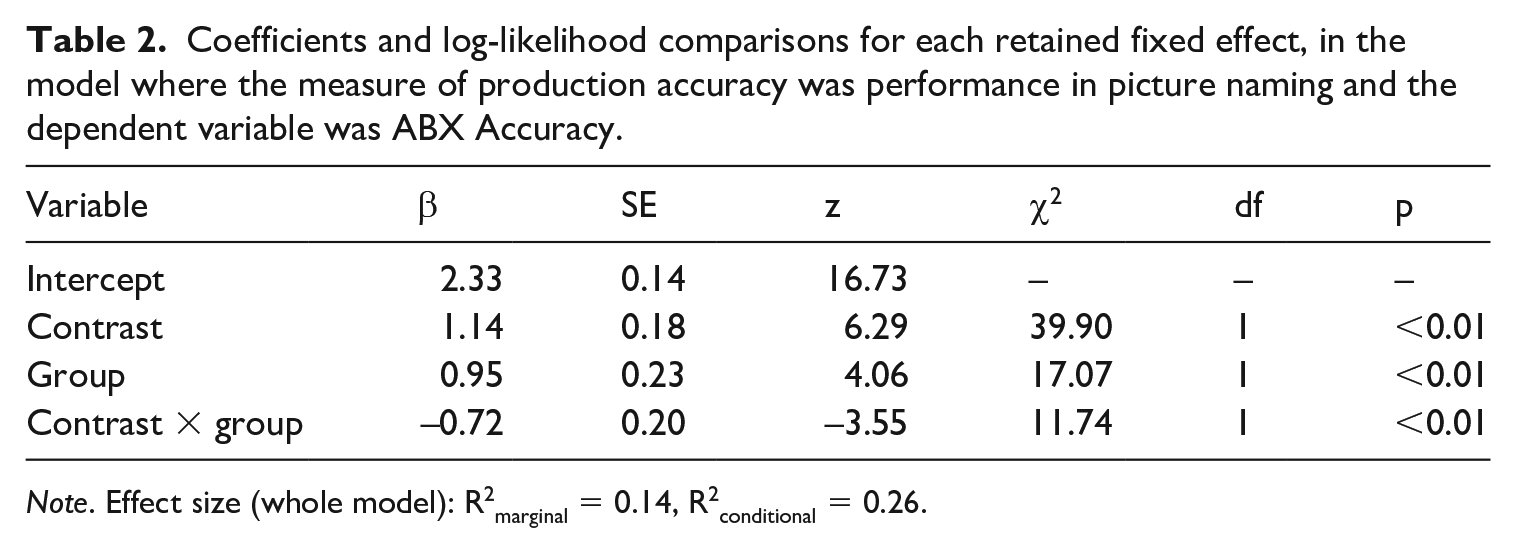
Note. Effect size (whole model): R2marginal = 0.14, R2conditional = 0.26.
3 Clustering
In order to classify the late learners into relatively good and bad perceivers and relatively good and bad producers, we carried out separate clustering analyses on the discrimination, reading and naming data. We used non-hierarchical k-means clustering to group the participants into two groups according to their performance. For production, we entered two scores, i.e. the performance in pseudoword reading and the performance in picture naming. For perception, we entered one score, i.e. the mean of performance on short and long ISIs in the test condition. For pseudoword reading and for naming, participants with a minimum mean Mahalanobis distance of 6.35 and 6.85, respectively, were classified as showing relatively good performance, and those with a maximum mean Mahalanobis distance of 4.71 and 5.48, respectively, as showing relatively bad performance. For perception, participants with a minimum mean accuracy score of 70% were classified as showing relatively good performance, and those with a maximum mean accuracy score of 65% as showing relatively bad performance. Finally, based on the obtained clusters we superimposed the proficiency groups in the perception task and each of the production tasks, assigning the participants to one of the following groups: good perception and good production; good perception and bad production; bad perception and good production; bad perception and bad production (Table 3).
Number of late learners in each class according to their performance in the perception and production tasks.

Regardless of the production task under consideration, we found that the majority of late learners belonged to one of three groups: those with good production and perception; those with bad production and perception; and those with bad production but good perception. Of interest is the fact that while several late learners belonged to the good perception / bad production group (6 in the reading task and 8 in the naming task), only one of them was assigned to the bad perception / good production group (in both reading and naming). 12
Thus, with one exception, late learners who were good in production were also good in perception, while only about half of those who were good in perception were also good in production. Aside from the one exception, these results are in accordance with the central claim of the SLM (Flege, 1987, 1995) that accurate perception of an L2 sound is a prerequisite for its correct production.
V General discussion
Investigating the relationship between perception and production in L2 phonological processing is all but straightforward. The specific tasks used to assess perception and production, the measure by which production accuracy is evaluated, the presence of a control contrast and/or group, and the statistical methods used to analyse the data all require non-trivial choices to be made. Here, we focused on the French vowel contrast /u/–/y/, and tested proficient English-speaking L2 learners of French in a design aimed at obtaining more precise and comparable measures for perception and production accuracy. For perception we used a prelexical task, ABX discrimination, with the /u/–/y/ test contrast and a series of different vowel contrasts as control. For production, we used both a prelexical task, pseudoword reading (using the same items as those in ABX discrimination), and a lexical task, picture naming, and measured the Mahalanobis distance between /u/ and /y/ in the Bark scale to assess accuracy. In all tasks, we compared performance of the late learners to that of a control group of native French speakers. Using mixed-effects modeling, we found evidence for a relationship between perception and production within but not across levels: prelexical pseudoword reading, but not lexical naming, was a good predictor of accuracy in prelexical ABX discrimination. In addition, we tested whether good perception is a prerequisite for good production. Using a clustering algorithm, we found evidence that this is indeed the case. Before discussing the results regarding the relation between perception and production, we comment on the production and the perception results separately.
As to the production accuracy of late learners versus native speakers of French, we obtained mixed results. We expected late learners to produce /u/ and /y/ less accurately than native French speakers (with less distance between the two vowels in the acoustic space) and hence, to have less distinct /u/ and /y/ categories, as observed earlier with a repetition task by Levy and Law (2010). However, in both pseudoword reading and picture naming the difference between native speakers and late learners did not reach significance. A post-hoc analysis of token durations showed that compared to the late learners, the native French participants produced significantly shorter tokens of /u/ and /y/. This means that the distance between those vowels in French productions was likely reduced, as vowels typically become more central at increased speech rates. Thus, the lack of difference between the productions of native speakers and late learners could be explained by a difference in speech rate. This issue with the performance of control participants should be taken into account in further studies. For pseudoword reading this could be done by using a metronome to pace participants’ speech rate (Kittredge and Dell, 2016; Motohashi-Saigo and Hardison, 2009). For picture naming, where stimuli differ in length and familiarity, a more ecological solution would be to take into account individual relative speech rates, by having both a normal and a fast speech condition for each participant; the comparison of recordings at both speech rates would allow one to take into account the possible reduction processes that occur in faster speech (Nadeu, 2014; Schmidt and Flege, 1995).
In perception, the late learners were overall less accurate than the native French speakers, and their performance was 18.1 percent point worse on the test contrast /u/–/y/ than on the control contrasts. This reflects the strong effect of the listeners’ native language on their phonological categorization. The native speakers also had more difficulty with the test contrast, on which they performed somewhat less accurately than on the control contrasts (the difference in accuracy between the two conditions was of 4.6 percent point). This is unsurprising, as /u/–/y/ is acoustically a smaller contrast than any of the control contrasts /a/–/i/, /a/–/e/, /o/–/i/, and /e/–/o/. The results on the late learners are consistent with the findings of Levy and Strange (2008), who examined the perception of French vowels by American English listeners with and without French language experience. In their study, both groups of American English listeners performed worse than French control participants. Moreover, for the experienced group the /u/–/y/ contrast was the most difficult one (the other test contrasts were /i/–/y/, /u/–/œ/, and /y/–/œ/). 13
Turning now to the link between perception and production in the late learners, we observed – as predicted – a relationship between discrimination and pseudoword reading. We consider this relationship to be reliable and robust: not only do the two tasks tap the same, prelexical, processing level, we also implemented them using the same items. Thus, we obtained comparable measures for assessing the participants’ performance in the two modalities. 14 This result contrasts with that of Levy and Law (2010), who also used the same items in perception and production but found no direct link between the two modalities. Their participants, though, had varying levels of French proficiency (from none to advanced), and their tasks were different: mapping of French vowels onto the closest English ones in perception, and pseudoword repetition in production. Interestingly, the link between perception and production observed in the present study held for both the discrimination responses on the test contrast and those on the control contrasts; that is, /u/–/y/ production accuracy was predicted by discrimination accuracy of not only the same /u/–/y/ contrast but also different vowel contrasts. In other words, the interrelation between the modalities did not hinge upon the use of the same contrast, and, a fortiori, of the same set of test items. By contrast, we observed no direct link between discrimination and picture naming, suggesting that the prelexical and lexical processing levels are to a certain extent independent, and that the perception–production relationship can be restricted to a specific level. The lack of a perception–production link when tested across levels could be explained by the fact that tasks tapping into different levels of processing might not be directly comparable as they involve different skills with different amounts of cognitive load and require access to different types of representation. Specifically, while pseudoword reading might be of similar difficulty as ABX discrimination, as both only involve phonetic and phonological analysis, a lexical task such as picture naming might be more difficult as it additionally requires mapping the incoming speech signal onto phonological representations of words stored in memory (Pisoni and Luce, 1987), which can, moreover, be less accurate than phonetic category representations (see Llompart and Reinisch, and references therein).
The relationship between discrimination and reading was not moderated by ISI. We had chosen the ISIs such that the long but not the short ISI condition allowed for a complete activation of the perception–production loop (Baddeley et al., 1984; Jacquemot and Scott, 2006), i.e. for participants’ automatic, subvocal rehearsal of the stimuli and their processing of these covert productions prior to decision making. The absence of a moderator effect of ISI indicates that the perception and production link does not hinge upon the activation of participants’ production module during the discrimination task, contrary to a suggestion by Peperkamp and Bouchon (2011). Of course, it is still possible that the perception–production loop plays a role during the process of L2 phonological learning and hence in the origin of the relationship in L2 learners.
Finally, the clustering analysis showed that more than half of the participants were relatively good or relatively bad at both modalities (12 out of 19 when perception was compared to reading and 10 out of 19 when perception was compared to naming), confirming that there is indeed a direct relationship between perception and production. More importantly, it also showed that among the remaining participants good production very rarely occurs in the absence of good perception while good perception often occurs in the absence of good production. This result is most consistent with the Speech Learning Model (SLM; Flege, 1987, 1995), according to which accurate perception is a necessary condition for accurate production. Thus, the relationship between perception and production can vary according to the learning stage. For instance, it is possible that the modalities are aligned at the beginning of learning (‘bad perception and bad production’), but that perception improves faster at the early stages. Thus, production would lag behind perception (‘good perception and bad production’) but eventually catch up with it (‘good perception and good production’). This explanation is in accordance with Nagle (2018) and Casillas (2019), which demonstrated a time-lagged perception–production relationship, whereby improvements in perception preceded improvements in production, suggesting a delayed alignment of performance in the two modalities. Another interpretation of our results could be that there is variability among participants, in that some develop their perception and production skills in parallel, whereas others lag behind with production. While further research is needed to disentangle these two explanations, our results point to the fact that during periods of the asynchronic development of modalities, it is perception that precedes production, and not vice versa.
Our main result on the relationship between perception and production is in agreement with a number of previous studies (Bettoni-Techio et al., 2007; Flege, 1993; Flege et al., 1997, 1999; Flege and Schmidt, 1995; Hattori and Iverson, 2009, 2010; Jia et al., 2006; Kluge et al., 2007; Schmidt and Flege, 1995; Zhang and Peng, 2017). However, it contrasts with several others (Kartushina and Frauenfelder, 2014; Levy and Law, 2010; Peperkamp and Bouchon, 2011). Why some studies observed a relationship and others did not remains an open question. In particular, it is not the case that all of the former and none of the latter used comparable tasks and stimuli across the two modalities, as we would expect based on our own results. Rather, the presence vs. absence of a link between perception and production probably hinges on a host of factors, only some of which are methodological. For instance, there might be differences in the relation between perception and production according to the type of L2 sounds (consonants vs. vowels, or sounds that have a close L1 counterpart vs. those that do not; Bohn and Flege, 1997), or the general level of L2 proficiency (Levy, 2009; Levy and Law, 2010). Another factor that has often been suggested is L2 speakers’ motivation – or lack thereof – to reduce their foreign accent (Bohn and Flege, 1997; Flege, 1999; Mack, 1989; Sheldon, 1985).
Similarly, the result of our clustering analysis that good perception is a prerequisite for good production seems to be in accordance with some previous studies (Flege, 1993; Nagle, 2018), but not with others (Bohn and Flege, 1997; Goto, 1971; Flege and Eefting, 1987; Sheldon and Strange, 1982). However, in order to assess the issue of whether the ability to perceive L2 sounds develops before the ability to produce them, it can be more insightful to consider individual rather than group performance. For instance, Flege (1993) observes that while in his study L2 learners’ perception was overall better than their production, at the individual level participants were about equally divided between those having better perception and those having better production. Examining perception and production in beginning L2 learners over the course of one year, Nagle (2018) found that improvement in perception generally precedes improvement in production, but he likewise observed a lot of variability at the individual level. Goto (1971) and Sheldon and Strange (1982) also analysed individual data; modulo the fact that they had few participants (11 and 6, respectively), their results do provide evidence for better production than perception in L2 phonological processing. This, then, clearly contrasts with the present data, where we used a clustering analysis to examine individual performance.
To conclude, using well-controlled experimental conditions, we provided robust evidence for a relationship between the prelexical perception and production of the French /u/–/y/ contrast by English advanced learners of French. The methodological framework we developed for studying the relationship between the two modalities can be used in further studies, focusing on other languages, other types of contrasts, and other profiles of L2 learners. Future research could also concentrate on lexical processing, comparing, for instance, naming and lexical decision. At least for the case of English learners’ processing of the French /u/–/y/ contrast, we expect the performance on one task to be a could predictor for the performance in the other, provided the same items are used in the two tasks.
Supplemental Material
sj-pdf-1-slr-10.1177_0267658320988061 – Supplemental material for On the relationship between perception and production of L2 sounds: Evidence from Anglophones’ processing of the French /u/–/y/ contrast
Supplemental material, sj-pdf-1-slr-10.1177_0267658320988061 for On the relationship between perception and production of L2 sounds: Evidence from Anglophones’ processing of the French /u/–/y/ contrast by Gerda Ana Melnik-Leroy, Rory Turnbull and Sharon Peperkamp in Second Language Research
Footnotes
Acknowledgements
We would like to thank Claire Barrault, Charlotte Hauser and Guillaume de Longuemar for recording the stimuli, and Mathilde Mus for her assistance during the preparation of the experiment.
Declaration of conflicting interests
The author(s) declared no potential conflicts of interest with respect to the research, authorship, and/or publication of this article.
Funding
The author(s) disclosed receipt of the following financial support for the research, authorship, and/or publication of this article: This research was supported by grants from the Agence Nationale de la Recherche, France (grant numbers ANR-17-EURE-0017 and ANR-17-CE28-0007-01) and a Postdoctoral Fellowship Grant from Vilnius University, Lithuania, to Dr Gerda Ana Melnik-Leroy.
Supplemental material
Supplemental material for this article is available online.
Notes
References
Supplementary Material
Please find the following supplemental material available below.
For Open Access articles published under a Creative Commons License, all supplemental material carries the same license as the article it is associated with.
For non-Open Access articles published, all supplemental material carries a non-exclusive license, and permission requests for re-use of supplemental material or any part of supplemental material shall be sent directly to the copyright owner as specified in the copyright notice associated with the article.