
Abstract
Background
[Please check the following sentence for clarity: “Point-of-care devices measuring international normalized ratio have clinical appeal, reports of ‘off-label’ in-hospital/primary care use report improved time to intervention/dose adjustment.”]Point-of-care devices measuring international normalized ratio have clinical appeal, reports of ‘off-label’ in-hospital/primary care use report improved time to intervention/dose adjustment. We evaluated the accuracy and precision of a device for such multiple patient use compared to a reference laboratory.
Methods
The point-of-care international normalized ratio result of patients on oral anticoagulation at the Vascular Surgery clinic was compared to the reference to check for statistical and clinical correlation. This was a prospective case–control study design with sample size calculated for sensitivity of 87.5%, precision 5% and desired confidence level 95%.
Results
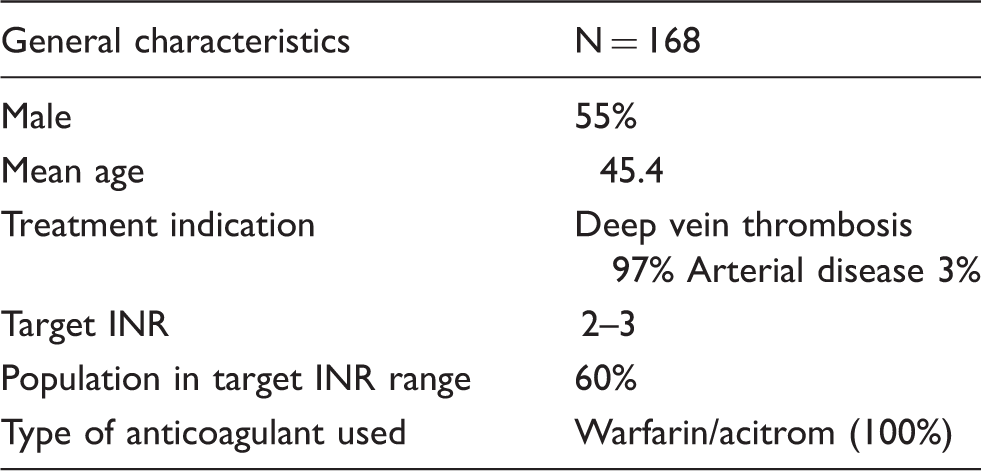
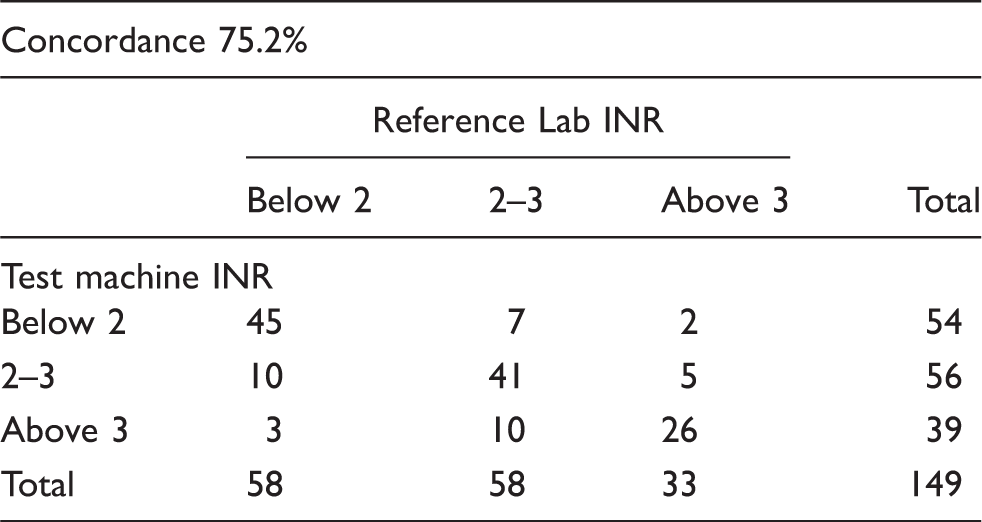
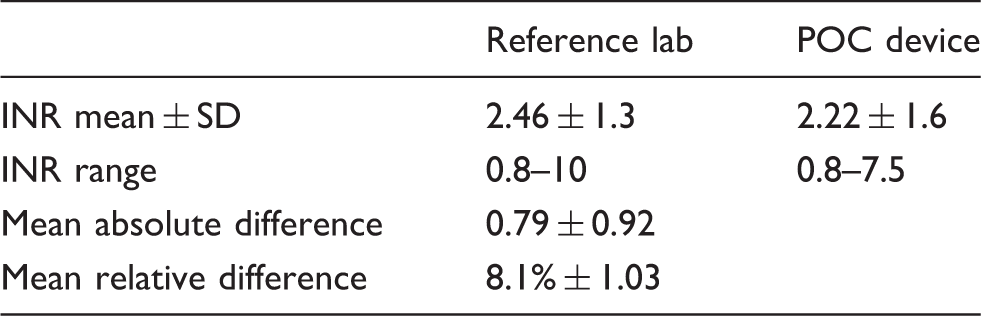
There were 168 patients tested; 55% were male, the mean age was 45.4. Sixty per cent were in the target international normalized ratio range. Tests were done for statistical and clinical correlation. The international normalized ratio range using the point-of-care device was 0.8–7.5 (reference lab 0.8–10), mean international normalized ratio was 2.22 ± 1.6 (point-of-care device) compared to 2.46 ± 1.3 (reference lab). The mean absolute difference was 0.79 ± 0.92 and the mean relative difference was 8.1% ± 1.03. Data was analysed using a Bland–Altman plot yielding a mean of 0.738 (standard deviation 0.92). Concordance between the tests was 75% with r2 = 0.52 on linear regression. Using an error grid plot, excellent clinical correlation was seen in 63.8%. In 5.4% major corrective action was needed but potentially missed if relying on the point-of-care device.
Conclusion
The accuracy and precision of this point-of-care device is moderate. It may have potential utility only where access to a reference lab is difficult.
Introduction
Testing in a reference lab remains the gold standard for monitoring patients on oral anticoagulants. However, this is time consuming and has led to the development of ‘self-testing’. 1 Accurate point-of-care (POC) devices providing reliable international normalized ratio (INR) results are commercially available. They help to increase the time spent in the therapeutic range and reduce thromboembolic and major bleeding events. 2 Access to health care services providing coagulation testing is lacking in most cities in India. Patients travel long distances to be monitored. Given the logistics involved, this leads to poor compliance, inadequate control of anticoagulation and increased risk of developing adverse events.
POC devices have been validated for use by single users. Use in multiple users can be considered ‘off label’. However, such an application is reported from many centres for reducing time to intervention, improving the time in therapeutic range and dose adjustment in a many a setting in patients on oral anticoagulation.3–6 POC devices expedite testing as an INR result is obtained in under a minute. However, there is no evidence to prove equivalent device accuracy when used in multiple patients. The goal of this study was to determine if the POC device can safely replace laboratory INR measurement.
Materials and methods
The primary objective was the assessment of the numerical equivalence of the INR provided by the POC device to the reference lab INR and the agreement regarding dose decisions based on these results. The secondary end point was a clinical end point which included thromboembolic or haemorrhagic events.
All patients on oral anticoagulation with coumarins undergoing INR testing at the Vascular Surgery clinic were enrolled in the study after obtaining informed consent. Patients in extremes of age ( < 15, >75 years), those not compliant to medication, pregnancy, lupus anticoagulant positivity, on injectable heparins, anaemia, lipaemia, jaundice or haemolysis were excluded. Basic patient details like indication for anticoagulation, patient age, and sex were also documented. Sample size calculation was based on the study by Taborski et al. 2 Using a reported sensitivity of 87.5%, sample size was determined for a precision of 5% and a desired confidence level of 95%; the calculated sample size was 168. Sampling was done for consecutive patients, data collection was prospective and selection was independent of the results of the reference lab test.
The study was performed from August 2012 to March 2013. All 168 patients who were asked participated, all were asked once and multiple testing was not allowed since patient-bound factors influencing differences in INR results when comparing both methods would give rise to bias.
Patients on oral anticoagulation were followed up systematically once every two weeks for the first two months, and monthly thereafter for six months to assess clinical adverse effects from over or under anticoagulation.
The POC device used in this study is INRatio ™ (Alere, Hemosense, distributed by Sysmex, Milton Keynes, UK): a coagulation monitor manufactured by HemoSense. It yields prothrombin time (PT) and INR by measuring the change in the electrical impedance of the sample of blood which occurs with the conversion of fibrinogen to fibrin. The test results are displayed in less than 60 s. The machine performs an electronic system self-test automatically and has an international sensitivity index (ISI) of 1.0. The device provided a numerical INR output with a range of 0.7–7.5. The coefficient of variation (CV) of the device is 5.9% for patients within the therapeutic interval. These results have been validated for different machines and test strip lots, with a correlation coefficient of 0.97.7,8
This POC device was chosen in this study as the machine was easily available, easy to use; test strips were individually packed and did not require any special storage conditions. A single POC machine was used for all the tests eliminating inter-observer and inter-machine variability. The blood collection was done by a finger-tip puncture using a lancet, expressed without squeezing performed by the principal investigator after informed consent. Blood for the laboratory INR was collected in citrated Vacutainer™ tubes without a tourniquet using a wide bore needle. The reference lab uses a Sysmex CS-2000i monitor and Dade Innovin reagent. This has an ISI from 0.92 to 1.0 with a CV of 1.4%. The reference lab test result was used as the predicate method (control). The entire sample was verified with the reference standard (laboratory INR) of diagnosis. The POC test was interpreted independently without knowledge of the result of the reference test. Un-interpretable test results (where the POC device yielded an ‘error’ message instead of a numerical value) were noted and then excluded from the final analysis. The numbers of these were noted as machine failure. There was no missing information. The study was approved by the institutional review board.
In the current study design, both the numerical data (POC device, reference lab INR) and clinical results were analysed at the end of the study period. The POC device result was interpreted independently without knowledge of the result of the reference test.
The numerical correlation of the two INRs was the primary end point. Data analysis was done in two parts: clinical and statistical. The clinical accuracy dealt with the diagnostic issues in management – evidence of over or under-coagulation (e.g. bleeding or thrombosis) and whether the dose adjustment decision based on the POC would correlate with the reference standard. The clinical accuracy was determined by the treating physician based on the reference lab results. This aspect of analysis dealt with assessing if the information provided by the POC about clinical issues matched the information provided by the lab standard and was assessed by use of a Bland–Altman plot, error grid analysis and clinical concordance.
A Bland–Altman plot graphically depicts the difference of results of the two methods against their average (Figure 1). It represents the limit of agreement among the two techniques and provides a visual representation of whether the difference of the averages lies within two standard deviations (± 1.96SD). The error grid plot is based on the clinical ranges of significance. This assessed the short-term effect of an erroneously high or low result on the clinical decision. The grid assessed the per cent of patients who were at risk of receiving an incorrect dose if the POC device INR was used (Figure 2).
Bland Altman plot: POC device and lab INR. Error grid plot: construct and results.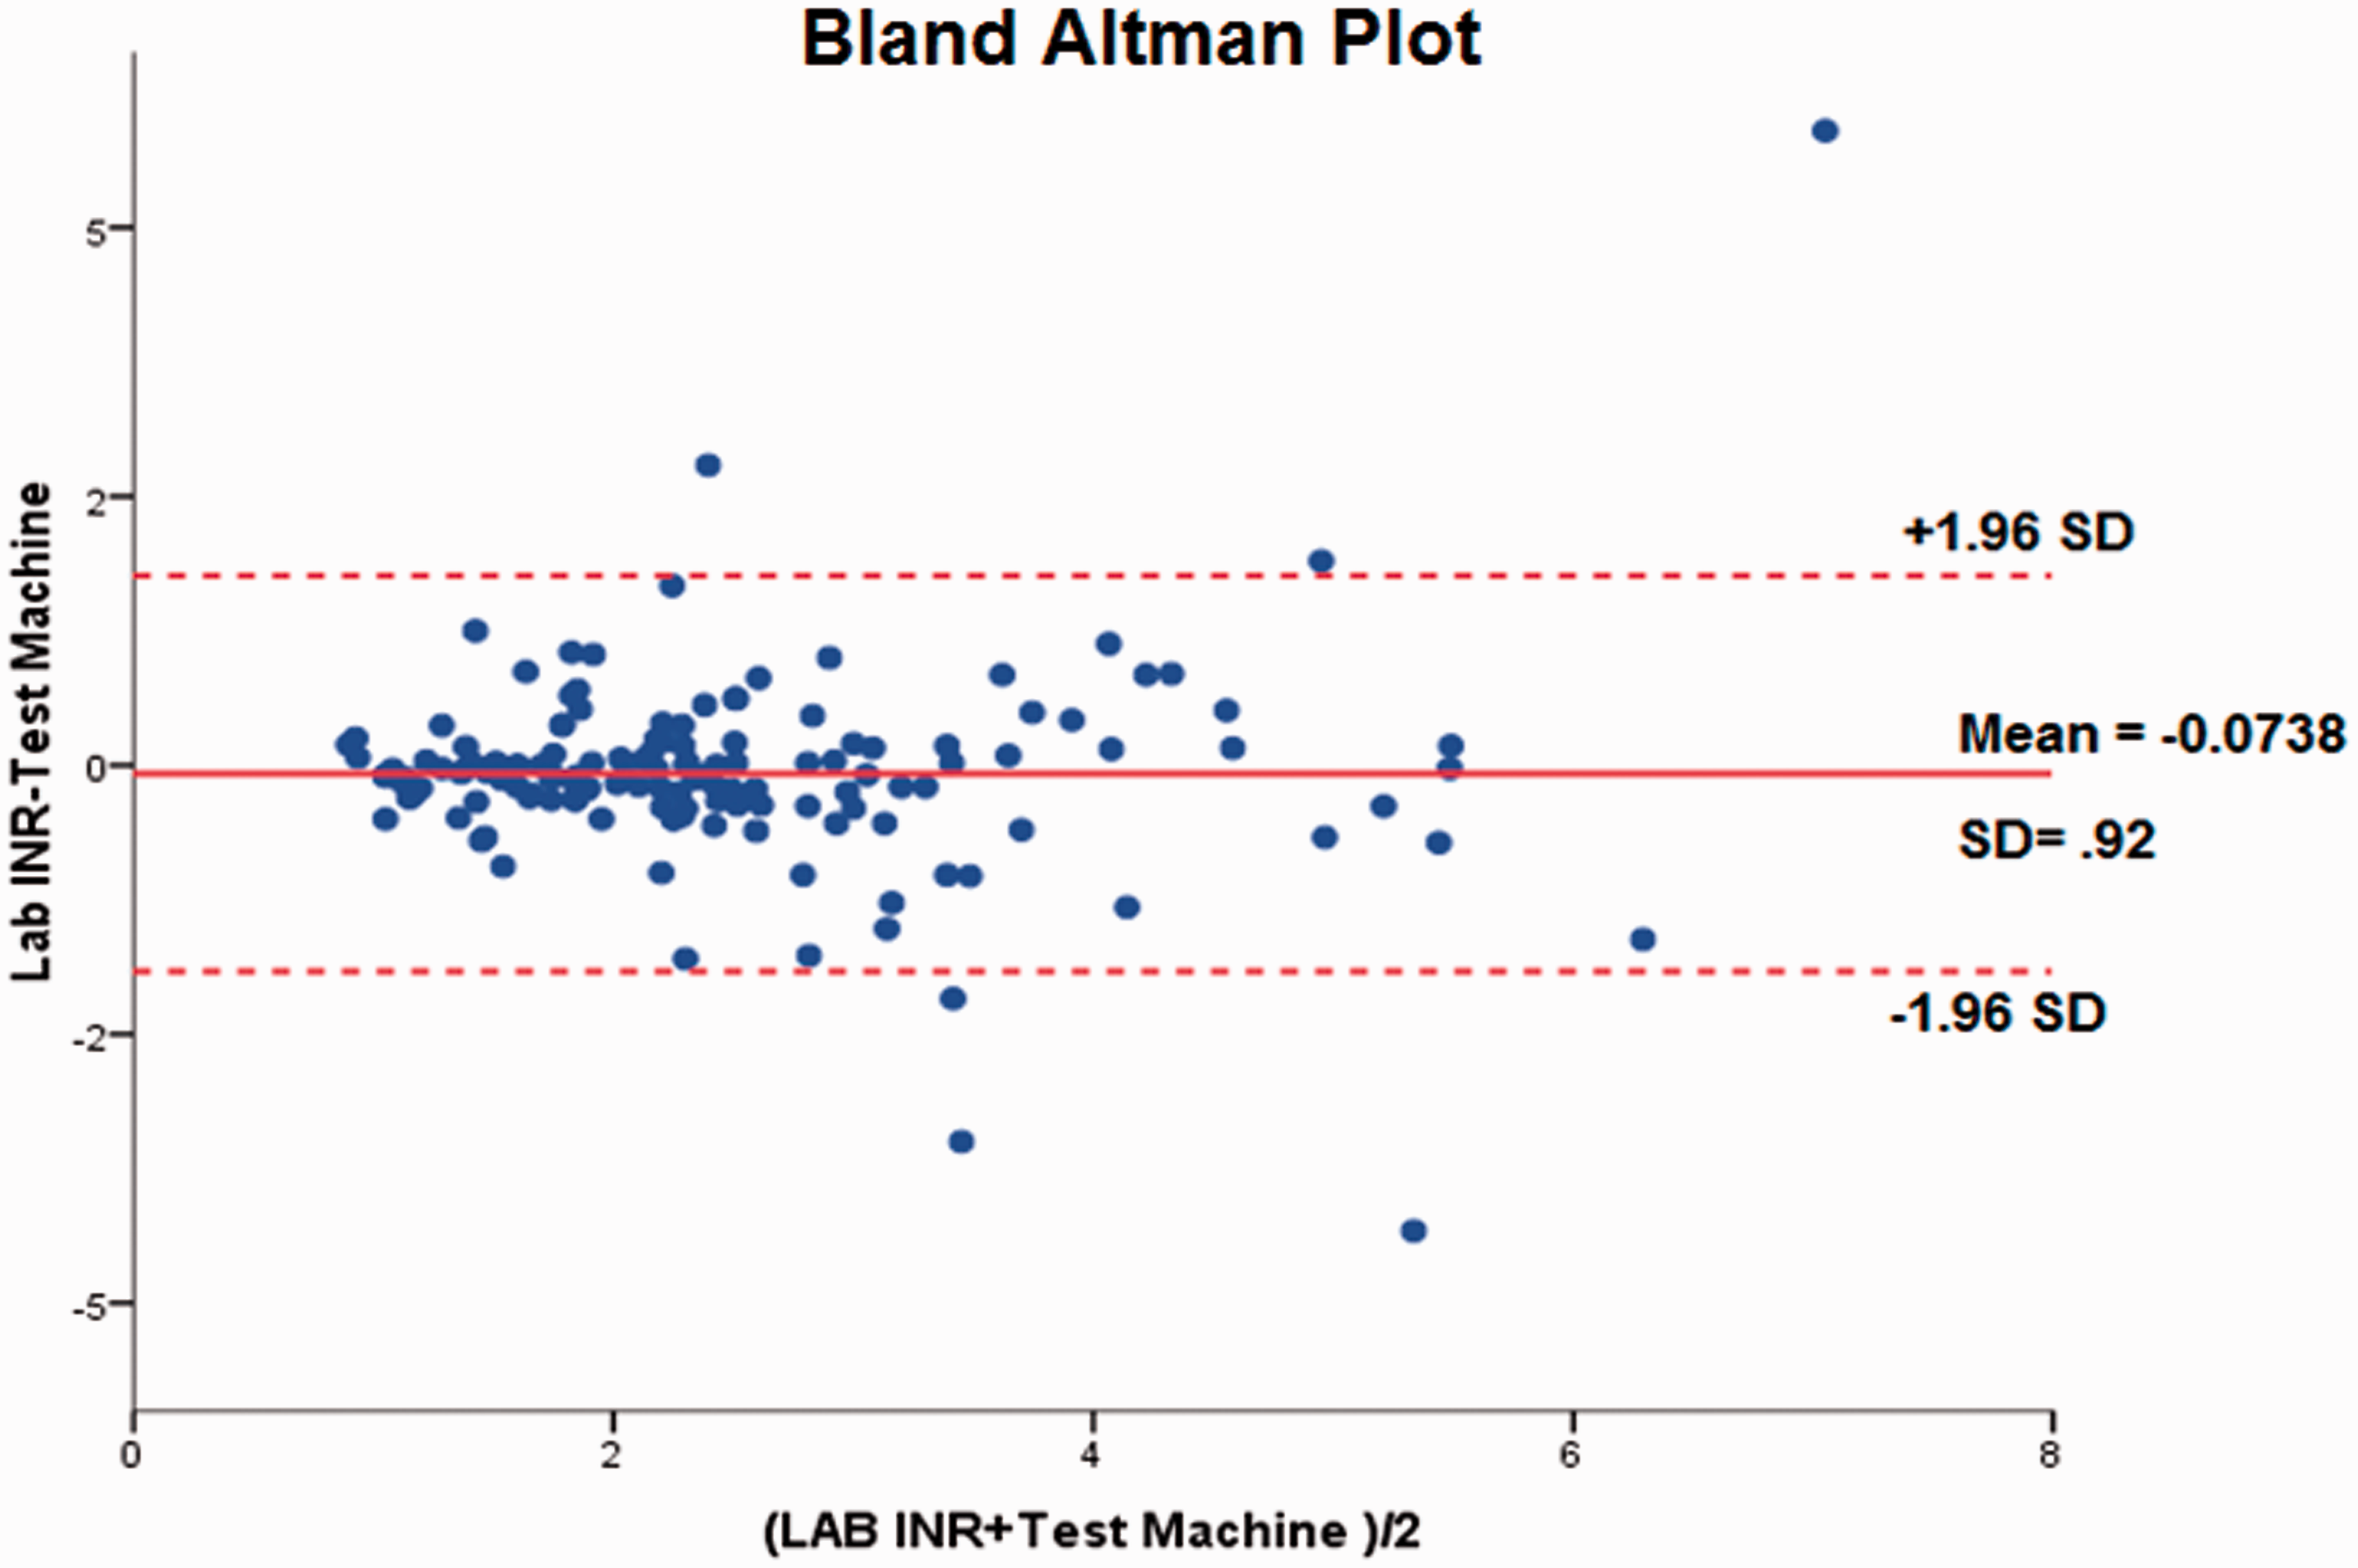
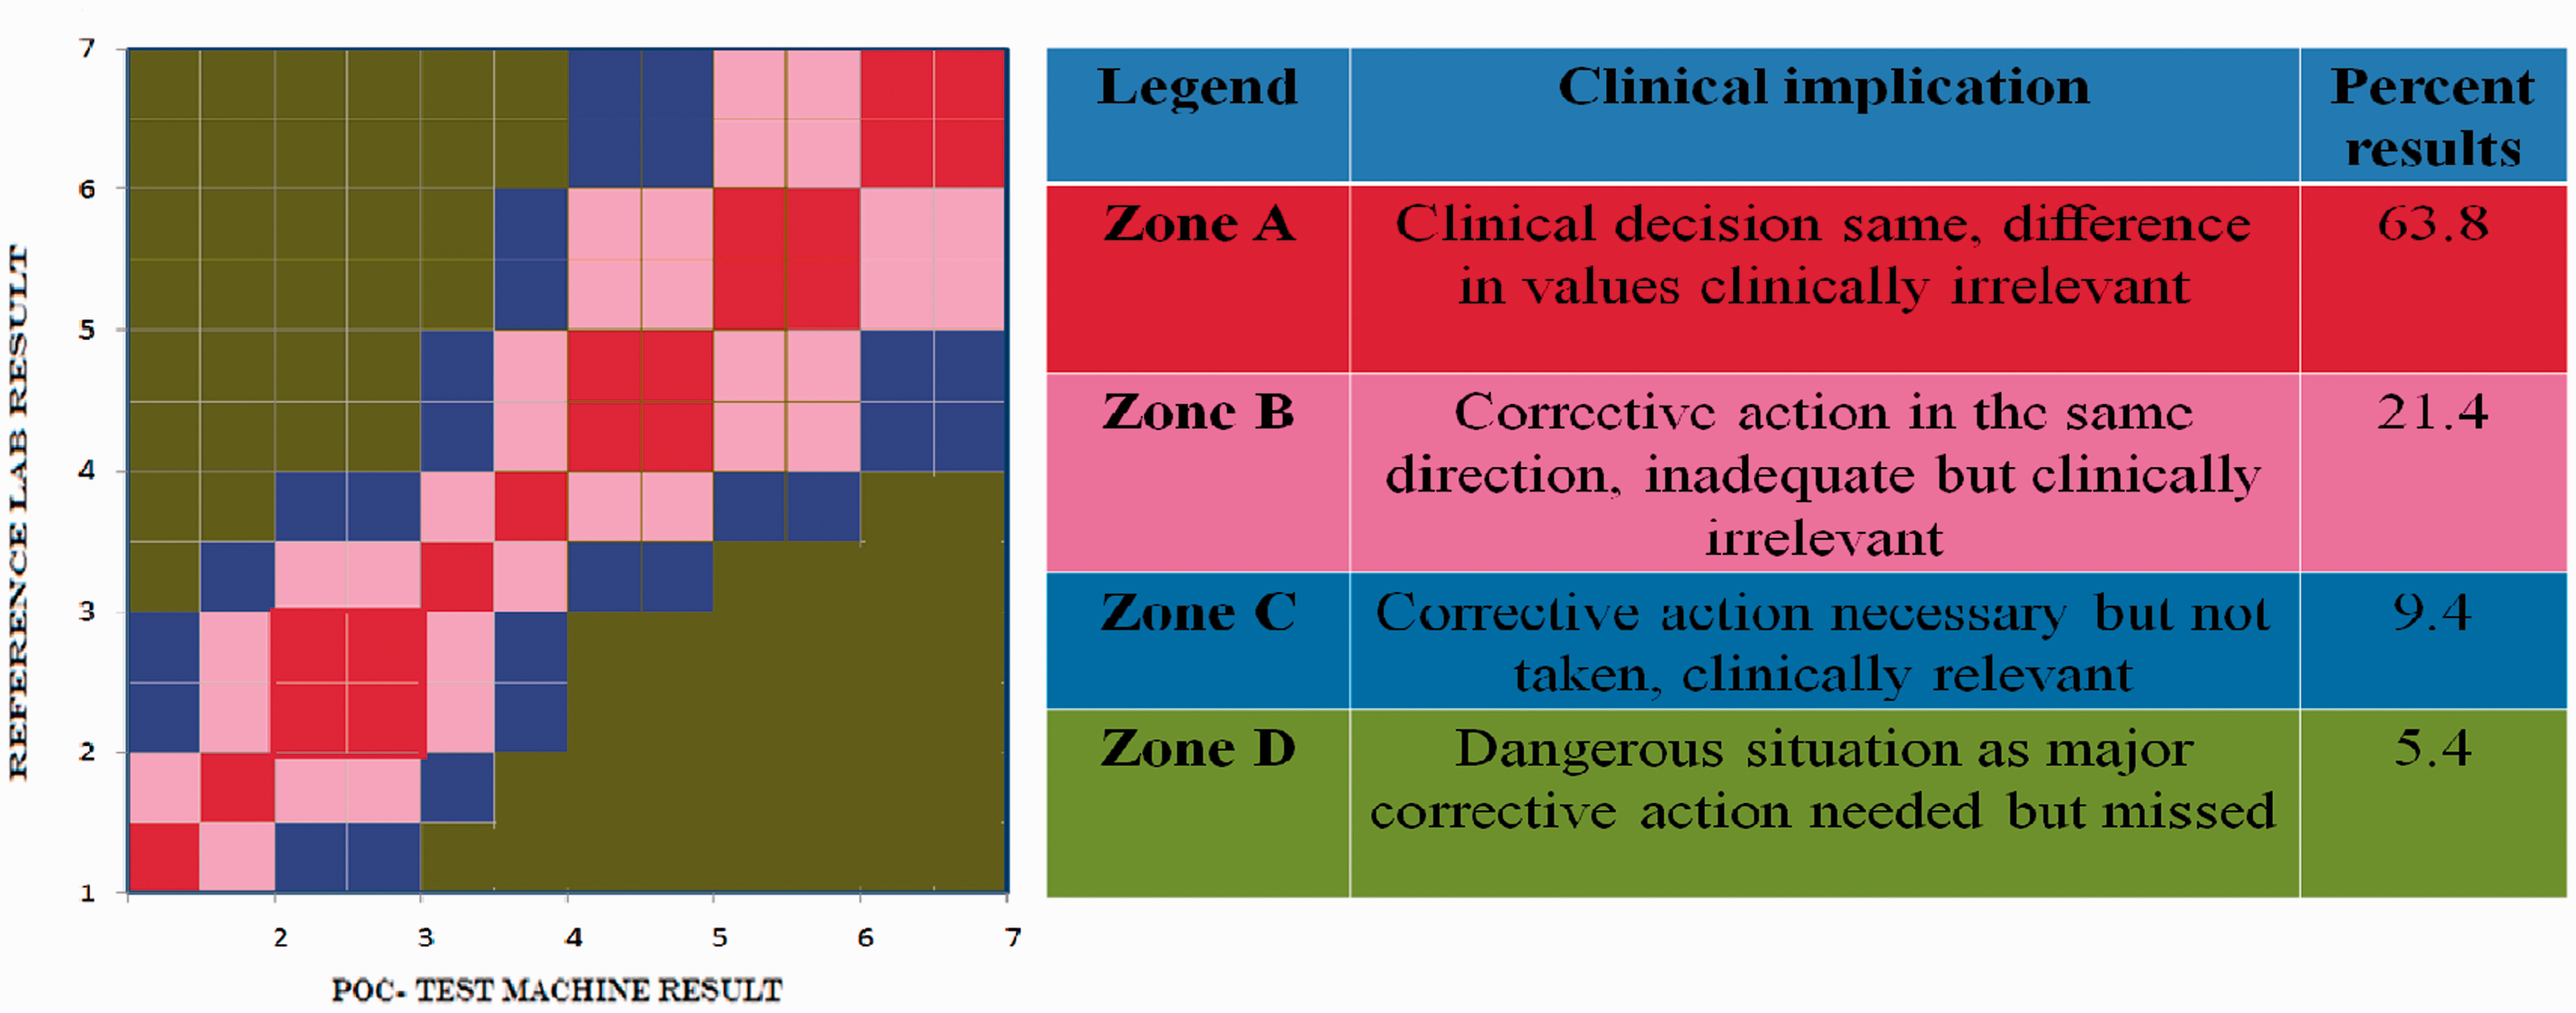
The dose prescribed to the patient was based on the lab INR result. This was decided by the treating physician. A dosing decision was also made by the investigator based on the POC result without knowledge of the reference lab test. The two were compared to determine if the treating physician would have made a different dosing decision based on the lab result rather than the POC result. This was the clinical accuracy – the data was further analysed using an error-grid plot. The ‘best-fit zone’ (zone A) represents the values in the area marked in red – in this zone, there is very minimal difference in the INR values yielded by the two methods, hence the clinical decision based on one or the other would be the same. The dosing decision was made based on dosing protocols which parallel the NHS warfarin management guidelines. It was therefore partly subjective; no computer-based dose calculation was used.
Four such zones of clinical significance are identified and the number of patient samples in each zone analysed.
Statistical accuracy dealt with the analytical/numerical similarity of the POC to the reference standard which was done by calculation of the mean absolute difference, mean relative difference (MRD) (Hill accuracy rating) and correlation coefficient. The Hill accuracy rating of the MRD% is very good (6.58–9.25), good (9.32–11.86), acceptable (11.93–14.54), marginal (14.60–20.28) and very poor (20.34–26.99).
2
The Passing and Bablok linear regression demonstrates agreement of methods (slope and coefficient of correlation). The Pearson correlation coefficient is a measure of dependence which studies how much every observation deviated from the best-fit line (Figure 3).
Correlation plot: POC device and lab INR.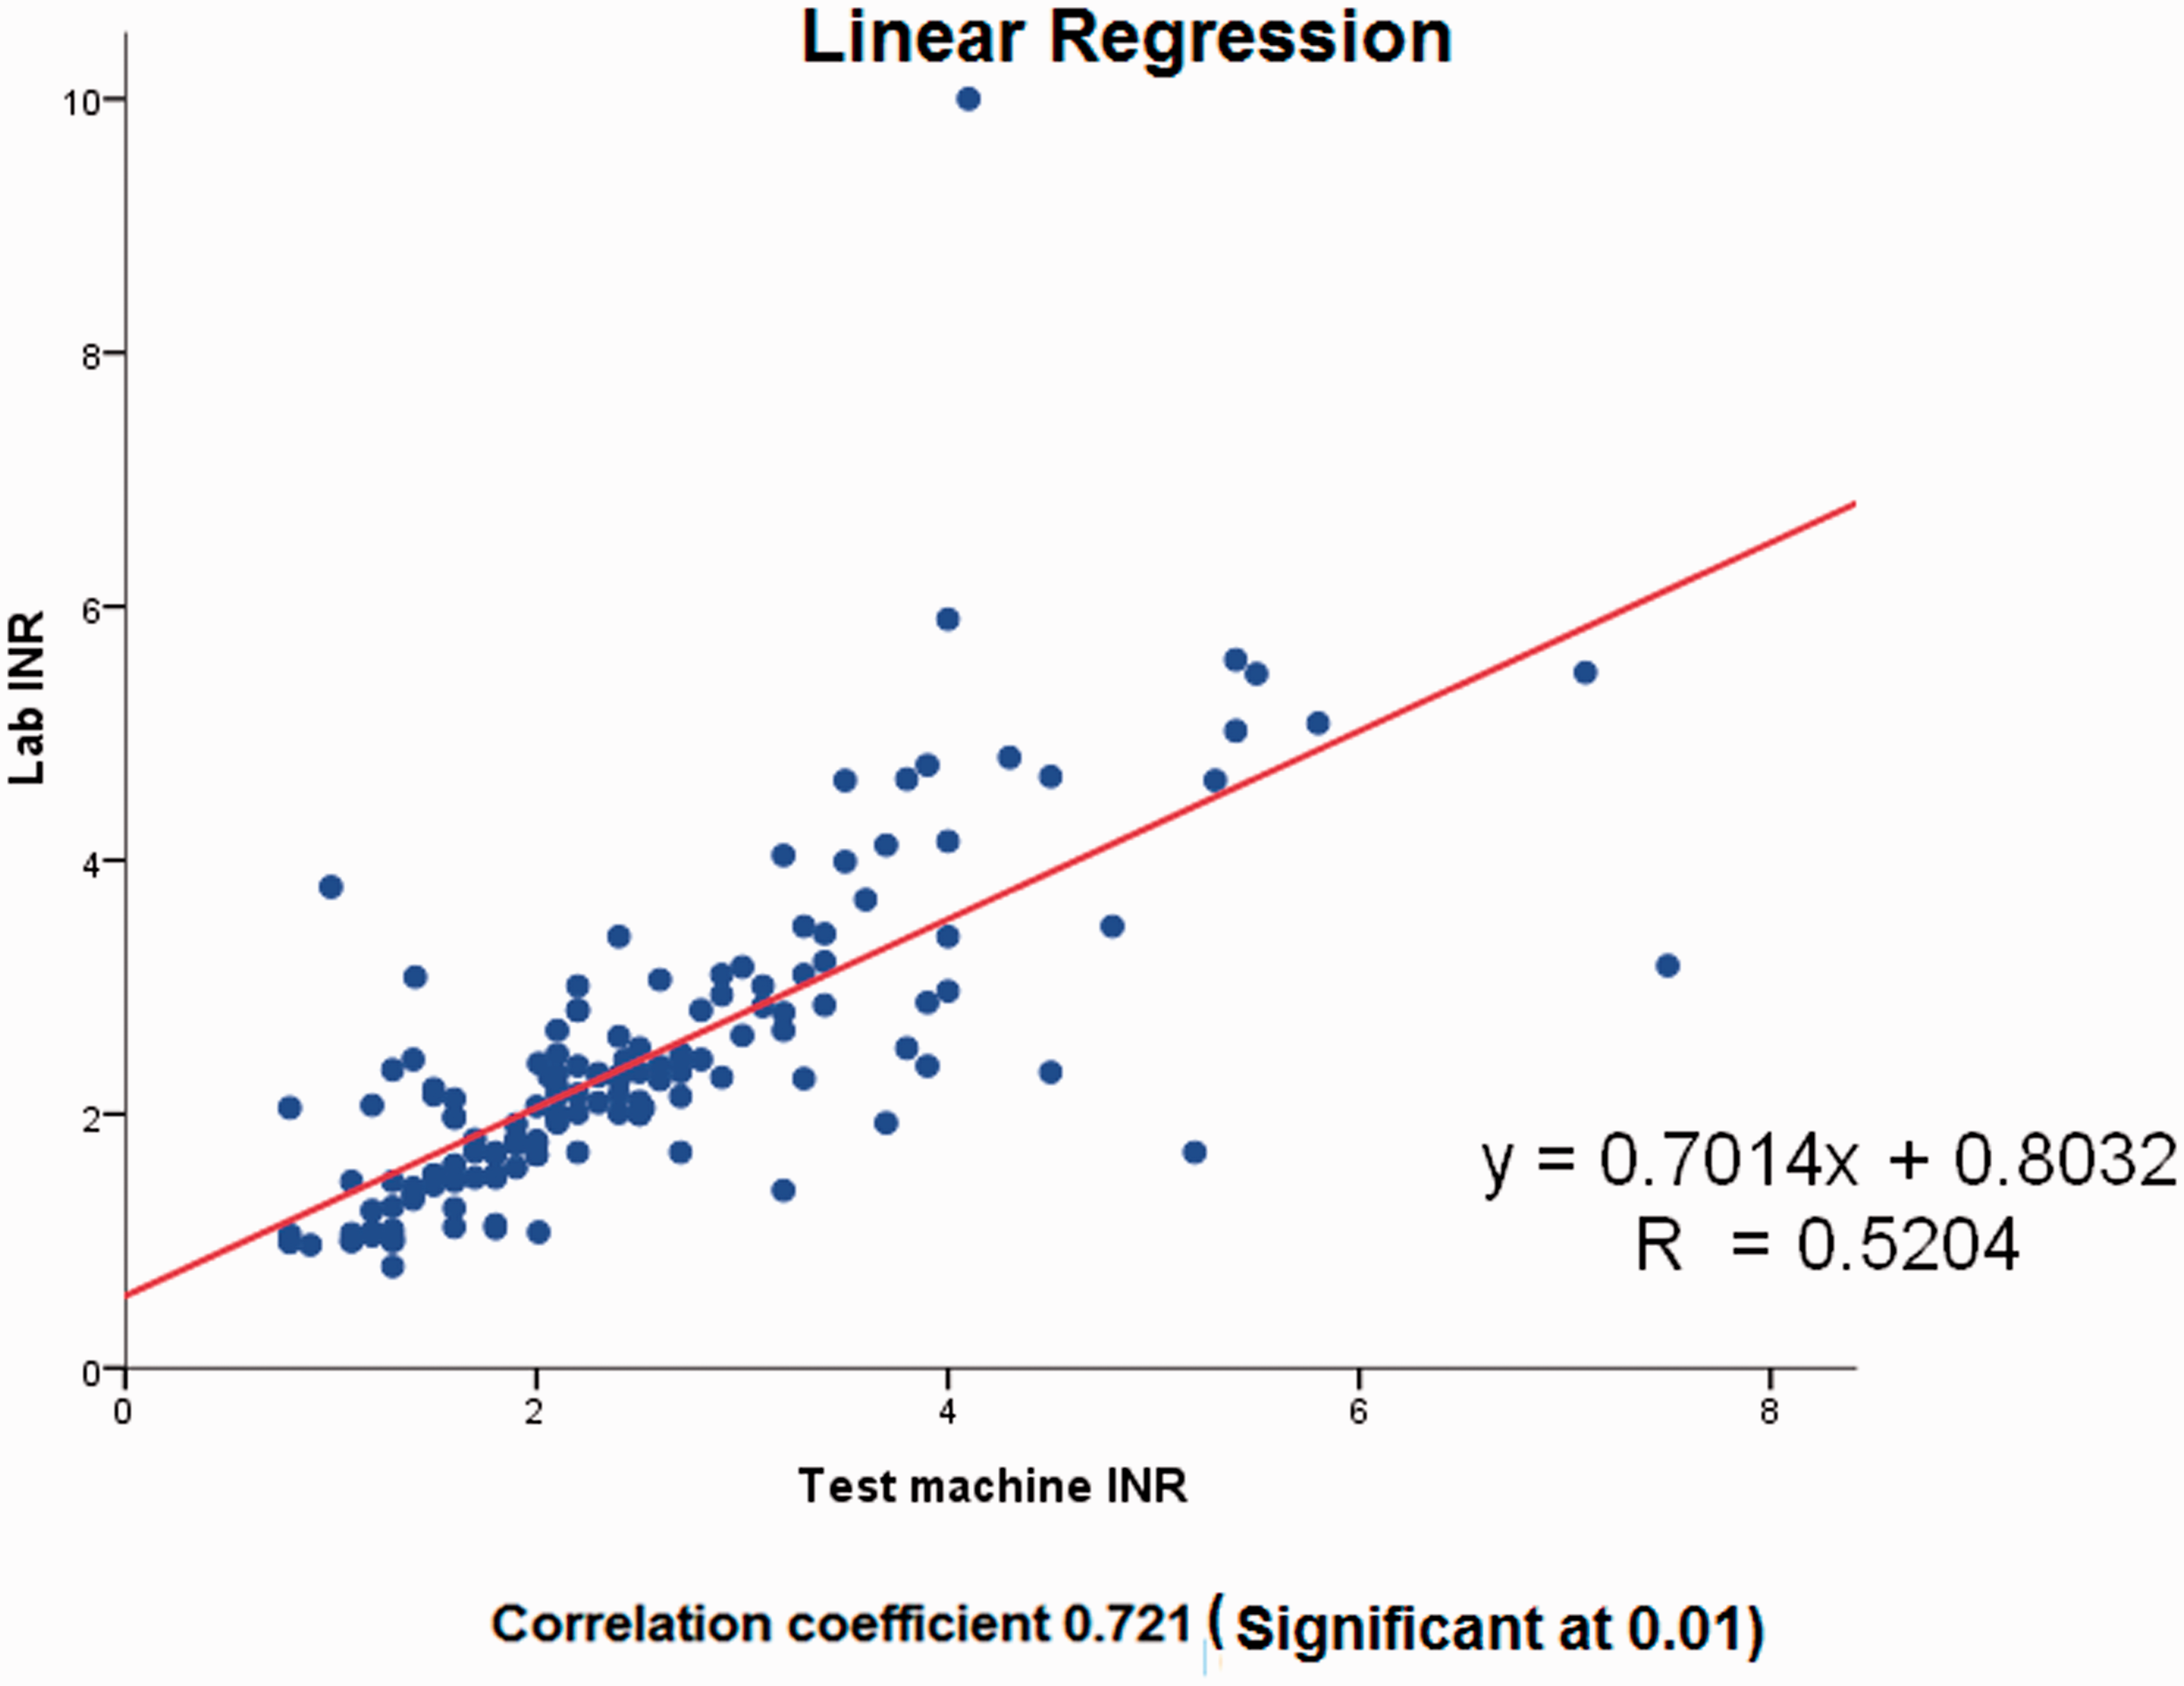
Results
General demography – test/patient characteristics.
The Bland–Altman plot (Figure 1) disclosed a good agreement trend between the two machines with very few values lying outside the 2SD mark even when the INR values were in the higher range.
Lab-POC test machine INR numerical result concordance.
Basic statistical comparisons between reference lab and POC test device INR.
The linear regression revealed a moderate deviation from the best-fit line with a slope of 0.7. This was confirmed by a concordance correlation coefficient of 0.52 at a significance of 0.01(Figure 3).
Discussion
The age–sex distribution for anticoagulation in this study matches what is seen in any anticoagulation clinic managing patients with DVT. 3 In many Western countries, the most common indication for anticoagulant treatment is atrial fibrillation.3–6,9,10 The mean age is relatively young in our study group. The patients included are fairly homogenous (DVT). The range of INR measured covered the clinically relevant range from 0.7 to 10. Our laboratory handles high volumes with over 5000 INR tests being performed daily. The lab participates in various proficiency tests; namely the Royal College of Pathologist of Australia quality assessment programme, World Federation of Haemophilia and World Health Organisation international external quality assessment scheme. The POC device is able to detect the high range values. The visual inspection of the Bland–Altman plot disclosed a trend in good agreement between the two machines with very few values lying outside the 2SD mark even when the INR values were in the higher range. This seemed to indicate clinical significance. However, in this study we wanted to test not just a single measure of numerical accuracy but the overall performance of the POC device by multiple qualitative and quantitative methods. The MRD and linear regression showed only moderate numerical correlation. Although numerically the POC device seemed to yield an acceptable result, the error grid plot revealed that only 63% fell in the best-fit zone. Five per cent of patients would be in the clinically dangerous zone where they would risk over or under-anticoagulation and thus be at risk for bleeding or thrombotic complications (zone D). In 30% the corrective action based on the POC device would have been minimal or incorrect (zones B, C). There were no thromboembolic or bleeding complications in the study period.
An 11% (19/168) unobtainable POC results is unacceptably high. Among these, three patients had very thick callused skin secondary to agricultural work – it was not possible to obtain an adequate finger-prick blood sample for the test. Even after excluding these, the machine yielded an ‘error’ result in 10%. This too is an unacceptably high percentage for a machine that is expected to give results in absolute numbers. There are no reports to suggest that use of POC devices can have such a high percentage of unobtainable results. The manufacturer’s machine use instructions state that an ‘error’ message is separate from a low battery, test strip inaccuracy or unacceptable ambient conditions. These ‘error’ readings were not consecutive, did not violate the exclusion criteria, did not have difference in test strip lots and were performed in the same way as all other tests. We thus attributed this to yet unidentified patient-bound factors. The POC device test was repeated but the repeat tests also yielded only error results. These numbers were not included in the final analysis as with only 63% in the ‘best-fit’ zone and such a high drop-off rate; the efficacy of the POC device was decidedly suboptimal and could not be recommended for clinical practice. This would also therefore not influence the power calculation for the study. Though there were no clinically adverse events, this was not the primary end point. A prospective study focusing on the thromboembolic complications, using this POC device would not be ethical, as the risks to patients would be unacceptable. In this study, all tests were all interpreted by physicians, but a potential scenario where a patient following self-testing faces repeated ‘error’ responses could be unsettling for the patients and the treating physicians. The main limitation of this study is the high number of unexplained ‘error’ results. However, this is a real-life outcome and therefore has to be accepted as a possible drawback of this POC device.
POC devices can provide INR results in a variety of settings, e.g. hospital based, physician offices, anticoagulation clinics, pharmacies, etc.3–6 The goal of this study was to determine if the POC device can safely replace laboratory INR measurement in a hospital-based setting. Different POC devices: the CoaguSense, ProTime, CoaguChek, CoagCare and Alere INRatio™ Monitoring Systems are approved by the Food and Drug Administration USA.9,10 These and other devices – Thrombotrak, Avosure, Rapidpoint coagulometer (TAS) and KC1 – are available in Europe. Of these the Coagucheck and Alere INRatio™ are easily available in India.
These devices use microfluidic technology, the test strips contain the thromboplastin required for INR measurement from capillary blood. Specific operating principles and sensitivity of the thromboplastin reagent vary between devices.11–14 PT depends on the levels of functional/active factors of the extrinsic and common pathway. The INR is the ratio of a test sample compared to a normal PT (derived from the log mean normal PT from normal donors) corrected to the thromboplastin sensitivity. The PT test uses a thromboplastin; the use of the INR standardizes the test. The reported ISI of the studied POC device (INRatio™) is 1: this indicates that it is a ‘good’ thromboplastin. Other devices report ISI’s ranging from 1.0 to 2.0. The INR is determined by different end-point detection methods (optical detection, electrical, electrochemical impedance). The POC device is not accurate in patients with APLA, very low haematocrit, lipaemia, hyperbilirubinaemia as the end-point detection varies unpredictably with these changes in patient-bound factors.7,8,15
Though the INRs between these devices do not always yield numerically equal results, they generally correspond well with reference lab results.13,16–18 The correlation coefficients vary from 0.81 to 0.95 for CoaguChek, 0.72 to 0.90 for ProTime and from 0.92 to 0.95 (INRatio™). The CV for this POC device (INRatio™) is reported to be 5.9% for patients within the therapeutic interval. This is the quoted CV for repeated tests of the same sample with different machines provided by the manufacturer. These results have been validated between different machines and test strip lots with a concordance of 81–87% in clinical use.
When a POC measurement is different from the reference laboratory, the ‘correct’ INR cannot be determined. This stems from the intrinsic variability of the reagents used in lab tests and the variation of sera used between different labs.19,20 With so many analytical variables, quality control and external quality assurance are important for results that are reliable, reproducible and accurate. Different calibration and quality control systems have been developed for POC devices to reduce the variability in test results between machines.21,22 The statistical accuracy (analytical – numerical similarity to gold standard) alone cannot replace the clinical (diagnostic – accurate provision of information about clinical issues as the gold standard) accuracy. 23
Traditionally monitoring is hospital based and can be time consuming. The development of POC devices allowed for testing in a physician office, hospital bedside, anticoagulation clinics, pharmacist based or self-testing settings.3–6,24 Each of these has their own advantages and disadvantages; however, they all aim at strict adherence to a narrow therapeutic range. This is essential for good clinical outcomes and minimizing adverse effects secondary to over or inadequate anticoagulation.1–3 The choice of the testing method should therefore depend on the reproducibility and accuracy of test results that it provides.
Few studies have assessed differences in clinical outcomes with use of POC devices for hospital clinic testing, none with the INRatio™ device.25,26 Though data about differences in clinical outcomes between the two modalities are usually documented, their analyses do not focus entirely on the accuracy or validity of the individual devices used. The clinical improvement is thought to be due to several factors, most importantly due to more frequent testing intervals and a higher measure frequency/shorter interval between consecutive INR measurements.23–25 Studies reporting POC device INR measurement in patients with atrial fibrillation, prosthetic valves, trauma or in children report evidence of variable utility.27–31 Any comparison of results obtained by use of POC monitor has to be interpreted in the light of the clinical setting for which it was evaluated. The overall poor performance of the POC device when used in multiple patients highlights the fact that this particular application cannot be recommended where a reference lab is available.
Conclusion
Our study was aimed at assessing the numerical agreement between POC and laboratory INR results and the agreement regarding dose decisions based on the INR results. There is at best only a moderate correlation with the lab standard. Hence, in the presence of a standard lab, testing using this POC device is not superior in oral anticoagulation management and cannot be recommended. However, we feel that the POC device may have a potential application in areas where a standard lab is not available as it may help identify patients at risk of bleeding and thrombotic complications. More frequent testing or referral to a standard lab may help improving outcomes in such patients.
Footnotes
Ethical approval
This study was cleared by the institutional review board and performed after informed consent was obtained.
Declaration of Conflicting Interests
The author(s) declared no potential conflicts of interest with respect to the research, authorship, and/or publication of this article.
Funding
The author(s) disclosed receipt of the following financial support for the research, authorship, and/or publication of this article: The entire cost was covered by an institutional research grant, Christian Medical College, Vellore, India.