
Abstract
Objectives
To investigate the haemodynamic causes of skin changes in limbs with primary varicose veins, which were assessed with air plethysmography.
Methods
Five hundred seventeen consecutive patients with axial reflux in the great saphenous vein (varicose vein group) and 248 normal subjects (normal group) were investigated. Varicose vein group patients were divided into two groups according to whether they did (C4–6) or did not (C2–3) have skin changes. Several parameters obtained using air plethysmography were compared among the normal group, C2–3 and C4–6 patients.
Results
Although there was no significant difference in the regurgitation index to quantify venous reflux in C2–3 and C4–6 patients, the maximum arterial inflow rate increased (normal group < C2–3 < C4–6), even in limbs with a small amount of venous reflux.
Conclusions
This study suggests that it is not essential to increase the venous reflux rate in skin change development; rather, it is based on various pathophysiological conditions that increase the arterial inflow rate.
Introduction
Although several reports have evaluated the relationship between venous reflux and the clinical severity of venous insufficiency,1,2 it is unclear whether the development of skin changes depends on the venous reflux rate in legs with primary varicose veins. Limbs with active ulcers but not much venous reflux are often found in daily care. On the other hand, the increased arterial inflow rate that is found in legs with primary varicose veins 3 is considered to increase the venous return, leading to venous hypertension. 4 Furthermore, increased hydrostatic pressure, small re-entry, poor distensibility of the vein, limited ankle range of motion and reduced calf muscle pump function would worsen venous hypertension,1,5,6 which is the core abnormality in patients with chronic venous insufficiency. The present study was conducted to investigate the haemodynamic cause of skin changes in limbs with primary varicose veins, and it especially focused on the significance of the venous reflux and arterial inflow rate through evaluating parameters that were obtained using air plethysmography (APG).
Materials and methods
Ethical considerations
Verbal informed consent was obtained from all patients before they underwent noninvasive evaluations.
Patients
From an existing prospective database of patients with primary varicose veins who underwent duplex ultrasonography (DS) and APG to evaluate possible surgical treatment, data on 517 consecutive patients with axial reflux in the great saphenous vein from the saphenofemoral junction to below the knee (varicose vein group [VG]: 517 limbs) between January 2014 and July 2016 were extracted and retrospectively reviewed. All VG subjects were divided into two groups according to the clinical score component of the Comprehensive Classification System for Chronic Venous Disorders (CEAP) 7 : C2–3 (392 limbs), which means that these patients did not have a skin lesion; and C4–6 (125 limbs), which means that these patients did.
All parameters that were obtained using APG and DS in VG patients were compared with those of 248 normal subjects (normal group: NG) whose data were stored in our database from May 2012 to July 2016. The NG comprised of ambulatory patients without arterial and venous disease (C0 patients) who visited our clinic with various leg complaints but did not have gait disturbance, chronic oedema or a history of venous thrombosis. To define the patient's condition as normal, arterial disease was ruled out by palpating the dorsalis pedis and posterior tibial artery. Ankle brachial index (ABI) was measured for subjects with weak pulsation of each artery, and subjects with ABI less than 0.9 were excluded from NG. The absence of venous incompetence was verified using DS.
Duplex ultrasonography
All subjects were examined using DS (HIVISION Avius; Hitachi, Tokyo, Japan). The patient's valve competence was evaluated in the standing position, using the squeezing maneuver. The calf was squeezed to measure the reflux flow; if the reflux flow in the superficial vein persisted for more than 0.5 s 8 and 1.0 s in the popliteal vein, venous incompetence was indicated. An incompetent perforator was determined not only by the duration of the reflux flow (>0.5 s) but by flow patterns that were demonstrated by García-Gimeno et al. 9 Thus, a perforating vein with an outward flow during both muscular contraction and release, and markedly greater outward flow during muscular contractions with a small inward flow during muscular release, was defined as incompetent perforators.
Air plethysmography
Volume changes of the lower limbs were recorded with APG (APG-1000; ACI Medical LLC, San Marcos, CA, USA) for haemodynamic assessment. Following 10 min of rest in the supine position, the subjects were asked to place the foot of the test leg on a 15-cm foam block with their knee externally rotated and bent. After the test leg was enclosed from the ankle to the knee in a 27.5-cm polyurethane sensing cuff, a 10-cm wide pneumatic tourniquet was placed just proximal to the knee and connected to a rapid indeflator (VenaPulse®; ACI Medical LLC). The venous capacitance (VC), maximum arterial inflow rate (maxAIR) and venous filling index in the supine position (VFIsu) were obtained using the venous occlusion method. After calibration, the tourniquet was rapidly inflated to 70 mmHg. Increased volume tracing was observed and gradually reached a stable plateau. The maxAIR was calculated from the linear slope of the volume just after tourniquet inflation. VFIsu, which was defined as the overall arterial inflow rate, was calculated by dividing the 90% venous volume by the 90% venous filling time. The exercise test that was previously described by Christopoulos et al. 10 was performed to measure the venous volume while standing (VVst), venous filling index while standing (VFIst), ejection fraction (EF) and residual volume fraction (RVF) immediately after measuring the VC, maxAIR and VFIsu.
VFIst, which was comparable to a previously reported venous filling index (VFI),
10
was calculated in the same manner as VFIsu (Figure 1).
Samples of volume traces that were obtained with APG show the VC, VFIsu and maxAIR using the venous occlusion method (top); and VVst, VFIst, EF and RVF that were obtained with an exercise test (bottom).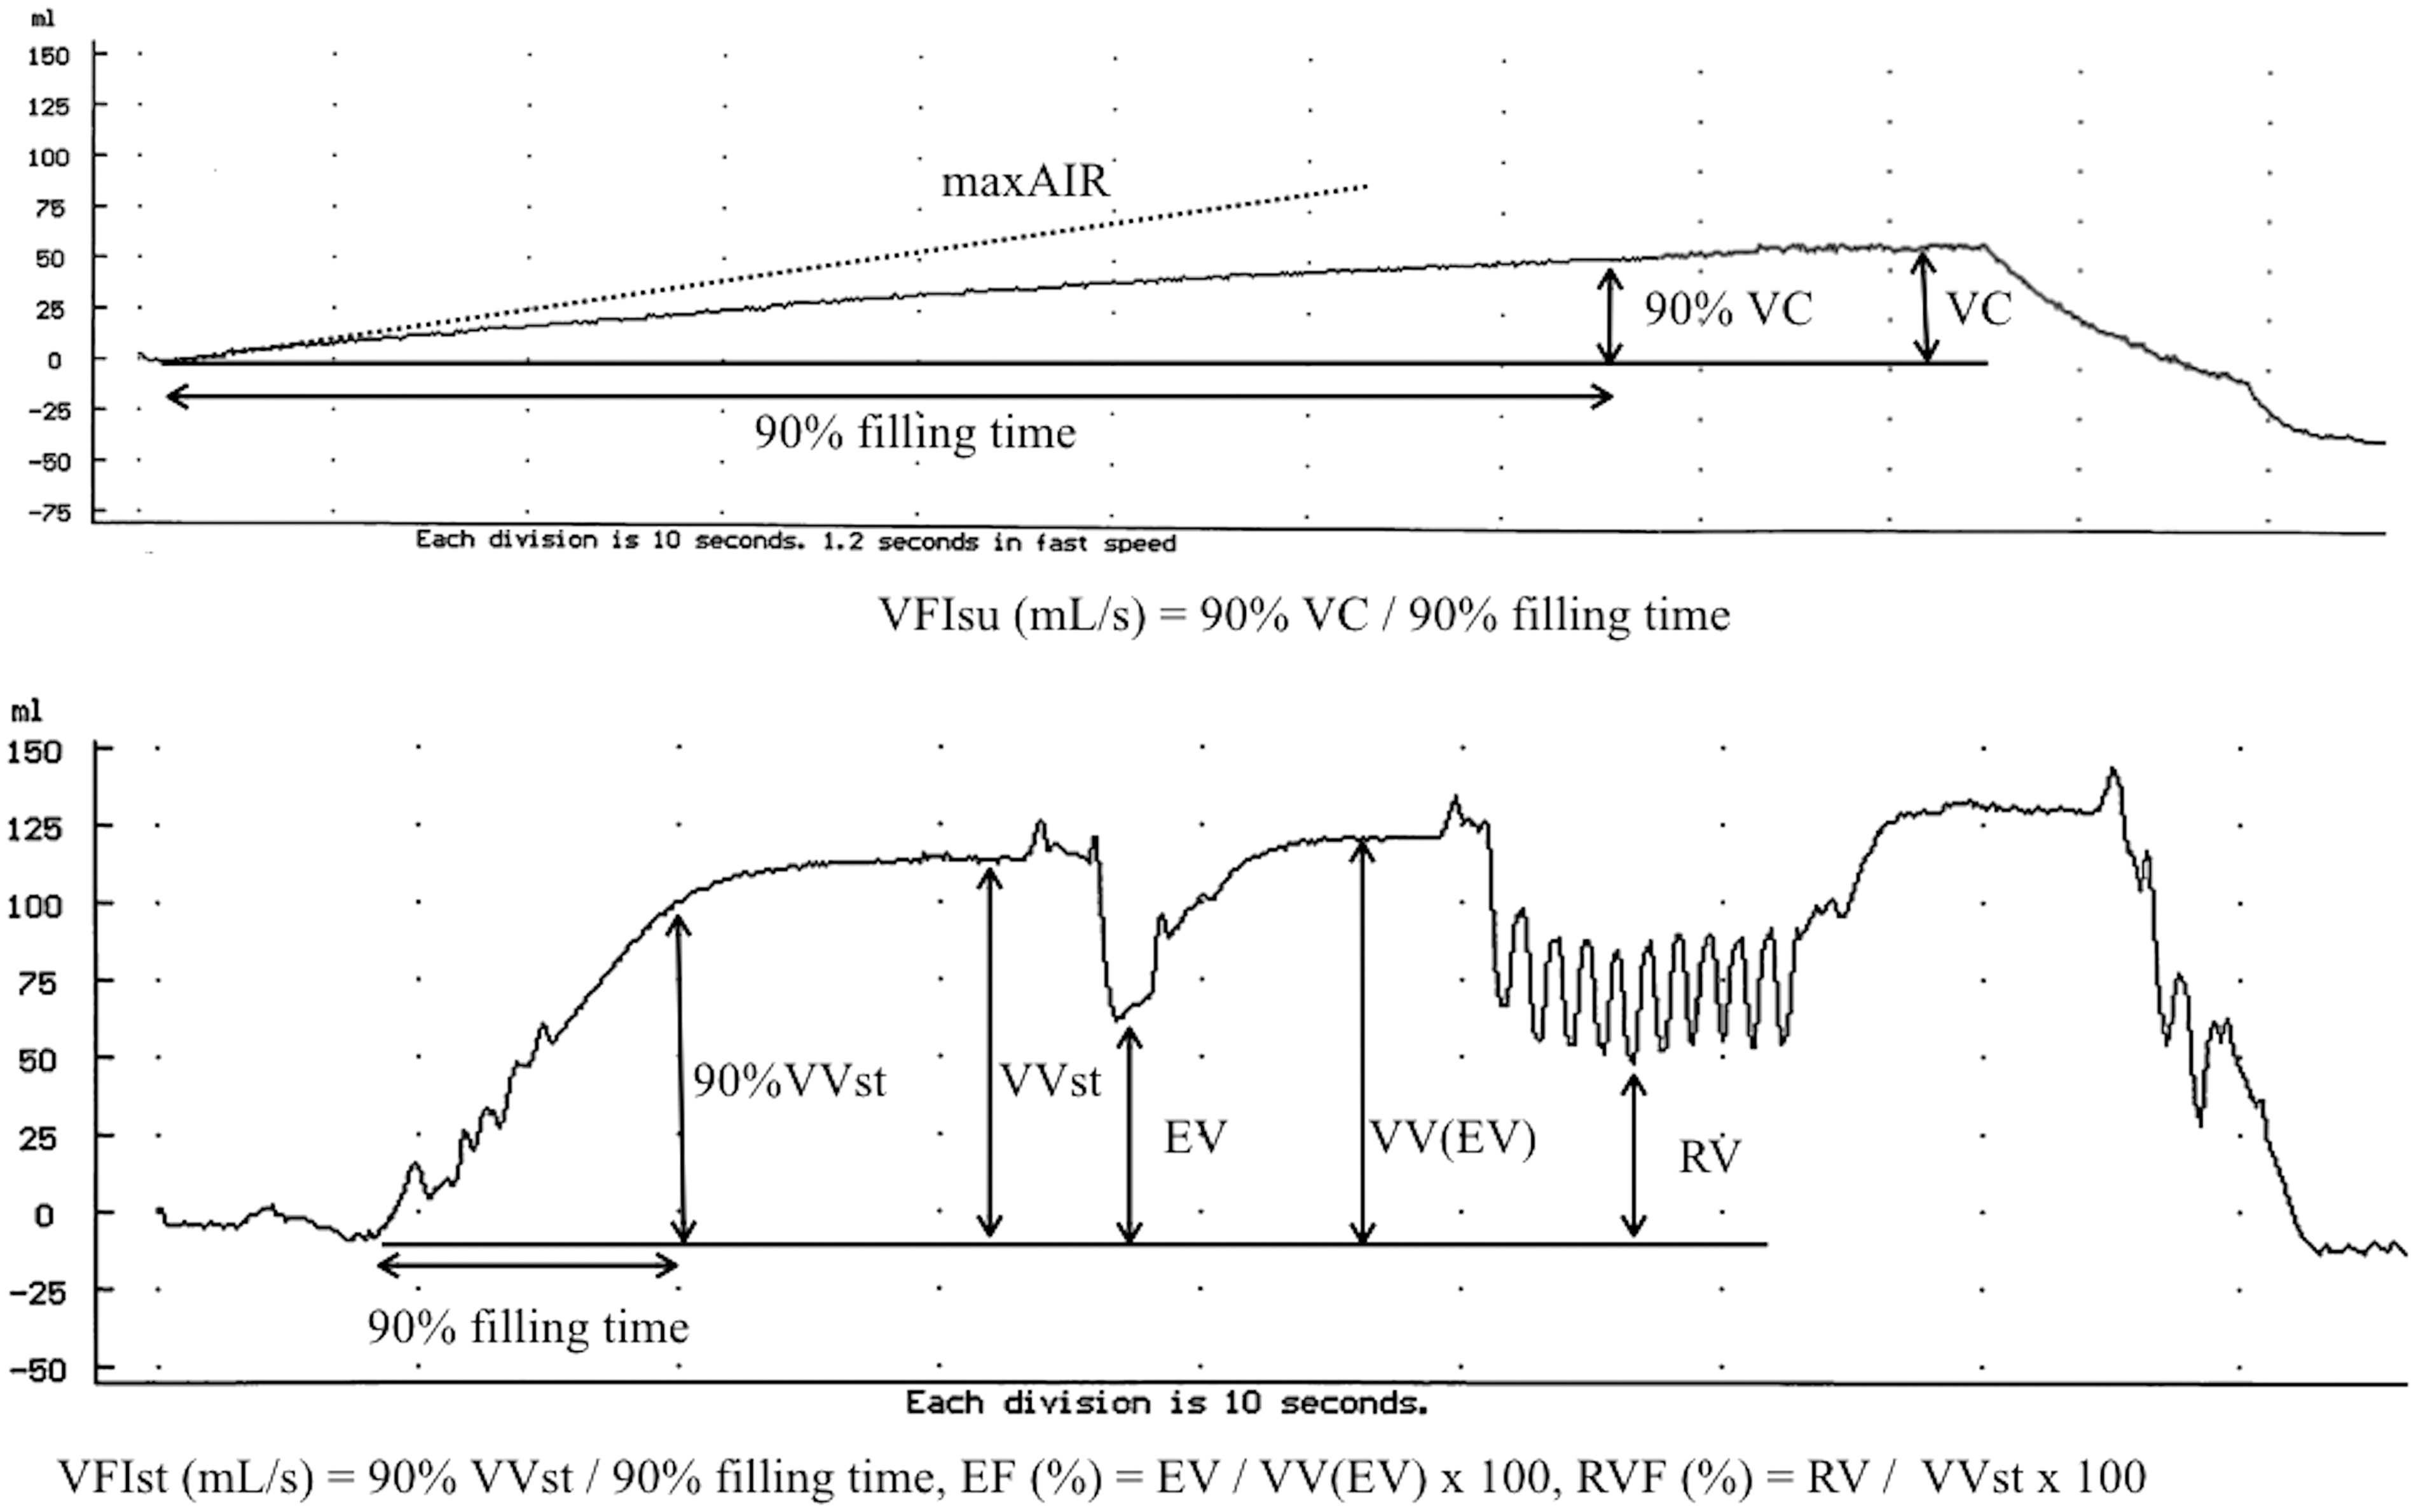
To quantify venous reflux from the thigh to the calf, a regurgitation index (RI) was calculated, as described below.

This novel index is based on the theory that the VFIst is the sum of the arterial inflow and venous reflux rates. Since the venous filling rate is affected by venous tone, the VFIsu was used to represent the arterial inflow rate instead of the maxAIR in the equation. Although there is a difference in the arterial inflow rate between the supine and standing positions, this equation is based on the assumption that there is no significant difference between them.
Statistical analysis
The results are reported as the median (range) or count (percentage), unless otherwise indicated. The chi-square and Mann–Whitney U-tests were used to test the differences in each patient's characteristics and for multiple comparisons. A simple linear regression analysis using Spearman's correlation test was used to study the correlation among the VFIsu, VFIst, body mass index (BMI) and maxAIR in NG and VG patients. The statistical analyses were performed using JMP 13.0 (SAS Institute, Cary, NC, USA). A P value less than 0.05 was considered statistically significant. The accuracies of the RI and VFIst, which represent the venous reflux rate, were evaluated and compared by creating a receiver operating characteristic (ROC) curve for the NG (gold standard reflux negative) and VG (gold standard reflux positive).
The ROC curves were created and analysed using EZR™ (Easy R) (Saitama Medical Center, Jichi Medical University, Saitama, Japan), which is a graphical user interface for R (The R Foundation for Statistical Computing, Vienna, Austria).
Results
Patients
Characteristics of all subjects.
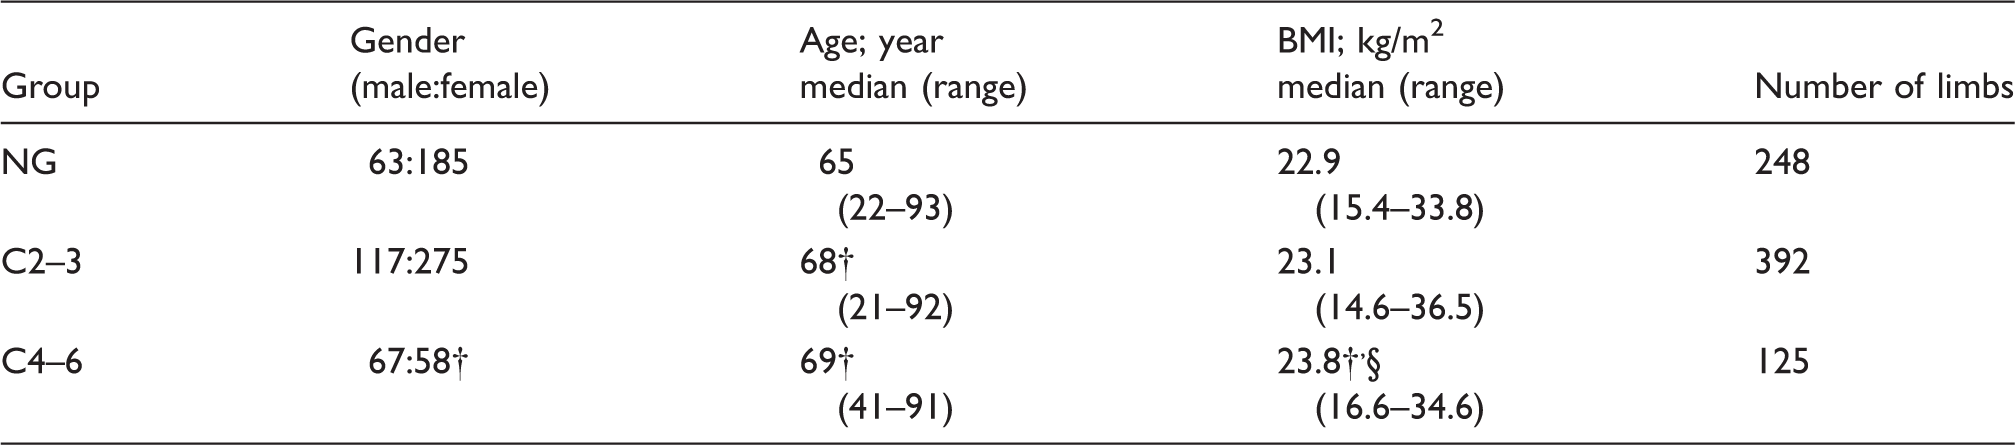
NG: normal group; C2–3: clinical classification 2 and 3; C4–6: clinical classification from 4a to 6; BMI: body mass index.
p < 0.001 vs. the NG.
p < 0.01 vs. the C2–3 group.
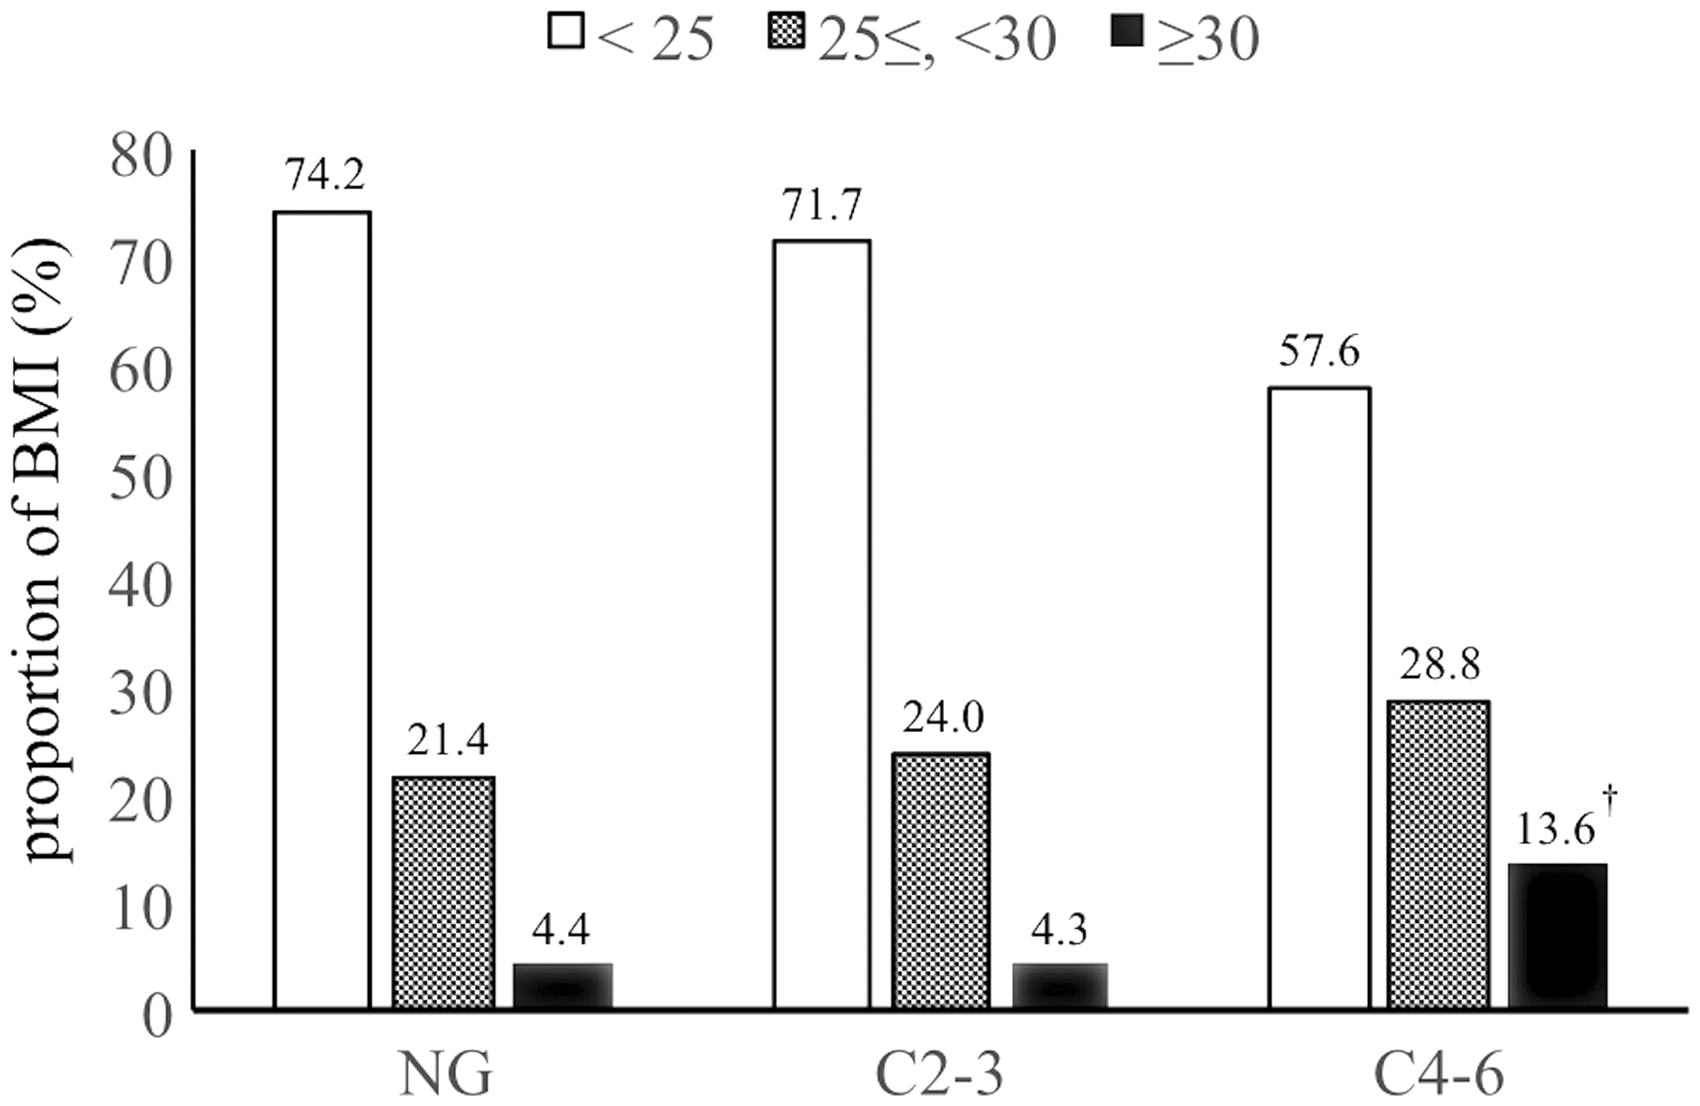
Proportion of BMI according to each group. BMI: body mass index.
The clinical classification and morphologic data that were obtained with duplex scanning in the varicose vein group.
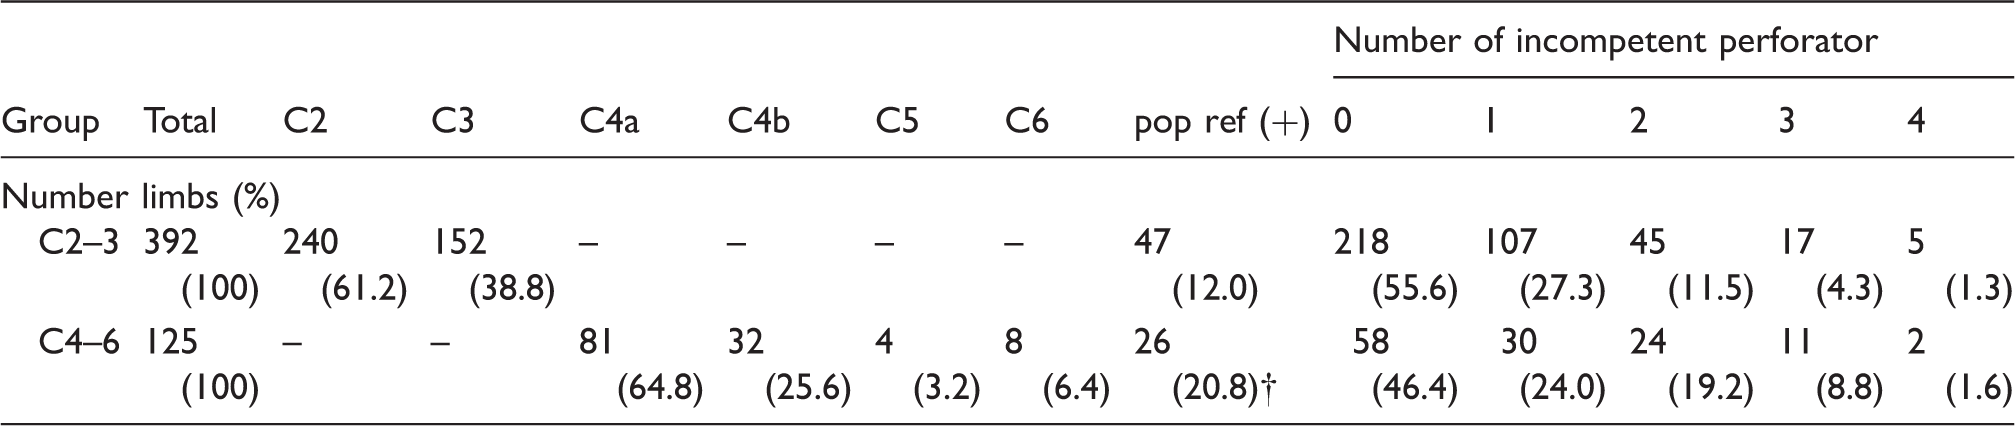
Pop ref (+): positive reflux in the popliteal vein.
p < 0.001 vs. the C2–3 group.
There was no significant difference in the number of incompetent perforators between the C2–3 and C4–6 groups.
C2–3: clinical classification 2 and 3; C4–6: clinical classification from 4a to 6.
Comparison of the accuracy of the VFIst and RI
The optimal cut-off values (mL/s), sensitivities (%), specificities (%) and areas under the curve (AUC) of the RI and VFIst were 1.474 and 2.058, 89.8 and 87.2, 93.6 and 96.8, and 0.963 and 0.970, respectively. The RI had a significantly greater AUC (p < 0.05) than the VFIst, indicating that the RI is superior to the VFIst as an index for detecting venous reflux (Figure 3).
ROC curve. The cut-off-value was calculated with the Youden index.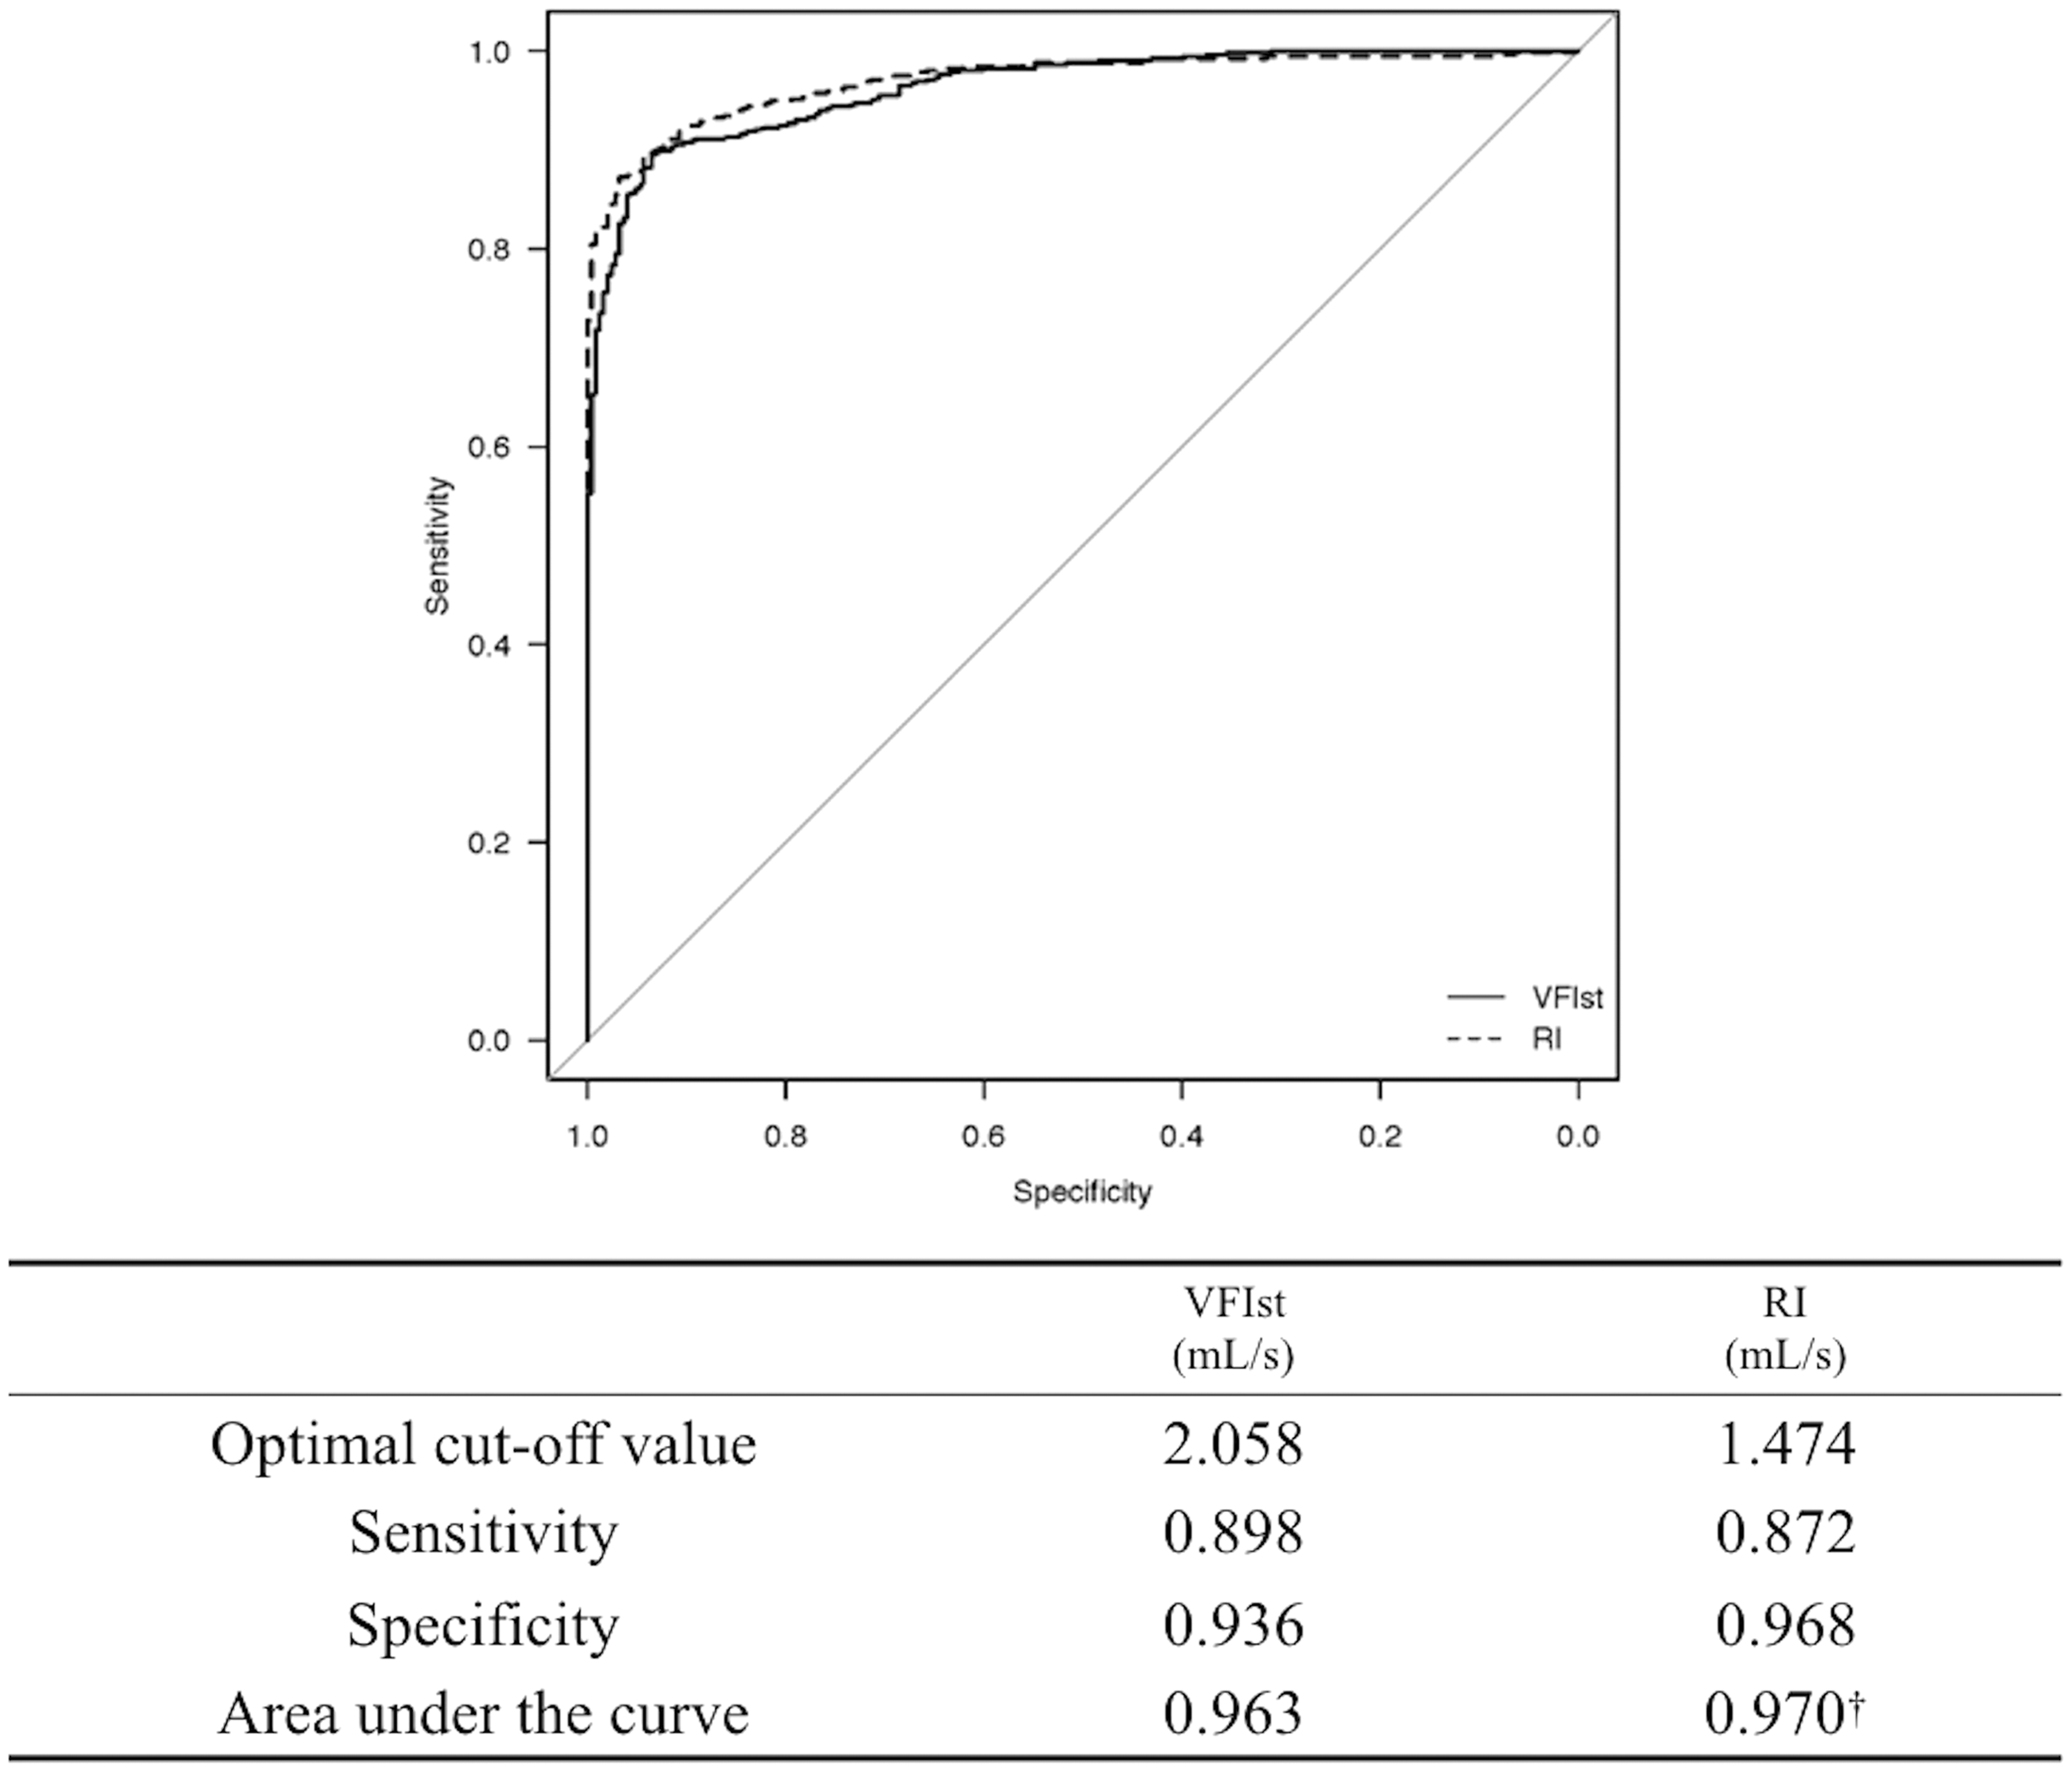
Correlations between the VFIsu, VFIst, BMI and maxAIR
Figure 4 shows the correlations among the VFIsu, VFIst, BMI and maxAIR in NG and VG patients. A very strong correlation was observed between the maxAIR and VFIsu in both NG (r = 0.89) and VG (r = 0.85) patients. The high correlation coefficients (r = 0.70) in the maxAIR and VFIst in the NG were markedly decreased (r = 0.35) due to venous reflux in the VG. The maxAIR showed moderate correlations (r = 0.42–0.48) with BMI in the NG and VG.
The relationship among the VFIsu, VFIst, BMI and maxAIR in the NG (top) and VG (bottom). The correlation coefficient of the VFIst and maxAIR in the VG (r = 0.35) was markedly lower than that in the NG (r = 0.70) due to venous reflux.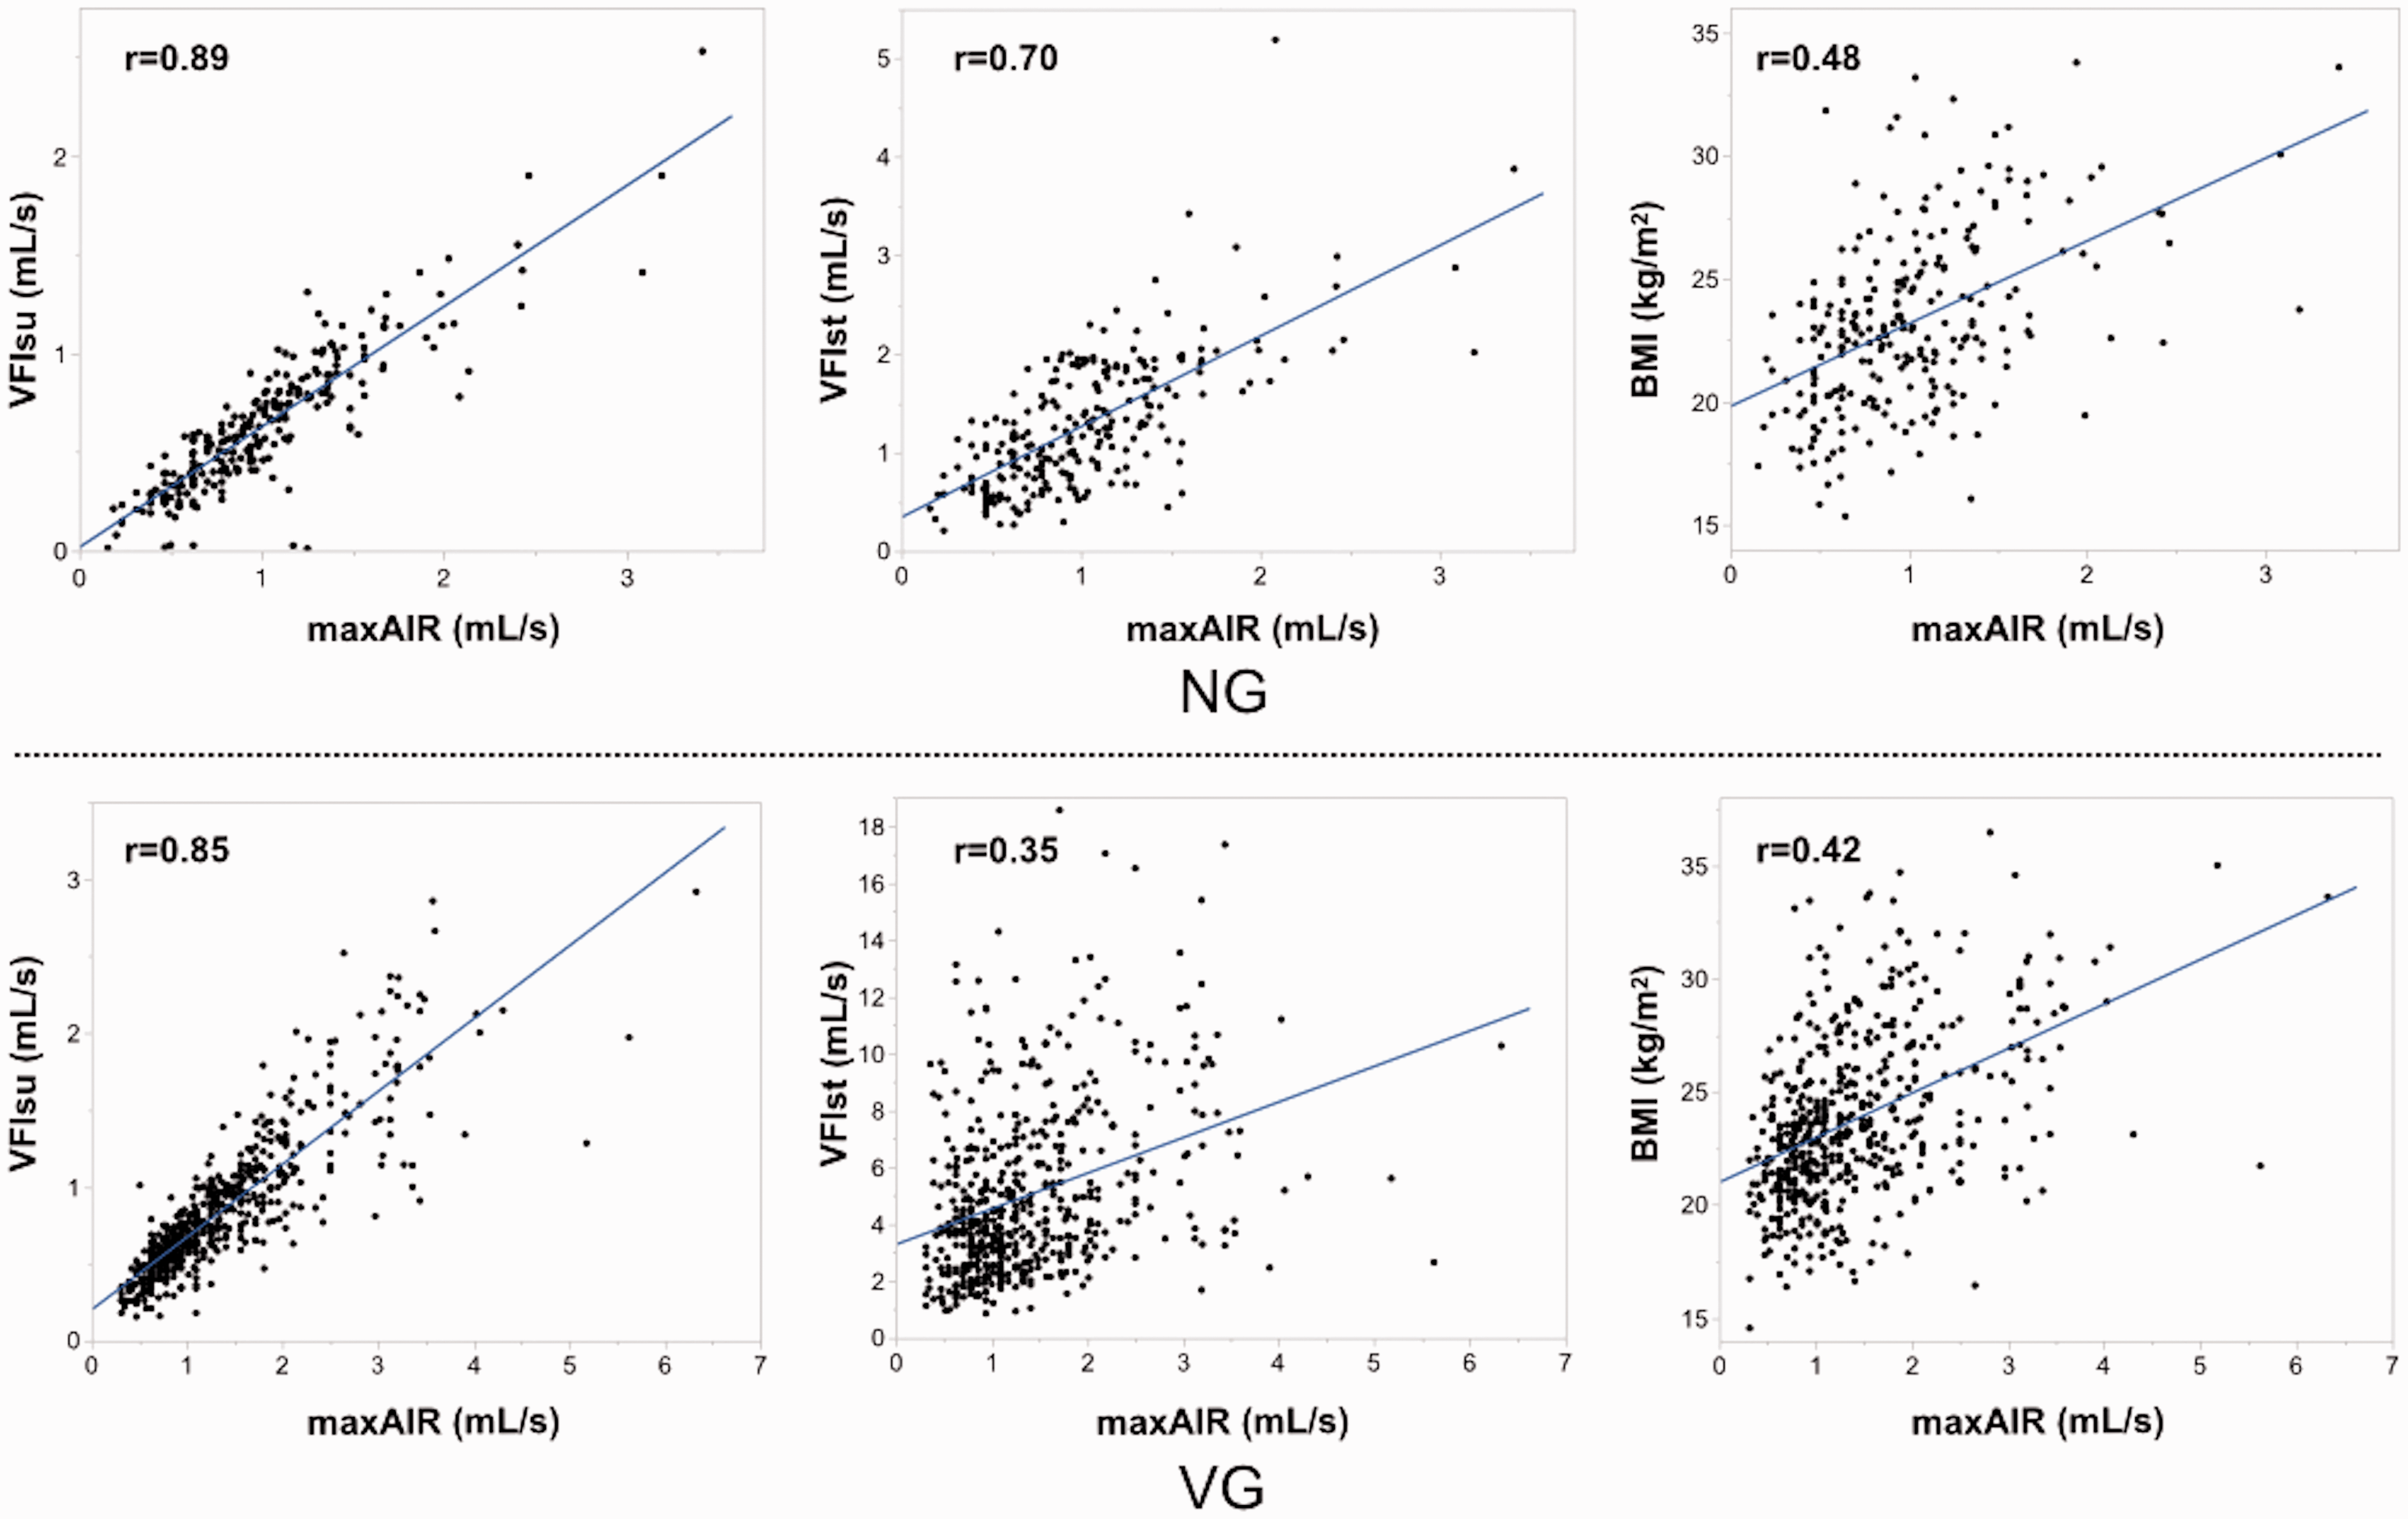
Comparison of each APG-obtained parameter among the groups
Comparison of parameters representing the venous volume.

NG: normal group; VVst: venous volume obtained with an exercise test while standing; VC: the venous capacity in the supine position that was obtained with the venous occlusion method.
p < 0.0001 vs. the NG.
p < 0.0001 vs. the NG and p < 0.01 vs. the C2–3 group.
p < 0.0001 vs. the NG and p < 0.05 vs. the C2–3 group.
Comparison of parameters representing the venous volume
The VVst and VC represented the venous volume. While VC was the volume under constant pressure load (70 mmHg), VVst was the volume under the hydrostatic pressure load with reflux. The VVst and VC were significantly greater in the C2–3 (106.9 [38.3–355.5] and 71.6 [13.2–264.8], respectively) and C4–6 groups (116.4 [39.2–294.7] and 78.2 [26.3–191.1], respectively) than in the NG (78.1 [25.0–82.8] and 55.4 [138–130.6], respectively). Although the VVst in the C4-6 group was significantly greater than that in the C2–3 group, there was no significant difference in the VC between the C2–3 and C4–6 groups (Table 3).
Comparison of parameters representing venous reflux
The VFIst and RI represented venous reflux from the thigh to the calf. Although the VFIst was significantly greater in the C4–6 group (4.774 [0.860–18.55]) than in the C2–3 group (4.053 [0.860–18.66]), there was no significant difference in the RI between the C2–3 (3.421 [−0.269 to 17.62]) and C4–6 groups (3.768 [0.374–15.09]). The VFIst and RI were significantly greater in these groups than in the NG (1.150 [0.208–5.191] and 0.567 [−0.335 to 4.411], respectively) (Figure 5, top).
A box plot showing the VFIst and RI, which represent the venous reflux rate (top); and VFIsu and maxAIR, which represent the arterial inflow rate (bottom) according to group classification. There was no significant difference in the RI between the C2–3 and C4–6 groups. The VFIsu and maxAIR increased gradually according to clinical severity. The dots represent outliers.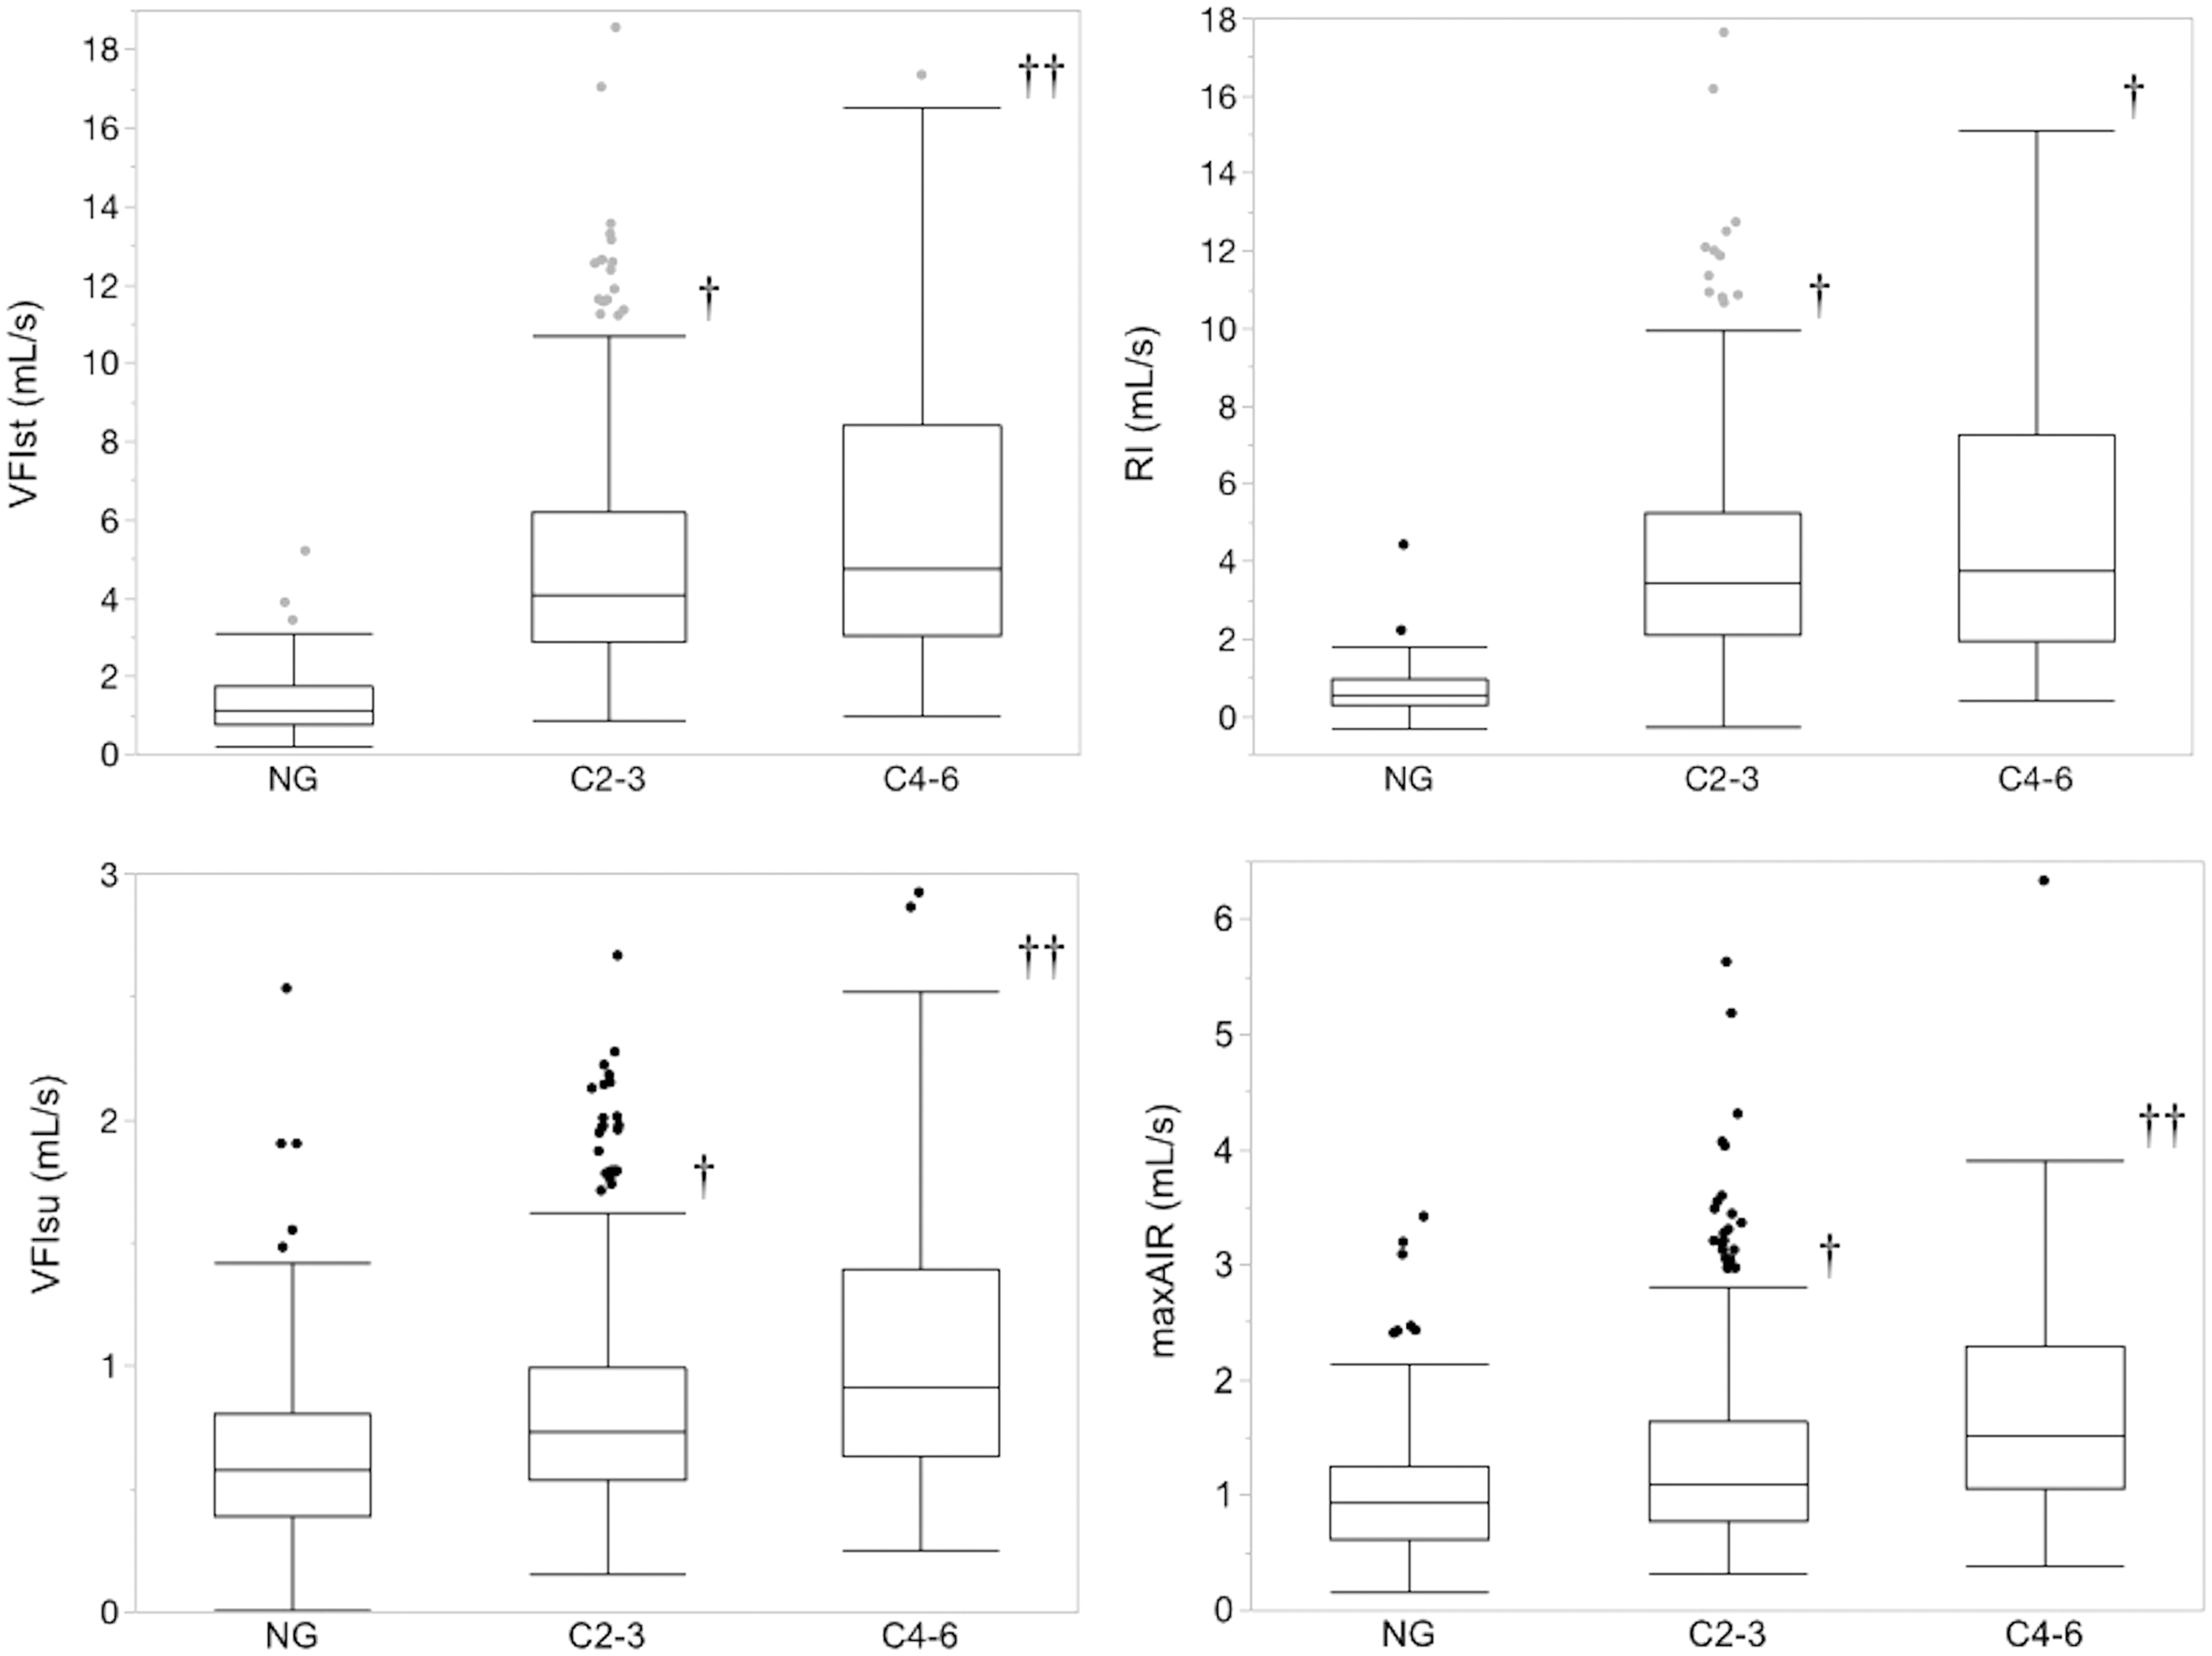
Comparison of parameters representing the arterial inflow rate
The maxAIR and VFIsu represented the arterial inflow rate. The maxAIR (mL/s) and VFIsu (mL/s) were significantly (p < 0.0001) increased step-by-step according to their clinical classification. Thus, the maxAIR was 0.938 (0.156–3.414) in the NG, 1.094 (0.313–5.625) in the C2–3 group and 1.528 (0.390–6.328) in the C4–6 group. The VFIsu was 0.580 (0.011–2.530) in the NG, 0.730 (0.156–2.664) in the C2–3 group and 0.910 (0.253–2.920) in the C4–6 group (Figure 5, bottom).
Comparison of parameters representing the calf muscle's pump function
The value of each parameter that was obtained using air plethysmography.
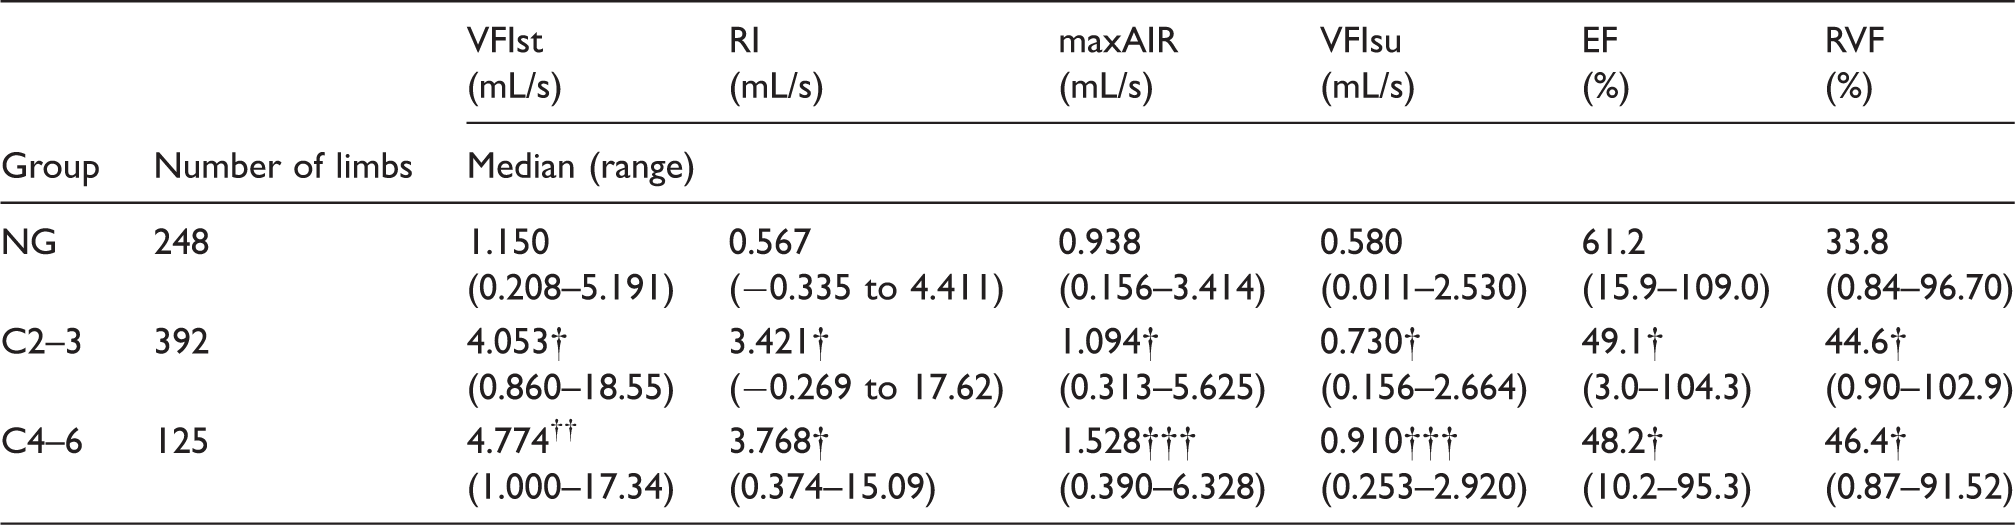
The data are presented as a number or median (range).
NG: normal group; VG: varicose vein group; VFIst: venous filling index while standing; RI: regurgitation index; maxAIR: maximum arterial inflow rate; VFIsu: venous filling index in the supine position; EF: ejection fraction; RVF: residual volume fraction.
p < 0.0001 vs. the NG.
p < 0.0001 vs. the NG and p < 0.05 vs. the C2–3 group.
p < 0.0001 vs. the NG and C2–3 group.
Comparison of the arterial inflow rate in limbs with low venous reflux
Characteristics and APG measurements of data in extracted patients from each group who had an RI value that was less than 1.474 mL/s (the optimal cut-off value).

APG: air plethysmography; RI: regurgitation index; NG: normal group; C2–3: clinical classification 2 and 3.
p < 0.05 vs. the ex-NG.
p < 0.01 vs. the ex-NG.
p < 0.05 vs. the ex-C2–3 group.
Discussion
The key haemodynamic results in this study are as follows: (1) There was no significant difference in RI between C2–3 and C4–6; (2) maxAIR and VFIsu significantly increased according to clinical severity (NG < C2–3 < C4–6) and (3) maxAIR in ex-C4–6 increased significantly more than in ex-NG and ex-C2–3.
Although the venous reflux volume is a major factor in the deterioration of venous hypertension, 4 venous reflux that is quantified with DS is poorly correlated with clinical severity due to its segmental, not whole, reflux volume. 1 On the other hand, while VFI that is obtained with APG is considered to quantify the whole reflux from the thigh to the calf, it cannot detect outward flow of the incomplete perforating vein in the calf, nor distinguish between the superficial and deep vein and separate information on the arterial inflow rate. Because the VFI is greatly affected by the arterial inflow rate, 11 when the relationship between venous reflux and clinical severity is evaluated using VFI, it is important to remove the arterial factor from VFI. Christopoulos et al. described that the incidences of ulceration, chronic oedema and skin changes increase with increased VFI. 12 Bemmelen et al. described that although VFI in limbs with ulcers and dermatitis was significantly higher than it was in limbs with varicose veins, there was a large amount of overlap. 13 Concerning the relationship between the reflux rate and development of skin changes, result number 1 indicates that increasing reflux volume is not the primary cause of developing skin changes and the results of previous reports seem to be caused by an increased arterial inflow rate. In addition to a higher resting arterial inflow rate in patients with primary varicose veins compared to normal subjects, and an increase in the arterial inflow rate with increasing clinical severity,3,14 there is a difference in the veno-arterial response and venous tone changes that reflect postural change between normal limbs and limbs with venous hypertension. In this study, a significant difference in the VVst, but no significant difference in the VC between the C2–3 and C4–6 groups, suggests that this may depend on a difference in the arterial inflow rate according to postural change due to reduced or abolished veno-arterial reflex. Thus, even if the amount of venous reflux and venous distensibility or tone is the same, if the amount of arterial inflow while standing in C4–6 patients is greater than that in C2–3 patients, the VVst in C4–6 patients would be larger than that in C2–3 patients due to increasing venous returning volume.
There are several theories concerning deteriorating chronic venous diseases. 15 Patients with primary varicose veins and people at a high risk of developing chronic vein insufficiency have generalized high distensibility of the vein that is possibly hereditary. 6 In addition to this hereditary factor, long periods of sitting or standing and reduced ankle range of motion would reduce sheer stress to the venous endothelium, increasing endothelial–leukocyte interaction16,17 and leading to valve degeneration and venous wall remodeling. 18 Morbid obesity reduces the vein's distensibility and increases intra-abdominal pressure and the arterial inflow rate. Furthermore, increased hydrostatic pressure deteriorates capillary resistance, causing microangiopathy, which leads to gradual deterioration of the skin's microcirculation that in turn leads to skin damage. Even in legs with a small amount of venous reflux, a combination of pathophysiologic factors is considered to worsen subdermal and dermal inflammation and increase arterial inflow rate through angiogenesis and arterio-venous shunt formation.
However, it is not considered that increased arterial inflow directly causes skin changes. Results number 2 and 3 suggest that patients in the C4–6 group may have the pathophysiology described above, in contrast to C2–3.
Regarding the role of incompetent calf perforators, lbegbuna et al. reported that an increased number of incompetent perforators in the calf lead to increased VFI. 19 As the amount of outward flow via an incompetent perforator could not be detected with APG, this result implies an increased arterial inflow rate.
Although previous reports have described the significance of incompetent perforators in the development of skin changes and the importance of treating them, 20 the same proportion of concomitant incompetent perforators was found in C4–6 and C2–3 patients in this study. Local subcutaneous venous hypertension following reflux via an incompetent perforator might cause local subcutaneous inflammation resulting in increased arterial inflow rate. 21
Regarding the relationship between poor calf muscle function and deteriorated venous insufficiency, limited ankle movement affects the calf muscle's pump function.22,23 Because EF and RVF, which were evaluated using an exercise test, do not exactly reflect daily walking, 24 it was not clear through this study whether poor calf muscle function causes skin damage.
Limitations
The participants who were defined as normal and classified into the NG were not healthy volunteers but ambulatory patients without clinical and echographic abnormalities at the time of their clinical visit. Although variability in venous haemodynamics with daily activity was reported, 25 the examination time was not constant. Although the RI is based on a theory that the actual reflux rate was the VFIst minus the arterial inflow rate while standing, which could not be measured by APG, the RI in the VG group was possibly greater than the actual value due to reduced or abolished veno-arterial reflex.
Conclusion
According to the analysis of parameters that were obtained with APG, it is not essential to increase the venous reflux rate in patients with skin changes; rather, it is based on various pathophysiological conditions that lead to increased arterial inflow rate.
Footnotes
Acknowledgements
Declaration of Conflicting Interests
The author(s) declares no potential conflicts of interests with respect to the research, authorship, and/or publication of this article.
Funding
The author(s) received no financial support for the research, authorship, and/or publication of this article.
Ethical approval
N/A.
Guarantor
N/A.
Contributorship
N/A.