



Abstract
Objectives
To determine the effect of liquid gas fraction (LGF), sclerosant type and concentration, and filter use on foam bubble size and count.
Methods
Sclerosant foam microstructure was investigated using light microscopy for a range of LGFs (1 + 2, 1 + 4 and 1 + 8), for both sodium tetradecyl sulphate (STS) and polidocanol (POL), at a range of concentrations (0.5–3%), with and without the addition of micro-filters. Foam was generated using a modified Tessari method and placed into wells for analysis by light microscopy. Foam microscopic morphology was photographically documented, and bubble diameters and counts were quantified.
Results
Spherical bubbles were observed at lower LGF and a trend towards polyhedral morphology was observed at the higher LGF of (1 + 8). The higher gas content in LGF led to larger but fewer bubbles. POL bubble diameters appeared to be more influenced by concentration than STS with smaller bubbles observed at higher concentrations of POL. The mean bubble diameters were slightly larger for STS than POL at the highest concentration of 3% but smaller at lower concentrations of 1% and 1.5%.
Conclusions
LGF is the primary determinant of bubble diameter and count. In contrast to STS, POL concentration influences the foam bubble size with smaller bubbles generated at higher concentrations of POL and larger bubbles appearing at low concentrations of this agent.
Keywords
Introduction
Aqueous foams are comprised of dispersed gas bubbles separated by a thin liquid film of surfactant.1,2 Sclerosing foams are generated by mixing detergent sclerosants such as Sodium Tetradecyl Sulphate (STS) or Polidocanol (POL) with a gas such as the room air or other gases such as sterile air, carbon dioxide (CO2) or a mixture of CO2 and oxygen (O2). 3 The generated foam can be classified as micro-foam (<200 μm), mini-foam (200–500–μm) or macro-foam (>500 μm) based on the average bubble diameter. 4
Foam sclerosants are considered advantageous to liquid agents as the increased viscosity of foam 5 allows for displacement of intravascular blood, minimising dilution and deactivation of the active sclerosant by plasma proteins and circulating blood cells.6,7 Despite the increased clinical efficacy, foam sclerotherapy is associated with an increased risk of neurological complications, predominantly associated with the introduction of macrobubbles into the central venous system with potential for paradoxical embolism via a patent foramen ovale (PFO).8,9
In previous studies, we investigated the basic physiochemical properties of sclerosant foams and in particular the sclerosant foam density and viscosity. 5 In other investigations, we examined the effect of liquid gas fraction (LGF) 4 and temperature 10 on foam stability and rheology. In simulation experiments, we investigated the fate of sclerosant foams (bubble count and diameter) over a set time period following injection into an in vitro model of straight veins. 4
The aim of this study was to examine the effect of LGF, sclerosant concentration, sclerosant type and the use of filters on sclerosant foam microstructure with an emphasis on bubble morphology, size and count.
Methods
Definitions
LGF was defined as the relative volumes of liquid and gas constituents used in foam preparation. The reference foam of (1 + 4) consisted of one-part sclerosant liquid and four parts gas. LGF investigated in this study included (1 + 2), (1 + 4) and (1 + 8). Descriptive terms of ‘wet’ and ‘dry’ were used in comparative terms to the (1 + 4) reference foam with ‘wet’ foams containing less gas volume e.g. (1 + 2) and ‘dry’ foams containing a higher gas content e.g. (1 + 8).
Materials
These included STS 3.0% (FIBROVEIN, STD Pharmaceuticals, Hereford, UK); POL 3.0% (Aethoxysklerol, Chemische Fabrik Kreussler, Wiesbaden, Germany); Normal Saline comprising Sodium Chloride 0.9% w/v (Baxter Healthcare, NSW, Australia); 1mL luer-lock syringe (Becton Dickson [BD], NJ, USA); 3mL luer-slip syringe (Terumo, NJ, USA); three-way stopcock (BD); 5-micron Sterifix filter (B-Braun, Melsungen, Germany); 25G (0.260mm bore) needles (BD); Adobe Photoshop version CS2 (Adobe System Inc, San Jose, California, USA); MATLAB software (MathWorks Inc, Natick, Massachusetts, USA); Leica DM5500 Microscope (Leica Microsystems GmbH, Wetzlar, Germany).
Sclerosant Foam Preparation
3% sclerosants were diluted with normal saline to achieve final concentrations. Foam was generated using a modified Tessari method. 3 Briefly, 0.6 mL of liquid sclerosant was drawn up in the 1mL syringe and 2.4 mL of room air in the 3 mL syringe to achieve the desired LGF. The two syringes were then assembled using a three-way stopcock. In filter experiments, two 5µm filters were added to the assembly with one filter placed on each syringe. The stopcock and filter assembly dead-space always consisted of room air at start of foam generation. The plunger was moved through 10 full strokes to disperse the gas in liquid. One stroke was defined as the emptying movement and re-filling of the syringe initially filled with liquid. The assembly was inverted once during foam preparation to allow further mixing. All experiments were performed at room temperature.
Microscopy image acquisition
All images were captured within 10 seconds of foam preparation. We assessed several different techniques for capturing bubble images by light microscopy. Capturing foam structures with these techniques faced inherent limitations such as sample focusing. The techniques were compared to determine the flaws for each method and to adopt the most suitable technique (Figure 1).

Image acquisition methods. We trialed various image capturing methods to assess foam microstructure including (a) conventional, (b) double-glass slides and (c) petri dish and found them all problematic resulting in errors. The syringe-well method (d) was developed and adopted for these experiments.
Single glass slide, glass cover slip
This method has been previously reported by others. 11 Here, sclerosant foam is placed on a glass slide covered by a glass cover slip (Figure 1(a)). This technique has multiple flaws as the bubbles are squashed, bubble morphology is artificially changed from circular to polyhedral and bubble walls artificially appear too thick hence diameter measurements were neither accurate nor reliable.
Double glass slides
In the second method, we introduced a 1mm gap between two glass slides (Figure 1(b)). This method introduced artificially thick bubble borders and visual interference due to artefacts such as reflection and refraction.
Petri dish
In the third method, we attempted to eliminate the compression of foam bubbles by using a Petri Dish (Figure 1(c)). Using this method, the bubble walls were distinctively displayed but with the drawback of unfocussed images due to the uneven surface of the sample on the dish.
Foam wells
The final and most successful method involved creating wells constructed from the ends of syringes (Figure 1(d)). This method introduced a container height of 8mm that allowed bubbles to move freely without squashing. Excessive (or overflowing) foam was removed and covered using a glass coverslip. This method was used for all subsequent analyses.
Image enhancement
Images were processed to distinguish bubble types (complete or partial) using Photoshop. Complete bubbles in the microscopy images were coloured red for STS and blue for POL. Partial bubbles that appeared on the edge of the image were coloured green. An example of an original image and the processed image are shown in Figure 2.

Image enhancing process. The original (a) microscopy image for polidocanol (POL) 3.0% (b) with patched colours (blue for complete bubbles and green for partial bubbles) after manually distinguished complete and partial bubbles.
MATLAB analysis
A code was written to detect, count and measure the diameter of the bubbles. The code counted the complete bubbles and measured the internal area of each bubble and computed an equivalent diameter for each complete bubble. The code counted only the complete bubbles in the field of view. The code was based on a previous study, where a line was manually drawn onto all bubbles to detect, count, and measure the bubbles. 12 The current code did not make the assumption that bubbles were spherical, and the modified MATLAB code detected complete bubble area instead of line. The code computed an equivalent diameter based on the area, with the diameter for the complete bubbles (irregular shape) equal to the diameter of a sphere of equivalent cross-sectional area. 13
Statistics
Results are expressed as the mean ± the standard error of the mean (SEM). Mean bubble counts were measured from the total number of bubbles per image. Calculated mean bubble diameter were based on pooled results of all fields of view from each replicate. P-values were calculated using an unpaired T-Test with two tails. The breakdowns of P values were indicated as not significant (NS) when P > .05, and significance indicated as *P ≤ .05, **P ≤ .01, ***P ≤ .001 and ****P ≤ .0001.
Results
Foam morphology
Spherical bubbles were observed at lower LGFs with a trend towards polyhedral morphology at the higher LGF of (1 + 8) (Figure 3).
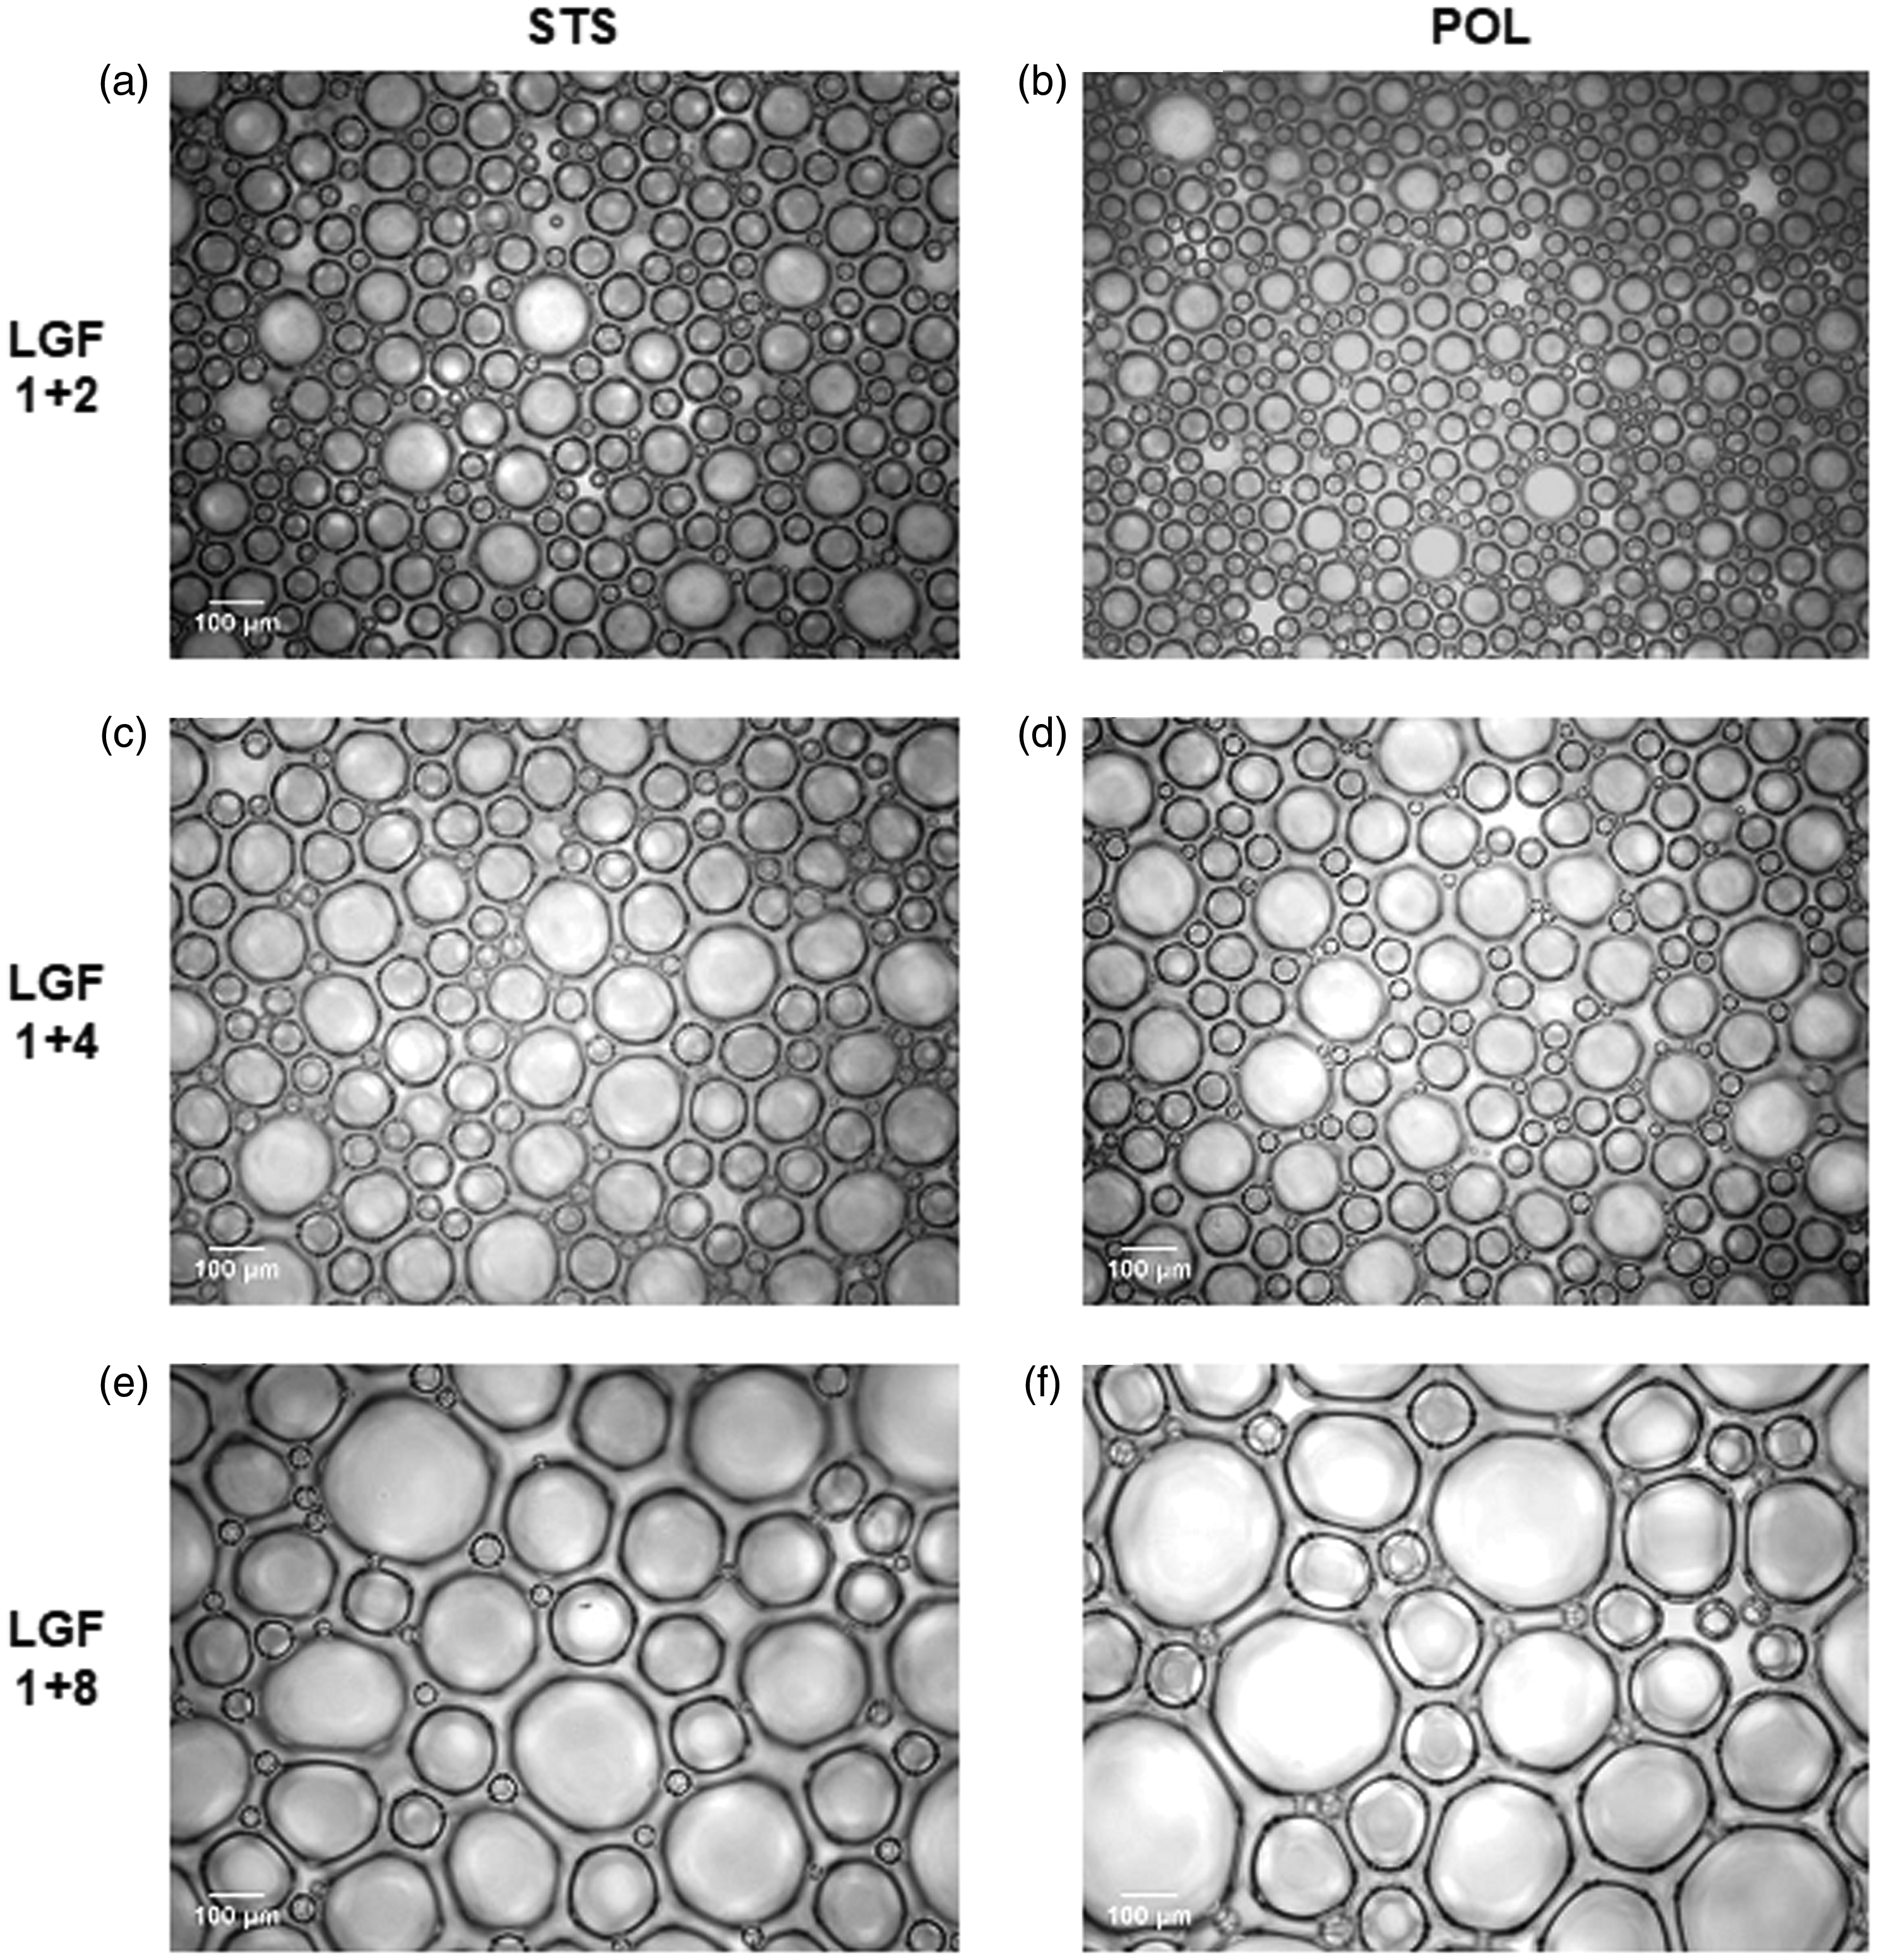
Foam microstructure. Microscopic images demonstrating the effect of liquid gas fraction (LGF) on foam bubble morphology. The wettest foams (LGF 1 + 2), showed the smallest bubble diameters, the largest number of bubbles and a circular morphology. The driest foams (LGF 1 + 8) showed the largest size and the lowest counts of bubbles while showing a trend towards a polyhedral morphology.
Effect of liquid gas fraction
A statistically significant increase in bubble diameter correlating with a significant decrease in the bubble count was observed at increasing LGFs (Table 1; Figures 3 and 4). This trend was consistent for all remaining sclerosant concentrations (0.5, 1.0 and 1.5%, data not shown).
The effect of liquid gas fraction (LGF), sclerosant concentration and sclerosant type, sodium tetradecyl sulphate (STS) vs. polidocanol (POL), on foam bubble diameter. Shaded areas correspond to the most clinically used LGF of (1 + 4) Tessari foam. Comparative terms refer to values across rows.

A. The effect of LGF on bubble size for each sclerosant at 3% concentration (Figure 4). Both agents demonstrated a progressive and significant increase in bubble size that corelated with a decrease in bubble count (not tabulated) with the increase in gas content.
B. The effect of concentration on bubble size for STS (Figure 5). At LGF (1 + 2), 0.5% STS bubbles were smaller than 1% but there was no difference with higher concentrations of 1% and 1.5%. At LGF (1 + 4) and (1 + 8) a similar trend was observed of smaller diameters for the lower 0.5% concentration but no difference with the highest concentration of 3%.
C. The effect of concentration on bubble size for POL (Figure 5). At LGF (1 + 2), 0.5% POL bubbles were of a similar size to 1% but 1.5% and 3% showed significantly smaller diameters. At LGF (1 + 4), the increase in concentration resulted in a decrease in bubble diameters with the 0.5% showing the largest size. At (1 + 8), the rise in POL concentration did not influence the bubble size.
D. The effect of sclerosant type at LGF (1 + 4) on bubble diameter (Figure 6). The mean bubble diameter for STS foam was larger than POL foam. At 0.5%, there was no significant difference between STS and POL. STS showed smaller bubbles at 1% and 1.5% while POL generated smaller bubbles at 3%.
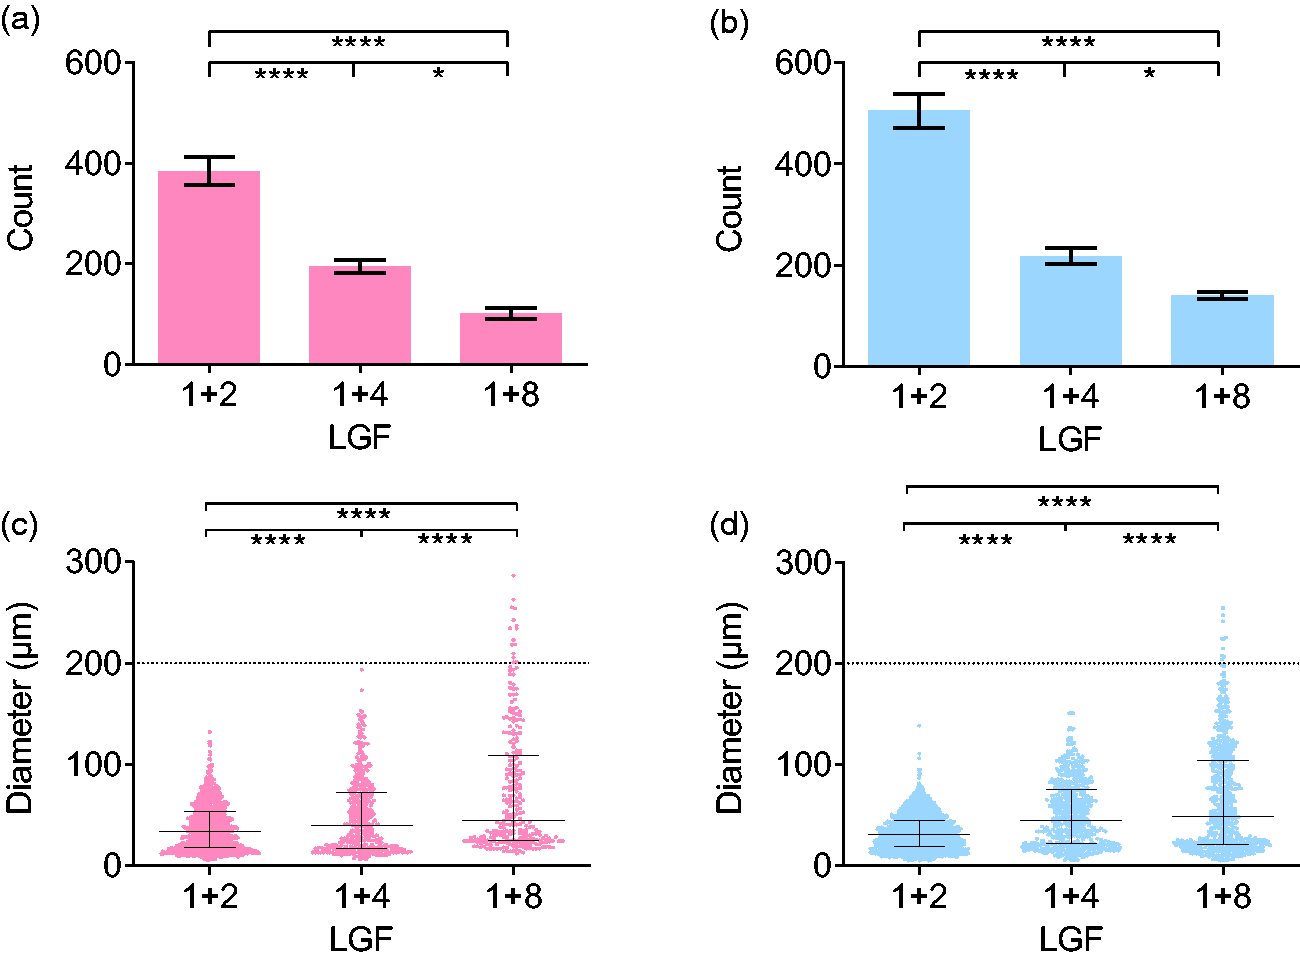
The effect of liquid gas fraction (LGF). The effect of liquid gas fraction (LGF) on foam bubble count and diameter for sodium tetradecyl sulphate (STS, pink) and polidocanol (POL, blue) both at 3%. Results for bubble count are presented as the mean ± SEM and results for bubble diameters are presented as the median ± interquartile range (n ≥ 3). The dotted line at 200 µm represents the distinction between microbubbles and minibubbles, with mini bubbles found in 0% of (1 + 2) foams, 0% in (1 + 4) foams and 5.43% of STS and 1.59% of POL (1 + 8) foams. Higher LGFs showed larger bubble diameters and smaller counts whereas lower LGFs showed significantly smaller bubbles but higher numbers.
Effect of sclerosant concentration
Sclerosant concentration had no effect on bubble count but selectively influenced the bubble diameters of POL foam (Table 1; Figure 5).
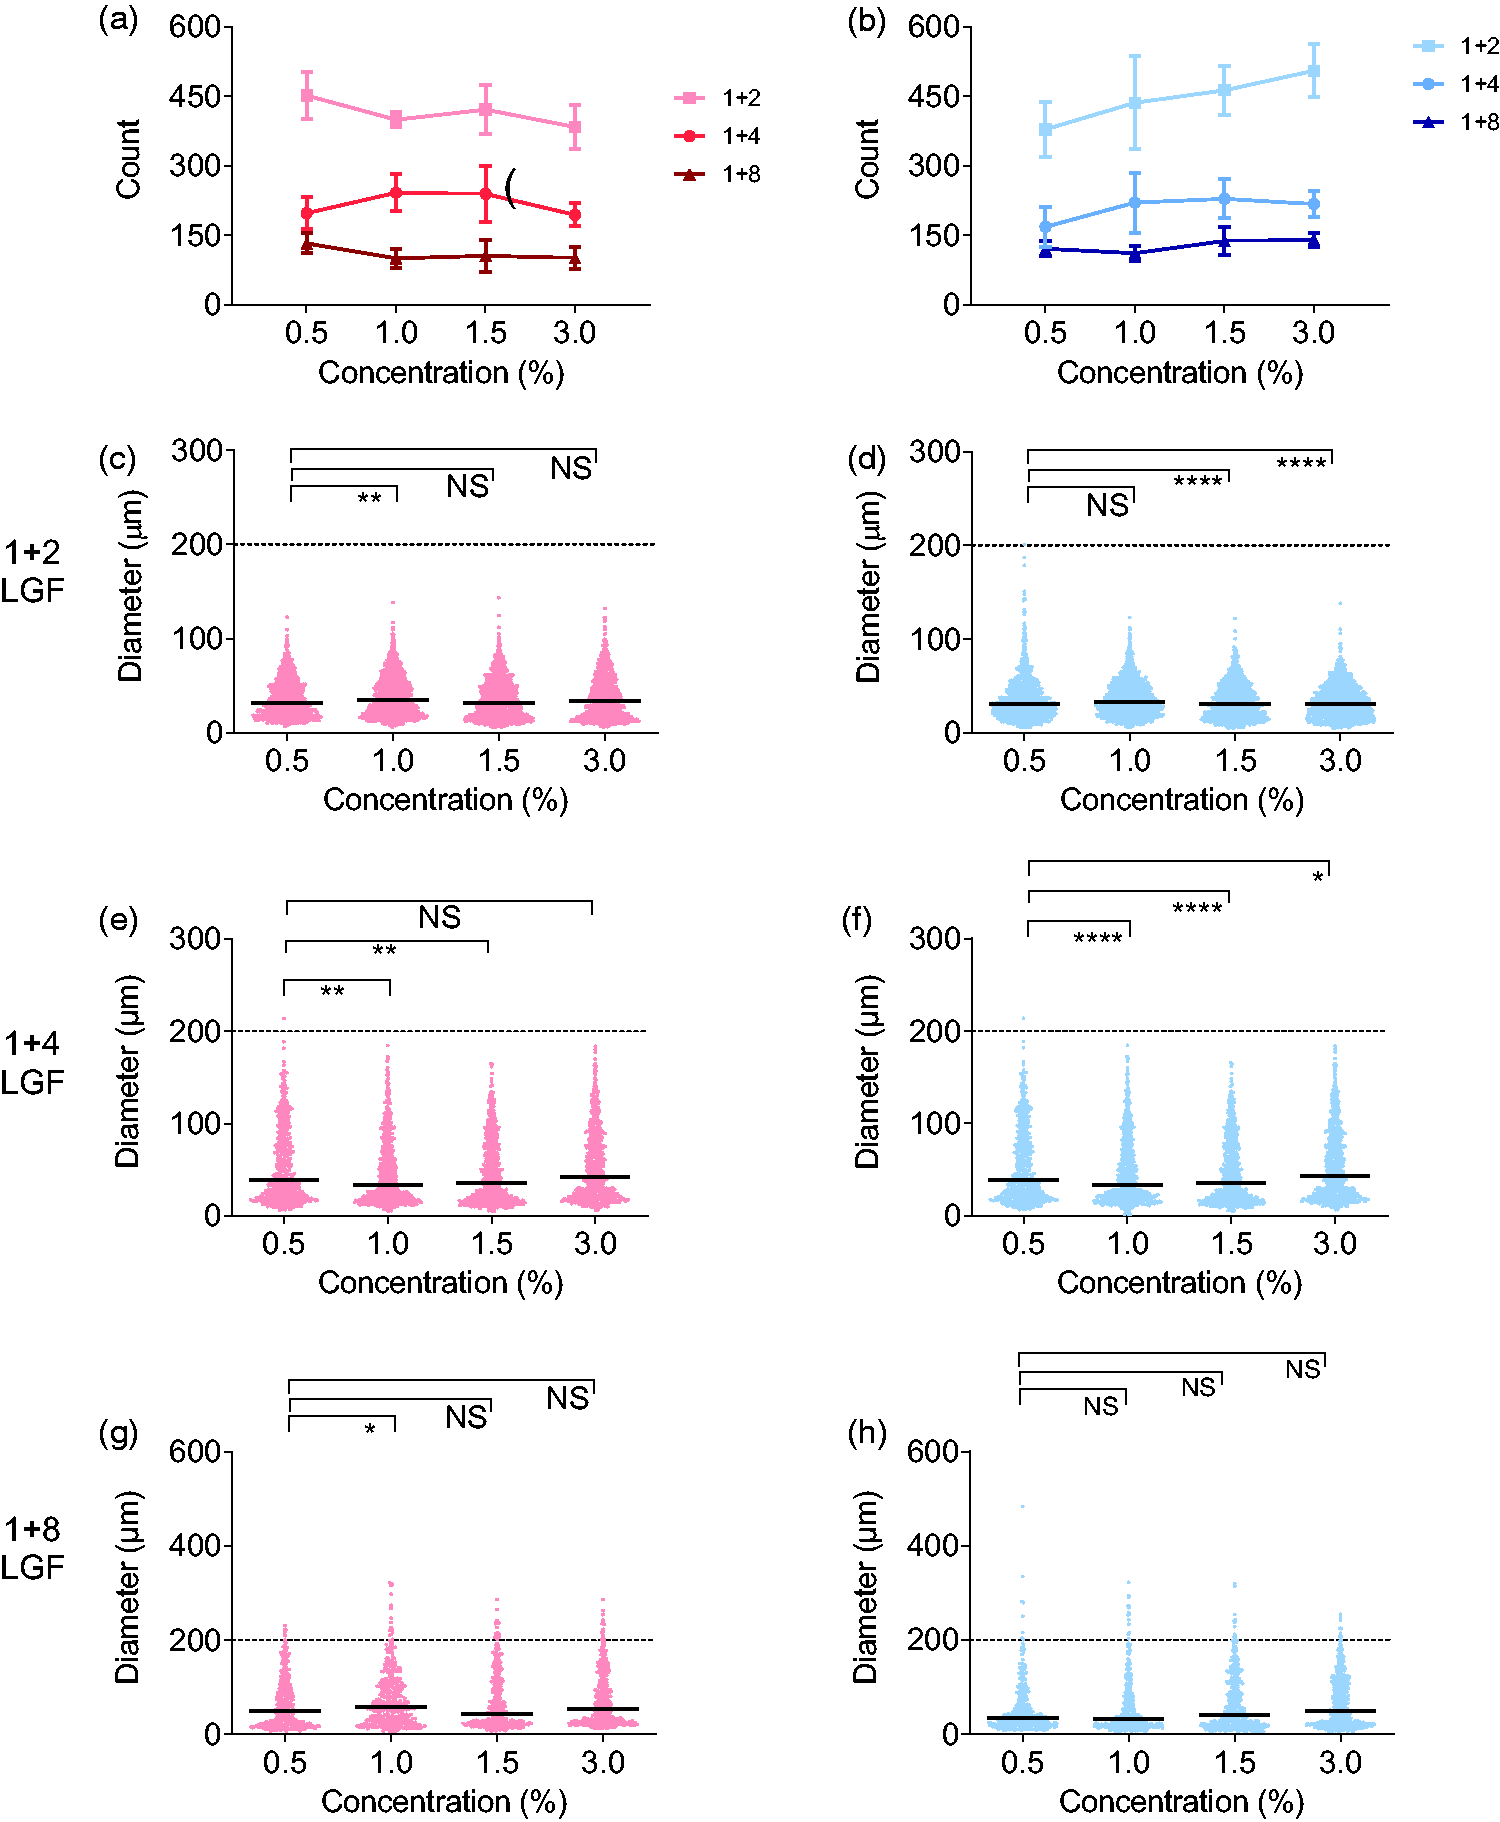
The effect of sclerosant concentration. The effect of sclerosant concentration on foam bubble count and diameter for sodium tetradecyl sulphate (STS, pink) and polidocanol (POL, blue) at increasing concentrations and liquid gas fractions (LGF). Results for bubble count are presented as the mean ± SEM and results for bubble diameters are presented as the median ± interquartile range (n ≥ 3). The dotted line at 200 µm represents the distinction between microbubbles and minibubbles. Minibubbles for each figure at 0.5, 1.0, 1.5 and 3.0% concentrations were respectively (c) 0,0,0,0%, (d) 0.09,0,0,0%, (e) 0.17,0,0,0%, (f) 0.39,0.19,.012,0%, (g) 1.51, 3.75, 4.41, 3.37%, (h) 2.21,4.22,2.62,1.89%. See Table 1 for interpretation of results.
Bubble count
Concentration had no statistically significant effect on bubble count for either sclerosant (Figure 5(a) and (b)).
Bubble diameter
No macrobubbles (>500 µm) were generated in this study (Figure 5). The vast majority (94.6–100%) of bubbles were microbubbles (<200 μm) with the remaining being minibubbles (200–500 μm, 0–5.4%).
Polidocanol
Bubble diameters were influenced by POL concentration (Table 1; Figure 5(d), (f), and (h)). The diameters were smaller at higher concentrations of POL at both (1 + 2) and (1 + 4) LGFs but not at (1 + 8) where the excess gas content was the main determinant of bubble diameter. The changes were small but statistically significant.
STS
The effect of STS concentration on bubble diameter appeared erratic, complex and less predictable (Table 1; Figure 5(c), (e), and (g)).
Wet STS foams (LGF 1 + 2) demonstrated a statistically significant but very minor increase in bubble diameters from 0.5% to 1.0% but not at other tested concentrations (1.5% or 3.0%) (Table 1; Figure 5(c)).
Standard STS foams (LGF 1 + 4) showed a statistically significant but very minor decrease in bubble diameter from 0.5% to 1.0% and 1.5% but there was no difference between 0.5% and 3% (Table 1; Figure 5(e)).
Dry STS foams (LGF 1 + 8) showed a significant increase in bubble diameters from 0.5% to 1.0% but there was no difference between 0.5 and 1.5% or 3.0% (Table 1; Figure 5(g)).
Effect of Sclerosant Type
The effect of sclerosant type on bubble diameters and counts was determined at a constant LGF of (1 + 4) and a range of sclerosant concentrations (Table 1; Figure 6).

The effect of sclerosant type. The effect of sclerosant type on foam bubble count and diameter for sodium tetradecyl sulphate (STS, pink) and polidocanol (POL, blue) at LGF (1 + 4). Results for bubble count are presented as the mean ± SEM and results for bubble diameters are presented as the median ± interquartile range (n ≥ 3). The dotted line at 200 µm represents the distinction between microbubbles and minibubbles. Minibubbles for each figure for STS and POL were respectively (b) 0.16 and 0.39%, (d) 0.00 and 0.18%, (f) 0.00 and 0.12%, (h) 0.00 and 0.00%. See Table 1 for interpretation of results.
Bubble counts were not affected by sclerosant type at any of the tested concentrations. However, bubble diameters were influenced by the sclerosant type with POL showing larger bubbles at 1% and 1.5% while at 3% it showed smaller bubbles compared with STS. At 0.5% there was no difference between the two.
Addition of filters
The effect of incorporating 5-micron filters in the foam production assembly on bubble diameter and count was assessed using a constant LGF of (1 + 4) and at a range of sclerosant concentrations for both STS (Figure 7) and POL (Figure 8).
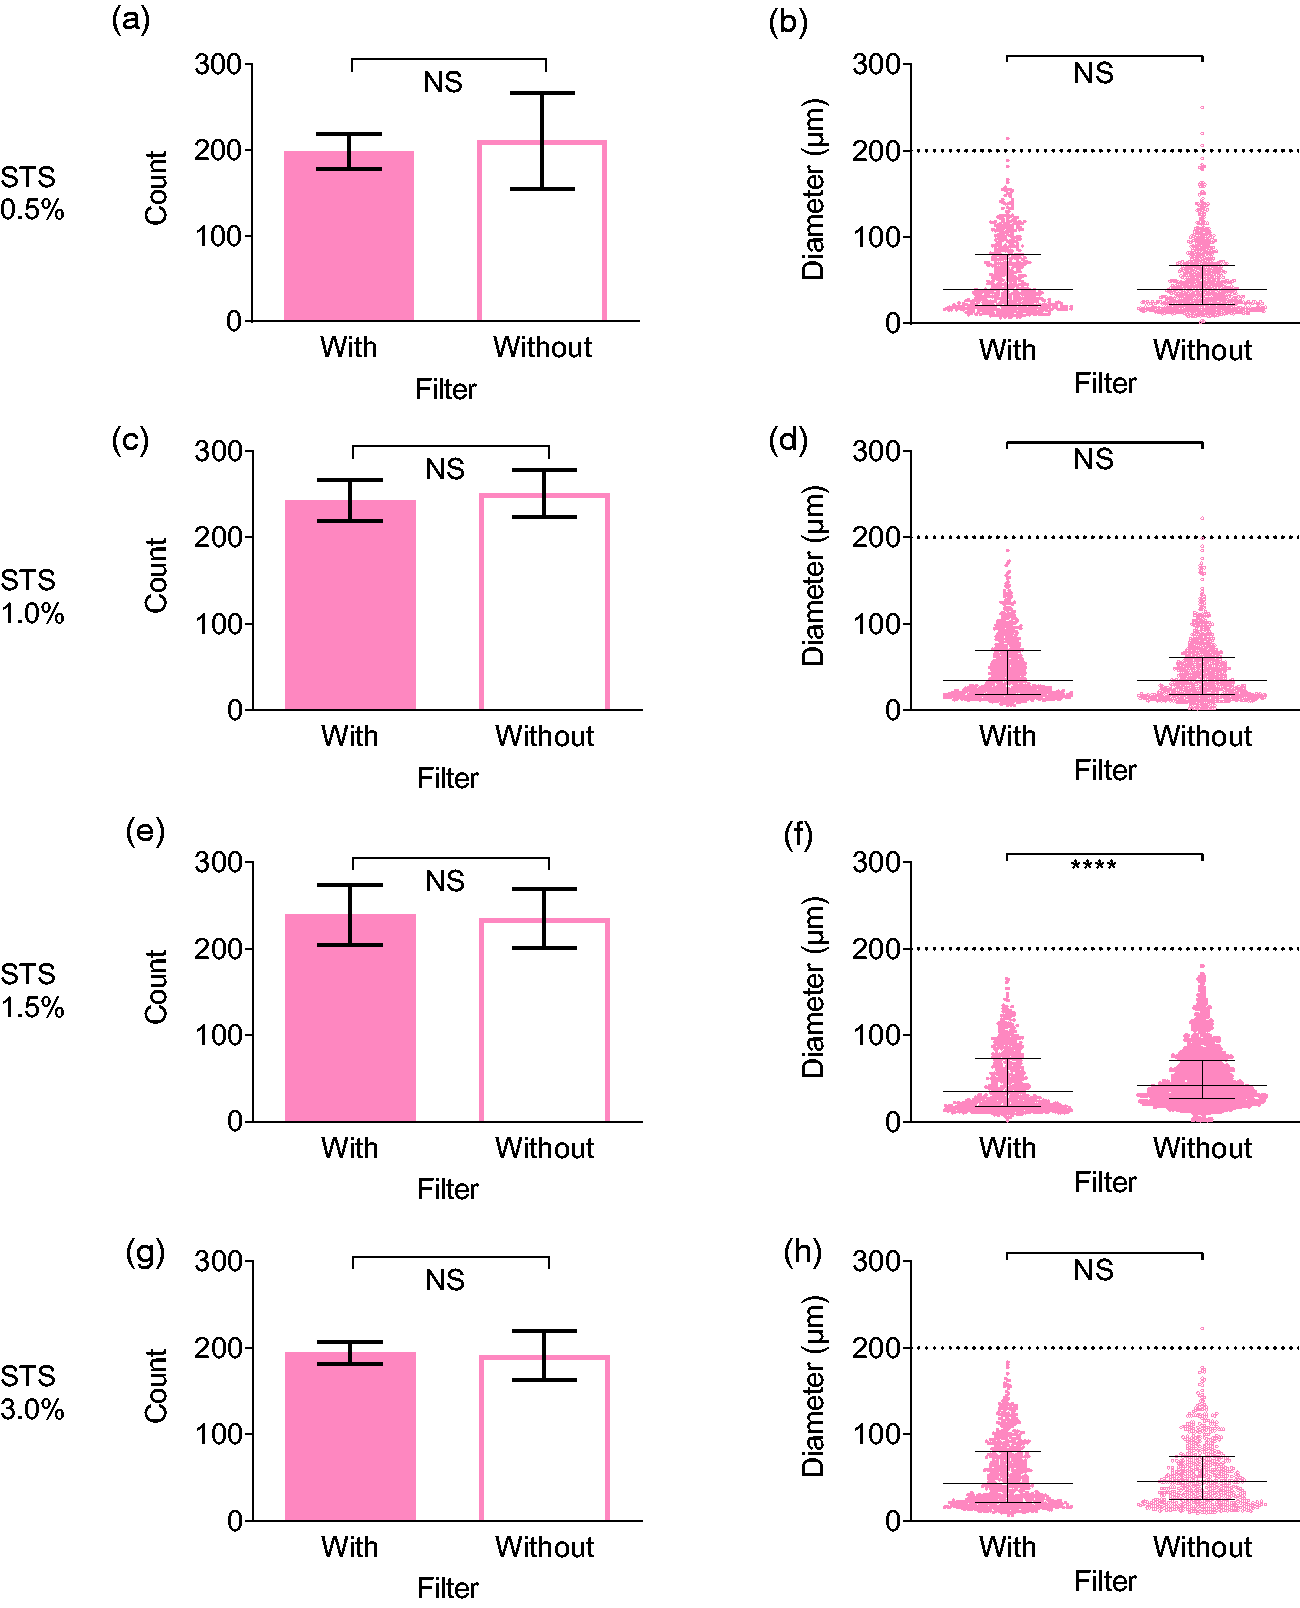
The effect of filters on STS bubble size and count. The effect of incorporating 0.5-micron filters in the foam assembly unit on bubble count and diameter for sodium tetradecyl sulphate (STS). Results for bubble count are presented as the mean ± SEM and results for bubble diameters are presented as the median ± interquartile range (n ≥ 3). The dotted line at 200 µm represents the distinction between microbubbles and minibubbles. Minibubbles for each figure with and without filters were respectively (b) 0.16 and 0.29%, (d) 0.00 and 0.10%, (f) 0.00 and 0.00%, (h) 0.00 and 0.13%.
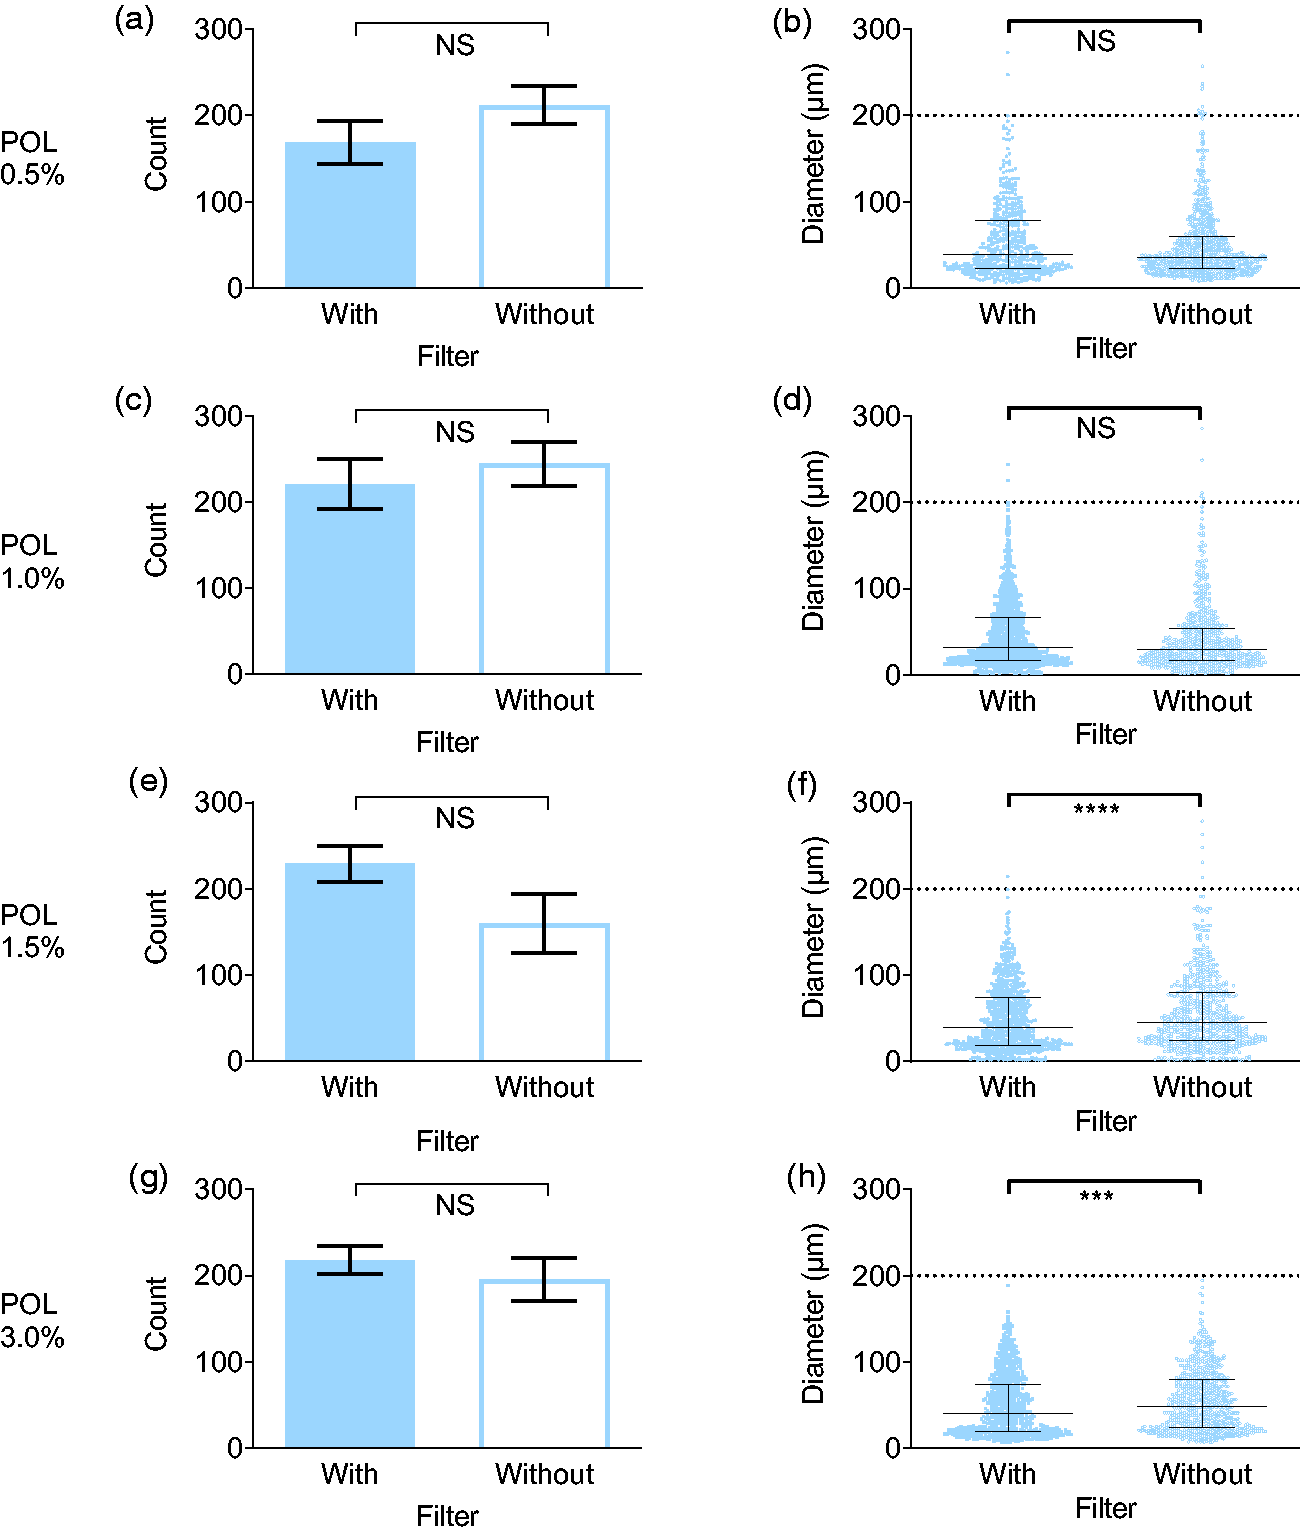
The effect of filters on POL bubble size and count. The effect of incorporating 0.5-micron filters in the foam assembly unit on bubble count and diameter for polidocanol (POL). Results for bubble count are presented as the mean ± SEM and results for bubble diameters are presented as the median ± interquartile range (n ≥ 3). Minibubbles for each figure with and without filters were respectively (b) 0.39 and 1.18%, (d) 0.18 and 0.71%, (f) 0.12 and 0.80%, (h) 0.00 and 0.00%.
Filter usage had no statistically significant effect on bubble counts for any sclerosant concentration or type. Inclusion of filters had no effect on mean bubble diameters except for STS 1.5% and POL 1.5% and 3%, where minor but still statistically significant decreases in bubble diameters were recorded.
Discussion
In this study, we aimed to determine the effect of LGF, sclerosant concentration, sclerosant type and the inclusion of filters on foam bubble counts and diameters by means of light microscopy. LGF was the main determinant of bubble size and count for both sclerosants with higher LGFs generating larger bubbles. Sclerosant concentration influenced the POL foam with higher concentrations showing smaller bubbles in wet and standard foams (LGF 1 + 2 and 1 + 4) but not in dry foams (LGF 1 + 8). High concentration of POL (3%) generated significantly smaller bubbles compared to STS while at lower concentrations of 1% and 1.5%, STS generated smaller bubbles compared to POL (Table 1).
Several methods can be used to determine the bubble size including microscopy, light scattering, light reflection and depolarisation and optical probes. In our previous studies involving vein injection models, we used a digital camera to capture images and to measure bubble diameters and counts. 4 In the current study, we improved on the image capture and analysis techniques by utilising light microscopy and MATLAB software. We also further refined the available microscopic methods to assess foam structure. We identified multiple flaws in the published methods and developed a novel in-house syringe well (8 mm height) model to capture microscopic images. These wells allowed bubbles to flow freely without being confined, compressed or deformed, providing superior images to those reported previously in other studies4,11.
Using this approach, we recorded smaller bubble diameters compared to other studies.4,11 The difference may be due to our new imaging technique or due to the materials used for foam generation and in particular the use of smaller syringe sizes (1 and 3 mL) used in this study. The smaller air-liquid interface provided by smaller syringe size would reduce the rate of bubble coalescence. The observed difference may also be due to the shorter image capture times of this study following foam preparation. Here, we captured microscopic images 10 seconds after foam generation, whereas in other studies bubble sizes were recorded at 40 115 seconds or even up to several minutes following foam preparation.4,11 At these prolonged time periods, bubbles coalescence would undoubtedly enlarge the diameters of any remaining bubbles.
Foams may be classified as dry (more gas content) or wet (less gas volume) relative to the commonly used (1 + 4) LGF. For instance, LGF of (1 + 8) and (1 + 6) would be considered dry due to the larger relative gas contents and (1 + 2) would be considered wet due to the larger relative liquid content. In general, dry foams are more viscous than wet foams.2,5,14 The gas content of the foam influences the shape of the bubbles and its viscosity as a whole.4,5 Wet foams are associated with spherical shape bubbles whereas polyhedral bubbles dominate in a dry foam. 15 Bubbles in wet foams tend to be less resistive to flow compared to dry foams due to higher liquid content allowing lower viscosities. 5 By contrast, the tightly packed polyhedral structure in dry foams is more resistive to flow and the high yield stress leads to higher viscosities. 16 In this study, a trend towards the polyhedral morphology was observed at the higher LGFs of 1 + 8. Perfect polyhedral morphology, however, was not obtained. The idealised Weaire–Phelan structure 17 representing an idealised stable foam of equal-sized bubbles in the lowest possible energy state may be the ideal bubble structure to be incorporated in sclerosant foams and should be the target of future research and development in this field.
In this study, increasing the LGF led to decreased bubble counts and increased bubble diameters as foams became dryer. The (1 + 2) LGF provided the smallest bubble diameters. Given the clinical concerns with systemic embolization of large diameter bubbles occluding cerebral arteries, it may be concluded that (1 + 2) is the ideal LGF given its small diameter bubbles. However, (1 + 2) is a wet foam with low viscosity and a high liquid drainage rate. 4 Wet foams do not fully occlude larger veins 18 and mix with blood more than dry foams resulting in dilution and deactivation of the active sclerosant and a reduction in the active concentration.6,7 This can result in treatment failure especially if wet foams are used to treat larger veins. Use of wet foams such as the (1 + 2) LGF may be appropriate in smaller veins such as dermal and subdermal reticular veins 19 where even the wet foam is able to displace the intravascular blood.
In this study, sclerosant concentration had no effect on the bubble count but the bubble diameters decreased with the increasing concentrations of the non-ionic surfactant, POL. This is consistent with the existing literature that increasing surfactant concentration leads to a reduction in foam bubble diameters.4,9,11,20–27 An increase in surfactant concentration results in an increase in liquid viscosity 5 and a subsequent reduction in bubble diameter. 22
However, this trend was not observed for the anionic surfactant, STS. This is consistent with studies comparing anionic with non-ionic surfactants.9,11 The apparent erratic and complex response of STS bubble diameter to the increase in STS concentration has been previously reported and may relate to the half-life of the surfactant foam. 24 Studies on bubble size and foam half-life have shown the same trend of a reduction followed by an increase in bubble size and foam half-life with increasing STS concentrations.4,10 Further research on the dynamic surface tension of anionic surfactants such as STS may further explore and explain the observed complex patterns. 24
In this study, the effect of concentration on bubble diameters was influenced by the sclerosant types tested. We compared the anionic sclerosant STS with the non-ionic POL. Whilst, there was no significant difference in bubble diameters between the two detergents at 0.5%, at the highest concentration of 3%, POL showed significantly smaller bubbles compared with STS. This is consistent with previous studies showing non-ionic surfactants generating smaller bubbles compared with anionic surfactants.27–29
We found the use of filters had a significant although minor effect on bubble diameters at the higher sclerosant concentrations (1.5% and 3%) clinically used to treat larger varicose veins. The filters used in this study had an average pore diameter of 5 µm and the diameter of the bubbles produced through the filters were on average between 71 and 83 µm. This implies that bubbles stretch through the pore rather than the filter producing bubbles of the same size as the pore.
This study may have a number of clinical implications. Whilst most practitioners are aware of the effect of increasing gas content on the bubble diameter, the effect of concentration on bubble size has not been clearly illustrated. Most practitioners use lower sclerosant concentrations to treat smaller vessels. As demonstrated here, lower POL concentrations generate larger bubbles. The larger bubble diameter is more likely to occlude cerebral vessels when systemically embolised. 8 Technique modifications and/or lower volumes of foam should be adopted to prevent systemic embolization of POL foam when lower concentrations of this agent is being used.
Whilst this paper may address some factors contributing to cerebral occlusion following foam sclerotherapy, it does not address all the etiologic factors in the development of neurologic events. The release of Endothelin-1 from endothelial cells has been demonstrated in a number of studies following foam sclerotherapy.30,31. Endothelin-1 is a potent vasoconstrictor and has been proposed to contribute to visual disturbances and migraine like symptoms following foam sclerotherapy. Further studies are required to determine whether air emboli or the release of endothelin-1 contribute more to these adverse effects.
We recognise several limitations in this study. Foam stability can be affected at higher temperatures 10 and hence the effect of temperature on bubble morphology, count and diameter should be investigated in future studies. All sclerosant foams produced in this study used room air. Future studies should investigate the effect of using other gases such as CO2 or CO2/O2 combinations and other foam generation materials on bubble morphology.
In conclusion, sclerosant foam LGF was the major determinant of sclerosant foam bubble size and count. Sclerosant concentration tends to influence the bubble diameters for non-ionic polidocanol with smaller diameters observed at higher concentrations but has no predictable effect on the anionic STS.
Footnotes
Acknowledgements
The authors thank Dr Amgad Habib (Leica Microsystems) for providing training in microscopy, Dr Nick Williamson and Prof Steven Armfield of the University of Sydney for advice on the experiments, Dr Babak Fakhim and Xinlu Tan for suggestions and testing software for bubble counting and measurement and Brend van Deurzen of Delft University, the Netherlands for sharing the MatLab code and its technique.
Declaration of Conflicting Interests
The author(s) declared no potential conflicts of interest with respect to the research, authorship, and/or publication of this article.
Funding
The author(s) received no financial support for the research, authorship, and/or publication of this article.
Guarantor
KP.
Contributorship
KW was involved in study design, performance of microscopy experiments and their interpretation, analysis, statistical analysis and manuscript preparation. OCA was involved in study design, performance of microscopy experiments, analysis and manuscript preparation. DC was involved in study design, statistical analysis and manuscript preparation. KP as involved in study design, analysis and manuscript preparation.
