
Abstract
Problems resulting from selecting on statistical significance and practical importance
We congratulate Ananya Sen, Gary Smith, and Claire Van Note (SSV) on the publication of their paper “Statistical Significance versus Practical Importance in Information Systems Research” (Sen et al., 2022; forthcoming), which reviews all 306 empirical papers published in Management Information Systems Quarterly over the 2010–2019 decade and finds that the null hypothesis significance testing (NHST) paradigm is the dominant statistical paradigm employed in these papers. Specifically, the papers typically “report whether the p-values…are below specified thresholds for statistical significance and do not report the actual p-values.” They also do not report “confidence intervals that would allow readers to assess the uncertainty in the estimated coefficients. Nor do they report marginal effects or elasticities that would allow readers to gauge the practical importance of the coefficients.” SSV conclude, “For IS [Information Systems] to achieve its goals of using technology to improve society, managers need to be able to assess the practical importance of IS research.”
As statisticians, it behooves us to understand the statistical praxis of Management Information Systems Quarterly, given that its impact factor is larger than that of the Journal of the American Statistical Association, the leading journal in our field. The impact factor is of course an imperfect measure, but the point is that most statistical reporting occurs outside the domain of statistics.
We agree with SSV that summarizing results based on statistical significance does not allow for an assessment of practical importance. As we all know, an utterly trivial effect estimated with great precision is statistically significant but practically irrelevant. And indeed, studies with results like this come up from time to time (and irritatingly, they get publicity in part because of their enormous sample sizes, which just seems wrong given that they needed these enormous sample sizes in order to “detect” anything in the first place).
However, what seems to us to be much more common are small studies with effect estimates that are statistically significant but unrealistically large. Consider a study examining an early childhood intervention previously discussed in Gelman (2018). The point estimate from the study is statistically significant (though just barely reaching the conventional 0.05 threshold) and practically important (a 25% increase in earnings 20 years after the study)—a veritable jackpot! But, there is more to the story.
The problem is not that the effect estimate is statistically significant but practically unimportant. Rather, the problem is that it is statistically significant but huge—seemingly implausibly so. Indeed, the small sample size of 129 subjects in the study coupled with the highly variable outcome measure guarantee that if the effect estimate is statistically significant, it must be huge. But that’s just a selection effect: the “statistical significance filter” by which effect estimates are much more likely to be presented and published if they are statistically significant leads to an upward bias in published effect estimates (a “type M,” or magnitude, error; Gelman and Carlin (2014)).
Given this, our concern is that SSV’s recommendation to focus on practical importance—“discussing whether the estimated effects are substantial enough to make a real difference”—can lead to the incorrect impression that studies reporting larger effect estimates are more important or more trustworthy. Indeed, the naive view that the study with the largest point estimate provides the strongest evidence in favor of an effect is backward: conditional on the p-value, a larger point estimate corresponds to a larger interval estimate and thus the study with the largest point estimate is arguably the least informative (Morris, 1987)!
Consequently, our message is that arbitrary thresholds applied to p-values and related summaries such as posterior probabilities and Bayes factors (i.e., “statistical significance”) or to effect estimates (i.e., “practical importance”) are insufficient for research and publication on one hand or for decision making on the other hand and therefore that selecting on statistical significance and practical importance is wrong.
In research and publication, we advocate taking a more holistic approach that treats p-values and related summaries in a continuous manner rather than in a dichotomous, thresholded manner and considers them as but two among many pieces of evidence such as related prior evidence, plausibility of mechanism, study design and data quality, real-world costs and benefits, novelty of finding, and others that vary by research domain (McShane et al., 2019a). While taking a more holistic approach requires careful thought and judgment and involves subjectivity, there is subjectivity at all stages of scientific inquiry—even if objectivity remains the ultimate goal (Lykken, 1968). Indeed, p-values and effect estimates are themselves subjective in the sense that they are affected by the many necessarily subjective choices involved in study design, data processing, statistical modeling, and other aspects of the research process.
In decision making, we advocate a decision analytic approach that considers the costs, benefits, and probabilities of all outcomes and that respects the fact that different stakeholders may evaluate those costs, benefits, and probabilities differently. This also requires careful thought and judgment and involves subjectivity, and although some might argue that the effort required for decision analysis is too great in practice, we would rather see decisions made using an explicit (even if imperfect) quantification of costs, benefits, and probabilities rather than based on arbitrary thresholds applied either to p-values alone or in tandem with effect estimates.
In short, thresholding both p-values and effect estimates can be deleterious for research and publication as well as for decision making by guaranteeing wildly overestimated published effect estimates which in turn lead to wildly overoptimistic decision recommendations (see Gelman (2017)). To be clear, we emphasize that SSV do not recommend such thresholding. Their recommendations to “avoid the phrase statistically significant entirely,” “report p-values instead of asterisks or parenthetical inequalities based on arbitrary demarcations,” and “report confidence intervals” show they recognize the problems resulting from thresholding p-values. Further, their comments that “the assessment of an estimated coefficient should consider whether its value is substantial and plausible” and “[p]ractical importance cannot be gauged by a statistical yardstick but is, instead, a subjective decision that depends on context and may vary from person [to person]” show they recognize the problems resulting from thresholding effect estimates.
Illustration
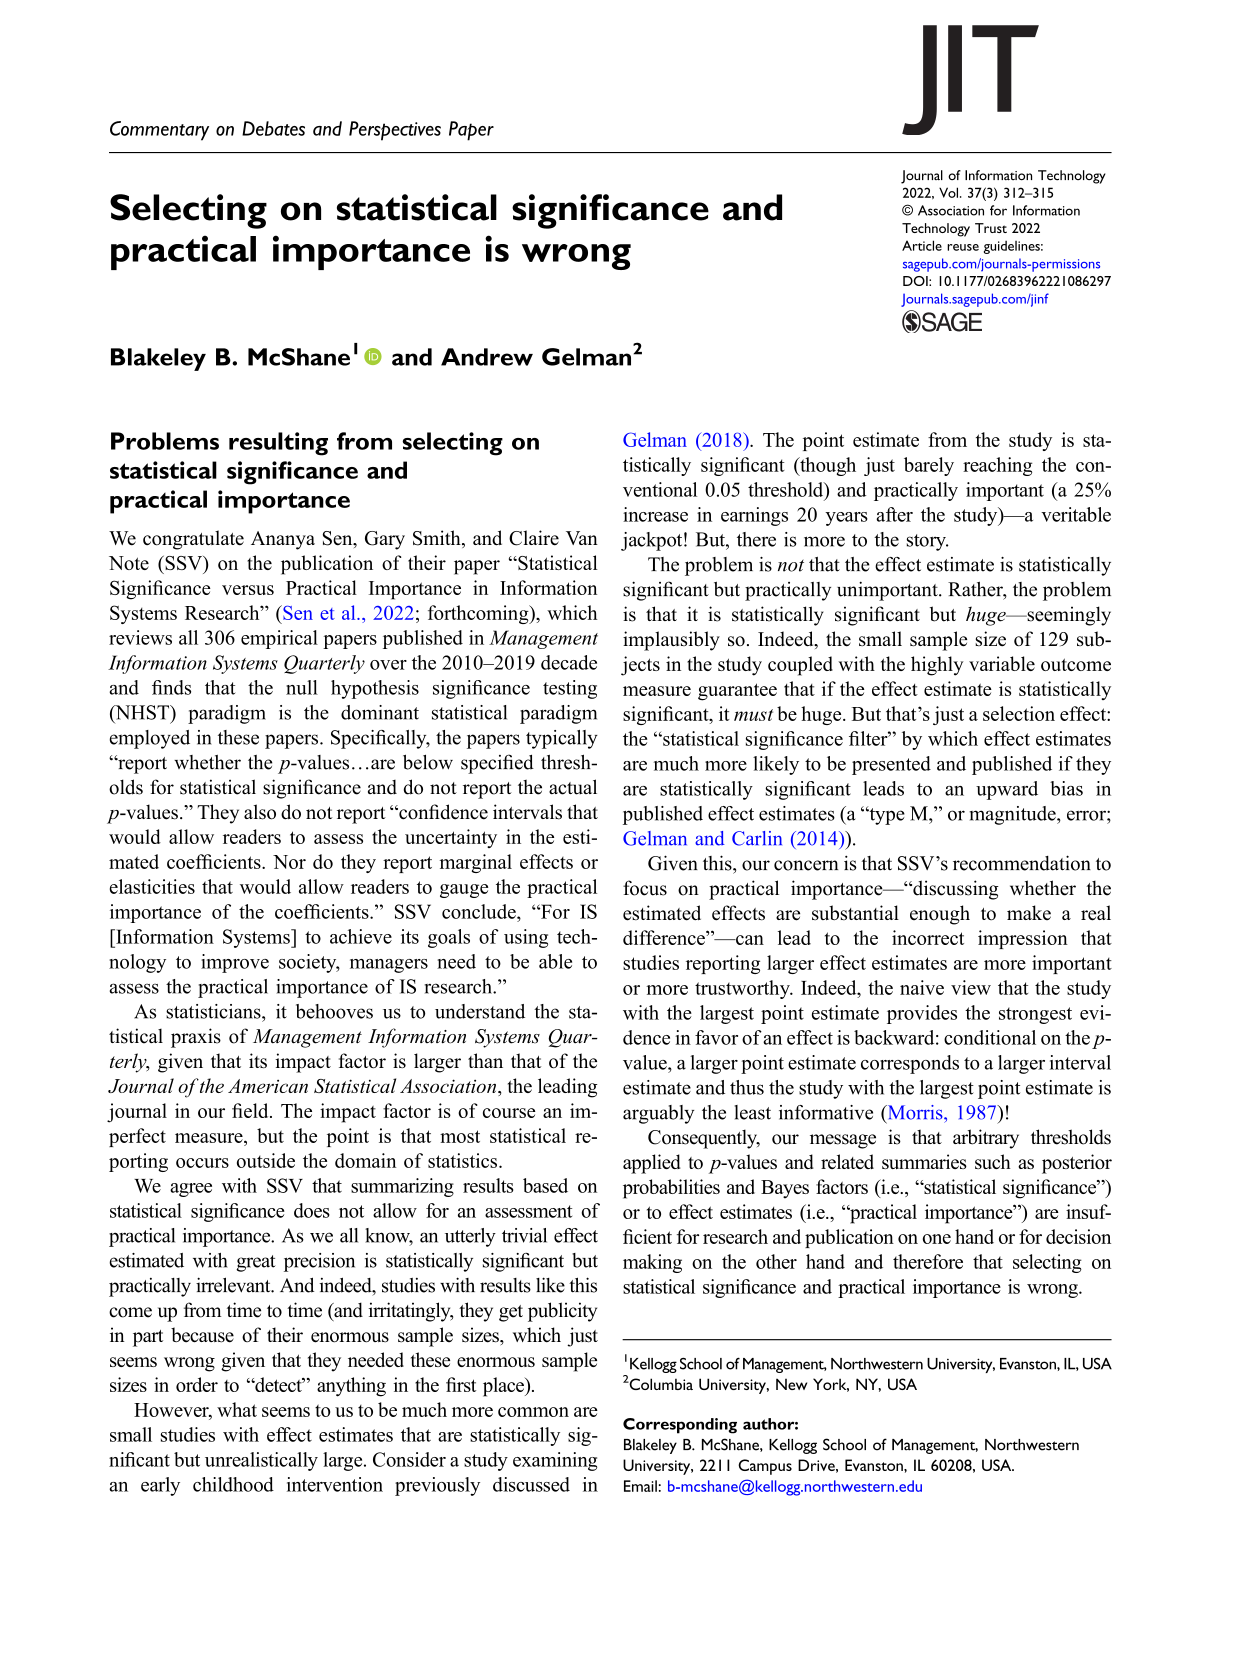
To illustrate why arbitrary thresholds applied to p-values and related summaries or to effect estimates are insufficient for research and publication on one hand or for decision making on the other hand and therefore that selecting on statistical significance and practical importance is wrong, consider four studies of the effect of some intervention on some outcome that are identical in every possible way except for their effect estimates and standard error estimates. Suppose Study 1 has an effect estimate of 0.10 and a standard error estimate of 0.05 and thus a p-value of 0.046; Study 2 has an effect estimate of 1.00 and a standard error estimate of 0.05 and thus a p-value less than 0.001; Study 3 has an effect estimate of 0.10 and a standard error estimate of 0.50 and thus a p-value of 0.841; and Study 4 has an effect estimate of 1.00 and a standard error estimate of 0.50 and thus a p-value of 0.046. Further, suppose an effect of 0.10 is considered small and practically irrelevant in the domain while an effect of 1.00 is considered large and practically important. Point and interval estimates for these studies are depicted in Figure 1. Four studies. Circles denote point estimates and thick (thin) lines denote 50% (95%) interval estimates. A small (large) effect estimate is defined as 0.10 (1.00), a small (large) standard error as 0.05 (0.50), and a small (large) degree of individual-level variation as 0.35 (1.00).
In terms of research and publication, under the NHST paradigm, the average effect estimate in Study 3 would be filtered. However, the average effect estimates from the other three studies would be treated identically because all three are statistically significant.
Under a paradigm that requires both statistical significance and practical importance, not only Study 3 but also Study 1 would be filtered. However, the average effect estimates from Study 2 and Study 4 would be treated identically because both are statistically significant and practically important.
However, we view Study 2 and Study 4 as distinctly different and worthy of different treatment: the highly precise average effect estimate in Study 2 is more informative than that in Study 4. Further, while no single study is ever definitive, Study 4 practically cries out for further studies to quantify the average effect more precisely as well as its variation across contexts via meta-analysis. Indeed, all four studies would make a useful contribution to a meta-analysis and excluding any of them due to a lack of statistical significance or practical importance would bias any research synthesis (McShane et al., 2016).
In terms of decision making, under the NHST paradigm, Study 1, Study 2, and Study 3 would lead to a rollout of the intervention while under a paradigm that requires both statistical significance and practical importance, only Study 2 and Study 4 would. However, we again view Study 2 and Study 4 as distinctly different and worthy of different treatment. Specifically, Study 4 is, in contrast to Study 2, compatible with a negligible average effect. Further, supposing the variation in the effect of the intervention across individuals is quantified by a standard deviation of 0.35, Study 4 is also compatible with negligible or harmful effects for a substantial fraction of individuals. Finally, were this individual-level variation instead quantified by a standard deviation of 1.00, both studies are compatible with negligible or harmful effects for a substantial fraction of individuals.
Given this, a policy maker considering rolling out this intervention to the population at large or an individual considering adopting it for himself might well decide differently depending on which of the two studies he is presented with and on the degree of individual-level variation. And reasonable people might disagree! For example, if the individual-level variation is small, one might choose the intervention if presented with Study 2 (although that will also depend on financial considerations) but not if presented with Study 4 (because effects are negligible or harmful for a substantial fraction of individuals). Or, if the individual-level variation is large, one might choose not to adopt it regardless of the study one is presented with. Any such considerations would also depend on whether the individual-level effect can be predicted a priori. In any event, a decision analysis of some form cannot be avoided.
In sum, whether in research and publication on one hand or in decision making on the other hand, thresholds applied either to p-values alone or in tandem with effect estimates can do harm: the very measures that are taken in order to guard against noise-chasing can themselves introduce bias and noise. Of course, there is much more to be said. For example, our discussion here is overly simplistic in that it has considered only a single study as the basis for research and publication or for decision making, a point on which we elaborate below.
Conclusion
If small effects are unimportant and large effect estimates can often be untrustworthy, what can be done?
As we have said before, “Statistics is hard, especially when effects are small and variable and measurements are noisy. There are no quick fixes…and a formulaic approach to statistics is a principal cause of the current replication crisis” (McShane et al., 2019a). Nonetheless, in addition to our recommendations to eschew arbitrary thresholds, to treat p-values and effect estimates continuously and consider them as but two among many pieces of evidence in research and publication, and to conduct a formal decision analysis in decision making, we have three additional recommendations.
First, do not consider point estimates on their own; instead, consider them alongside interval estimates. In doing so, recall that the 95% level, like the 0.05 threshold from which it came, is itself an arbitrary convention, and different and even multiple levels can be justified depending on the application (Amrhein et al., 2019a) (this is not unrelated to the recommendation that when one considers the p-value for the null hypothesis of no difference, one should also consider the p-value for at least one plausible additional value for the difference, such as a difference that is small but nonetheless large enough to be considered practically important, or even plot the p-values for a range of differences (Greenland, 2017; Rafi and Greenland, 2020)). Regardless, both studies with wide interval estimates and those with large p-values are useful, and no study should be filtered whether due to statistical nonsignificance or practical unimportance. The aim of single studies should be to report unfiltered information (Amrhein et al., 2019b)—a fact which leads us to our second recommendation.
Second, do not expect ironclad proof from a single study; instead, build up understanding across multiple studies. Single studies are never definitive. Further, the effects in such studies are not fixed but instead vary across contexts such as subject populations, time periods, and operationalizations of the intervention and outcome measure (McShane and Böckenholt, 2014; McShane et al., 2019b). Therefore, it is critical to take a meta-analytic perspective that quantifies effects, quantifies the variation in them across contexts, identifies predictors of this variation, and quantifies the degree of predictability.
Third, do not disregard measurement; instead, design studies so that, insofar as possible, measures are unbiased, precise, reliable, and valid. Studies frequently acknowledge that measures have bias and variance but then blithely disregard these problems, seemingly according to the (erroneous) two-part argument that (i) bias cancels out in randomized studies and (ii) large sample sizes in tandem with statistically significance abates all ills associated with variance. Researchers also frequently fail to assess the connection between the latent constructs they claim to be interested in and the operationalizations of them (perhaps because if they claimed to have found an association between construct X and measure Y but then determined they actually had measured Z, they could change the claim to one of an association between construct X and measure Z). Instead, it is critical to focus on measurement and recognize that often multiple measures may be required for unbiasedness, precision, reliability, and validity and so too may be within-subjects designs that directly measure the within-subject variation that is typically of interest.
Our recommendations will not themselves resolve all difficulties associated with research and publication or with decision making. However, we believe they will have the salutary effect of pushing researchers and decision makers away from the pursuit of irrelevant statistical and practical thresholds and toward understanding of theory, mechanism, and measurement in research and costs, benefits, and probabilities in decision making.
Footnotes
Declaration of conflicting interests
The author(s) declared no potential conflicts of interest with respect to the research, authorship, and/or publication of this article.
Funding
The author(s) received no financial support for the research, authorship, and/or publication of this article.