




Abstract
Many empirical studies have focused on the macroeconomic impact of Chinese Outward Foreign Direct Investment on African economies. However, the results are rarely consistent and often contradictory. This paper approaches the ‘impact’ question from a different perspective using the ‘net additionality’ methodology to test, at the micro level, if Chinese Outward Foreign Direct Investment does positively impact one dimension, employment, at the local level. The data set comprises 80 Chinese investment projects over the 2003–2013 period in seven African economies. Net additionality, as a concept, is much wider than standard multiplier analysis and is more suited to analysing project impacts at the local level in both developed and developing economies. The results demonstrate that Chinese Outward Foreign Direct Investment can have substantial indirect employment effects and induced employment effects can be significant under certain conditions. These include a local supply chain infrastructure, reasonable human capital levels, availability of locally produced goods and local wages spent on such goods. The policy implications arising from the study suggest a dire need for local government action in the areas of training, education, local content minima and enabling policies that encourage small and medium enterprises' (SME) development.
Introduction
The role of FDI in economic growth and development has been studied for over 60 years and to date the evidence in support of FDI as a ‘development engine’ remains contrary. In many previous studies, the focus has been variously on GDP growth per se, GDP/capita growth, technology transfer, regional growth and trade effects of FDI among other specific aims. Previous literature has also tended to focus on FDI from western economies to the South and in particular to China. Only in recent years have studies been undertaken on Chinese FDI itself – investments by Chinese state enterprises and Chinese-Local Partner investments outside China. These investments have often been criticised for being overly resource seeking and not particularly helpful to the receiving economies. This paper refutes the latter. The paper is focused on the employment effect at the national and local level in receiving countries of Chinese Outward Foreign Direct Investment (OFDI) and presents evidence that in fact a significant amount of new employment is created by Chinese OFDI in Africa.
The paper is organised as follows: the next section provides a brief literature review on the theoretical foundations of and the empirical findings on Chinese OFDI in general and as related to Africa in specific. ‘Aggregate FDI data’ section presents aggregate level data on Chinese OFDI stocks and flows across the seven selected African countries between 2003 and 2012 and relative to the rest of Africa. 1 This reveals the increasing importance of these seven countries for Chinese OFDI since 2003. ‘Employment creation’ section presents an analysis of direct employment creation arising from Chinese OFDI and specifically in the seven countries of this study. ‘Estimating additionality’ section applies the additionality methodology to the direct employment data to obtain the net employment creation from Chinese OFDI and this is discussed in ‘Net employment creation from Chinese OFDI’ section and final section presents the conclusions of the study.
Literature review
Conventional theory (Dunning, 1977, 1993) proposes three principal motivations for OFDI: (1) foreign market-seeking investment, where the objective is to enter new foreign markets; (2) efficiency-seeking investment, where the objective is to reduce costs and (3) resource-seeking investment, where the objective is to find resources in specific locations. A fourth OFDI driver, which could also be perceived as a subset from the third motive is strategic asset-seeking investment, where the objective is to acquire strategic assets, tangibles or intangibles, that are crucial to the firms’ long run goals but that are not present at home. These motives backed up by empirical findings were able to explain the experience of industrialised countries’ OFDI.
When investigating Chinese OFDI in particular, some empirical studies highlight the above motives, with the exception of the efficiency-seeking motive since China is well known for its low production costs (although this might be changing because of the increasing wages and environmental restrictions), as main determinants for China’s OFDI (Buckley et al., 2007; Cheng and Ma, 2007; Pradhan, 2009). However, many empirical studies stress the uniqueness of the Chinese OFDI experience for a number of reasons. First, Chinese MNCs are chiefly state owned, which means that political objectives could be a significant determinant when choosing the host countries (Yeung and Liu, 2008). Second, institutional factors that are peculiar to China also play a role in the choice of the host country, where on the one hand Chinese MNCs could have high government support in terms of low cost capital, privileged access to raw materials and other important inputs that could offset location and ownership disadvantages abroad (Aggarwal and Agmon, 1990) and on the other hand policy directives determine where the FDI is to take place from supporting exportation of state-owned manufacturers to securing scarce natural resources to acquiring knowledge and technology (Buckely et al., 2007). Third, Chinese MNCs do not seem to be deterred by high political risk like similar MNCs from industrialised countries (Kolstad and Wiig, 2012; Quer et al., 2012).
Chinese OFDI was found to have a market-seeking motive by Buckley et al. (2007) who found that it was attracted to market size and so did Cheung and Qian (2009) but only in relation to developed countries. Kolstad and Wiig (2012) confirmed a similar finding with respect to OECD countries as opposed to non-OECD countries. Cheung et al. (2012) also found that Chinese OFDI has a market-seeking motive in Africa. On the other hand, Huang and Wang (2011) as well as Kang and Jiang (2012) found the market-seeking motive for Chinese OFDI to be insignificant.
Chinese OFDI’s efficiency-seeking motive has been largely ignored in the empirical literature because of the reason stated previously, and so has been the strategic asset-seeking motive until recently when it was found mostly insignificant (see for instance). On the contrary, the resource-seeking motive was continuously affirmed (see Buckley et al., 2007; Cheung et al., 2012; Huang and Wang, 2011; Salidjanova, 2011; Zhang and Daly, 2011).
In fact, the two most common criticisms of Chinese OFDI are that: First, it is primarily resource seeking, especially in developing countries (as found in Cheung and Qian (2009) and Kang and Jiang (2012)) and more specifically in countries with poor quality of institutions (Kolstad and Wiig, 2012) and particularly in Africa (Cheung et al., 2012; Ross, 2015). Second, Chinese OFDI contributes little, if anything, to knowledge transfer, technology transfer, value added, export earnings, human capital development, employment or capacity building in the receiving economy. Weisbrod and Whalley (2011), for example, showed that Chinese OFDI’s contributions to GDP growth range from 0.01 to 1.01%, this is a factor of 100 while the study by Adams (2009) suggests that in sub-Saharan Africa increases in FDI flows (from any source) did not impact GDP growth in the 1990s at all. Such critiques may be valid (or not) but they mainly apply at the macro level with the emphasis on little or no addition to GDP growth from Chinese OFDI (see also Busse et al., 2014; Zhang et al., 2014). This however is in stark contrast to the conclusion of Brambila-Macias and Massa (2010) who argue that both FDI and cross-border bank lending have had a significant and positive impact on sub-Saharan Africa’s growth over the 1980–2008 period. Furthermore, Claassen et al. (2011: 10) also concluded that ‘The results presented in this study refute the general perception of solely resource-driven Chinese FDI in Africa’. The latter present evidence that Chinese OFDI into sub-Saharan Africa is much more diversified than purely resource-driven investments. However, these authors also point out that the contribution to growth is not at all clear while there may be some relation between such FDI and human capital development although the evidence for this is rather weak.
The central argument of this paper is that even if such OFDI makes a very small contribution at the macro level it does not follow that the same applies at the local level. In other words, Chinese OFDI may well be making a significant contribution to local economic development while the studies at the macro level mask this contribution.
In most EU countries any significant government intervention is required to meet standard ‘value for money’ criteria in order to ensure the efficient and effective use of EU taxpayer funds. One of the main justifications for such interventions is the presence of one or more market failures that act to prevent, delay or in some way limit investment in a particular project or sector. Justifying public sector intervention therefore becomes an evidence-based problem – to what extent can it be demonstrated that the intervention has actually made a difference in terms of a variety of possible outcomes such as employment, output, labour quality, technology and knowledge transfer, export earnings among others. In this paper, we argue that the same methodology can and should be applied to FDI in the receiving country for the following reasons.
Although much of the literature on FDI focuses on its macro level and global effects it is often the case that these analyses ignore the fact that FDI often happens because it is actively sought by the receiving country. It does not just happen. Many countries operate their own investment promotion agency (IPA) which is public sector funded and the principal function of these agencies is to actively seek, find and attract FDI into their economies.
We can consider this to represent the demand side for FDI while the supply side is represented by the market, resource, asset and efficiency-seeking firms (private or public) which are constantly searching for enhanced opportunities. It is thus a matching process in which the IPA seeks to attract the firm which is likely to maximise the investment benefit to its national economy. Whatever the motivation of the investing firm the receiving economy will be interested in a range of outcomes depending on national priorities – these may include improving a balance of payments problem, technology absorption, employment and other ‘target’ outcomes.
The role of additionality analysis is to assess to what extent these target outcomes are likely to be achieved (ex ante evaluation) or have actually been achieved (ex post evaluation) and to determine if such outcomes are greater than the counter-factual case in which the alternative scenario assumes the deadweight position, that is, would have happened anyway in the absence of the intervention. Estimating additionality therefore requires an accounting framework that explicitly includes a number of measures which take account of as many economic parameters as possible. Every investment whether domestically sourced or foreign sourced will have a range of effects on the national, regional and local economy within the receiving country. These will include direct, indirect and induced effects 2 operating through the multiplier process, impacts on the local supply chain, potential displacement, leakage and substitution effects and of course the measurement of deadweight all of which will be thoroughly explained later on.
The authors are not aware of any previous studies applying the additionality model in the African context. As discussed above there are many macroeconomic studies discussing FDI and its various ‘roles’ in economic development processes but at the microeconomic level very little. In a forthcoming paper, it is argued that: ‘The results suggest that for Africa as a whole, represented in 38 countries, Chinese direct investments had a significant positive effect on employment’ (JCEFTS, forthcoming, 2016). Although the latter partly supports the present findings it is focused on the national and very broad regional level (Northern Africa and Southern Africa), not the specific project level. The present paper is focused on the specific project level and the entailing employment effects of a large number of Chinese OFDI projects.
Consequently, we argue this paper contributes to the literature in several ways: it applies a methodology which is usually confined to assessing public sector interventions in developed economies although there is no reason why it should be so confined; it utilises a rich source of highly reliable data on employment creation by project and sector across the sample countries and it provides a set of recommendations that are both practical and realistic in terms of FDI policy as applied in African countries. Before we discuss the microeconomic data set utilised in the study it is useful to consider the aggregate data for FDI into Africa in order to establish the context for Chinese OFDI in Africa. This is done in the next section.
Aggregate FDI data
Based on our calculations from United Nations Conference on Trade and Development (UNCTAD) Bilateral FDI Statistics 2014, UNCTAD, 2015 in 2003, Chinese OFDI flows were mostly going to developing economies (91%) followed by developed economies (8%) then transition economies (1%).
3
This trend did not change later on, albeit with variations in the percentages, where in 2012 for instance, developing economies were receiving 80% of China’s total OFDI flows, while developed economies and transition economies were receiving 15 and 5%, respectively. As seen in Figure 1, developing economies in Asia were the highest recipients of China’s OFDI flows in the whole period except in 2005 and 2006 where developing economies in Latin America and the Caribbean were the highest recipients. In the entire 2003–2012 period, Africa never received more than 12% of China’s OFDI flows. Figure 2 does not tell a much different story; developing countries in Asia remain the ones with the highest percentage of China’s OFDI stocks during the whole period.
China’s OFDI Flows by geographical destination from 2003 till 2012. China’s OFDI Stocks by geographical destination from 2003 till 2012.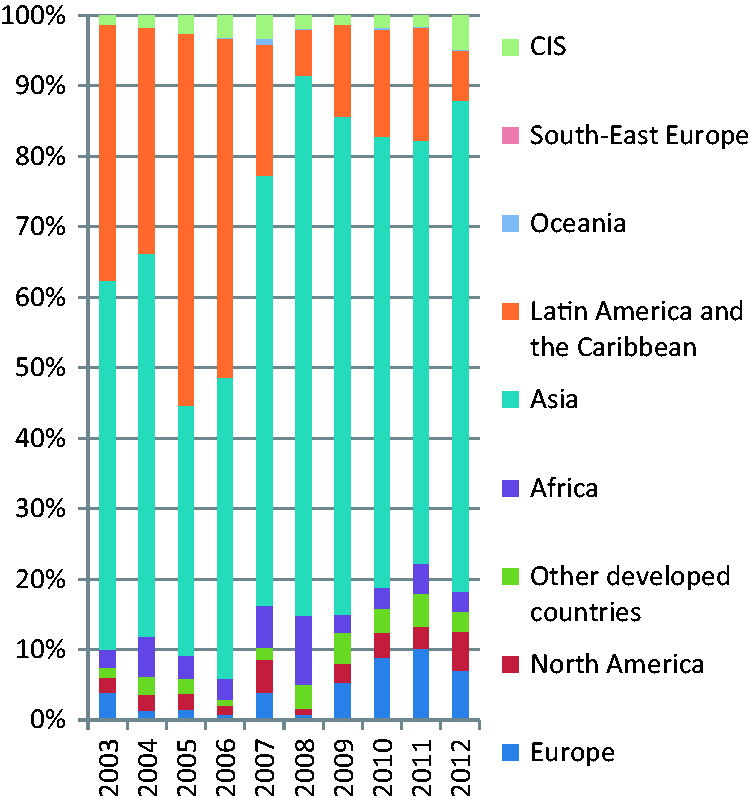
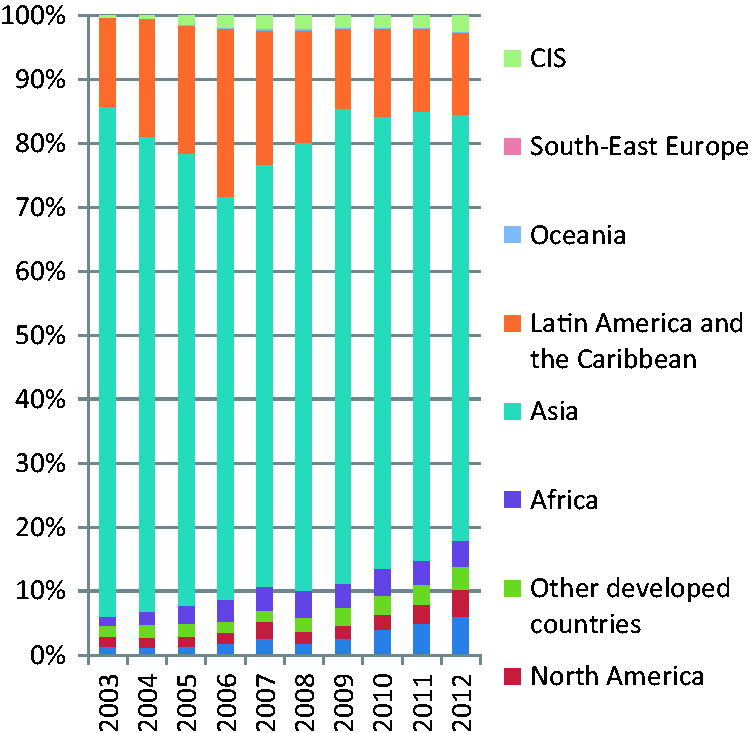
Figure 3 shows China’s OFDI flows in the 2003–2012 period to the seven highest receiving African countries compared to the rest of Africa, where highest receiving is based on calculating the average of all Chinese OFDI flows to each African country during the whole period. These seven African countries are Algeria, Angola, Democratic Republic of Congo, Nigeria, South Africa, Sudan (including South Sudan in 2012) and Zambia. These countries receive on average 69% of all Chinese OFDI flows going into Africa ranging from a minimum of 52% in 2011 to 96% in 2008. Figure 4 tells a similar story to Figure 3, where China’s OFDI stocks in these seven African countries represent on average 62% of all Chinese OFDI stocks in Africa ranging from a minimum of 46% in 2003 to 74% in 2008.
China’s OFDI Flows to the seven African countries compared to the rest of Africa. OFDI: Outward Foreign Direct Investment. China’s OFDI Stocks in the seven African countries compared to the rest of Africa. Source: Flows and Stocks raw data from UNCTAD. Calculations and figures made by authors.

In terms of millions of US dollars, Algeria, DR of Congo, Nigeria and Zambia have had a steady increase in their Chinese OFDI stocks for the period from 2003 till 2012. 4
Correlations (P values below Pearson correlations).

Source: Authors’ calculation based on data from FDI data from UNCTAD and trade date from COMTRADE.
In other words, a significant positive correlation exists between Chinese OFDI stocks in the seven African countries and China’s imports from these countries. This supports the many studies that claim that China’s OFDI in Africa is mainly for extraction of raw materials. A positive correlation also exists between Chinese OFDI flows and imports, although not as strong as with the OFDI stocks, for all the countries with the exception of Nigeria and South Africa. At the aggregate level it certainly appears that resource extraction has been the primary objective of the OFDI into these seven countries. However, at the project level a different story emerges which supports the argument of Claassen et al. (2011) that many Chinese OFDIs to Africa have little to do with resource seeking. The analysis below sets out the evidence for this argument.
Employment creation
Using fDI Intelligence 5 reports from the Financial Times Ltd, we were able to obtain data on Chinese capital investment and numbers of jobs created (both by sector and by destination country) across all African countries over the 2003–2014 period. Across all of Africa Chinese OFDI created 167 projects which in total generated a total of 87,259 direct jobs. The data covers 18 sectors in total across 80 different projects between 2003 and 2013 in the seven countries of interest. In our sample of seven, the total direct jobs created in this period from the 80 projects were 43,307. Note that these jobs exclude the Chinese personnel working in the projects. Of this number 17,291 were created in the extractive sectors, only 40%. The remaining 60% were created in sectors ranging from consumer electronics to vehicle parts, business machines, tools, business and financial services, IT, ceramics and real estate. Even more to the point 12,672 (73%) of the jobs created in extractive projects were created in South Africa and Zambia alone.
Discounting this number leaves 30,635 jobs of which only 4619 were extractive (resource) related – a mere 15%. On the other hand, the capital invested across these projects shows a very different pattern: in total between 2003 and 2013 total capital invested was $14.67B of which $9.69B was invested in resource-seeking projects, around 66%. This clearly suggests these types of projects have very low employment creation and hence are unlikely to generate significant employment additionality impacts. Even so, these data clearly show that around $5B was invested through Chinese OFDI in these seven countries over a 10-year period in sectors that are not related to resource-seeking strategies and this has created nearly 26,000 direct jobs in non-resource sectors.
It is also noteworthy that employment creation over the period of 2003–2014 by Chinese OFDI has been cyclical. Two peaks are represented in 2008 and 2012, respectively, and a third peak employment creation period was already underway by 2014. It is very difficult to know why these particular years were peak years for Chinese OFDI in Africa – there will be a myriad of reasons. However, what is clear from the data is that in each peak period no single sector was dominant. More than 21,000 jobs were created in 2008 alone but only around 25% of these were extractive/resource based. The second peak in 2012 created over 17,000 jobs but only 30% of these were extractive or resource related. Job creation again began to increase after 2013 and by the end of 2014 only 22% of the 9460 jobs created were related to these sectors. Figure 5 shows the cyclical nature of the Chinese OFDI across the 28 African countries.
Direct jobs created per year (28 countries).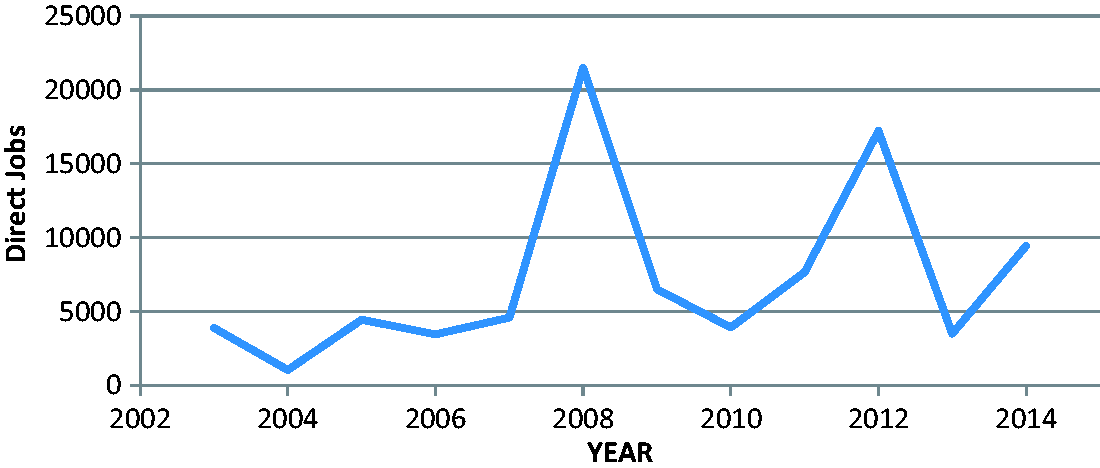
Returning to the core purpose of this paper, we can now estimate the additionality impact that may have occurred using the framework set out below.
Estimating additionality
The starting point for any additionality assessment is the estimation (or reporting) of a direct effect – this may be in terms of output, jobs, exports or other ‘target’ outcome. This paper focuses on only one of these direct effects – employment. There are several reasons for this.
The number of direct jobs created by an investment is often the easiest ‘project’ data to acquire and the most reliable; employment itself is often one if not the most important target outcome sought by the FDI receiving country; with employment comes knowledge transfer and capacity building (even if limited); employment further generates multiplier effects (indirect and induced) which contribute to local economic development even if the investment project has a marginal effect on national GDP and employment generates social and psychological benefits for the local population in terms of well-being, a sense of worth and value to the family and society.
The latter are not usually measurable in an additionality assessment, however, but they are nonetheless real. In this paper, we estimate the employment effect of Chinese OFDI in seven African countries using direct employment data provided by specific investment projects. In order to do this, we apply an additionality estimation method as follows
6
number of direct jobs created by the investment
7
leakage (proportion of jobs taken by non-national labour) displacement (proportion of jobs lost elsewhere due to the investment) loss of employment through purchases from non-domestic suppliers by the project (will be lower at the national or regional level than the local level unless agglomeration economies are significant). labour substitution (this tends to apply only where subsidies for employment are available and firms discard existing employees to take advantage of the wage subsidy by employing an unemployed person). Likely to be zero or close to zero in FDI projects. Type I multiplier (income and indirect effect on employment) deadweight employment (proportion of jobs without the FDI). In the case of most countries this is likely to be very low or even zero. proportion of FDI project revenue and local firms’ revenue paid in local wages proportion of α spent on local goods and services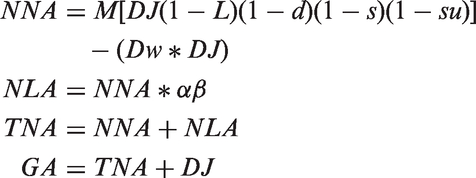
NNA is net national additionality and NLA is net local additionality which is explicitly the local induced effect on employment hence TNA is total net additionality. GA is gross additionality, which is TNA plus direct jobs created. This set of additionality equations makes economic sense since not all inputs to an investment project will come from the local economy due to the non-presence or limited presence of local suppliers and skilled labour. In addition, not all the direct jobs created will be taken by the locally unemployed since internal migrants are likely to target these new jobs and thus a proportion of the incomes earned are likely to be ‘exported’ out of the local economy. Hence the local supply chain is unlikely to be capable of meeting all of the project’s (physical) capital or labour requirements.
This implies that the net effect on employment at the local level will depend crucially on α and β. In the case of α (proportion of revenues paid in local wages), this will depend crucially on the availability of labour capable of taking the jobs that are directly created and those that are indirect and/or induced. This will depend on the local human capital stock. A rough proxy for this is the Human Development Index (education and literacy are key components of this) which we got from the UNDP website (2015). The country with the highest HDI in 2014 was Norway – meaning the problem of leakage is likely to be the least associated with any FDI in that country since skilled and experienced labour at the local level across the country is normally available. But before we continue the explanation of α and β we need to clarify the issue of deadweight.
It is notoriously difficult to answer the apparently simple question – ‘what would have happened in the absence of the investment?’ This is the counterfactual case and requires, in some countries, heroic assumptions regarding alternative possible scenarios. However, there are a number of ways in which an estimate of possible deadweight can be generated if the data exist. For example, it may be possible to measure what has gone before in terms of past changes in a local economy, to forecast key economic variables within the local economy or to undertake an analysis and assessment of ‘planned’ policies and strategies at the regional and local level. In the ideal case, to assess previous evaluations of additionality and deadweight, if they exist. For the present study, it has proved impossible to undertake any of these approaches, simply because the data does not exist. Hence our simulated values for deadweight are essentially ‘informed guesswork’ based upon the rationale explained later in the paper. In a study by English Partnerships in October 2008, evidence from 10 sectors produced estimates of deadweight ranging from 18 to 30% (with five of the sectors below 25%) (English Partnerships, 2008). Evidence from the UK 8 suggests relatively low levels of deadweight and, as argued below, the likelihood that this will be much lower in our sample is very high.
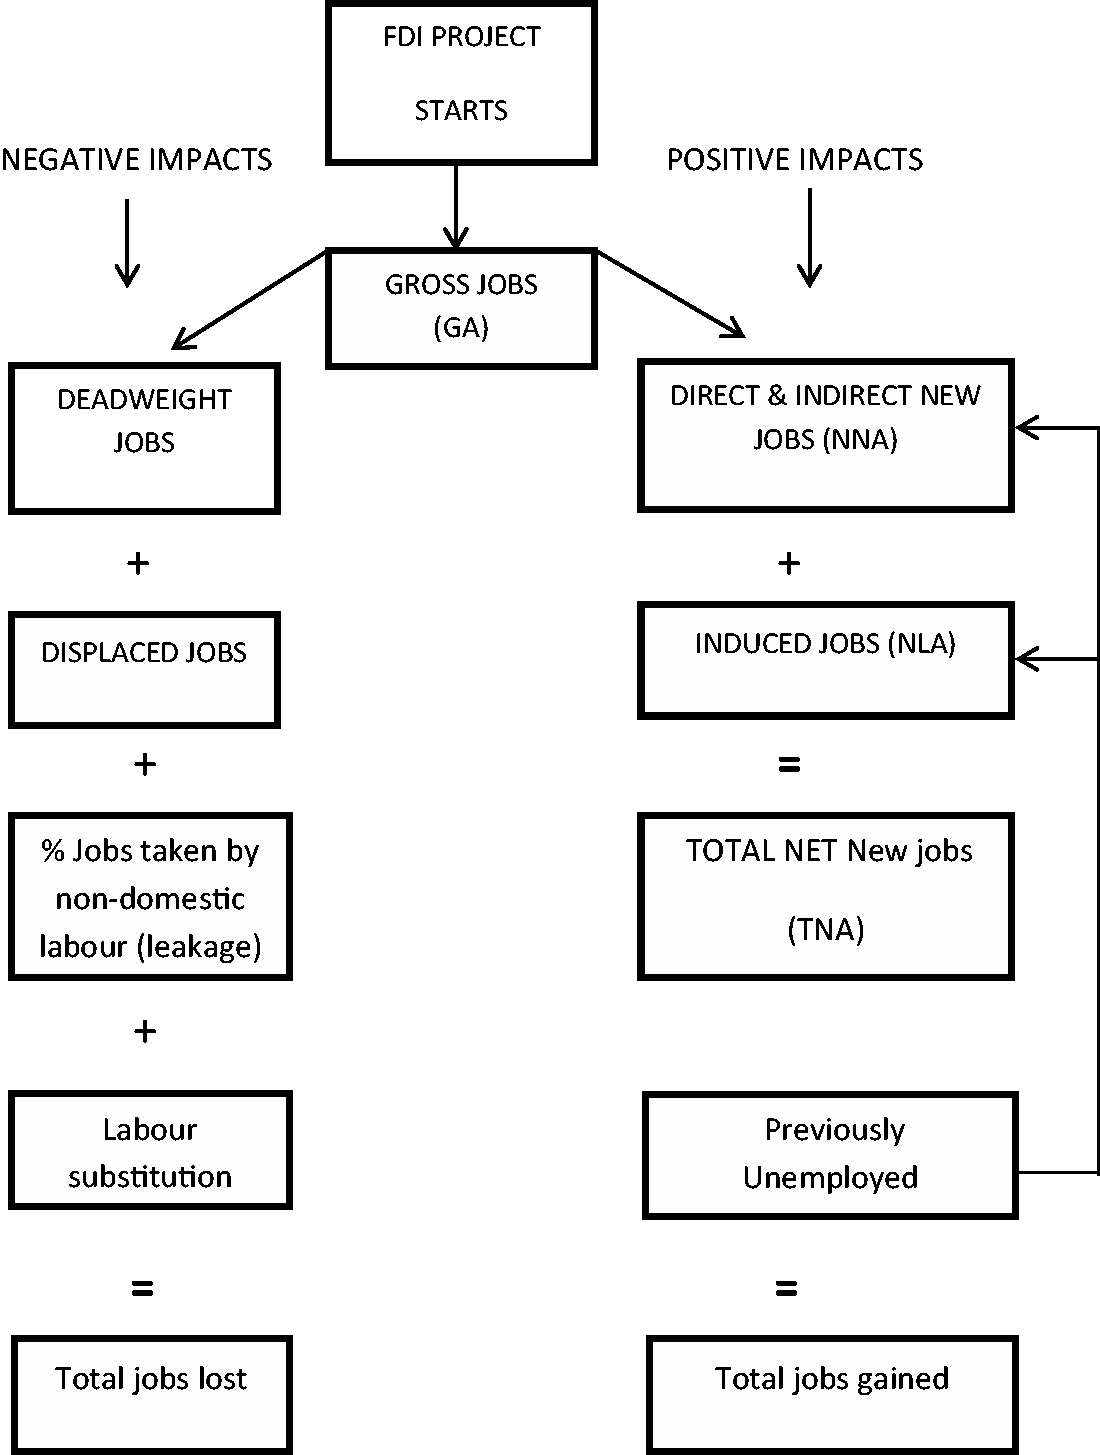
It is helpful to visualise the additionality model process as in Figures 6 and 7.
A stylised representation of the additionality process. FD investment, impacts and employment outcomes.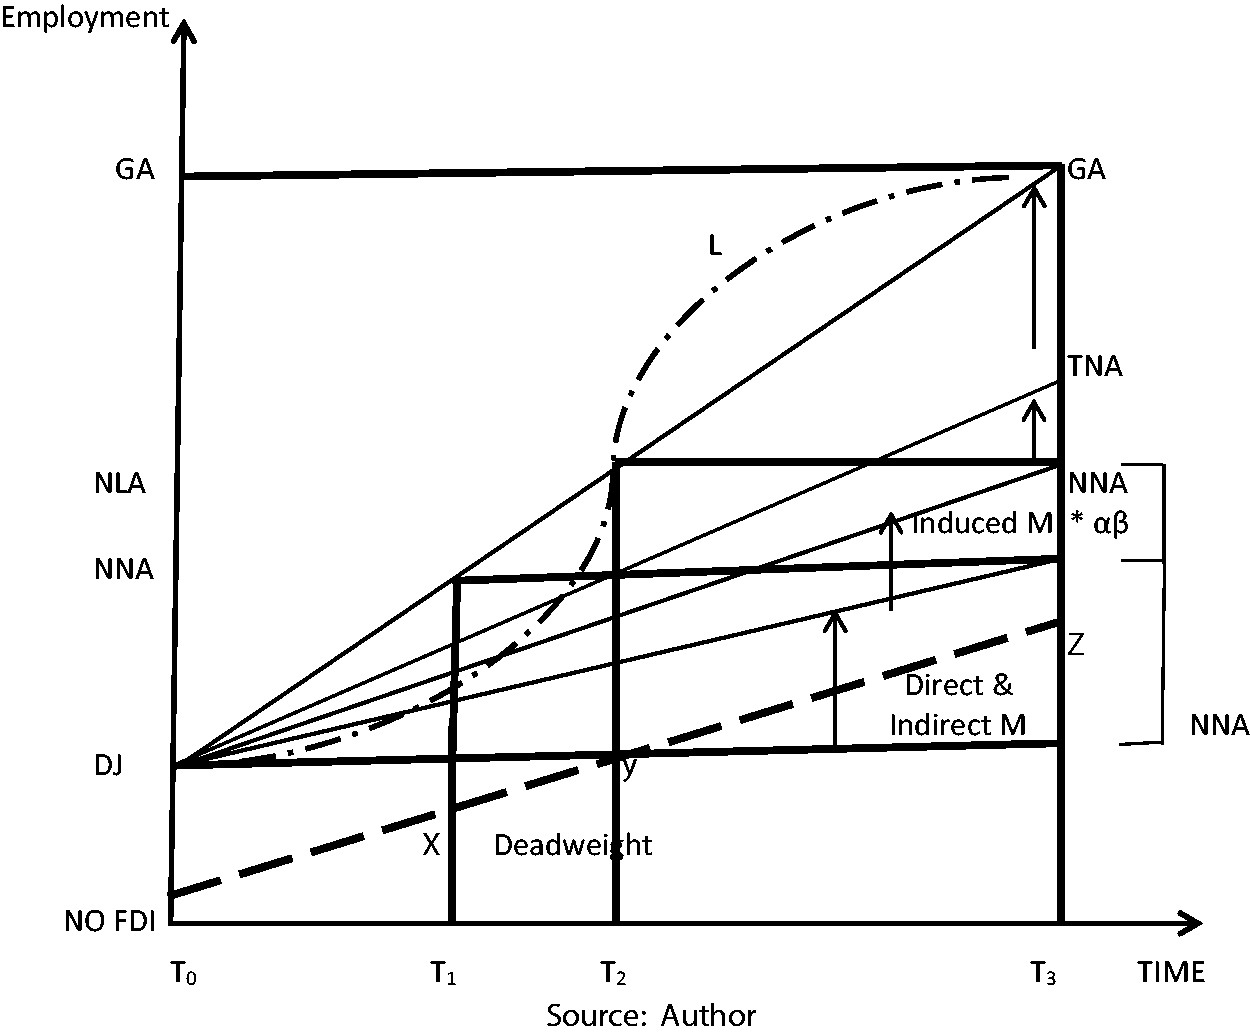
Consider the case where no FDI is present: here there may be investment from domestic sources anyway and this is represented by the dashed line which shows the counterfactual case – investment that would have happened anyway. However, by its very nature this counterfactual case cannot possibly be known and can only be an assumed scenario. In economies that already have a functioning internal supply chain of firms from the national to the local level and across several sectors, it is reasonable to assume there will be some level of deadweight while those that do not have a ‘critical mass’ of inter-connected firms are very unlikely to create domestic investment and hence deadweight in these cases will be close to or at zero.
Irrespective of the presence of deadweight (or not) if at time T0 an FDI project takes place at the level FDI DJ (direct jobs) this is expanded through the Type 1 (direct and indirect) multiplier to generate FDI NNA employment at time T1. This level of employment is increased again through the induced multiplier effect (Type 2) at the local level via the interaction of α and β by time period T3.
In this stylised representation, the additionality process is not of course of the stepwise nature depicted here, in reality it is a dynamic process since both Type 1 and Type 2 multipliers are operating from time T = 0 but at an increasing and then decreasing pace until both processes have worked themselves ‘out’ at T = 3. This is represented by the curve L which is approximately logistic. At this point (T = 3) the GA of the FDI project is equal to GA and the NNA is given by GA minus DJ. Hence at time T = 1, TNA = GA – DJ - X jobs; at time T = 2 TNA = GA - DJ (where DJ = Y) jobs and at time T = 3 TNA = GA - Z jobs. An alternative (simpler) representation is given in Figure 7.
On the left-hand side of this figure we represent the potential negative effects of a new investment plus the possibility of deadweight. On the right-hand side are the potential positive effects of the investment project. If total jobs gained is greater than total jobs lost the investment has generated a positive net national and local additionality employment effect. This is the final ‘number’ the additionality model is designed to determine. Strictly, the deadweight jobs are not ‘lost’ – they are simply jobs that would have been created in the absence of the FDI but must nevertheless be deducted from gross jobs created.
Estimated values for α in the seven sample countries.
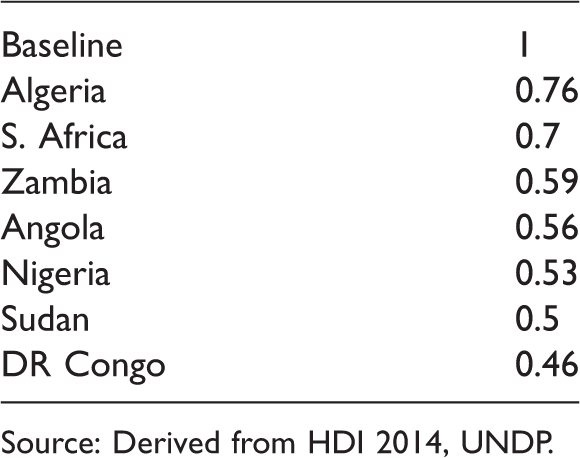
Source: Derived from HDI 2014, UNDP.
Clearly there are very large differences across the seven countries in terms of human capital availability and this is very likely to affect the take up of employment opportunities arising from any FDI while at the same time increase the magnitude of leakage. For β, the proportion of local income spent on local goods and services, there are several measures that can be determined. The most obvious is the trade openness index; however, this includes capital goods, infrastructure, property investments, financial transactions and other categories that do not normally enter the typical household’s consumption function in most economies, not least the developing economies.
The issue commonly associated with spending on locally produced goods and services is one of consumer preferences – such that people tend to prefer ‘brand’ names and/or the imported version of a good simply because they believe it to be superior to the locally available version. This argument may well be true in many countries; however, it ignores the rather obvious constraint that consumer ‘choice’ may not in fact be available at all or at least may be highly restricted in some countries. In the case of the seven sample countries for this study, a more accurate measure of β is one based on the availability of local goods rather than on consumer preference since the former is a real constraint on the latter in most of them.
Using the WTO international trade and market access data maps (2014) it is possible to determine the proportion of imports by category relative to total imports and thus generate an estimate of the value of β based on this ratio. For example in 2013 the total value of imports to Algeria of clothing, food and manufactured goods (predominantly consumer goods) was $49.3bn while Algeria’s exports of these three goods totalled only $0.98bn. Total imports to the country in the same year were $55.7bn – thus these three goods represented nearly 89% of all imports. This suggests a number of points: first, Algeria is highly dependent on imports for all three goods and second its domestic production of these goods (and hence local availability) is extremely small and/or is of such poor quality that they cannot be exported and are primarily consumed domestically. This is however unlikely to be the case since it implies almost none of these domestically produced goods meet even the lowest standards of quality which, a priori, is simply not credible.
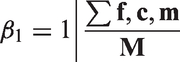
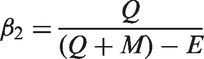
Estimated values for β in five of the seven sample countries. a

Source: Derived from WTO Maps (2014).
Sourced from McMahon and Tracy (2012).
Note: No data available for the three commodities for the DR of Congo or Angola.
In every case except South Africa and Zambia, β2 is significantly less than β1 reflecting that in South Africa the local availability of the three types of goods is high because the economy already possesses a large number of domestic firms in all three. 10
The low values for β2 in the other three countries reflect the very low presence of formal sector production of all three goods. 11 Sudan, on the other hand, is a rather special case – it simply reflects the fact that total imports of the three goods are so low that the public have no choice but to buy locally 12 and the majority of locally produced goods are from the informal sector thus β2 is less than half of β1. In the case of Nigeria, 97% of all imports are in food, clothing and manufactured goods hence the locally available ‘item’ is indeed scarce.
Given the above estimated values for both α and β and the values drawn from other studies for M, we are now in a position to apply the additionality equation to the employment impact of Chinese OFDI in the seven countries. 13
Below we construct a table of the key parameters from which the net additionality outcome in terms of employment can be indicated as either high, low or very low at both the national and the local level. We present only a sample of the possible permutations of these values based on the most likely range per parameter. The values for the Type I multiplier, M, 14 and for the Type II multiplier, (α * β), are not simulated values – only those for L, d, s and Dw are simulated (su, substitution is removed given the very high probability that it is zero).
The rationale for the choice of range is as follows: In many cases, it will be unusual for a local or regional economy to supply all the types of labour a new FDI project requires therefore it is possible that leakage could be high depending on the proportion of skilled/experienced labour to be employed. Where the latter is significant, a high proportion of the required labour may be imported from outside the country or certainly from outside the district level. This is also going to vary between sectors since availability of highly skilled labour will vary within each country in the sample. However, the variation in leakage across sectors (UK example) is in fact less than might be expected. The range across sectors and investments at the local level is just 11–17% but with the majority varying by much less than this (BIS, 2009). The Department for Business Innovation and Skills in the UK defines leakage as: ‘the proportion of outputs/outcomes that benefit those outside the target area of the intervention’ (BIS, 2009: 20). In a study of 51 projects in the UK, the degree of leakage at the local level was found to be on average quite low (BIS, 2009). The BIS report argued that: ‘… mean sub-regional leakage was found to be 15.8% overall, but the median suggests that for most initiatives leakage rates would be lower than this’ (BIS, 2009: 20).
This is a relatively low percentage given the availability of skilled labour and managerial expertise within the UK economy. It also suggests that within our sample of seven African countries the value of leakage can be expected to be significantly less than this, even in S. Africa, and maybe with the exception of Zambia for reasons given below. 15 This point has also been made earlier in the case of the evidence for deadweight.
Displacement of existing jobs by a new FDI project is unlikely to generate any significant job losses since, almost by definition, such jobs do not yet exist at any spatial level within the receiving economy, hence d will in almost all cases be either low or very low. Domestic suppliers may gain contracts with the FDI project in both construction and operational spheres if they actually exist and if they can meet the quality standards required. In many developing countries, especially at local level s is likely to be low or very low. At the regional and national levels the proportion of contracts going to non-domestic suppliers are likely to be lower since domestic-based firms tend to be more active at these levels than at the local level.
The Type I multiplier will depend largely on the nature of the FDI project in terms of capital intensity, technology and the related indirect and induced multiplier effects. For South Africa, Burrows and Botha (2013) estimate an all sector average Type I multiplier of 3.38 16 for the period 1980–2010 although the variation between sectors is very large ranging from 11.2 to 1.42 for leather products and coal mining, respectively. These estimates and those for the other six countries in the sample must be qualified by the fact that their calculation is based on a wide array of assumptions as well as very different estimation methods. Nevertheless, they are the data we actually have and the only empirical evidence of Type I multipliers the authors were able to source. The paucity of multiplier data, especially at project level, is an important gap in our knowledge and we discuss this issue at the end of the paper. For Nigeria, multiplier estimates range between 1.16 (Akpan and Abang, 2013) to 1.72 (Achoja, 2012). In a recent report from USAID (2014), the variation in multiplier estimates for agriculture alone across sub-Saharan Africa is very high therefore it is very difficult to be precise on the specific multiplier value to apply in an additionality analysis.
Parameter permutations for additionality estimation.
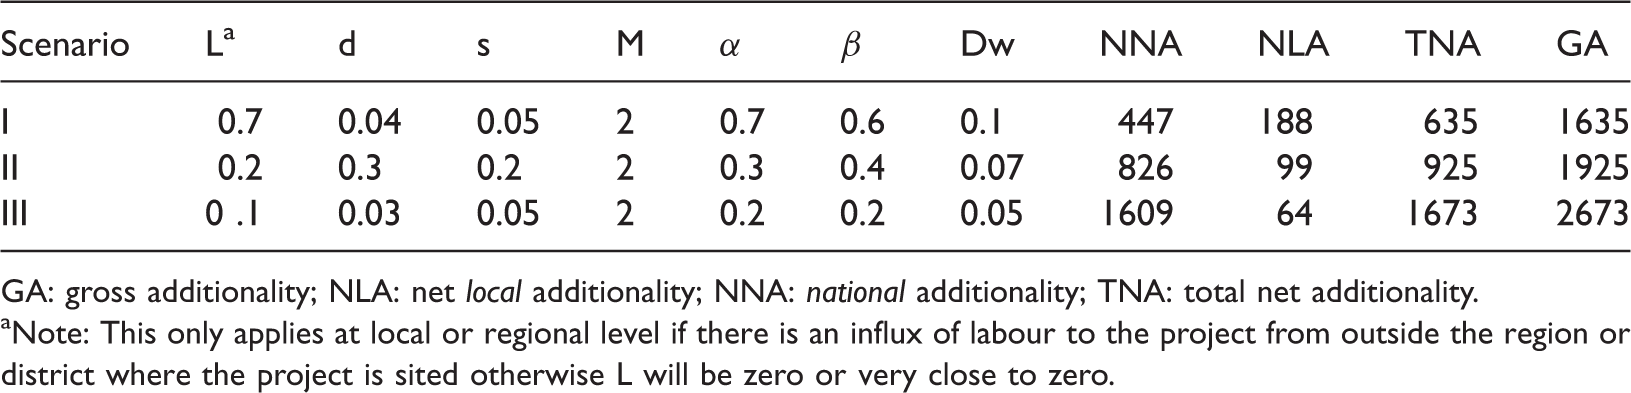
GA: gross additionality; NLA: net local additionality; NNA: national additionality; TNA: total net additionality.
Note: This only applies at local or regional level if there is an influx of labour to the project from outside the region or district where the project is sited otherwise L will be zero or very close to zero.
Suppose an OFDI project creates 1000 direct jobs: using the permutations in the above table for each of the three cases the NNA and NLA employment additionality will equal or be approximately equal to the values in the final two columns. In the above case assume the given M = 2 thus the NNA in terms of additional job impact is 447 jobs over and above the 1000 direct jobs (these are the indirect employment effects) and the locally induced employment effect is the provision of 188 extra new jobs giving a TNA of 635 jobs from the project.
Going to the second set of permutations the corresponding figures are 826 new jobs at the national level but only 99 extra are induced at the local level. In the third scenario, the total job impact is 1609 at the national level but in this case the number of jobs being induced at the local level has more than halved compared to Scenario I. What is determining this pattern? Clearly the value of leakage and deadweight has a very strong influence on potential (or actual job creation) while at the same time if α and β are falling the impact on locally induced jobs becomes even smaller. However as argued above, if deadweight is in reality close to or at zero then these induced effects would become slightly stronger compared with the values in the above table and if leakage is also close to zero we would find the induced jobs at the local level will increase even more significantly.
The key parameters involved in any additionality analysis are the Type I multiplier at the national level and the induced multiplier effect that is being generated at the local level (α and β interaction) where a project is actually sited. We have already established that substitution, deadweight and displacement are unlikely to be significant at the local level whereas leakage could be significant. Hence we apply a range for L that is consistent with the value of α in each case. 17 The range used for L is from 0.7 (high) to 0.1 (very low) reflecting the level/availability of human capital likely to be present across the seven countries in the sample. The authors are aware this is a somewhat simplistic measure of L but in the absence of any other information it is a reasonable range. 18
We apply zero to substitution and low values to deadweight and displacement (as explained above) in order to estimate a realistic range of values for local job creation using actual direct job data from the projects and estimated multipliers from the available literature. This is done below for the seven countries in the sample.
Net employment creation from Chinese OFDI 19
Between 2003 and 2013 Chinese OFDI invested a total of $1.535bn across 15 sectors and 36 projects in South Africa – an average capital investment of $43MM per project. A total of 38% of this was invested in resource-seeking projects and the remainder shared across automotive sector, electronics, manufacturing, construction and other sectors of the economy. A total of 13,121 direct jobs were created from these investment projects (excluding employment of Chinese nationals) over the same period. Applying the Type I multiplier estimates for South Africa (Burrows and Botha, 2013) we can estimate the NNA, NLA and TNA for all invested sectors.
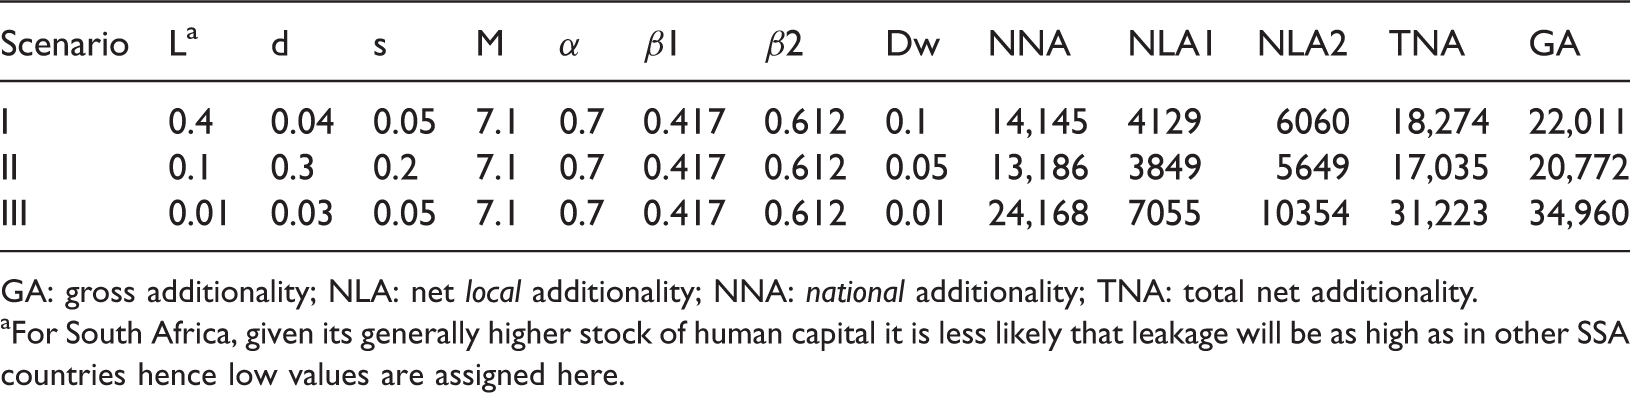
Taking the automotive sector as an example the estimated value for M is 7.1 (this is high) and applying the three scenarios in Table 3 gives three possible outcomes for the national and the local employment impact of the investments in this sector: a total of 3737 direct jobs were created in the automotive sector in South Africa by Chinese OFDI in the 10-year period from 2003 to 2013, almost 29% of all jobs created in the country from this FDI source.
South Africa – automotive sector.
GA: gross additionality; NLA: net local additionality; NNA: national additionality; TNA: total net additionality.
For South Africa, given its generally higher stock of human capital it is less likely that leakage will be as high as in other SSA countries hence low values are assigned here.
As both leakage and deadweight fall the number of locally induced jobs rises dramatically because the interaction of the relatively high induced effects in South Africa ensure job creation from the projects is being localised. If we apply the more accurate value for spending on locally available goods, β2 = 0.61, 20 the impact on local job creation rises dramatically to give the figures in the NLA2 column. This is very strong evidence for countries to take more seriously the critical importance of encouraging SMEs to become a key part of the local supply chain to FDI projects, whether Chinese or not. Even if M is reduced significantly the impact of a higher β is still important.
South Africa – metals sector.

GA: gross additionality; NLA: net local additionality; NNA: national additionality; TNA: total net additionality.
This sector has a Type I multiplier of 2.8 – significantly below that of the automotive sector. A total of 4871 direct jobs were created by Chinese OFDI across five projects in the metals sector. The additionality employment effects are as shown in the above table. Although direct job creation was nearly 40% more here than in automotives the employment additionality effects are significantly less due to the much lower Type I multiplier and hence the induced employment effect is considerably lower. As explained above, if β2 is applied again the impact on local job creation rises considerably even in a sector where M itself is well below that of the automotive sector.
Another way to consider these results is in terms of the efficiency of job creation per sector per dollar invested. In the automotive sector, a total of $454MM was invested and (taking the best scenario in Table 5) a total of just over 31,000 jobs were subsequently generated.
For the South Africa economy as a whole, the average value of M is 3.38 and including all 15 sectors and 36 projects from Chinese OFDI the best scenario produces an additional employment effect of over 52,000 jobs generated from an original direct job creation of 13,121 (NNA + NLA1) – giving a GA impact of over 65,000 jobs across all projects including a locally induced employment effect of over 17,000 in the ‘best’ scenario.
Given the relatively high values in South Africa for both α and β the number of the total jobs created that would have been available at the local level (across all projects) is between 11,800 and 17,300 (under scenario III) and the remainder spread across the regional hinterlands of the project locations. However, even in the worst case, scenario II, the NNA is nearly 22,000 jobs with over a further 9000 being created at the local level. The effects on total job creation under the three scenarios are clearly demonstrated in the figure below. Both scenario I and II are almost the same while scenario III reveals an increase in the TNA of over 80% – this is entirely due to leakage, displacement and deadweight effects being extremely low.
This raises some very interesting questions for inward FDI policy, not just in South Africa, such as – what is preferable, maximise jobs at the national level or at the local level? Should regional and local targeting of job creation be a central requirement of FDI policy? Should local suppliers (SMEs for example) be given priority in bidding for contracts with the foreign investor? Should sectors with an existing strong domestic supply chain be prioritised for FDI targeting? Should a lower limit be imposed on the foreign investor for local content? If the answer to these questions is in favour of the local level then both α and β would be maximised although NNA may not. This is however as much a political choice as an economic one but of course in some of the sample countries there may be little choice at all given the present conditions of local supply chains.
Turning now to the other six countries in the sample we find that Chinese OFDI in Zambia is dominated by resource-seeking investments, approximately 82% of the $2bn invested across 14 projects between 2003 and 2012 was in the metals sector (mainly copper mining). Total direct job creation across the six sectors invested by Chinese OFDI was 9737 of which 80% was in metals.
South Africa – total Chinese OFDI impact on job creation.

GA: gross additionality; NLA: net local additionality; NNA: national additionality; OFDI: Outward Foreign Direct Investment; TNA: total net additionality.
Zambia – total Chinese OFDI impact on job creation.
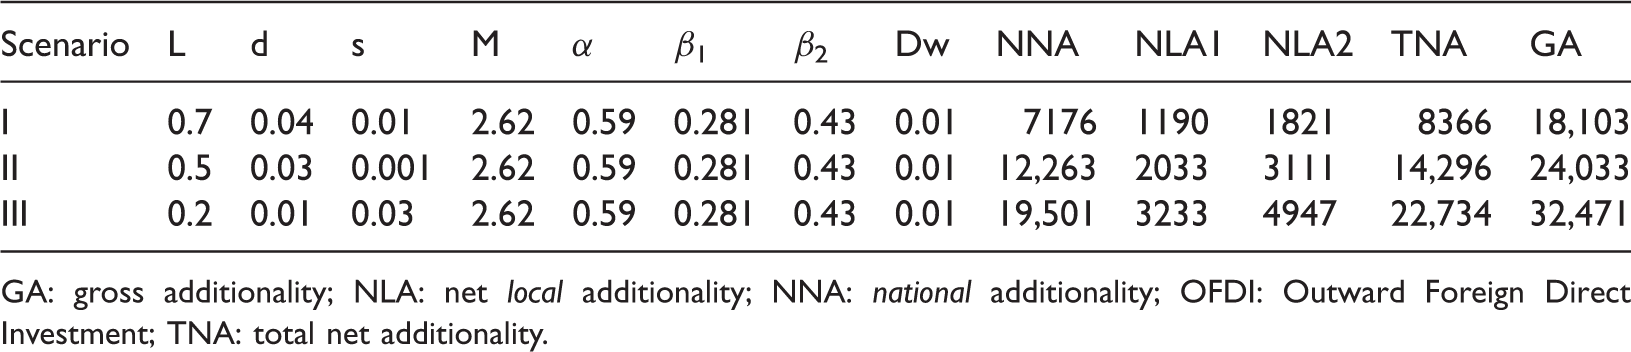
GA: gross additionality; NLA: net local additionality; NNA: national additionality; OFDI: Outward Foreign Direct Investment; TNA: total net additionality.
In the case of Zambia just over 24,000 jobs (best case scenario) have been created from the original 9737 directly created from Chinese OFDI between 2003 and 2013. The pattern generated by the induced effect under the three scenarios is similar to that of South Africa but in terms of scale is much smaller. This is almost entirely due to the very low involvement of Zambian firms in local contracting with the Chinese investing firm and the very high impact of leakage.
For Algeria the Type I employment multiplier is estimated between 1.5 and 2.5 (Musette, 2014) while the induced effect (α * β1) as given in Tables 2 and 3 is extremely low at only 0.0874 and very much less than Zambia – this of course should not be a surprise given the extremely high import dependency of Algeria and the correspondingly very low availability of domestically produced goods. A total of 9691 direct jobs were created by Chinese OFDI in Algeria between 2003 and 2013 and 87% of these were in the automotive sector! The remaining 13% were in industrial machinery, communications and extraction (the latter a mere 3% in only one project in 2003). However, given Algeria’s fairly high level of HDI and hence a value of 0.76 for α it is unlikely that leakage is high while displacement will be extremely low or zero along with local supplier inputs. Deadweight is thus also likely to be zero. In the case of Algeria, we therefore treat all these parameters as zero while accepting the higher end of the Type I multiplier at 2.5 – combined this produces a single scenario because there is no variation in any of the parameters – and this produces a gross employment impact of 22,350 jobs, 4.6% of which induced from local spending. This represents extremely low engagement with local suppliers but it is not unique to Chinese OFDI, indeed almost all FDI to Algeria will generate very low induced employment given the economy’s almost total disengagement with FDI firms.
Nigeria also provides evidence of very low multiplier effects from investment or spending as argued by Akpan and Abang (2013). This is also largely due to lack of engagement of the Nigerian formal sector with FDI projects and hence a high rate of leakage and low rates of domestic supply contracts along with low local goods availability. In this context it could be argued that Nigeria, in terms of FDI generally, exhibits the ‘worst of all worlds’. For Chinese OFDI total direct jobs created were only 3783 over the 2003–13 period and these were spread over 10 different projects and seven sectors – almost half were created in construction materials sector. Nigeria is a very small recipient of Chinese OFDI, even in the extractive industries, which is quite surprising given it is Africa’s top oil producer. The calculations for this study (using the Type I multiplier estimate from Akpan and Abang) gives additional jobs induced at the local level of between 35 and 51 but over 3000 jobs at the national level from the indirect employment effect. This is an incredibly low induced impact and is similar to Algeria, the result of an almost total disengagement of the local economy with any kind of FDI project.
It should be readily apparent that the employment impact of Chinese OFDI among the sample countries for this study varies enormously – this variation is not rooted in the sectoral distribution of the FDI but in the variation in Type I multipliers, local supply chain infrastructure, local availability of labour and of domestically produced goods. For two countries in the sample, Angola and the D.R. of Congo no reliable data for β1 or β2 could be sourced 23 while the α values are 0.56 and 0.46, respectively. Given the structure of these economies it can be reasonably assumed, a priori, that their Type I multiplier is similar to that of Algeria or Nigeria or somewhere between, that is between 1.16 and 1.5 or 1.16 and 2.5. In the case of these two economies, we take the simple average of the three values giving a Type I multiplier of 1.72. 24 For both Angola and the D.R. of Congo, Chinese OFDI created 4246 and 1339 direct jobs, respectively, between 2003 and 2013. The leakage value is likely to be mid-range and local supplier value to be very small while deadweight is almost certainly zero. The gross employment impact for both economies is calculated to be 8588 jobs (Angola) of which 9.85% is induced from local economic activity and 2660 jobs (D.R. Congo) of which 8.23% is locally induced.
Sudan is a relatively large recipient of Chinese OFDI in the coal, oil and gas sectors (investing $1.87bn over the 10 years) but with only 1390 direct jobs created in the same time period across four sectors, with automotives taking 64% of all jobs from the five projects initiated since 2003. Although the extractive sectors received 95% of the investment they only generated 20% of the direct jobs. With an α value of 0.5 but a respectable value for β1 and β2 of 0.432 and 0.18, respectively, there may well be significant additionality effects in the case of Sudan. However, multiplier estimates for the economy are not reliable and therefore, as above, we assume the value of 1.72 while leakage will be mid-range but local supplier inputs very low. The corresponding values for displacement and deadweight are almost certainly zero. The total employment effect in the case of Chinese OFDI is the creation of 2782 jobs but only 8.89% of these are being locally induced.
Comparison of employment impacts in the seven sample countries (central scenario II) with highest beta). a

GA: gross additionality; NLA: net local additionality; NNA: national additionality; TNA: total net additionality.
Highest beta as per cent of GA.
This rises to almost 150,000 under Scenario 3.
As stated above the variation is stark with Nigeria coming out the worst. The coefficient of variation among these seven in terms of the induced employment effect is 68%! Interestingly, Sudan has a significantly better induced impact than four of the other countries, even with a relatively small direct employment impact. The variation in impacts cannot be related to the nature of the Chinese OFDI in each country because, apart from Zambia, the investment profile across projects and sectors is very similar. The real source of the variation is in the engagement of the local economy with FDI projects. In South Africa and Zambia, this is fairly strong but low in most of the other countries in the sample, especially Nigeria, Angola and the D.R. of Congo. Of course it could be argued that it is the Chinese OFDI that is not engaging with the local economy however this is not a valid argument – as stated above if the local supply chain infrastructure is reasonable (as in S. Africa) then local engagement will be significant. It is the almost complete absence of this that is minimising the employment effects of the FDI in most of these countries and this is very much a matter of national and local policy priorities and not the domain of foreign investors per se. This argument is also found in the study by Kaplinsky and Morris (2009) in reference to opportunities coming from Chinese OFDI to Africa where they argue – ‘The real issue is whether SSA [Sub-Saharan African] countries have the human resource capacity and institutional capability to design and negotiate these agreements effectively, and then (perhaps more importantly) the political will and legitimacy to enforce them’ (Kaplinsky and Morris, 2009: 15).
For the seven country sample in this study, we estimate (scenario 2) that Chinese OFDI has created, over a 10-year period, a total of just over 112,000 jobs. If we apply the most optimistic scenario 3 this number rises to almost 150,000. The efficiency of job creation strongly depends on domestic supply chains, domestic production of goods and the availability of domestic goods to be purchased by the local community. The distribution of the type of employment impact across the seven sample countries is shown in Figure 9.
Local employment impact of Chinese OFDI in South Africa (2003–2013). Employment creation in the seven sample countries (2003–2013).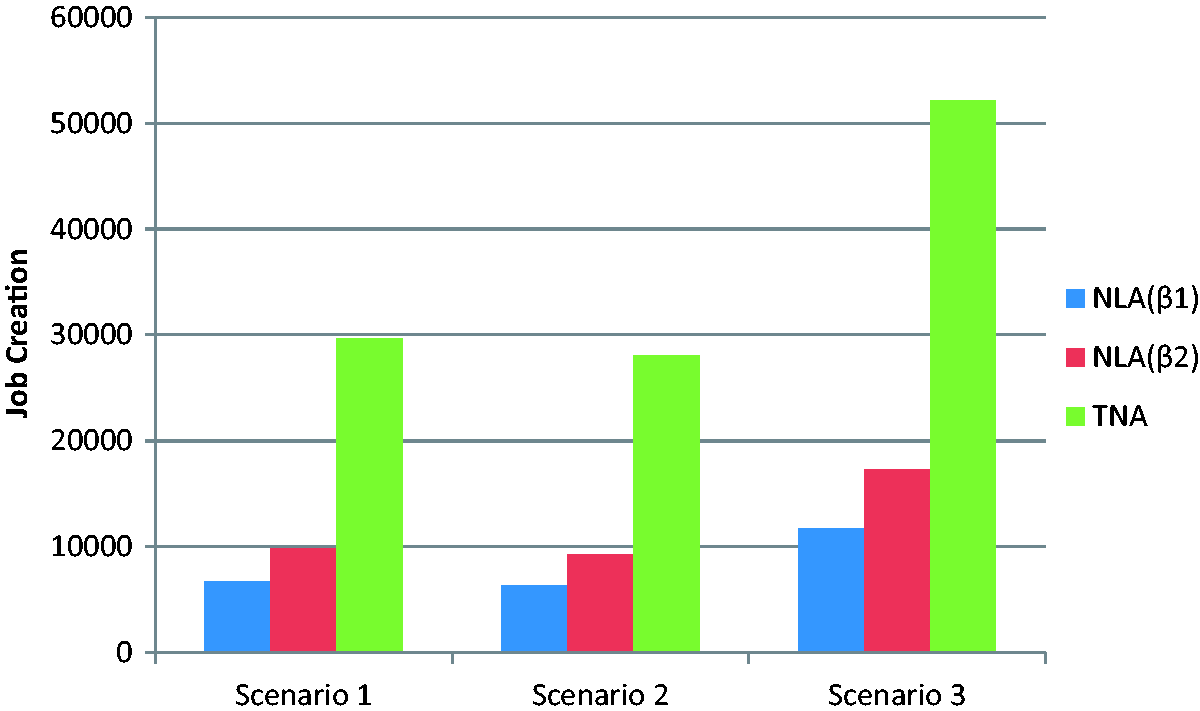
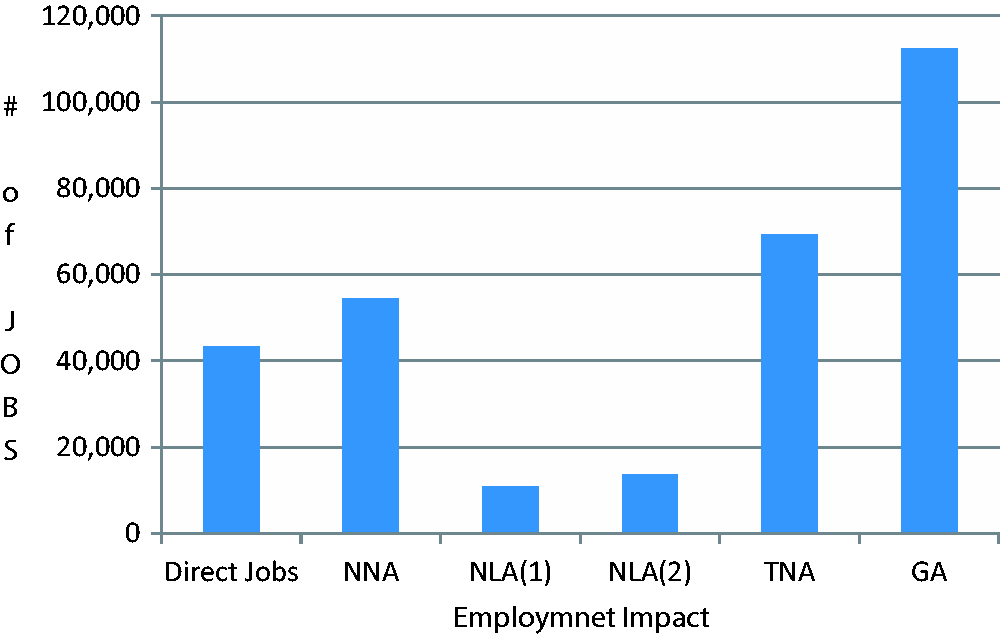
This reveals the important role that Chinese OFDI has had in generating total employment that is more than twice the number of jobs originally created and, at the localised level, arising from the interaction of α and β, at least 13,000 jobs have been induced. There is no doubt the latter could never have existed in the absence of such investment. These are fairly impressive numbers and contradict the argument that such investment brings little benefit to the African economies given that the magnitude of deadweight is almost zero in most of these economies.
Conclusion
Although the macroeconomic studies cited in this paper provide a rather depressing assessment of Chinese OFDI in Africa with estimates of GDP contribution rarely reaching above 1%, this study has demonstrated that such investment is still bringing many jobs to people who would otherwise be unemployed and even more importantly income to their families. The emphasis on contribution to GDP is a misplaced one because it ignores the welfare impact of the investments at the micro level which are important in many SSA countries given the lack of formal employment opportunities. In addition, the argument that Chinese OFDI in Africa is primarily resource seeking is simply not the case – this study has clearly refuted this. However, it should be a matter of concern for Chinese firms that the ‘negative’ image they receive is not a reflection of reality and therefore should invest in a project-by-project basis to generate accurate information on their real impact on local communities where they have significant investments.
On the policy side this paper has clearly demonstrated the importance of local supply chains, encouraging SMEs, encouraging production of goods at the local level, increasing local content and focusing on the importance of induced employment effects through policies that promote these. Only in South Africa does this appear to be the case – in the other sample countries the induced impacts are well below where they could be given improved education opportunities, SME encouragement, FDI engagement incentives and more active policies from national but more importantly local government. Greater attention needs to be paid to increasing the local content inputs which many projects actually seek but are not forthcoming due to the absence or inability of local firms to meet the quality standards required. This is an area that needs urgent attention from development banks, each country’s IPA and government departments at national and local level. Where most of these are present the data clearly show that locally induced employment additionality can be significant. Where none or very few such factors are present the local economy is losing out on additional employment opportunities.
There is also the problem of governance at the local level which may be too weak to enable the advantages of Chinese FDI projects to be realised. This is an issue Kaplinsky and Morris (2009) also highlighted in their study. There is a real need for further research on how governance at the local level acts as a barrier or a facilitator for local companies to benefit from FDI projects. Further work is also needed, ideally through local impact surveys, on the leakage, displacement, local supply contracts and local spending patterns to better estimate their values and the values of α and β in order to produce a more accurate assessment of the impact of FDI on local economies.
Footnotes
Declaration of conflicting interests
The author(s) declared no potential conflicts of interest with respect to the research, authorship, and/or publication of this article.
Funding
The author(s) received no financial support for the research, authorship, and/or publication of this article.