
Abstract
The Family Outcomes Survey–Revised (FOS-R) measures family outcomes of services for young children with disabilities or developmental delays, and it can be used to investigate change in outcome achievement over time. To confirm the validity of FOS-R change scores, it must be established that the FOS-R measures the same construct over time; if so, score changes can be attributed to family outcome achievement. However, if not, interpretation of change scores may be misleading. Caregivers (N = 349) of Singaporean children with developmental delays receiving early intervention services completed the FOS-R Part A twice, approximately 1 year apart. Factor analysis was used to confirm the structure of the FOS-R Part A and to assess whether the scale measures the same thing across time (i.e., longitudinal measurement invariance). Results provided support for partial longitudinal measurement invariance, indicating that change scores on this scale can be validly interpreted with certain caveats.
Documenting family outcomes, in addition to child outcomes, is now considered essential to evaluating the effectiveness of early childhood intervention (ECI) programs and services. Family outcomes were initially conceptualized broadly as “benefits experienced by families as a result of services received” (Bailey et al., 2006, p. 228). More specifically, however, family outcomes can be defined as benefits a family of a child with a disability receives due to ECI services provided to the child, where the members of a family may include parents or primary caregivers, siblings, grandparents, and extended family members, among others (Bailey et al., 2006; Poston et al., 2003). Family outcomes have been operationalized to include various family-related constructs such as family functioning, family stress, family satisfaction, family quality of life, family well-being, family adaptation, and parental self-efficacy (Epley et al., 2011; Hughes-Scholes & Gavidia-Payne, 2019; Turnbull et al., 2007). Through the Early Childhood Outcomes (ECO) Center funded by the U.S. Office of Special Education Programs (OSEP) in 2003, measures producing psychometrically reliable and valid scores have been developed and used for the evaluation of ECI programs to meet accountability requirements for Part C services under the Individuals with Disabilities Education Improvement Act (IDEA, 2004). Since then, measuring family outcomes has become a critical topic in the ECI field in the United States and increasingly across the globe, given the important role the family plays in a child’s development.
According to Bowen’s (1978) family systems theory, a family functions as a system with the components of this system constantly affecting each other. On one hand, raising a child with a disability can have both positive and negative impacts on the family (Hanson, 2013). While experiencing the joy and rewards of parenting, a family of a child with a disability may also be facing an array of risks such as increased parenting stress for both mothers and fathers (Foody et al., 2015), higher divorce rate (Hartley et al., 2010; Namkung et al., 2015), and behavioral and emotional issues of typically developing siblings (Hastings, 2007; Orsmond et al., 2009). On the other hand, how a family functions, and how different family members cope with the situation of parenting a child with a disability, can directly impact the outcomes a child receives from ECI services (Hughes-Scholes & Gavidia-Payne, 2019). Given the complexity of family systems, accurately assessing family outcomes is of critical significance in depicting a more complete picture of ECI outcomes for policymakers and different stakeholders.
Furthermore, family supports delivered via family-centered practices are increasingly recommended for implementation to empower families to understand and support the unique needs of raising a child with a disability (Bailey et al., 2012; Odom & Wolery, 2003). Measuring family outcomes over time would be conducive to identifying the potential mechanisms involved in family-centered practices that can promote positive family outcomes, in addition to positive child outcomes. In addition, families in different countries tend to have different characteristics (e.g., the presence/absence of grandparents, extended family members, or domestic helper in the family). Accordingly, assessing family outcomes using assessment tools that provide reliable and valid scores, and importantly, scores that are culturally valid and sensitive to change, becomes a critical issue to be further addressed to holistically document and quantify the efficacy of ECI programs and services (Raspa et al., 2010).
One of the most widely known measures of family outcomes in the ECI sector is the Family Outcomes Survey–Revised (FOS-R; Bailey et al., 2011). The FOS-R consists of Part A, measuring outcomes, and Part B, measuring helpfulness of services. The current article concerns Part A. The FOS-R Part A seeks to collect information from caregivers in relation to five family outcomes in early intervention: (a) understanding the child’s strengths, abilities, and special needs; (b) knowing their rights and advocating effectively for their children; (c) helping their child develop and learn; (d) having support systems; and (e) accessing desired services, programs, and activities in the community. These outcomes were designed to reflect “parents’ perceptions of their competence, confidence, and ability to care for their children with special needs and to achieve a satisfactory level of family adaptation” (Bailey et al., 2011, p. 7) and, furthermore, are designed to identify areas of improvement in early childhood education programs. Bailey et al. (2011) have reported good psychometric evidence for FOS-R Part A scores, with support for five factors representing the five identified outcomes as well as good internal consistency.
Although the FOS-R was developed in the U.S. context, previous cross-cultural studies of the FOS-R have reported good psychometric properties in international samples, including Singapore (Poon et al., 2014) and Japan (Ueda et al., 2015). Analyzing the construct validity of the FOS-R with a sample of 291 caregivers of children attending ECI services in Singapore, Poon et al. (2014) reported that a second-order, five-factor model of the FOS-R Part A fit the data well, providing validity evidence for the five individual outcomes as well as an overall score. These authors additionally reported that the five individual subscales as well as the overall score showed high internal consistency (e.g., Cronbach’s alpha ranged from .84 to .91).
However, existing studies have assessed the validity of FOS-R scores at a single time point only. Given that assessing family outcomes includes understanding how early intervention services influence family outcomes, it is reasonable, both in the United States and internationally, to examine how well the FOS-R Part A documents change in family outcomes over time. Raspa et al. (2009) proposed that when caregivers report they feel generally competent and confident on all items from a given outcome, evidence for outcome attainment is established. However, change could also be evaluated in terms of absolute improvement in FOS-R Part A scores on each of the outcomes.
To understand the validity of comparing scores on the FOS-R Part A across time, longitudinal measurement invariance—evidence that FOS-R Part A measures the same construct across time—must be established (Widaman et al., 2010). Without ensuring the equivalence of the construct measured across time, comparison of scores at different time points can lead to incorrect conclusions and can result in comparing apples to oranges (Putnick & Bornstein, 2016). Statistical measurement invariance techniques can be used to empirically test the assumption of longitudinal measurement invariance. In the present case, if the assumption of invariance across time is not met for the FOS-R Part A, this would make it invalid to compare scores across time as any differences observed could be due to measurement artifacts rather than real changes in outcomes. In other words, the interpretation of change scores can be meaningless without evidence of measurement invariance over time, which is of particular significance in quantifying family outcomes given its potential impact on policy and practice. In fact, Vandenberg and Lance (2000) argued that failure to demonstrate measurement invariance represents just as serious a problem to measurement as that of low validity or reliability of scores on a measure.
Therefore, this study aimed to first replicate evidence for the factor structure of the FOS-R Part A as reported in Poon et al. (2014). Second, this study aimed to assess the evidence for longitudinal measurement invariance (i.e., invariance across time) of the FOS-R Part A at two time points (i.e., Time 1 and Time 2) across a period of approximately 1 year (ranging from 9 to 15 months) to investigate the validity of using FOS-R Part A change scores to document changes in family outcomes across time. Given the importance of understanding and documenting how ECI services influence family outcomes, this presents another important step in validating FOS-R Part A change scores for such a use.
Method
Participants and Procedures
Participants were caregivers of children from 15 Early Intervention Programme for Infants and Children (EIPIC) centers in Singapore, where young children and their families receive early intervention services (Poon & Lim, 2012; Poon & Yang, 2016). The FOS-R Part A was completed at two time points: Time 1 upon their child’s entry to EIPIC and Time 2 when their child had attended EIPIC for approximately 1 year. A total of 349 caregivers were included in the current analysis: 237 caregivers had responses present on the FOS-R Part A at both time points, while a further 101 had responses present at Time 1 only and 12 had responses present at Time 2 only. Responses were considered present when the participant had responded to at least 50% of the items at a given time point. One case with complete data at Time 1 but responses to only two of 24 items at Time 2 was excluded from the individual analysis of Time 2 data due to the extreme amount of missing data points, but was included in the joint analysis of Time 1 and 2 data (measurement invariance analysis).
Children whose caregivers completed the FOS-R were ages 5 to 83 months (M = 47.46, SD = 14.88) at Time 1, and 19 to 92 months (M = 57.08, SD = 14.09) at Time 2. Of the survey respondents, the large majority were mothers (71.3%), followed by fathers (20.1%), others (3.2%), both parents (1.4%), or not reported (4.0%).
At both time points, the FOS-R Part A was provided to caregivers as part of a larger battery of hardcopy questionnaires. Caregivers completed the surveys in their own time and subsequently returned the surveys to study team members by post. If participants failed to return the surveys, two reminders were given, after which study team members contacted the participants a third time to request they complete the survey over the phone if they had not yet completed the survey. Of the current sample, eight participants completed the survey over the phone at Time 1 and two at Time 2. The only difference in administration across time points was that at Time 2 caregivers were also administered an adaptation of the FOS-R helpfulness items based on the FOS-R Part B and designed to match each of the FOS-R Part A items. It is possible that the administration of these helpfulness items could have influenced participants’ responses to FOS-R Part A items, although there was no clear evidence of this.
Measures
Family outcomes
The FOS-R Part A (Singapore adaptation; Bailey et al., 2011; Poon et al., 2014) was used to measure family outcomes at Time 1 and Time 2. Part A of the FOS-R consists of 24 items measuring five outcomes (i.e., understanding child’s strengths, abilities and special needs; knowing their rights and advocating effectively for their children; helping their child develop and learn; having support systems; and accessing desired services, programs and activities in the community). Each item is measured on a 5-point Likert-type scale (1 = not at all, 2 = a little, 3 = somewhat, 4 = almost, 5 = completely).
Analysis
Descriptive statistics were calculated using R (version 3.4.4; R Core Team, 2018). Confirmatory factor analysis (CFA) was conducted in Mplus 8 (Muthén & Muthén, 1998–2017) to examine the factor structure and longitudinal measurement invariance of the FOS-R Part A. For analysis of Likert-type scale questions with less than five categories, weighted least squares CFA estimators are generally recommended over maximum likelihood (ML) estimators (Rhemtulla et al., 2012); however, for five or more categories, recommendations are less clear (Li, 2016). Some research suggests that established cutoffs for measurement invariance testing statistics may be more appropriate for ML and robust maximum likelihood (MLR) estimators (Sass et al., 2014). Thus, the choice was made to use the MLR estimator, which is an ML estimator that is appropriate for nonnormal item distributions. 1
The MLR estimator uses full-information maximum likelihood (FIML) methods to deal with missing data. Given the number of cases with missing data at either Time 1 or 2 (n = 113), the method used to deal with missing data in this analysis was an important consideration. There are several different methods of dealing with missing data, but FIML is consistently regarded as one of the most accurate methods across a wide range of scenarios, including longitudinal analyses (Enders, 2013; Little et al., 2014; Newman, 2003; Pigott, 2001; Wothke, 2000). Other methods, such as complete case analysis, have been shown to bias parameter estimates and standard errors due to the strict assumptions made about the cause of missingness (Pigott, 2001).
The following fit indices were used to assess fit: comparative fit index (CFI) or Tucker–Lewis index (TLI) ≥ .95, root mean square error of approximation (RMSEA) ≤ .06, and standardized root mean square residual (SRMR) ≤ .08 (Brown, 2006; Hu & Bentler, 1999).
The fit of the five-factor structure proposed by Bailey at al. (2011) and the five-factor second-order structure reported by Poon et al. (2014) were investigated using both the Time 1 and Time 2 data. Statistical separability of the five factors was also tested to ensure that a five-factor model better explained the structure of the FOS-R Part A than a single factor. This was done through comparison of the chi-square difference between the five-factor model and the single-factor model, where a value of p < .05 would indicate significantly worse fit. In addition, the fit of the second-order model with five first-order outcome factors and a second-order general outcomes factor was compared with the first-order five-factor model. This second-order model allows for a test of whether a general outcomes factor explains the correlations between the five different first-order outcome factors (see Figure 1).
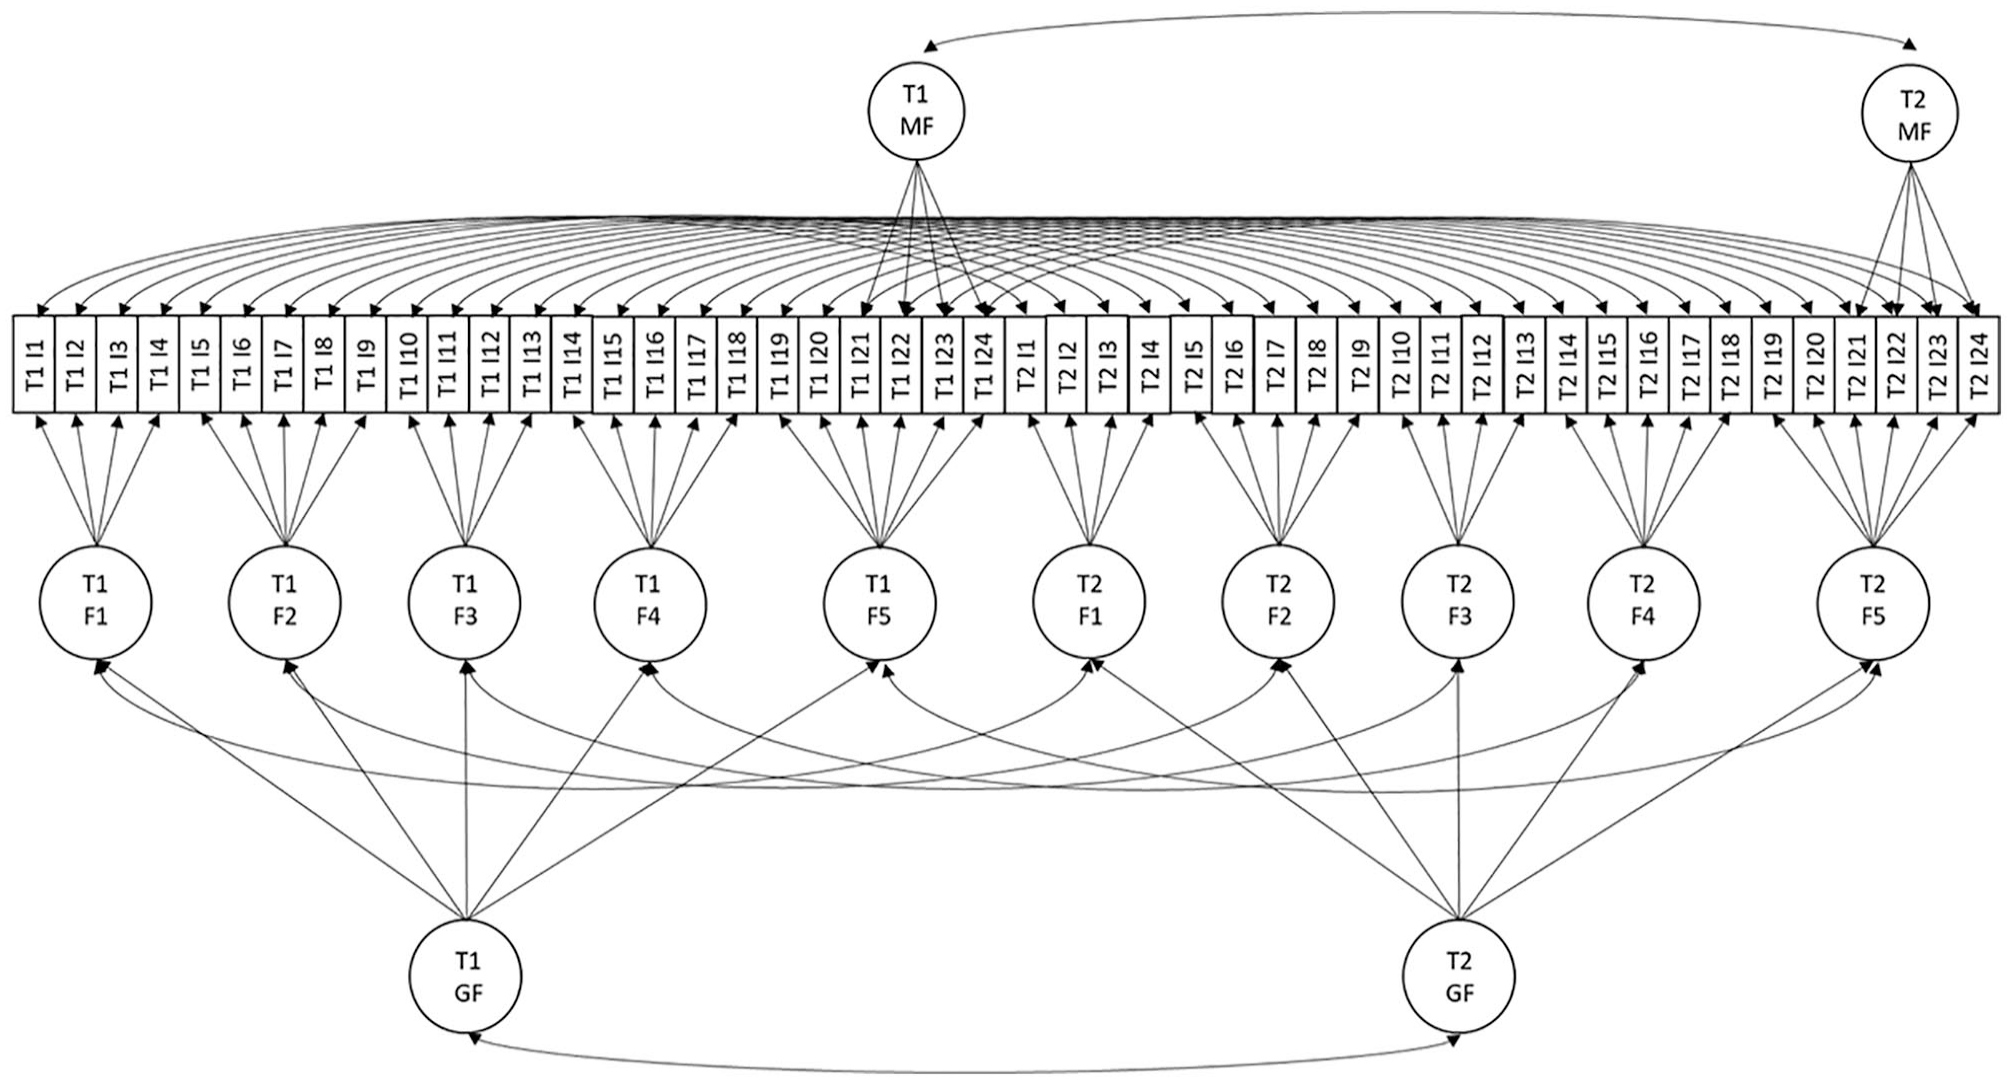
Confirmatory factor analysis model tested for longitudinal measurement invariance (second-order).
Longitudinal measurement invariance can be tested either by using the multiple-groups CFA method or by analysis of the augmented covariance matrix of longitudinal data. Vandenberg and Lance (2000) recommend the use of the augmented covariance matrix where possible, as it allows analysis to take into account the covariance among indicators across time as well as within time. This takes into account the repeated-measures nature of longitudinal measurement with the same sample as opposed to comparing independent groups. A conceptual diagram of the second-order model tested using the augmented covariance matrix is presented in Figure 1.
Measurement invariance testing proceeded following the standard steps outlined in the measurement invariance literature (Putnick & Bornstein, 2016; Vandenberg & Lance, 2000; Widaman et al., 2010):
Configural invariance tests the assumption of the same pattern of factor loadings at Time 1 and Time 2. If configural invariance is not met, this indicates that the items show different relationships to the construct across time.
Metric invariance tests the assumption of equal factor loadings across time. If metric invariance is not met, this means that the strength of the relationships between an item and the construct vary over time.
Scalar invariance tests the assumption of equal item intercepts across time. Violation of scalar invariance indicates that across time, people show a higher or lower likelihood of endorsing items at the same level of the construct.
Further tests of measurement invariance are available (e.g., indicator uniqueness invariance); however, they are not required for the interpretation of mean differences (Vandenberg & Lance, 2000) and so are not reported here. To test for measurement invariance, the fit of a more restrictive model is compared with the model from the previous step. A nonsignificant change in chi square as well as a change in CFI ≤ .002 (Cheung & Rensvold, 2002; Meade et al., 2008; Sass et al., 2014) indicates that invariance is met, as constraining parameters to equality did not significantly decrease model fit.
Results
Descriptive Statistics
Descriptive statistics indicated that caregivers generally felt reasonably competent and confident in their ability to care for their child, with average scores falling around 3.5 (Somewhat/Almost) at both Time 1 and Time 2. Item scores showed acceptable skew (−0.55 to −0.06) and kurtosis (−0.71 to 0.62).
Confirmatory Factor Analysis
Factor structure of FOS-R, Part A
The results of the CFAs generally provided support for both a first-order five-factor model and a second-order model (see Table 1). However, the fit of these models did not quite meet criteria required for adequate fit. Therefore, an orthogonal mini factor was modeled to account for additional shared variance between Items 21 to 24 (see Figure 1). Items 21 to 24 are “Our medical and dental needs are met” (Item 21), “Our child care needs are met” (Item 22), “Our transportation needs are met” (Item 23), and “Our food, clothing, and housing needs are met” (Item 24). Conceptually, Items 21 to 24 are more highly related to each other than they are to the other two items loading on factor 5 (Items 19 [“Our child participates in social, recreational, or religious activities that we want”] and 20 [“We are able to do things we enjoy together as a family”]) as Items 21 to 24 consider specific services such as medical/dental, child care, transport, food, clothing, and housing.
Fit Statistics for Confirmatory Factor Analysis of FOS-R (A) Items: Time 1 and Time 2.
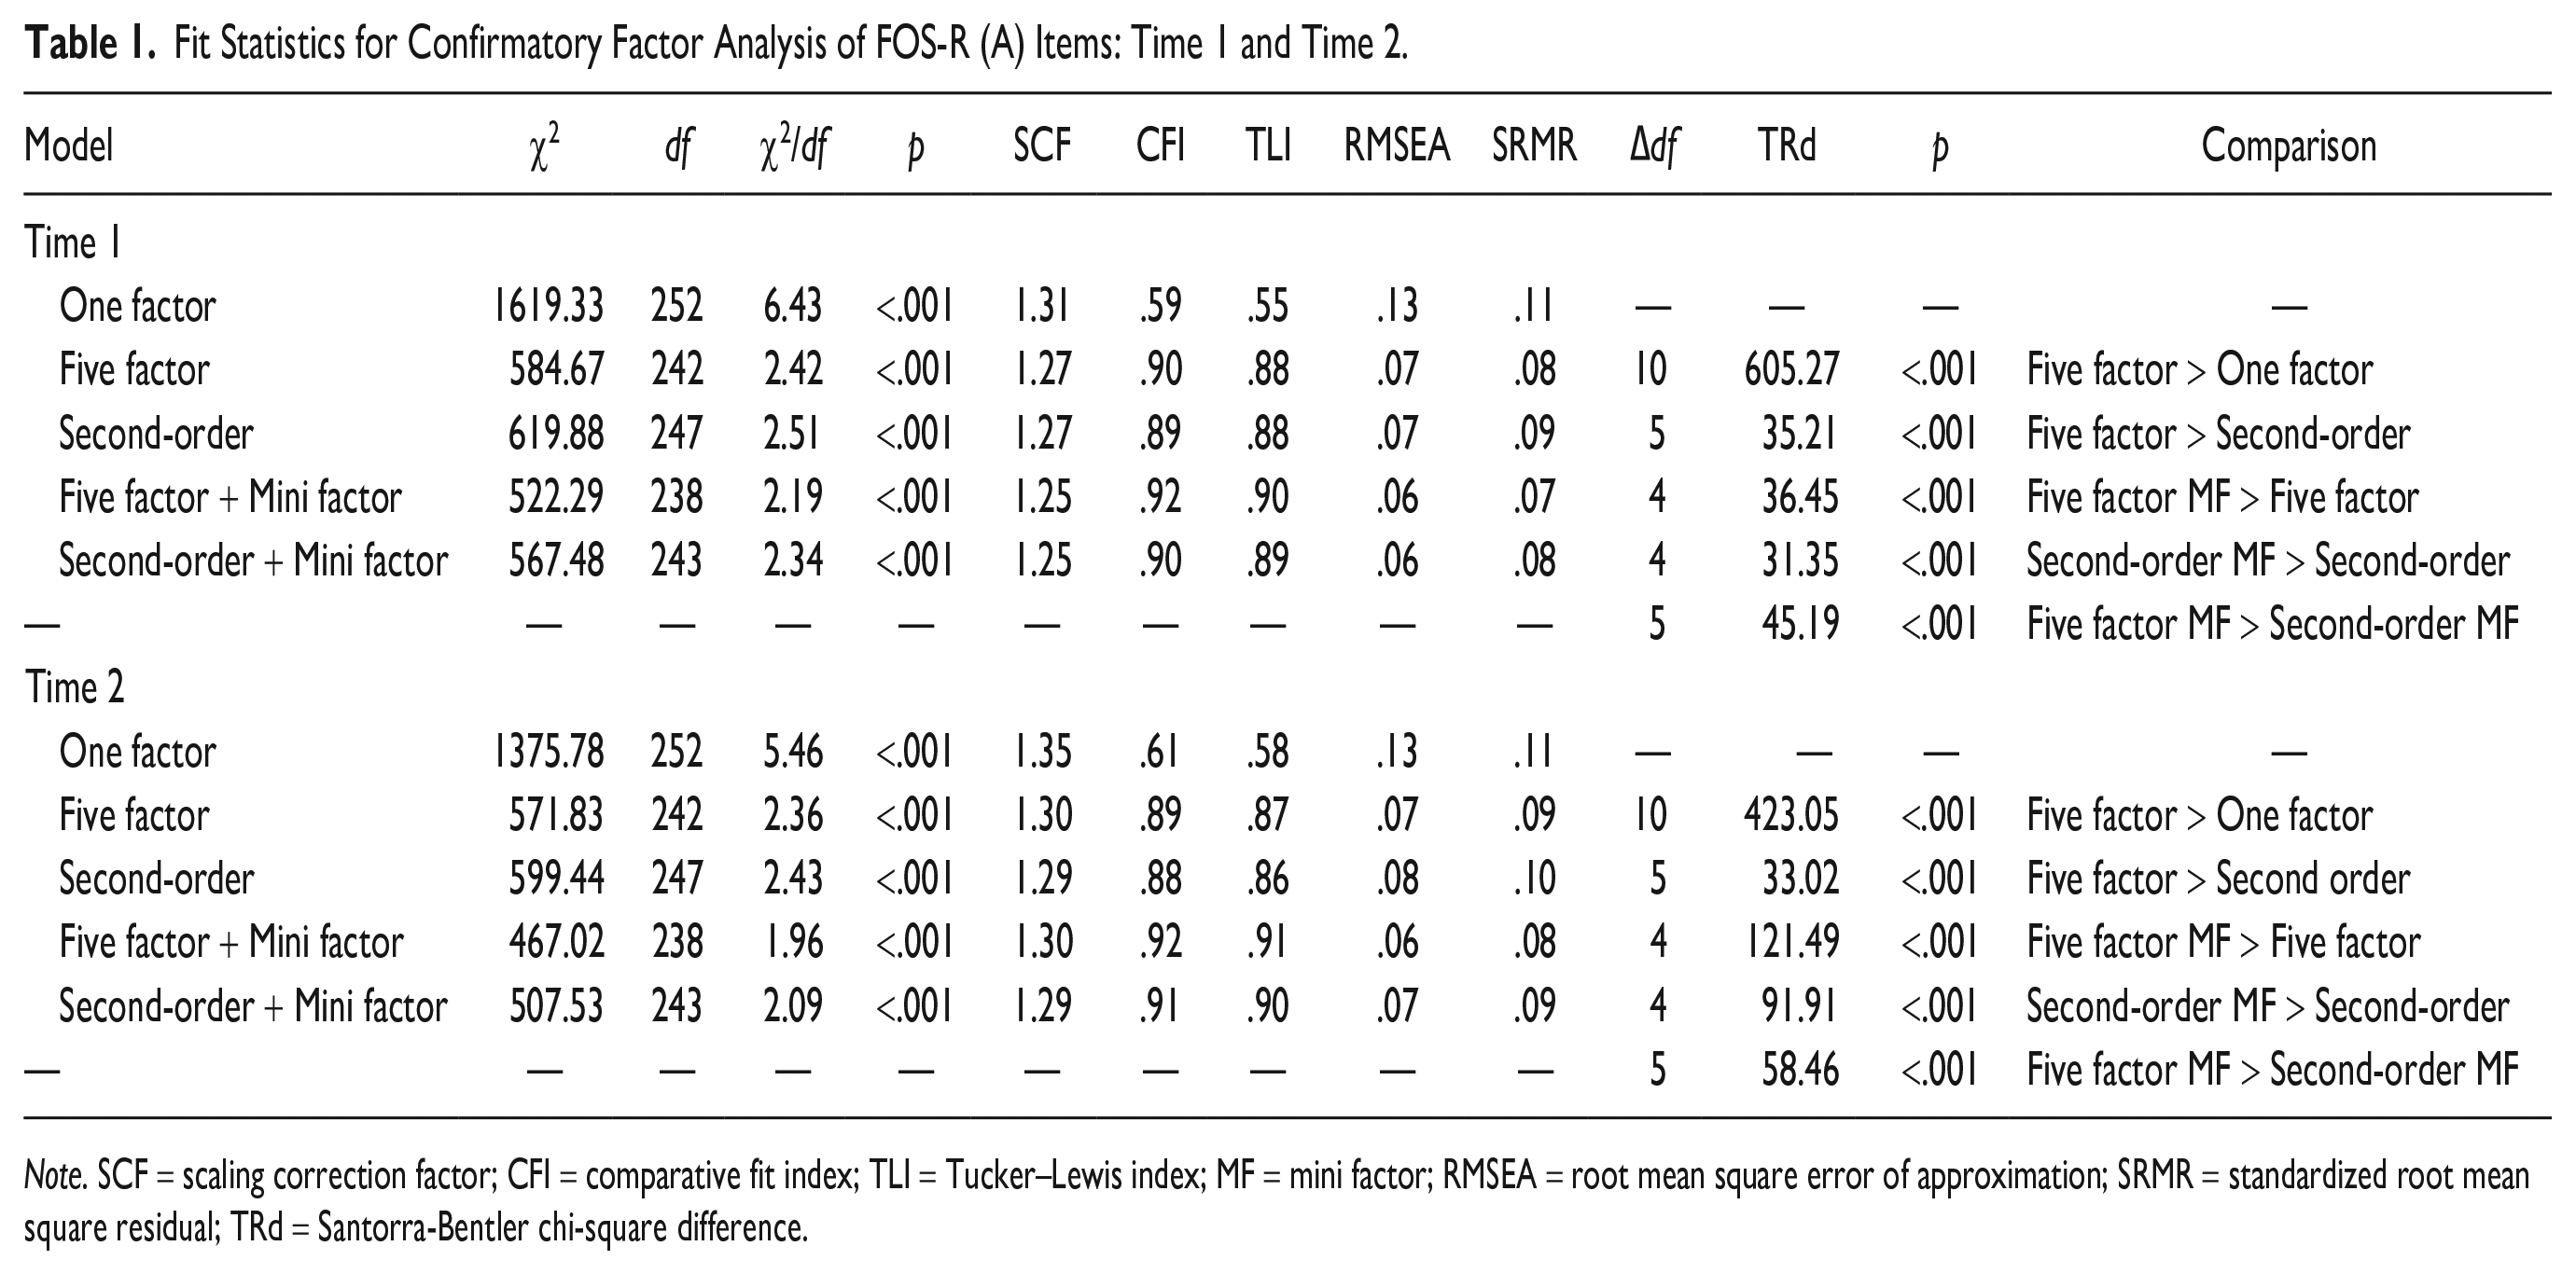
Note. SCF = scaling correction factor; CFI = comparative fit index; TLI = Tucker–Lewis index; MF = mini factor; RMSEA = root mean square error of approximation; SRMR = standardized root mean square residual; TRd = Santorra-Bentler chi-square difference.
The addition of this orthogonal mini factor to represent the shared variance between Items 21 to 24 can be thought of as similar to a testlet factor or specific factor in a bifactor model. Testlet or specific factors can be used to represent the shared variance of a small group of items that may have additional overlapping content due to item characteristics such as shared stimuli, common content, or response sets, and are modeled to be uncorrelated with other factors (Byun & Lee, 2016; DeMars, 2013). These testlet or specific factors can be modeled so that each item’s loading on the testlet/specific factor is proportional to its loading on the more general factor, or so that each item’s loading on the testlet/specific factor and more general factor are freely estimated (Byun & Lee, 2016; Rijmen, 2010). The constraints of proportional loadings may be too stringent (Byun & Lee, 2016; Rijmen, 2010); therefore, in the present case loadings on the orthogonal mini factor and the more general (outcome five) factor were freely estimated.
Including this orthogonal mini factor resulted in a significantly better fit in both the Time 1 and Time 2 samples, and for both the first- and second-order models. RMSEA and SRMR values for the models with the orthogonal mini factors were generally acceptable, but CFI and TLI values were lower than the criteria of ≥.95 required for good fit. However, CFI and TLI values ≥ .90 may indicate acceptable fit, particularly with sample sizes less than 500 (Bentler, 1990; Weston & Gore, 2006).
Interestingly, the five-factor model without a second-order general outcomes factor fit the model significantly better than the model with the second-order factor. This indicates that a general outcomes factor may not appropriately account for variance in the five outcomes. It should be noted, however, that although the first-order five-factor model fit statistically significantly better than the second-order model, the fit of the second-order model was also acceptable, indicating that the general outcomes factor may still be useful.
Longitudinal measurement invariance
Given that the first-order five-factor model demonstrated the best fit to the data at both Time 1 and Time 2, longitudinal measurement invariance testing proceeded with this model. However, the second-order model was also tested to examine longitudinal invariance in the general FOS-R Part A factor.
Results from the longitudinal measurement invariance testing of the first-order model provided support for invariance of the factor structure and factor loadings (configural and metric invariance; see Table 2); however, results indicated that intercept invariance (scalar invariance) was only met after freeing the intercept of Item 8 (“We know what options are available when our child leaves the program”). Thus, the results of the measurement invariance analysis provided support for partial measurement invariance. When the intercept of Item 8 was freely estimated, the unstandardized value was 2.76 at Time 1 and 3.02 at Time 2, indicating that given the same level of overall competence and confidence in knowing their rights and advocating effectively for their child, caregivers were more likely to rate this item highly at Time 2 than at Time 1. Results from the analysis of the second-order model supported the analysis of the first-order model, again reporting a violation of scalar invariance for Item 8. 2 In accordance with reporting conventions, standardized loadings from the respective final scalar invariance first- and second-order models are presented in Table 3.
Longitudinal Measurement Invariance Statistics for FOS-R, Part A (Time 1 and Time 2).
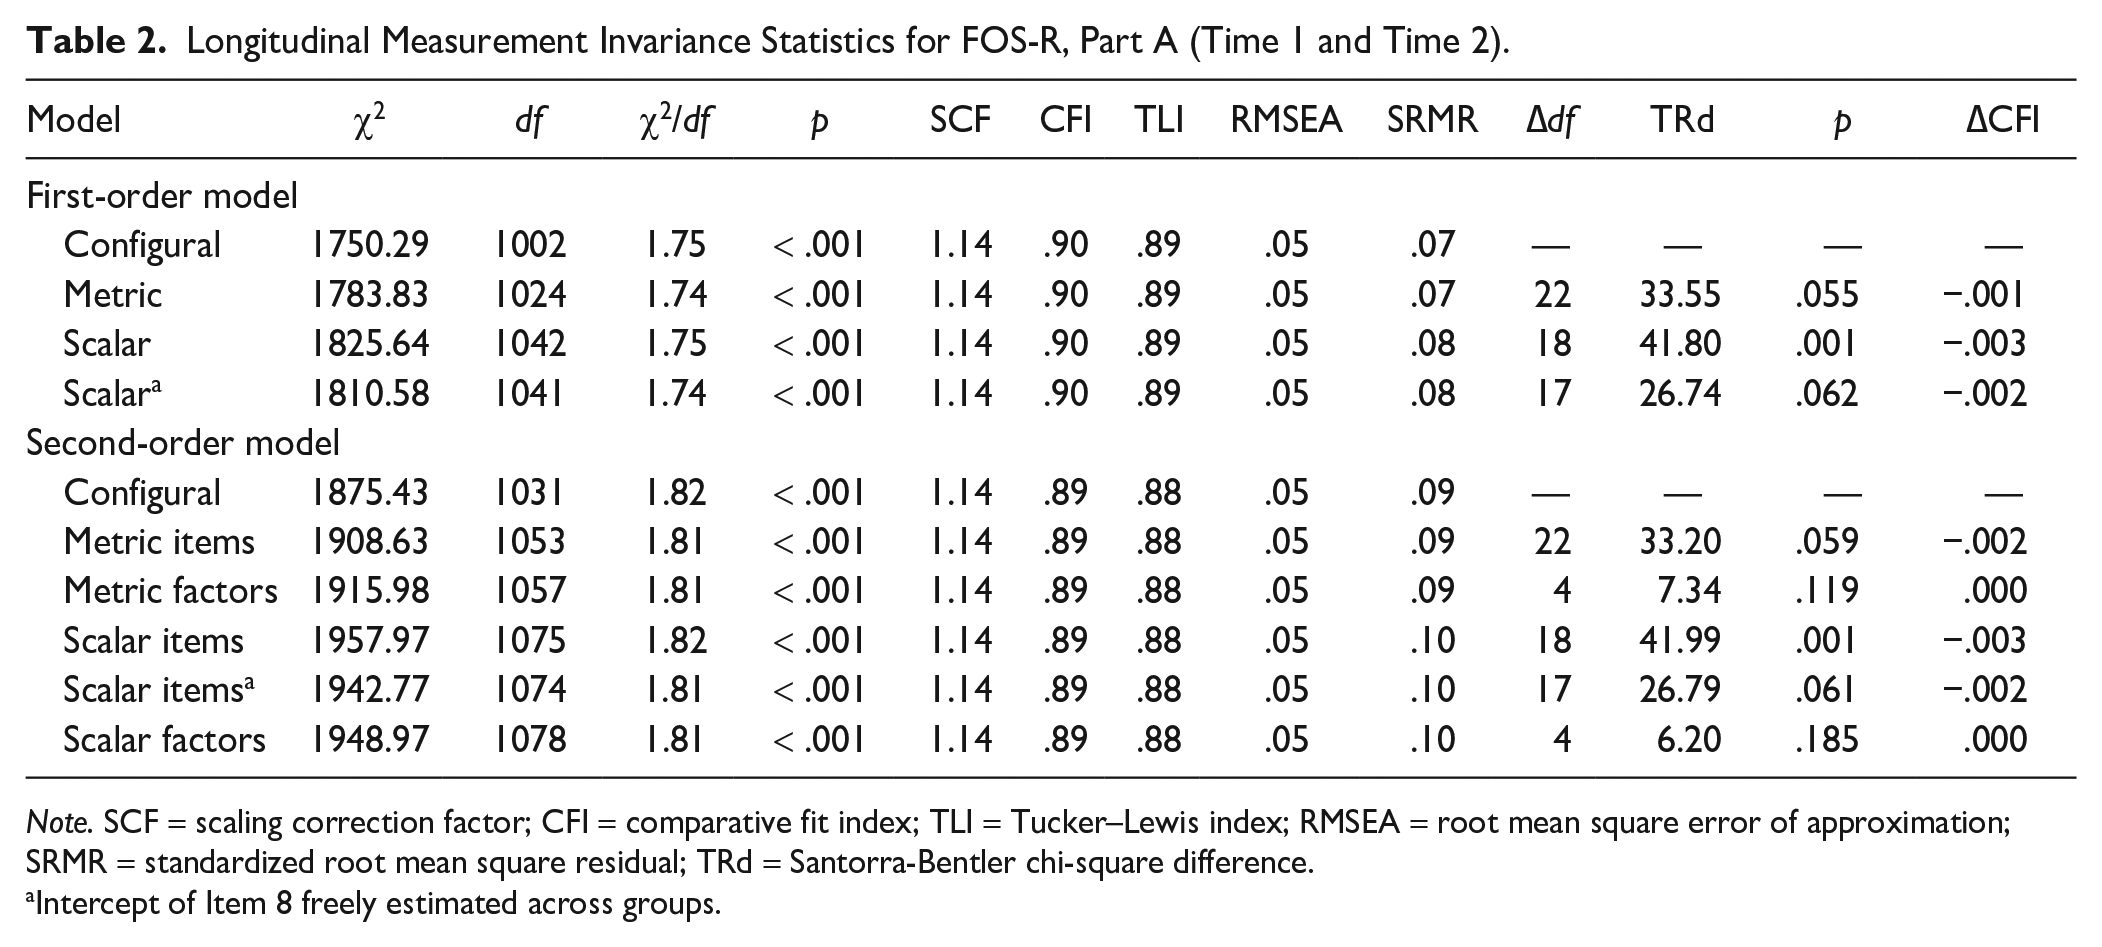
Note. SCF = scaling correction factor; CFI = comparative fit index; TLI = Tucker–Lewis index; RMSEA = root mean square error of approximation; SRMR = standardized root mean square residual; TRd = Santorra-Bentler chi-square difference.
Intercept of Item 8 freely estimated across groups.
Standardized Factor Loadings From Final Longitudinal Invariance Models.

Note. Understand = understanding child’s strengths, abilities, and special needs; Know = knowing their rights and advocating for their children; Help = helping their child develop and learn; Support = having support systems; Access = accessing desired services, programs, and activities in the community. Values outside parentheses indicate standardized loadings for the first-order model, while values inside parentheses indicate standardized loadings for second-order model.
Discussion
The results of the current study support Poon et al.’s (2014) previously proposed factor structure of the FOS-R Part A, with the addition of a mini factor to represent additional shared variance among items on the fifth factor, although the first-order five-factor model was found to fit better than the second-order model. The current study added to the literature by examining the factor structure with a mini factor accounting for additional shared variance between Items 21 to 24, which has not been done in previous studies (e.g., Bailey et al., 2011; Poon et al., 2014; Ueda et al., 2015). Results from this analysis suggested a potentially new factor or subfactor of the FOS-R Part A, which measures the practical aspects of care (e.g., dental, child care, transportation, and daily living needs), as related to but still distinct from the other items measuring the fifth family outcome, “accessing desired services, programs and activities in the community.” Including the mini factor significantly improved the fit of the five-factor first- and second-order models. However, the fit of these models without the mini factor was also very close to acceptable levels. This would indicate that although modeling the additional shared variance between these items may be conceptually and statistically useful, it likely does not represent a large threat to the validity of the instrument in its original five-factor structure. Previous studies, such as that by Poon et al. (2014), which reported satisfactory fit of the second-order model without a mini factor, support this notion. The new findings in the current study indicate a direction for future studies to examine an alternative six-factor structure of the FOS-R Part A.
The longitudinal measurement invariance analysis in the current article sought to understand the question of whether scores on the FOS-R Part A measured the same thing across the two time points. Improvement in the outcomes measured by the FOS-R Part A would be expected as a result of participation in the ECI program and therefore an increase in observed sum scores, as well as their corresponding latent factor scores, may be expected. Longitudinal measurement invariance allows for any such differences in the observed and latent scores while assessing whether there is a difference in the meaning of these scores, which would render score comparisons meaningless. Results of the longitudinal measurement invariance analysis largely supported both metric and scalar longitudinal invariance of the FOS-R Part A across time, indicating minimal difference in the meaning of the construct measured across the two time points, irrespective of any expected differences in observed sum or factor scores.
However, the intercept of one item (Item 8, “We know what options are available when our child leaves the program”) was found to vary across time, indicating that given the same level of perceived competence and confidence, Item 8 was more easily endorsed at Time 2 (i.e., after their child attended early intervention for about a year) than at Time 1 (i.e., upon their child’s entry to early intervention). This is not entirely unexpected, as Item 8 directly links to the participants’ experiences in the early intervention program. After attending the early intervention program (i.e., EIPIC in Singapore) for about a year, caregivers might be more aware of the varied options available after leaving the program, and therefore be more likely to endorse this item irrespective of any differences in their overall competence and confidence. This finding would suggest that attending the early intervention programs helped caregivers gain more specific knowledge regarding their options after the program.
This current finding relating to scalar noninvariance of Item eight would indicate that the families in the present study received some form of specific information regarding the transition beyond the ECI service which resulted in their increased propensity to endorse this item at the second time point. Although the sample considered in the present study experienced ECI services as provided in Singapore, it is likely this finding would also be applicable in other international contexts where transition services are mandated or provided, such as the United States. Such transition services could include, but are not limited to, employing customized approaches within programs for the transition of children in the programs to the next placement, providing information and counseling for parents on possible pathways for the child, conducting relevant assessments to advise on educational placements, and providing a customized report on the child’s needs for better transition support. More importantly, our findings suggest a need to look into the issue of measurement invariance across time for outcomes-related measures, where change scores are important, worldwide. This would not only help detect the nuances of scale and item functioning across countries/cultures, but also facilitate studying the measurement invariance of the commonly used outcome measures in ECI.
Although the FOS-R Part A was found to be largely measurement invariant across time, full measurement invariance was not met due to violation of scalar invariance of Item 8. Previous research has indicated that it may not be valid to compare raw scores when full measurement invariance is not met and that in such a case it would be more appropriate to compare latent variable means (Steinmetz, 2013). Steinmetz (2013) describes the issue of latent variable means versus raw scores in the following way: The latent variable can be thought of as the cause of the response, and the mean of the latent variable represents the true mean of the construct being measured. Raw scores, on the other hand, are influenced by the latent variable and the relation between the item and the latent variable (i.e., factor loadings and item intercepts). If full measurement invariance is met, differences in raw scores are attributable to differences in the latent mean. However, when there are differences in factor loadings or item intercepts, examining differences in raw scores does not represent a true picture of differences in the latent variable. Thus, findings from the current study indicate that it may be more appropriate to either use raw score changes on the FOS-R Part A without Item eight or to examine change at the latent mean level.
Instruments with psychometrically sound scores for measuring family outcomes, and particularly changes in family outcome attainment, can be used to inform practitioners and program leaders of the helpfulness of their services to families, as well as to suggest directions for improvement efforts. Although the five family outcomes in the FOS-R Part A are not required by either the Singapore or U.S. governments’ accountability reporting procedures, they can provide valuable data for program evaluation purposes. In the United States, the Division for Early Childhood (2014) recommends that “Leaders collaborate with stakeholders to collect and use data for program management and continuous program improvement and to examine the effectiveness of services and supports in improving child and family outcomes.” In Singapore, although there is no legislation that specifically addresses special education or ECI services, the series of Enabling Masterplans released every 5 years provides the country’s roadmap for the development of programs and services in the disability sector. In the current Enabling Masterplan (Enabling Masterplan Steering Committee, 2016), the third one in the series, “supporting caregivers” is listed as one of the four key thrusts in the provision and development of disability-related services from 2017 to 2021. Programs serving young children with disabilities or developmental delays and their families in both Singapore and the United States, as well as other countries which may have similar aims or requirements in terms of family outcomes in the context of disability services, may need instruments that can provide psychometrically sound scores across time to assess and document their efforts in aligning with these aims. The present findings provide evidence that the FOS-R Part A can satisfy this need.
Some limitations of the current study include the timeframe over which longitudinal measurement invariance was assessed. The interval between Time 1 and Time 2 was relatively short, ranging from 9 to 15 months (M = 10 months), which may have increased the likelihood of support for measurement invariance across these two time points. Ueda et al.’s (2015) findings that mothers with children who had been in early intervention for at least 4 years were more likely to achieve family outcomes suggested that it takes time to show changes on the family outcomes measured by FOS-R Part A. Therefore, it is also possible that although the FOS-R Part A can be said to measure the same construct across the relatively short period of time considered in the present study, it may not do so over a longer period of time as an increasingly greater magnitude of change is observed in scores. Therefore, future research is needed to examine the issue of longitudinal measurement invariance of this scale over a longer period of time.
The timing of data collection may also have influenced the likelihood of finding support for measurement invariance: at Time 1, children had been enrolled in early intervention programs for approximately one and a half months on average. Therefore, although Time 1 represents to some extent a baseline level of family outcomes, measurement at Time 1 was not done before entry to early intervention. It is possible that the constructs measured by the FOS-R Part A are more likely to differ when the time points considered are, for example, before and after commencement of the early intervention program.
Overall, the results of this study provide further support for the validity of FOS-R Part A scores in Singapore, while suggesting further investigation into a new factor or subfactor related to practical aspects of care. Moreover, the results provide the first evidence for longitudinal measurement invariance of the FOS-R Part A. This is particularly important given the impetus for the creation of the FOS-R, which was to assess the impact of early intervention programs on family outcomes. The current study demonstrates that it is valid to compare scores on the FOS-R Part A to measure change on family outcomes over the period of approximately 1 year, with the caveat of differences in the meaning of scores on Item 8.
Footnotes
Declaration of Conflicting Interests
The author(s) declared no potential conflicts of interest with respect to the research, authorship, and/or publication of this article.
Funding
Data used in this article are from a study funded by a grant from the Ministry of Social and Family Development, Singapore entitled EIPIC Impact Study.