
Abstract
Parkinson's disease (PD) is a complex progressive neurodegenerative disorder involving hallmarks such as
Keywords
Introduction
Parkinson’s disease (PD) is the second most common neurodegenerative disorder,
1
typically characterized by severe dopaminergic dysfunction, motor deficits, cognitive decline, and ultimately by severe disability. The etiology of PD is complex, involving an interplay between genetic, molecular, and environmental factors.
2
In PD,
Apart from these motor-related effects, PD also involves considerable sensory deficiencies. A reduced or lost sense of smell
16
was proposed to start manifesting early – even years before clinical motor signs.
17
To a lesser extent, visual impairments have also been described,
18
including visual hallucinations, decrease in visual acuity, eye tremor movement, or visual processing speeds.
19
Neuroimaging studies have found decreased metabolic consumption in some sensory areas,
20
but whether these are due to decreased activity or due to e.g. brain atrophy or blood flow decreases still remain to be elucidated. Interestingly, animal models of PD,
21
which allow for investigating the underlying mechanisms more directly and have mainly focused on motor and dopaminergic effects, have been able to recapitulate visual
22
and (separately) olfactory
23
deficits, mainly behaviorally.
23
In a toxic PD rodent model
24
where predominantly dopaminergic areas are injured, neural activity in visual areas such as Superior Colliculus were found to be enhanced upon visual stimulation,
25
while in a local expression model of
αSyn transgenic models are playing an increasingly important role for understanding PD and sensory/motor effects. For instance, Zhang et al. (2015) 31 reported deficits in odor discrimination and detection in Prp-A53T-αSyn mice at 6 months old. Similarly, Petit et al. (2013) 32 reported age-dependent olfactory deficits in F28 mice overexpressing human wildtype αSyn. The αSyn BAC transgenic mice exhibited olfactory bulb pathology and related behavioral deficits by 5 months of age, 33 underscoring that olfactory dysfunction typically emerges during the early stages of disease progression in these models. Visual impairments in αSyn transgenic mouse models were also noted, for instance with the overexpression of human wild-type α-Synuclein in the retina which has been shown to lead to early loss of dopaminergic amacrine cells, resulting in decreased visual acuity and altered electroretinography responses. 34 Similarly, the Plp-α-Syn mouse model exhibits human α-Synuclein accumulation in retinal neurons, particularly rod bipolar cells, leading to mild functional alterations under low-light conditions. 35 Furthermore, A53T αSyn overexpressing mice demonstrate reduced light-adapted ERG responses and outer retinal thinning correlating with elevated α-Synuclein levels. 36 These findings suggest that visual deficits can manifest in αSyn transgenic models, potentially preceding or coinciding with motor symptoms. On the other hand, motor symptoms show greater variability depending on the specific αSyn transgenic model. In A53T αSyn mice, motor deficits such as bradykinesia and ataxia appear around 8–10 months of age, with progressive worsening. 37 In contrast, other models, such as Line 61 mice, exhibit severe motor impairments as early as 1 month of age. 38 These differences highlight the importance of model-specific considerations when interpreting motor dysfunction.
Functional MRI (fMRI)39,40 interrogates brain-wide activity in small rodents,
41
completely noninvasively and with good spatiotemporal resolution, leading to deep insights into network-level function.40,42 In lesion-based models of PD, resting-state fMRI has shown increased functional connectivity in nigrostriatal pathways, which also extended to sensory cortices,43–45 suggesting higher baseline stimulation.
46
In an
Given the importance of
Subjects and methods
All animal experiments were pre-approved by the competent institutional and national authorities , namely, the Champalimaud Animal Welfare Body and the Portuguese Direção-Geral de Alimentação e Veterinária, and were carried out according to European Directive 2010/63 and ARRIVE guidelines.
Mouse line
The
MRI setup
All MRI scans were performed on a 9.4 T Bruker BioSpec scanner (Bruker BioSpin, Karlsruhe, Germany) equipped with an 86 mm volume coil for transmittance and a 4-element array cryogenic coil (Bruker BioSpin, Fallanden, Switzerland) for reception, a gradient system capable of producing up to 660 mT/m isotropically, and running ParaVision 6.0.1 software (Bruker Biospin, Ettlingen, Germany).
fMRI experiments
Animal preparation
Anesthesia was induced with 5% isoflurane (Vetflurane®, Virbac, France) mixed with oxygen-enriched (28%) medical air. Mice were weighed, moved to an MRI compatible bed (Bruker Biospin, Germany) equipped with odor/visual stimulation capacity (Figure 1) and isoflurane was reduced to 2–3%. The mouse head was secured with ear and bite bars, and eye drops (Bepanthen® Eye Drops, Bayer AG, Germany) were applied. About 6 min after isoflurane induction, animals were sedated with medetomidine s.c. (0.4 mg/kg initial bolus and 0.8 mg/kg/h continuous infusion). Isoflurane was gradually discontinued along the first 15 min of the experiment, allowing a smooth transition between isoflurane anesthesia and medetomidine sedation.
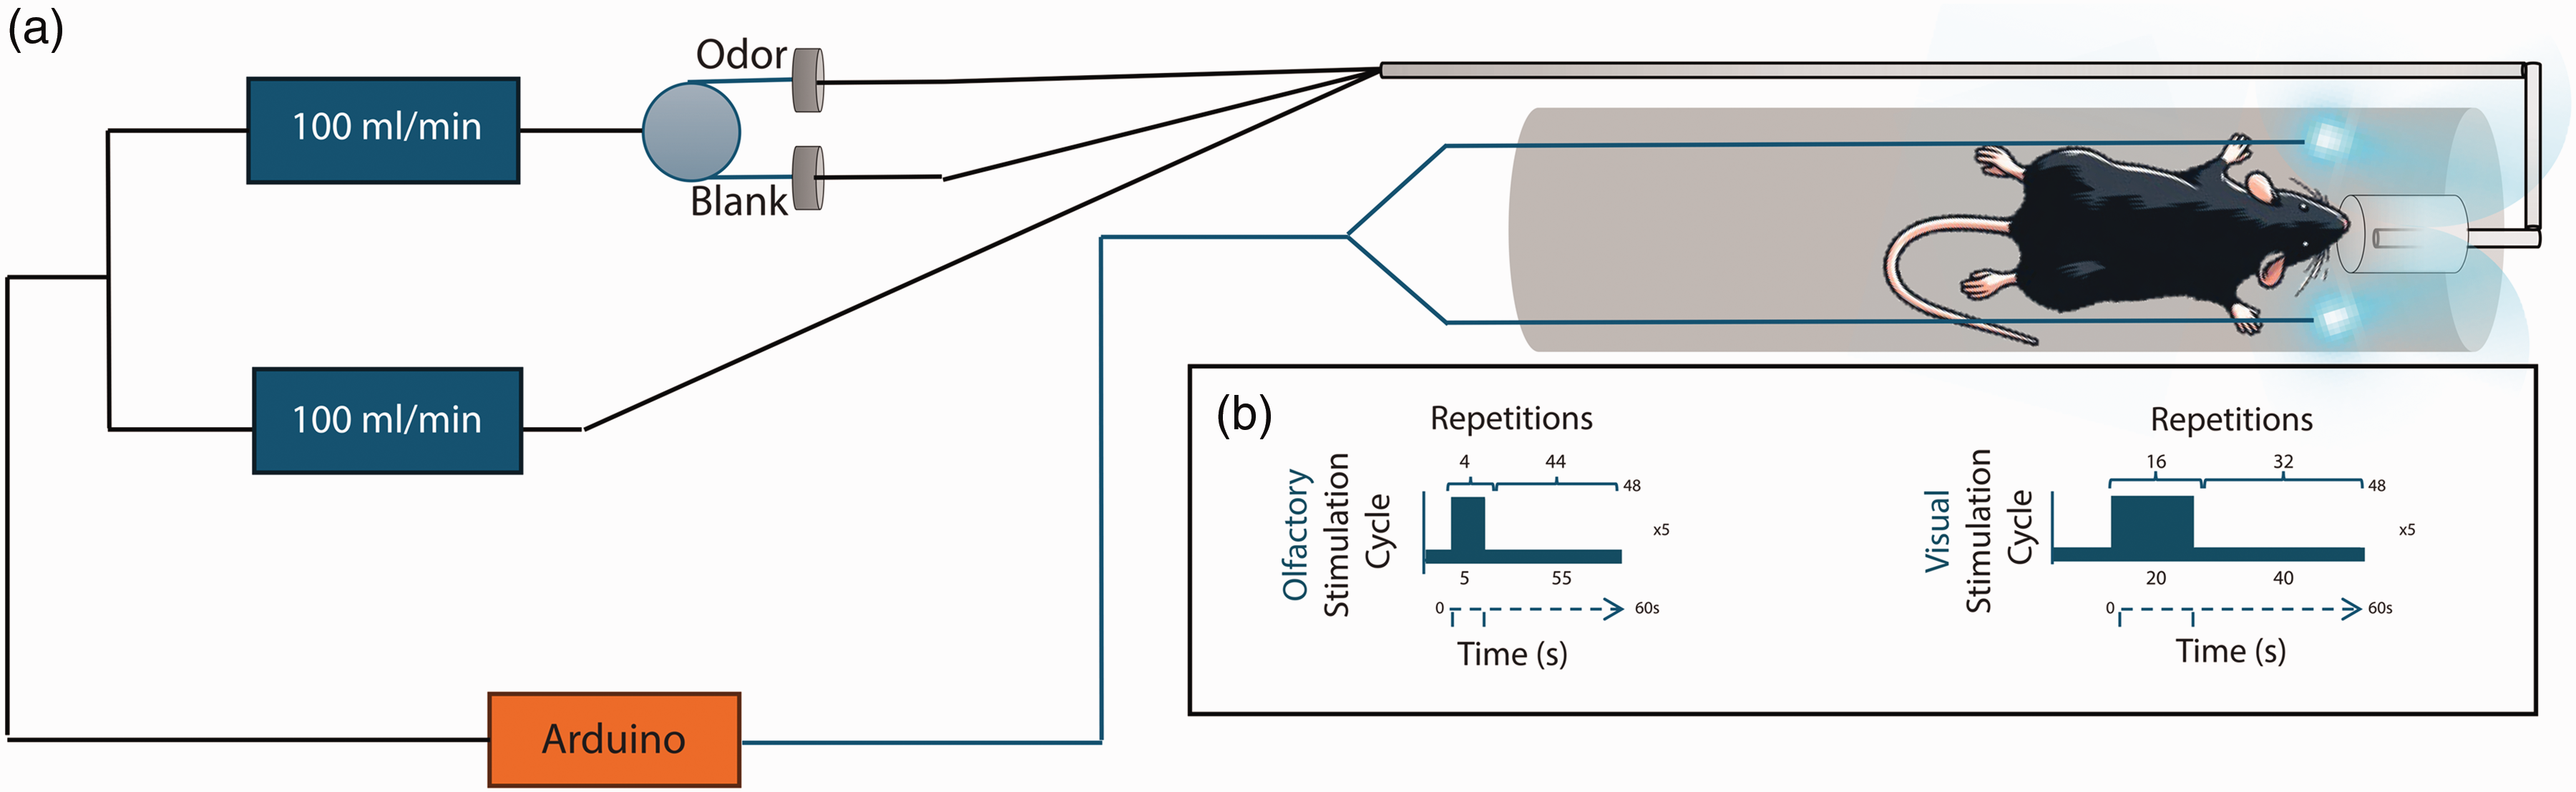
Experimental setup for fMRI experiments. (a) The odor delivery setup uses an olfactometer to deliver odors directly to the mouse nose. Two blue LEDs placed on each side of the head deliver binocular visual stimuli and (b) The fMRI paradigms used for each type of stimulation. The systems are controlled via an Arduino controller and are TTL’ed by the MRI scanner to ensure correct presentation of stimuli.
Rectal temperature and respiration rate were continuously monitored (SA Instruments, Inc., USA) and remained stable throughout the sessions. A warm water recirculating pad was used for body temperature control. At the end of experiments, an s.c. injection of 2 mg/kg atipamezole was administered to all animals to reverse medetomidine effects. All animals visibly recovered in ∼10 min.
Visual stimulation
The two ends of a two-branching optic fiber coupled to a blue LED (λ = 470 nm) were placed at ∼5 mm from the animals’ eyes for binocular stimulation flashing at 1 Hz frequency with a pulse width of 10 ms. 64 The fMRI design consisted of five blocks of 40/20 s of rest/stimulation, respectively, followed by a rest period of 40 s, and was repeated 1–3 times per animal.
Olfactory stimulation
Mice were stimulated using a specialized odor delivery setup 65 (Figure 1) providing Amyl acetate diluted 1:10 in mineral oil for odor stimulation. The fMRI paradigm was composed of five blocks of 55 s of rest followed by 5 s of continuous olfactory stimulation, ending with 55 s of rest, and was repeated 1–7 times per animal.
MRI acquisitions
After initial adjustments and localizer scans, two T2-weighted Turbo RARE sequences were acquired in the coronal and sagittal planes for accurate anatomical referencing (TR/TE = 2500/33 ms, FOV =25 × 25 mm2 (coronal) or 20 × 20 mm2 (sagittal), in-plane resolution = 98 × 98 µm2, RARE factor = 8, slice thickness = 0.7 mm, slice gap = 0.3 mm, number of slices = 14 (coronal) or 11 (sagittal), tacq=2 min 40 s (coronal) or 2 min 5 s (sagittal)).
All fMRI acquisitions began at least 40 min after isoflurane induction to ensure sufficient anesthetic washout. A multislice GE-EPI sequence with the following parameters was used for fMRI scans: for visual stimulation experiments, TR/TE = 1250/12 ms, flip angle = 75°, FOV = 15 × 12 mm2, in-plane resolution = 150 × 150 μm2, partial Fourier factor in the PE direction = 0.77 (acceleration factor = 1.3), slice thickness = 0.45 mm, slice gap = 0.1 mm, number of slices = 14 slices, repetitions = 272, tacq = 5 min 40 s, dummy scans = 216 (to ensure gradient temperature stabilization); and for olfactory stimulation experiments, TR/TE = 1250/12 ms, flip angle = 75°, FOV =16 × 12 mm2, in-plane resolution = 200 × 200 μm2, partial Fourier factor in the PE direction = 0.77, slice thickness = 0.45 mm, slice gap = 0.1 mm, number of slices = 10 slices, repetitions = 284, tacq = 5 min 55 s, dummy scans = 172.
Data analysis
All datasets were analyzed in MATLAB® (MathWorks, USA) using custom written code calling SPM12 functions. Functional data were first outlier corrected slicewise by manually selecting time points whose average brain signal deviated ∼2–3 SD from its 2nd order polynomial trend, and estimating new voxel values at those time points using piecewise cubic interpolation from the signal at the adjacent time points. Only <0.08% of datapoints/scan were identified as outliers and corrected. Images were then slice-timing and motion corrected, coregistered to their respective coronal anatomical scan, and normalized to the Allen Reference Atlas 66 in SPM12.
Voxelwise GLM analysis
Brain Oxygen Level Dependent signal (BOLD) mapping was analyzed in SPM12, using a general linear model (GLM) approach. Data were first smoothed with a 3 D isotropic Gaussian kernel (FWHM = 150 μm if visual fMRI or 200 μm if olfactory fMRI in all directions). For both visual and olfactory fMRI data, the experimental regressor of the design matrix was obtained by convolution of the respective stimulation paradigm with a double gamma HRF so that the expected BOLD response would peak at 3 s after stimulus onset. Motion correction parameters were used as nuisance regressors. For visual fMRI data only, the global brain signal was used as an extra nuisance regressor 67 due to brain-wide fluctuations in some scans. A high-pass filter with a 120 s cutoff was incorporated into the GLM to correct for slow signal drifts. A fixed-effects group analysis was run independently for each group and for the difference between both groups. Resulting t-value maps were thresholded with p < 0.001 (when analyzing each group) or p < 0.01 (when analyzing the difference between groups) and a minimum cluster size of 10 voxels and were cluster-FDR corrected at p < 0.01.
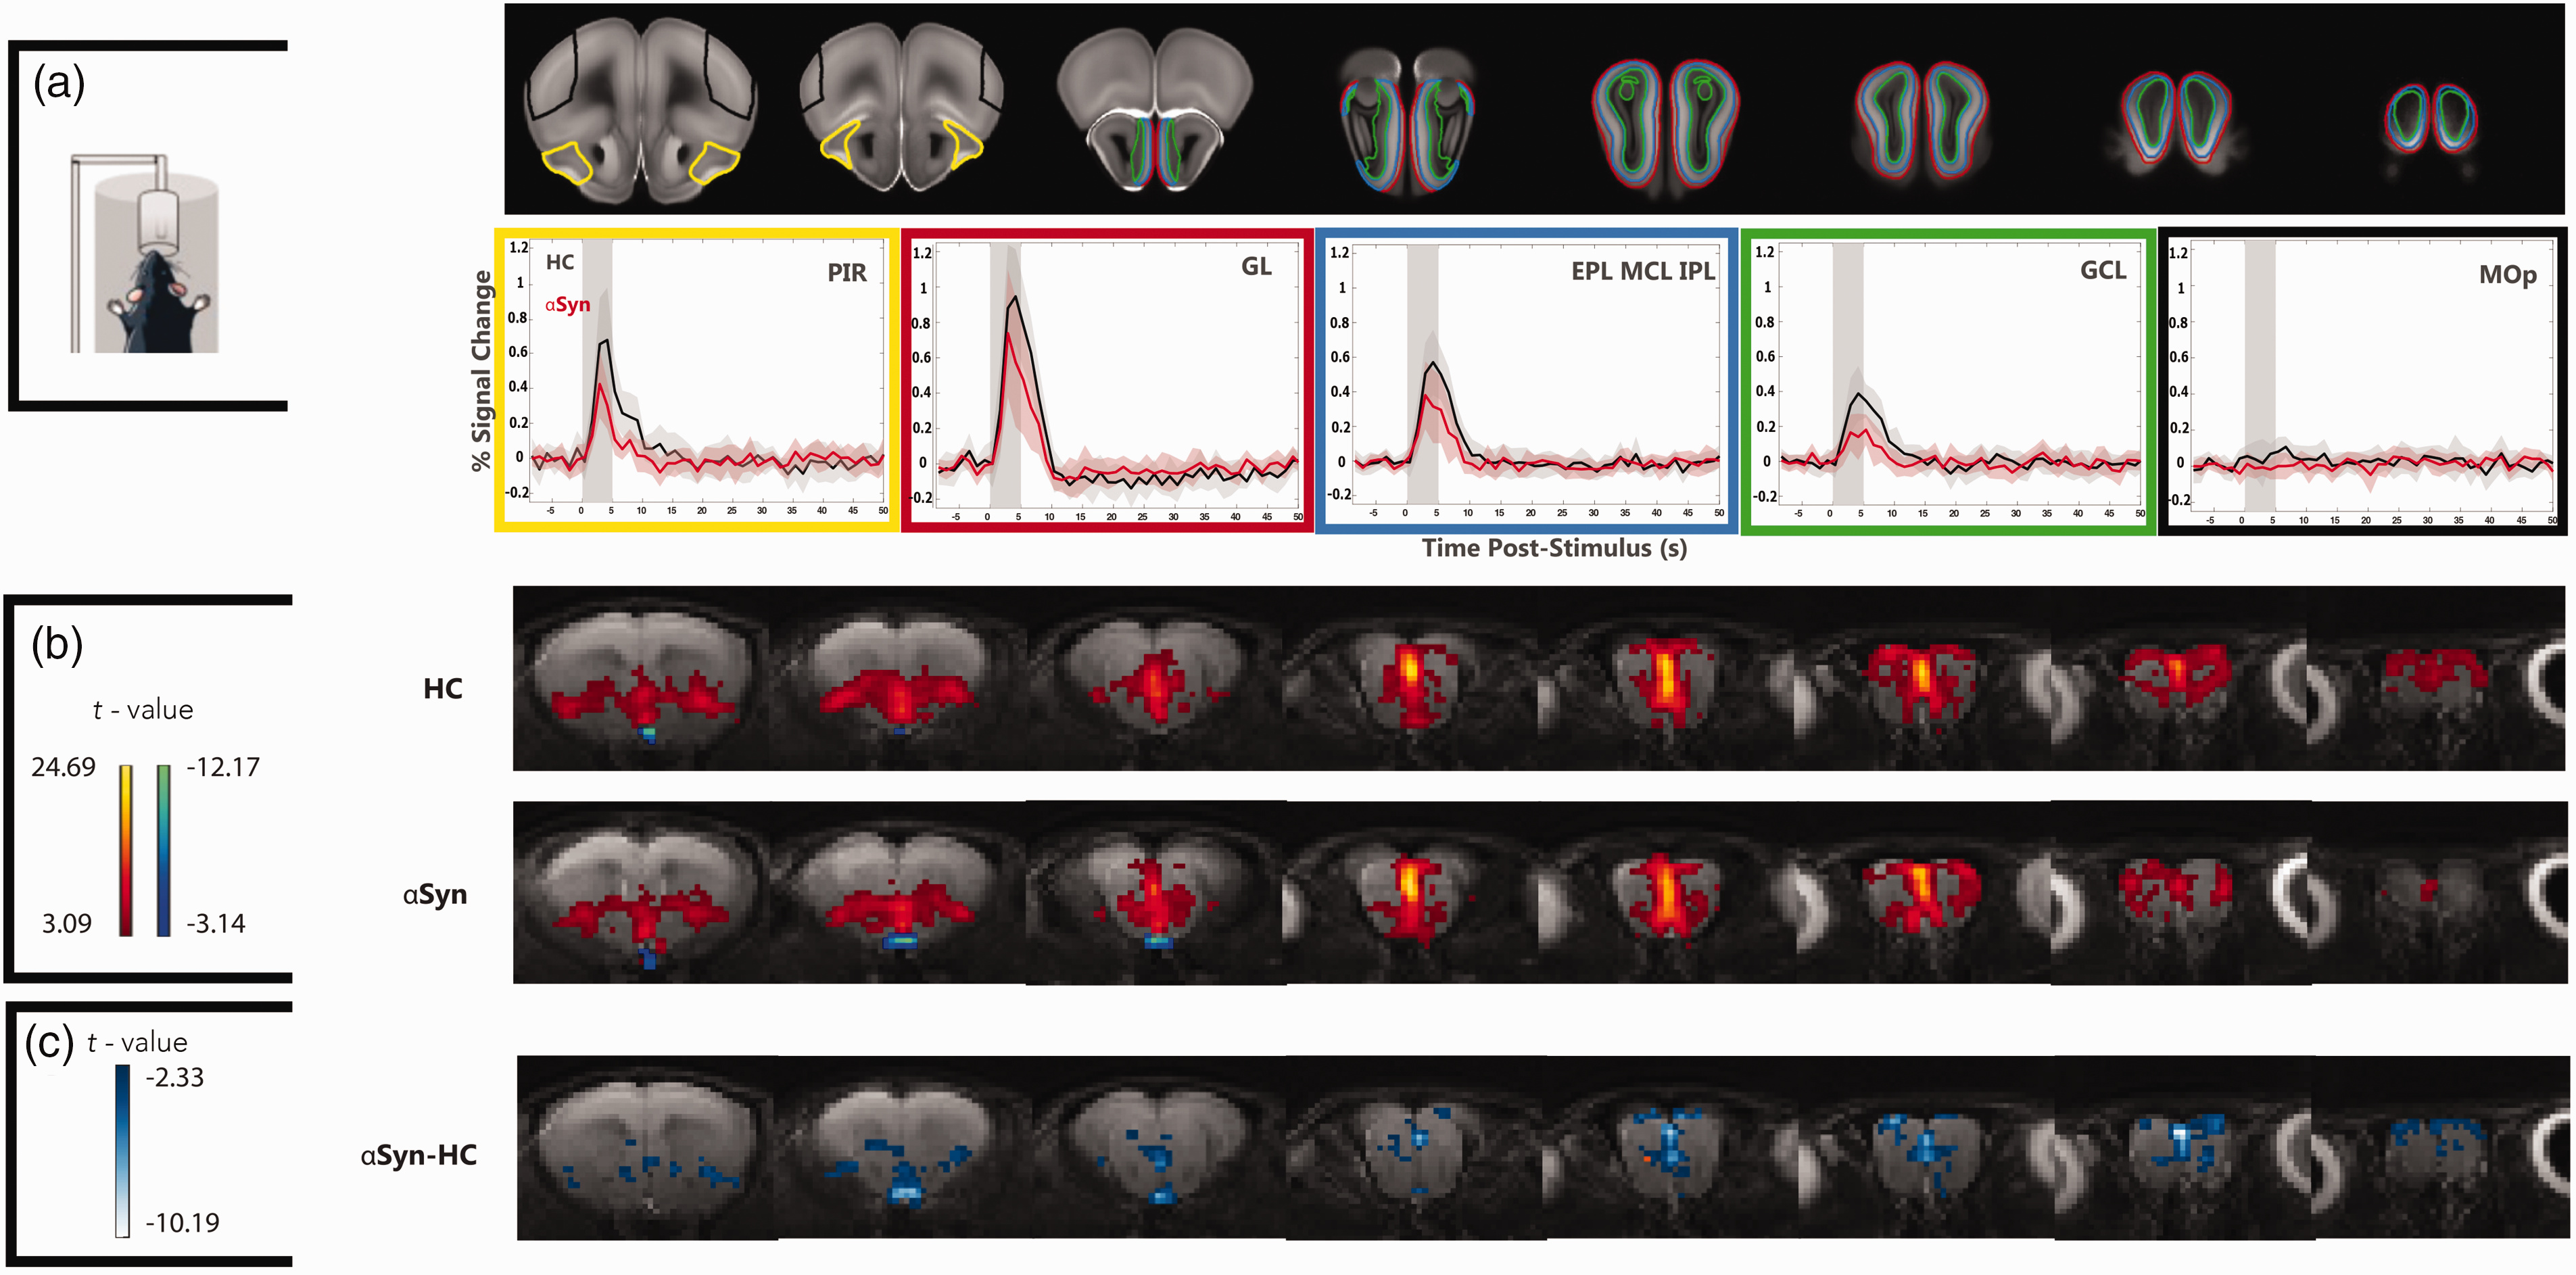
ROI analysis
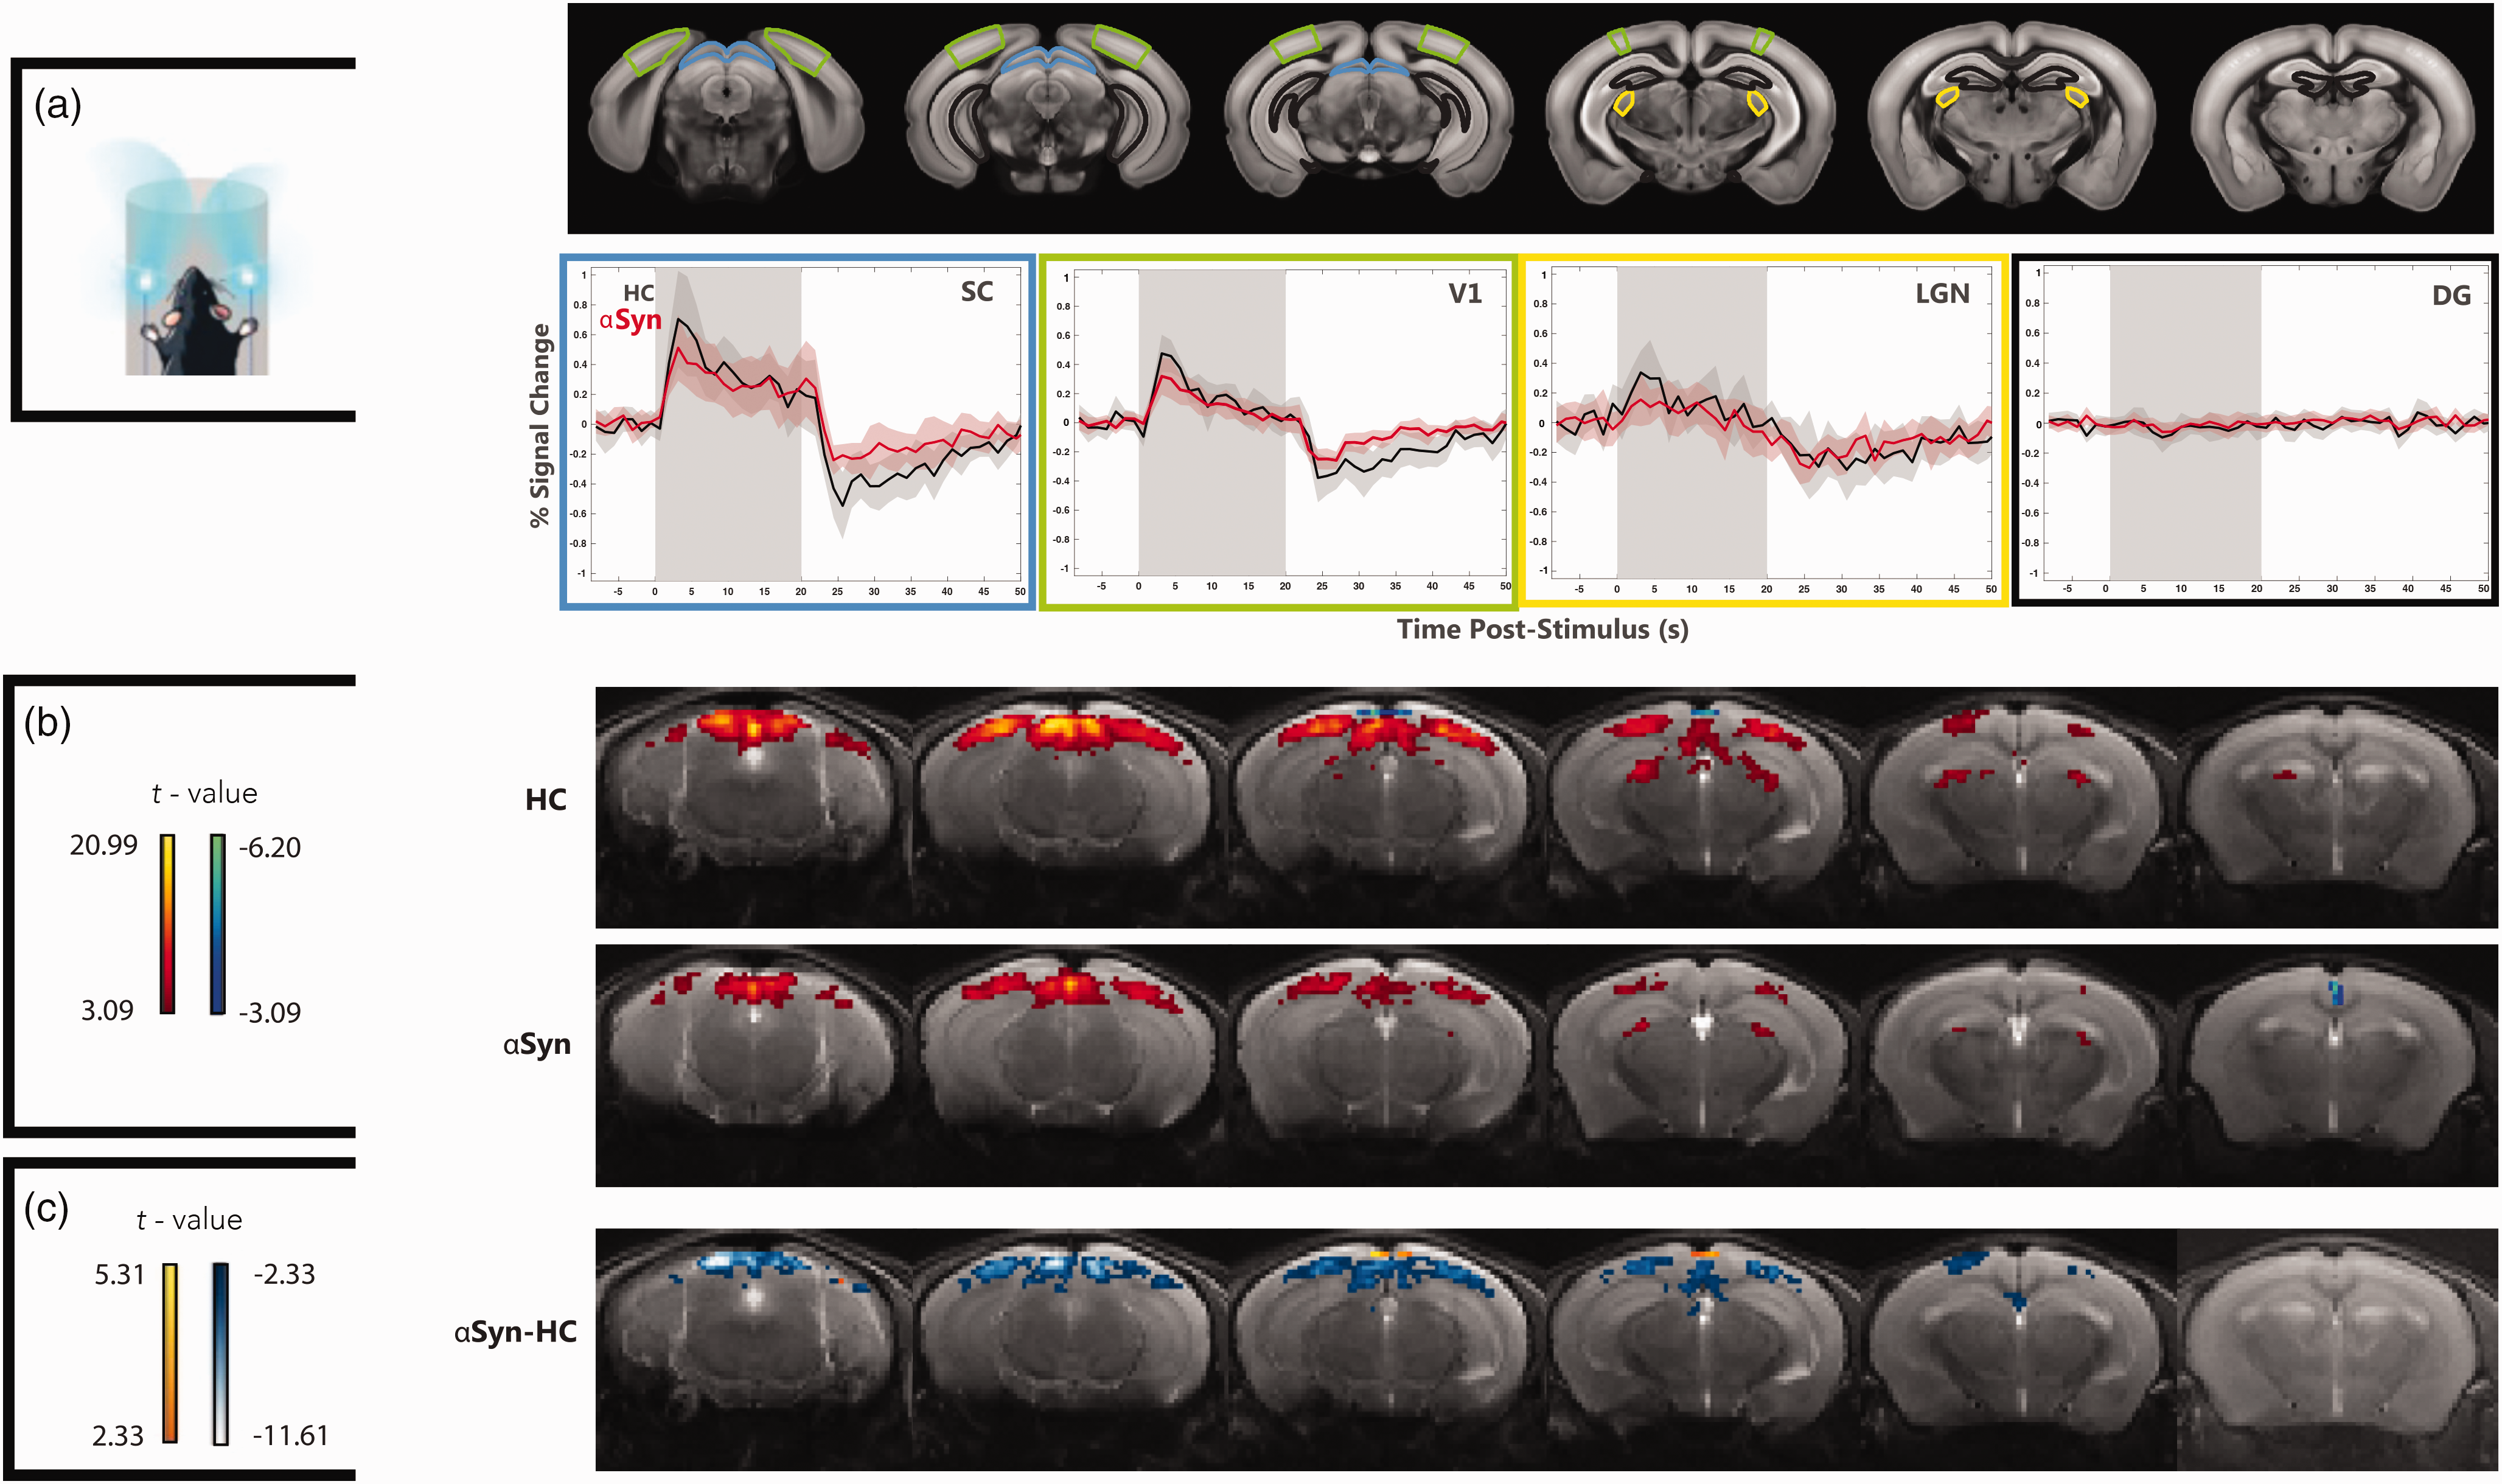
For visual fMRI data, signals were extracted from four anatomical bilateral ROIs obtained from the Allen Reference Atlas 68 corresponding to different visual pathway structures, namely the superior colliculus (SC), primary visual cortex (V1) and dorsal part of the lateral geniculate nucleus (LGN), and to a control region, the dentate gyrus (DG); data were then averaged for each ROI. For olfactory fMRI data, signals were also extracted and averaged inside the ROI for some olfactory pathway structures like the piriform cortex (PIR) and for a control region, the primary motor cortex (MOp). The main olfactory bulb (MOB) was also divided into three different layers that approximately covered, respectively, the glomerular layer (GL), the external plexiform, mitral cell and internal plexiform layers (EPL_MCL_IPL), and the more internal granular cell layer (GCL). These were manually defined according to the Paxinos and Franklin’s atlas. 69 Each ROI time-course was then subjected to global signal regression (visual fMRI data only), detrended using a 2nd degree polynomial fit to the first resting period and last 10 s of the remaining resting periods to remove low frequency trends and converted to percentage signal change. Responses were then averaged across all animals in each group to obtain the average full time-course, or across all stimulation epochs and animals to obtain the average cycle, from which mean ± SD values were extracted and the 95% confidence interval (CI) calculated.
c-FOS experiments
Measurement of c-FOS levels
Mice were kept in darkness/silence for 24 h before the experiment and were prepared in the same way as fMRI experiments (i.e., with the same induction and sedation protocol) while still in darkness/silence. They were then placed in a mock MRI bed to mimic the scanner setup and were then exposed to identical visual or olfactory stimulation paradigms as during the fMRI experiments (5 cycles per animal). Fixation was performed at 90 min as recommended, 70 while the animal remained in darkness and under continuous medetomidine infusion.
Brain extraction and sample preparation for immunohistochemistry
Brain specimens were fixed via standard transcardial perfusion. Briefly, animals were injected i.p. with an overdose of Pentobarbital and the entire body and brain were perfused. 71 The brain was extracted from the skull, immersed in a 4% PFA solution for 24 h and washed in a PBS solution thereafter, for immediate brain slicing. Brain slices for microscopy were obtained using a Vibratome (Leica VT1000s, Germany) sectioning with a thickness of 0.05 mm in 10 different horizontal levels spanning the entire olfactory and visual regions.
The samples were then washed in PBS 1x concentrated and incubated in PBS 10%/Triton 0.3 (PBST) for 1 h. Subsequently, the slices were incubated with primary antibodies (Rabbit monoclonal recombinant IgG anti c-FOS) at a 1:4000 dilution in 10% bovine serum albumin (BSA) + 0.1% sodium azide + 0.3% PBST overnight. The samples were then washed again three times with PBS and incubated in 10% BSA in 0.3% PBST for 2 h, then incubated with the secondary antibodies (Goat Anti-Rabbit IgG H&L (Alexa Fluor® 488)) at a 1:1000 dilution in 10% BSA + 0.1% sodium azide + 0.3% PBST, for 2 h. Finally, the samples were washed in phosphate-buffer (PB) 0.1 M at least three times, and then mounted in SuperFrost slides and 120 μl of Mowiol containing 2.5% 1,4 diazobicyclo [2.2.2]-octane (DABCO, Sigma, D2522) and high resolution (#1.5) coverslips were added.
Microscopy and cell counting
Microscopy was performed using a ZEISS Axio Scan.Z1 (Zeiss, Germany) coupled to a CCD color camera (Hitachi 3, Oxford instruments, UK). Images were then processed with Stereo Investigator® (MBF Bioscience - VT, USA). 72 For animals that underwent visual stimulation, ROIs were selected in V1, SC, LGN, and the entorhinal cortex (EC) as a control area. For animals that underwent olfactory stimulation, ROIs were selected in the GL, EPL_MCL_IPL and GCL of the MOB, and EC served as a control area. Expression levels were extracted from these regions in both groups. Statistical analyses using a Shapiro-Wilk test were performed at a 5% significance level, confirming the normality of the data distributions. Consequently, t-tests were used to compare expression levels between groups. Cohen’s d measurements of effect size were also calculated, using Sawilowsky’s expansion for interpretation of these values.
ASL experiments
To assess perfusion differences between
CBF quantification
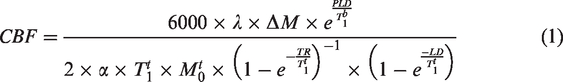
For CBF quantification, a T1 map was obtained from an inversion recovery spin-echo EPI sequence (TR/TE = 10000/19 ms; 18 inversion times (TI) between 30 and 10000 ms; tacq = 4 min). In addition, a pCASL encoded fast low angle shot (FLASH) sequence was used to estimate the inversion efficiency by acquiring the signal 3 mm above the labelling plane (TR/TE = 225/5.6 ms; slice thickness =1 mm, 2 averages, PLD = 0 ms, LD = 200 ms, tacq = 3 min 30 s). CBF maps (ml/100g/min)
75
were calculated pixel-by-pixel via equation (1):
Results
Disrupted BOLD-fMRI signals in the olfactory pathway of
Syn mice
Raw data from the fMRI EPI experiments in both pathways exhibited little susceptibility-induced distortions or motion artifacts (Video S1). tSNR maps showed a high tSNR of >30 in the relevant visual and olfactory areas (c.f. Figure S1 for tSNR maps from representative mice). Figure 2(a) presents BOLD-fMRI signals in ROIs placed along the olfactory pathway. Responses in the healthy control group were robustly observed, peaking ∼3 seconds after stimulus onset and decaying back to baseline around 10–15 seconds after the peak. The stimuli were stronger in the more external layers and weaker in the internal layers of the MOB. Note that in the control area, no such responses were observed, as expected. In the
Olfactory fMRI in human
Given the robust BOLD fMRI responses along the pathway, we turned to a more quantitative voxelwise analysis (Figure 2(b)). Upon olfactory stimulation, healthy controls exhibited robust activation in the entire olfactory pathway, reaching t-values of up to ∼23. The activation patterns of
BOLD-fMRI signals in the visual pathway of
Syn mice are also disrupted
To investigate whether sensory disruptions extend to other sensory modalities, we performed binocular visual stimulation experiments (Figure 3). The fMRI signals in ROIs placed along the visual pathway (Figure 3(a)) show robust signals in all cortical and subcortical brain areas, while unrelated control areas (DG) exhibit no signals, as expected. A strong post-stimulus undershoot can be observed in SC and V1 for both groups. In the
Visual fMRI in
We then quantified the voxelwise responses in both groups (Figure 3(b)). In HCs, the visual stimulation elicited clear activity along the visual pathway, while in the
c-FOS levels reveal neural contributions to the weaker fMRI signals in
Syn mice
Given the complexity of neurovascular couplings,
78
we probed the neural contributions to the observed fMRI deficits using c-FOS experiments (Figure 4(a)). Microscopy in a representative slice of the MOB (HC (left) and
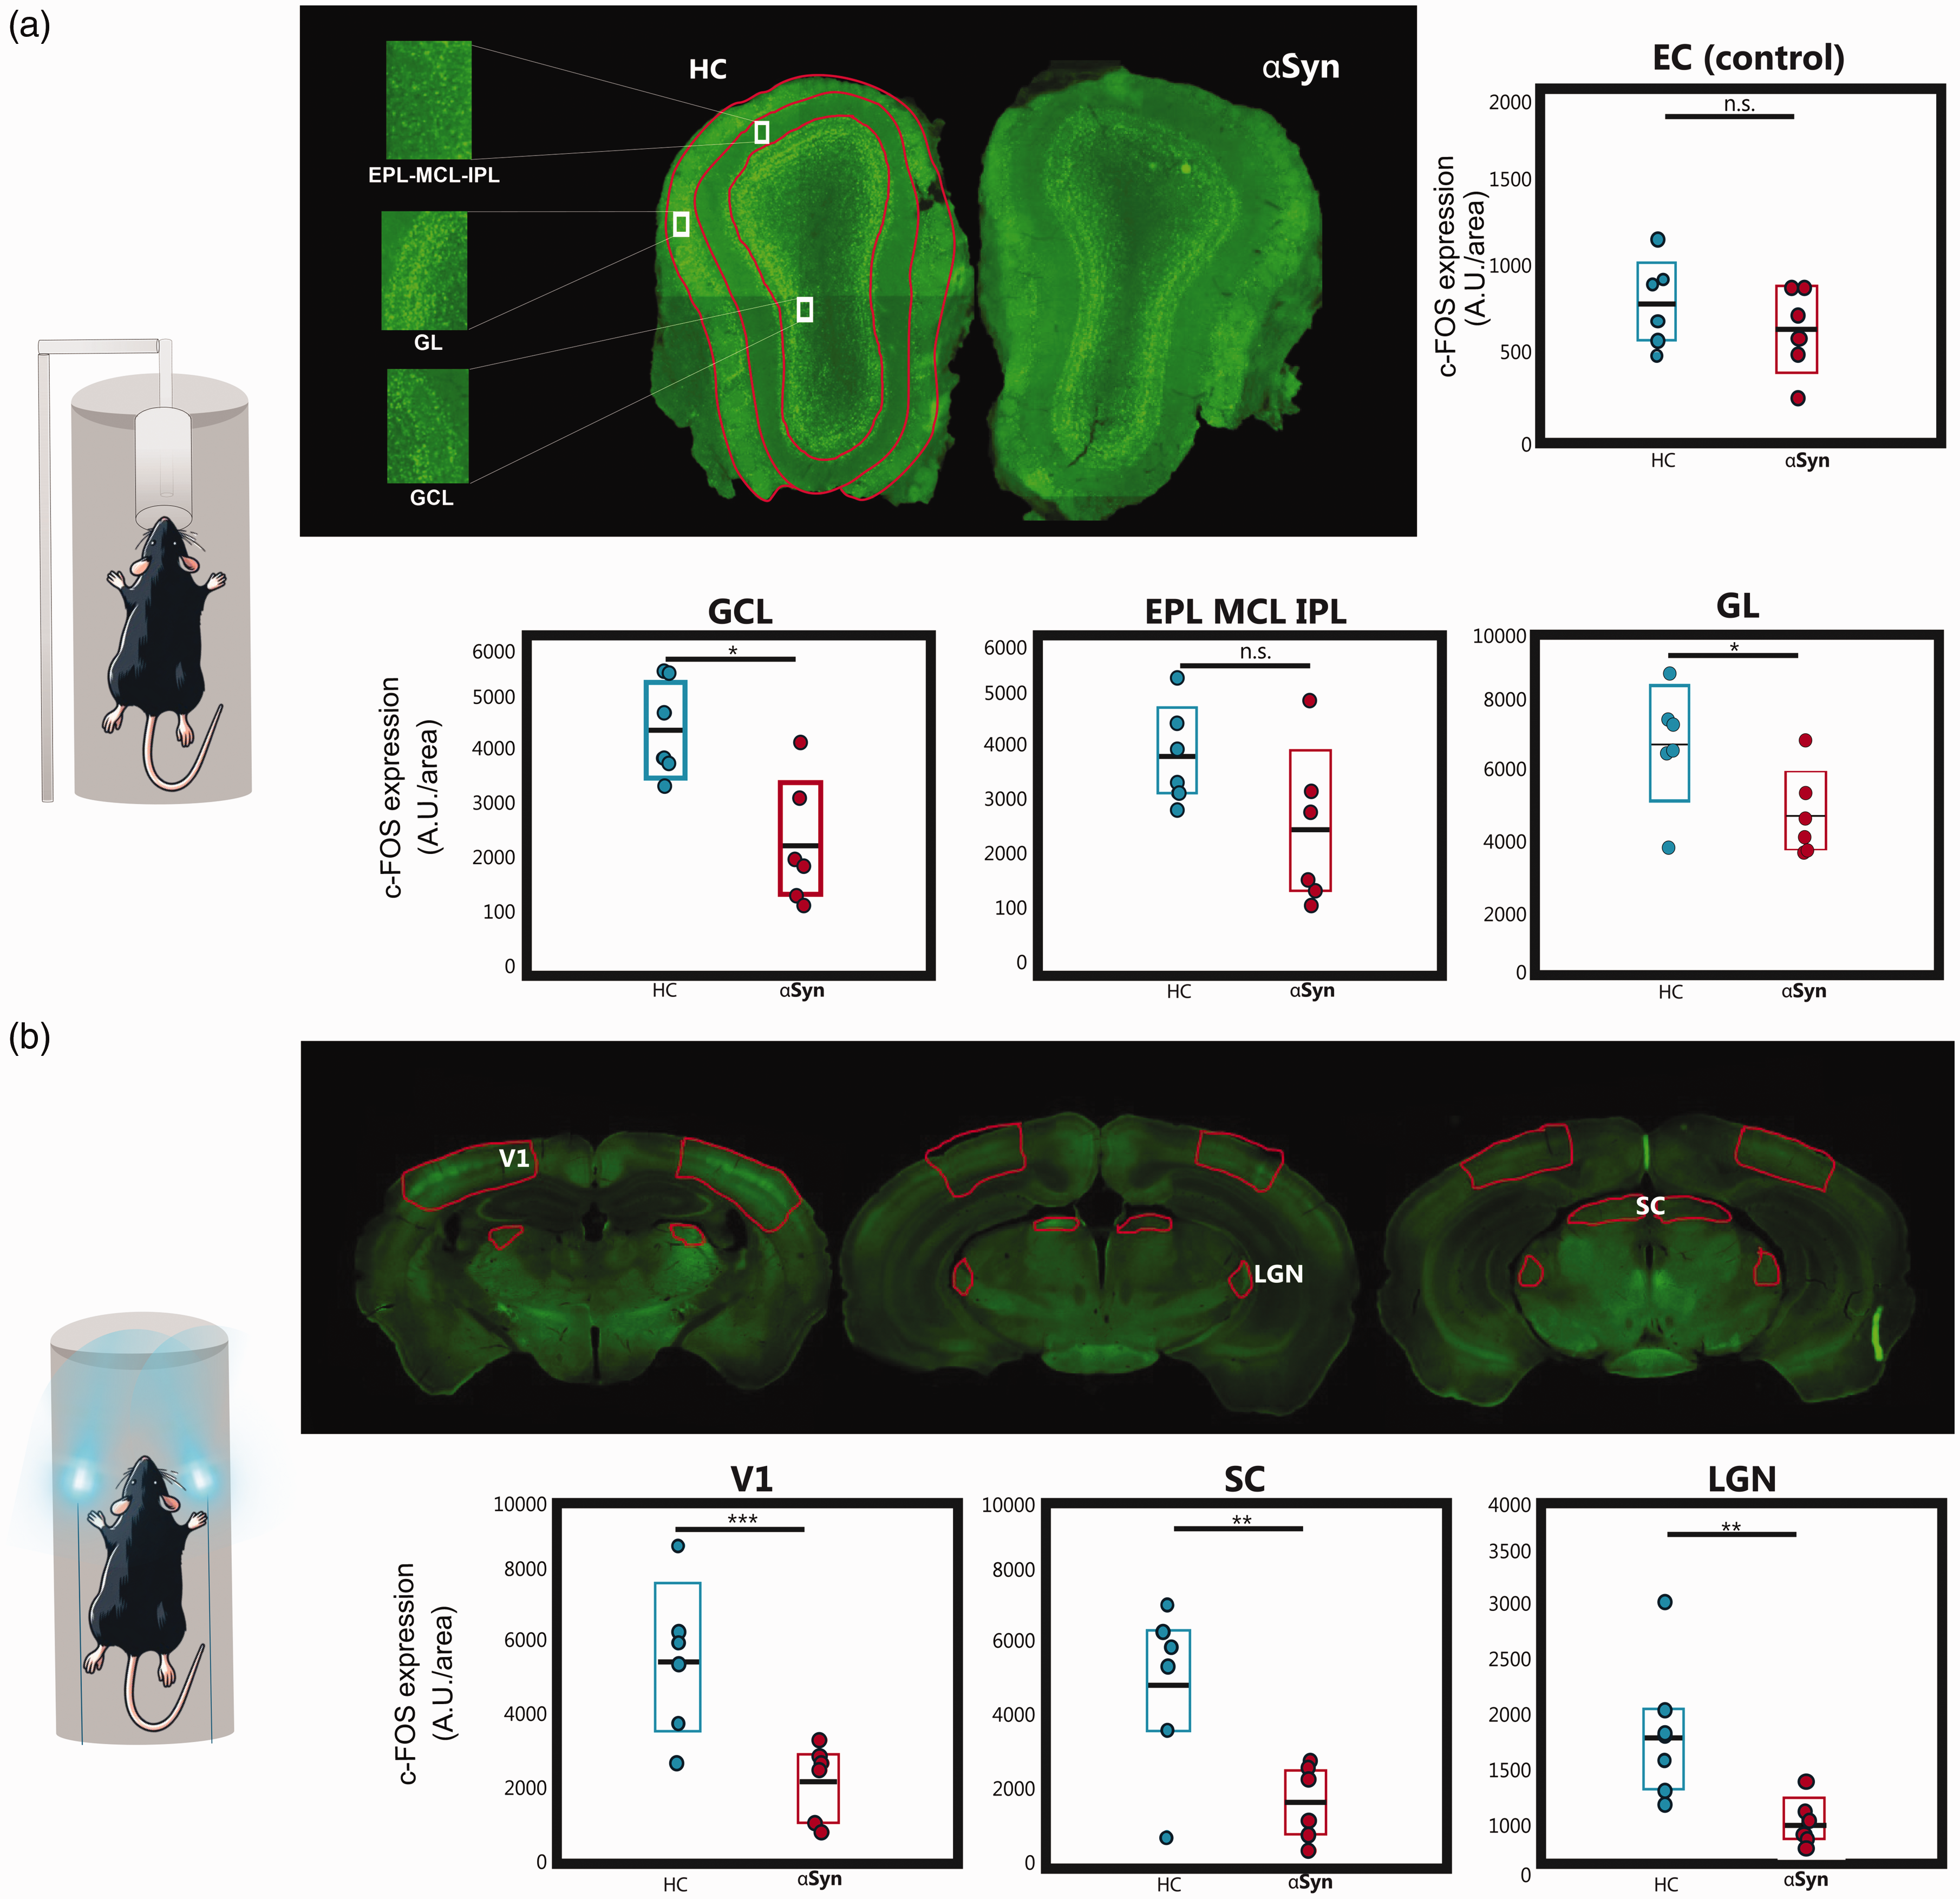
c-FOS levels. (a) Histological slices of the c-FOS levels in the MOB, and the analyzed ROIs (highlighted in red). Good expression levels were observed for both groups. ROIs were chosen anatomically (when needed, encompassing multiple slices for quantification) for N = 6 animals per group. Analysis of c-FOS protein levels in each ROI using a t-test (*p < 0.05, **p < 0.01, and ***p < 0.005). Colored bars indicate the 95% CI and the black horizontal line the mean. Statistically significant reductions in c-FOS levels after olfactory stimulation were observed in GL and GCL but not in the EPL_MCL_IPL and in the control (unrelated) area, the entorhinal cortex (EC). Effect size estimates were d = 1.449 in the GCL, d = 1.265 in the EPL_MCL_IPL and d = 1.3661 in the GL, indicating a very large effect size; and d = 0.623 in the EC (medium effect size) and (b) Same as (a) but for relevant slices of the visual pathway. Statistically significant reductions in c-FOS levels after visual stimulation were observed for the
We then performed the same experiments along the visual pathway, following visual stimulation (Figure 4(b)). Robust c-FOS staining along the visual pathway is clearly observed. When quantified, c-FOS levels in the αSyn group were significantly reduced when compared to the HC in V1, SC, and LGN areas by up to ∼70% (p < 0.01), while a control region showed, as expected, no statistically significant differences between the groups.
CBF measurements reveal vascular deficits in
Syn mice
To probe potential vascular effects, we mapped brain-wide CBF using pCASL measurements (Figure 5). Individual maps are shown in Figure 5(a), revealing relatively good agreement between different animals of each group. Upon averaging the individual CBF maps, the group maps clearly demonstrated lower perfusion in the αSyn group (Figure 5(b)). When quantified, the brain-wide CBF was ∼10% lower in the
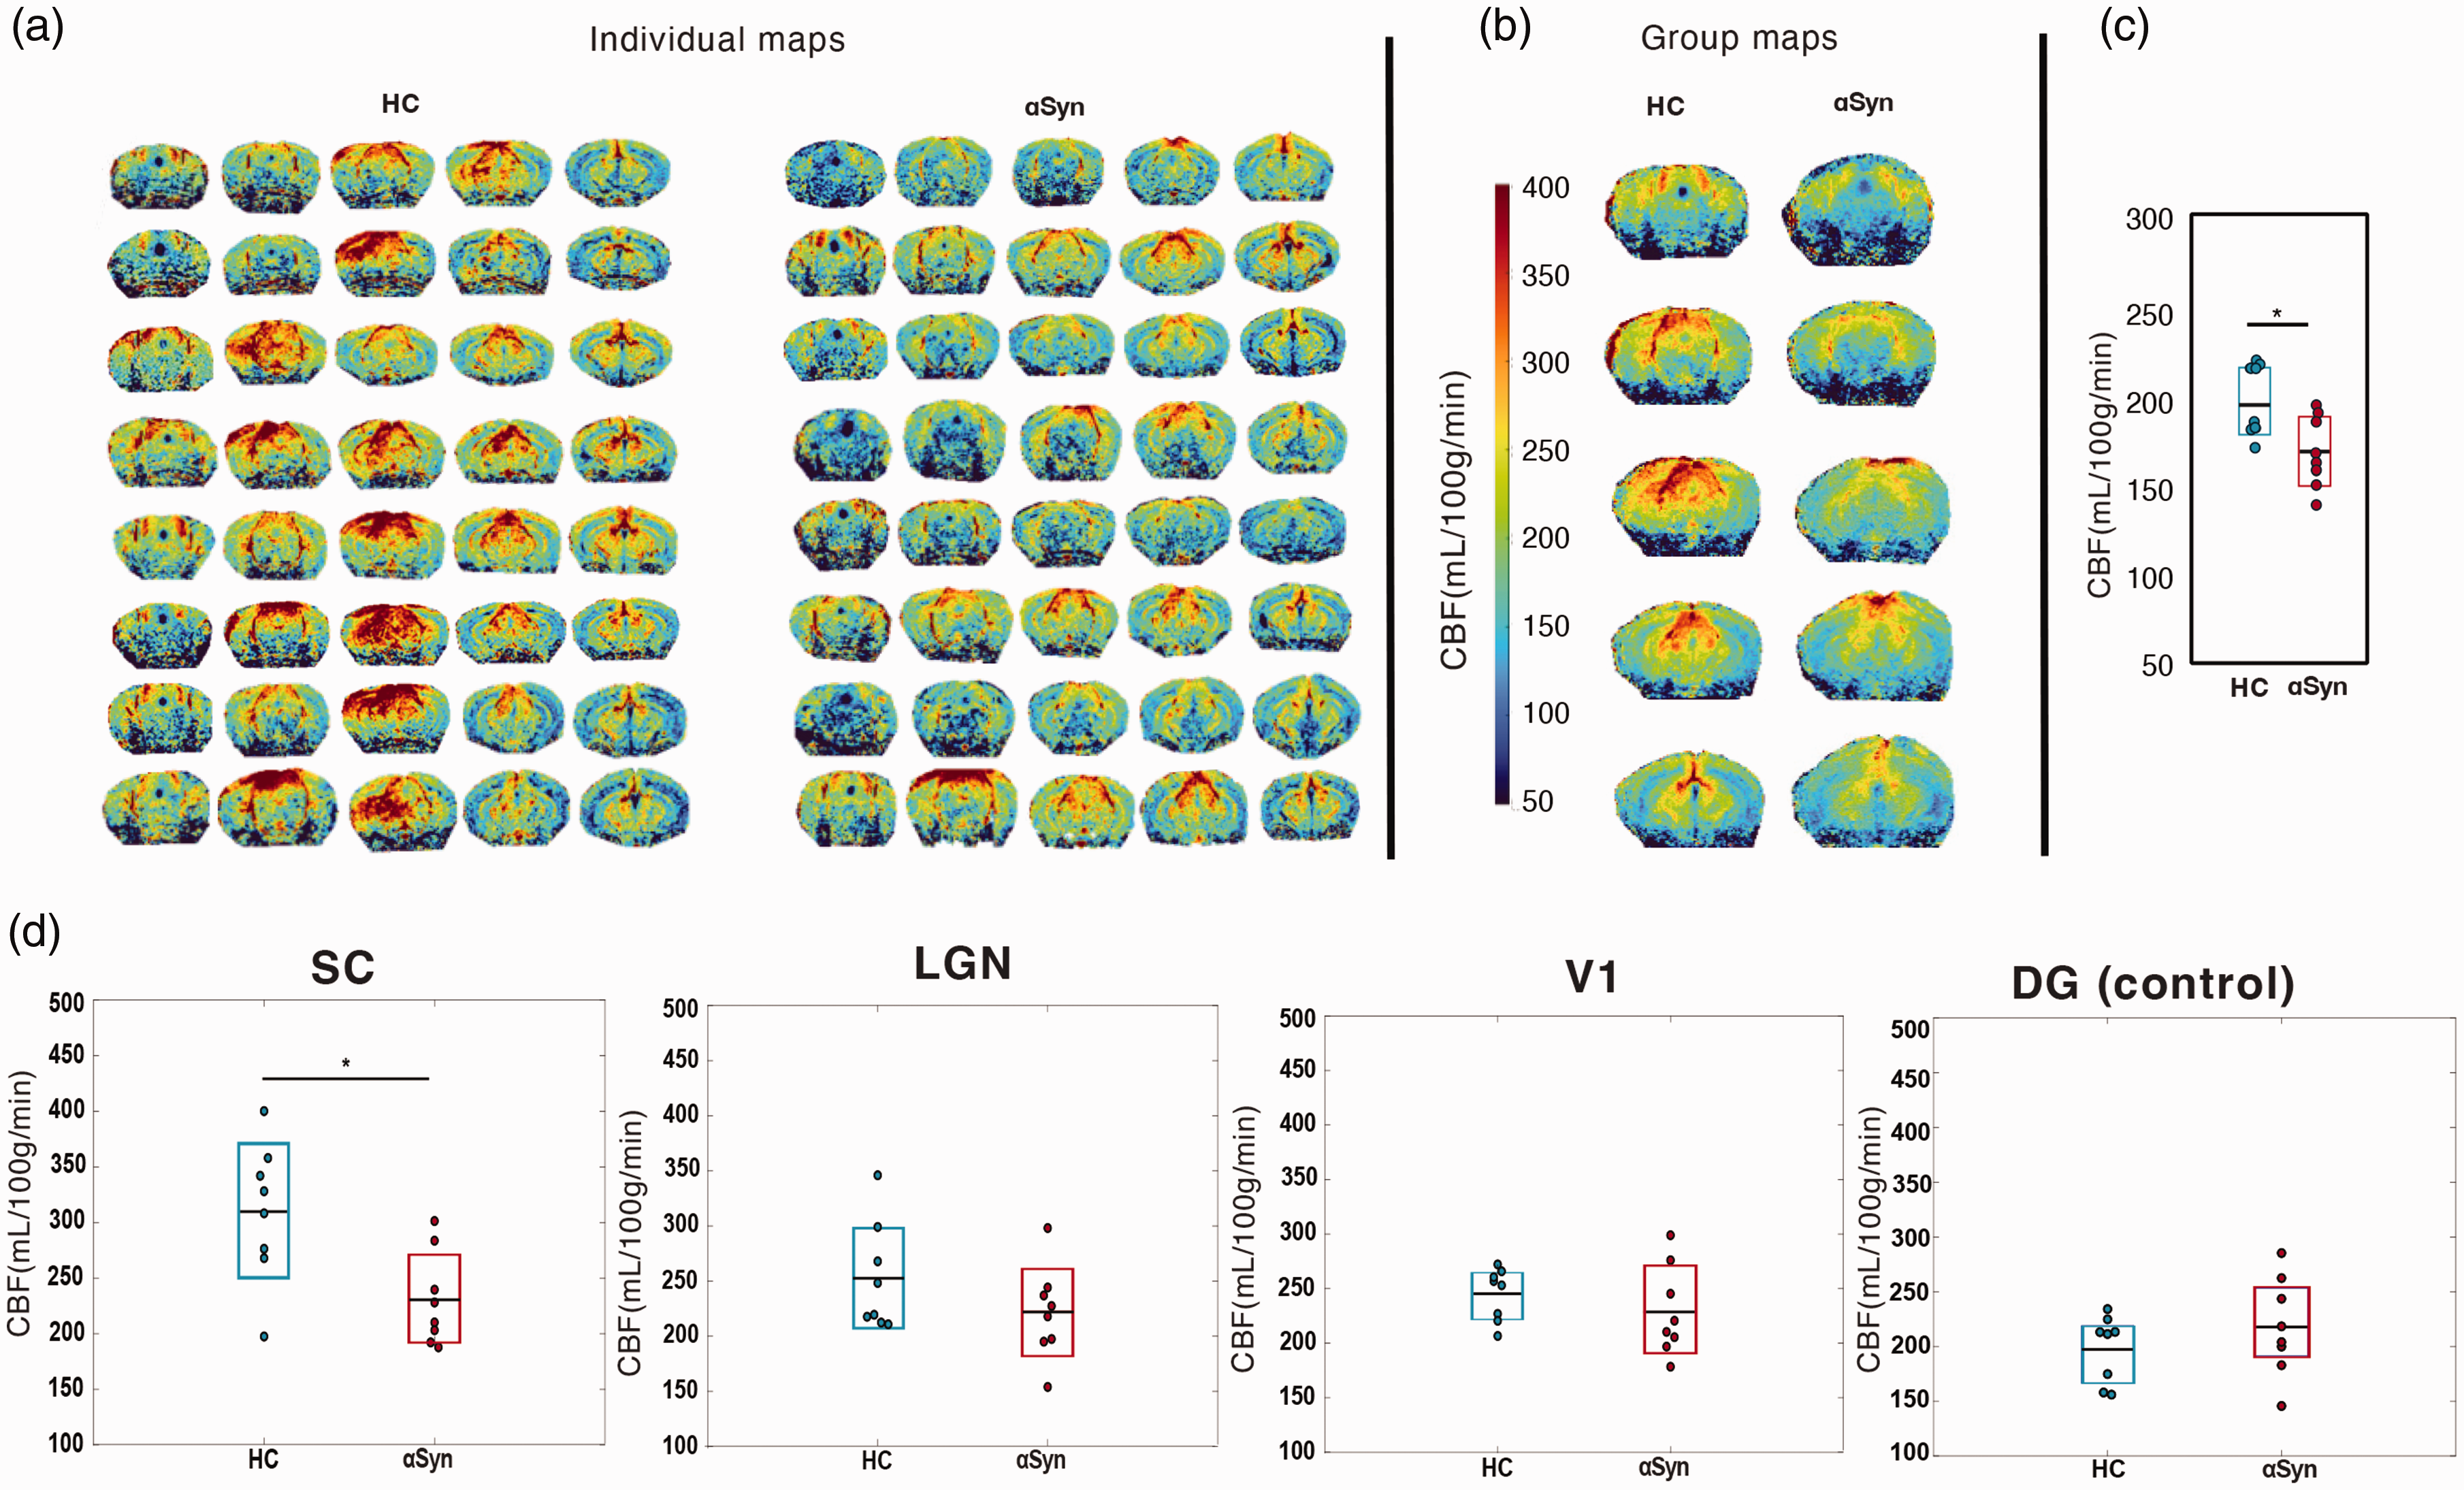
pCASL CBF maps. (a) Quantitative CBF maps for N = 8 HC and N = 8
Discussion
Dopaminergic dysfunction and death, alongside with αSyn aggregation in the brain, 79 are established pathological alterations in PD leading to progressive motor symptoms and cognitive decline.15,80 Interestingly, olfactory and visual sensory deficits have been reported in PD patients, in some cases many years before the motor symptoms onset.16,18 Other sensory effects include increases in tactile and thermal sensitivity, decreases in mechanical pain perception, and reduction in epidermal nerve fibers. 81 PET and fMRI experiments suggest that lower brain metabolic activity in sensory areas, 82 but it has been difficult to pinpoint whether signaling deficiencies, 24 damage in sensory areas, 83 or associated changes in perfusion contribute to these effects. 84
Using a well-established human αSyn transgenic mouse model of PD-like Synucleinopathy,29,58,60 we assessed evoked activity in the brain’s sensory networks. Our multimodal approach included fMRI for interrogating entire pathways as well as c-FOS expression and CBF mapping for probing the neural and vascular components of fMRI signals, respectively, thereby providing an integrated view from a neurovascular perspective. Weaker fMRI signals were found in both olfactory and visual sensory networks in the
Most of the previous reports investigating the biological underpinnings in animal models of PD have mainly focused on the olfactory system. In an injected
In this study, we aimed to go beyond a single sensory system to uncover a potentially more generalized sensory dysfunction in the brain. Although visual symptoms are reported in PD patients,
18
they have been rather rarely investigated in the context of mouse models, especially at a network-level perspective. In a 6-OHDA rat model of dopaminergic cell loss
98
(without
Our findings indicate decreased neural activity coupled with decreased CBF upon evoked activity in the
Finally, we note in passing that in this study, significant differences at the whole brain volume level (Figure S2) were not observed here, while previous studies demonstrated that brain volume alterations in PD models can occur in region-specific and model-dependent ways. 108 The absence of whole-brain volume loss in our study aligns with findings in the 6-OHDA model, where no significant basal ganglia atrophy was observed. 109 Future investigations should explore region-specific volumetric analyses to determine whether αSyn accumulation preferentially affects certain brain structures before global atrophy becomes evident.
Limitations
As in every study, we identify several limitations of our work. First, we did not quantify
In addition, we cannot deconvolve whether the effects shown here originate from local circuit dysfunction, aberrant inputs from sensory organs, and/or more global dopaminergic (and/or other secondary modulatory effects) dysfunction 112 and its downstream impact. Other factors, such as mitochondrial dysfunction, 113 3,4-dihydroxyphenylacetaldehyde (DOPAL) toxicity, 114 and brain atrophy 49 can also contribute to sensory dysfunction. Tackling these questions will require more specific experiments, involving e.g. optogenetics, lesion studies, and invasive recordings. Still, previous experiments lesioning dopaminergic areas typically show a “disinhibiting” effect, 115 thereby resulting in enhanced activity at least in some cell types. The effects in this study were opposite, suggesting more local and/or input aberrations as the main contributors to the decreased activity observed.
From the experimental perspective, it is worth mentioning that the weight of our healthy controls at 9 months old was significantly higher than the
In the context of CBF mapping, we note that olfactory ROIs were not included in our pCASL experiments due to our initial study design, which prioritized whole-brain coverage with a focus on the visual system. Additionally, technical challenges in acquiring high-quality whole-brain pCASL images made it difficult to reliably assess CBF in the olfactory bulb. Future studies should aim to target more specifically the olfactory regions to further explore potential perfusion deficits in sensory systems commonly affected in PD.
Finally, we used only male mice for the PD group in this study, since in this PD genetic model, the males are hemizygous, 60 always expressing the PD phenotype while females only carry the mutation. This approach prevents confounding effects related to the absence of αSyn overexpression in female carriers, ensuring a more accurate assessment of the disease-related effects but may entail a bias towards male traits. While sex differences in PD models have been reported, 118 our study design aimed to minimize additional variability by maintaining a homogeneous sample. Nonetheless, future studies incorporating both male and female cohorts, using alternative genetic strategies, could provide further insights into potential sex-specific differences.
Conclusions
Our study reveals broad, network-level sensory deficits in fMRI signals upon evoked activity in the olfactory and visual pathways, occurring in tandem at 9 months of age in a human
Supplemental Material
sj-pdf-1-jcb-10.1177_0271678X251338952 - Supplemental material for Neural and vascular contributions to sensory impairments in a human alpha-synuclein transgenic mouse model of Parkinson’s disease
Supplemental material, sj-pdf-1-jcb-10.1177_0271678X251338952 for Neural and vascular contributions to sensory impairments in a human alpha-synuclein transgenic mouse model of Parkinson’s disease by Ruxanda Lungu, Francisca F Fernandes, Sara Pires Monteiro, Tiago F Outeiro and Noam Shemesh in Journal of Cerebral Blood Flow & Metabolism
Supplemental Material
sj-pdf-2-jcb-10.1177_0271678X251338952 - Supplemental material for Neural and vascular contributions to sensory impairments in a human alpha-synuclein transgenic mouse model of Parkinson’s disease
Supplemental material, sj-pdf-2-jcb-10.1177_0271678X251338952 for Neural and vascular contributions to sensory impairments in a human alpha-synuclein transgenic mouse model of Parkinson’s disease by Ruxanda Lungu, Francisca F Fernandes, Sara Pires Monteiro, Tiago F Outeiro and Noam Shemesh in Journal of Cerebral Blood Flow & Metabolism
Supplemental Material
sj-mp4-3-jcb-10.1177_0271678X251338952 - Supplemental material for Neural and vascular contributions to sensory impairments in a human alpha-synuclein transgenic mouse model of Parkinson’s disease
Supplemental material, sj-mp4-3-jcb-10.1177_0271678X251338952 for Neural and vascular contributions to sensory impairments in a human alpha-synuclein transgenic mouse model of Parkinson’s disease by Ruxanda Lungu, Francisca F Fernandes, Sara Pires Monteiro, Tiago F Outeiro and Noam Shemesh in Journal of Cerebral Blood Flow & Metabolism
Footnotes
Availability of data and materials
The authors confirm that the data supporting the findings of this study will be made available on a free repository. The code used to analyze the fMRI data analysis will be shared upon request.
Funding
The author(s) disclosed receipt of the following financial support for the research, authorship, and/or publication of this article: This study was funded in part by the Mantero Belard Award of Santa Casa da Misericórdia, P2053 - SCML-PRÉMIO MANTERO BELARD-MB-56-2020. The authors acknowledge the vivarium of the Champalimaud center for the Unknown, a facility of CONGENTO financed by Lisboa Regional Operational Programme (Lisboa 2020), project LISBOA01–0145-FEDER-022170, and the Champalimaud Histopathology and the Champalimaud ABBE Platforms.
Declaration of conflicting interests
The author(s) declared the following potential conflicts of interest with respect to the research, authorship, and/or publication of this article: NS serves on the Scientific Advisory Board of Bruker Biospin.
Authors’ contributions
RL, FF, SPM, TO and NS have made a substantial contribution to the concept and design, acquisition of data or analysis and interpretation of data, have been involved in drafting the article and revising it critically for important intellectual content and have approved the version to be published. RL and FF have contributed equally.
Supplemental material
Supplemental material for this article is available online.
References
Supplementary Material
Please find the following supplemental material available below.
For Open Access articles published under a Creative Commons License, all supplemental material carries the same license as the article it is associated with.
For non-Open Access articles published, all supplemental material carries a non-exclusive license, and permission requests for re-use of supplemental material or any part of supplemental material shall be sent directly to the copyright owner as specified in the copyright notice associated with the article.