
Abstract
Cerebrospinal fluid (CSF) transport along meningeal pathways contributes to brain fluid homeostasis and is thought to change with aging, yet quantitative, region-resolved measurements across lifespan remain limited. We hypothesized that meningeal CSF transport dynamics exhibit region-specific age associations rather than uniform decline. We applied non-contrast time-spatial labeling inversion pulse (Time-SLIP) MRI combined with a bi-component analytical model to characterize CSF transport dynamics in a healthy, activity-controlled cohort of 64 adults aged 19–86 years. Signal increase ratio time courses were decomposed into a fast Gaussian bulk-displacement and a slower Γ-variate perfusion-like component. Linear mixed-effects models were used to assess regional and age-related effects. Model fits were robust across all participants (R2 = 0.97). CSF transport metrics differed significantly across parasagittal dura subregions and the superior sagittal sinus. Age associations were heterogeneous: the perfusion-like component declined with age in upper parasagittal dura, increased in lower parasagittal regions, and remained relatively stable within the superior sagittal sinus. Additional timing and amplitude parameters exhibited region-specific age trajectories. These findings demonstrate regionally heterogeneous aging effects on meningeal CSF transport dynamics and suggest age-related redistribution rather than uniform decline, providing a noninvasive framework for assessing physiological remodeling of CSF transport with aging.
Introduction
Meningeal cerebrospinal fluid (CSF) transport and egress along dural pathways is increasingly recognized as an important contributor to brain waste clearance, complementing exchange along paravascular and glymphatic pathways that facilitate CSF–interstitial fluid (ISF) transport and removal of metabolic wastes.1–4 Impairment of these pathways has been associated with aging and may contribute to increased susceptibility to Alzheimer’s disease and other neurodegenerative disorders in older adults.2–4 These processes are increasingly viewed as part of an integrated neurofluid system, in which CSF, ISF, and vascular compartments interact to regulate solute transport and tissue homeostasis. Disruption of this system may therefore have widespread consequences for metabolic clearance, neuroinflammation, and protein aggregation in the aging brain. In the meningeal region, multiple anatomical structures are present, including the parasagittal dura adjacent to the superior sagittal sinus, arachnoid granulations, and meningeal lymphatic vessels (Figure 1). Despite the centrality of CSF egress-related transport to brain homeostasis, quantitative, region-specific assessment of meningeal CSF transport dynamics in humans has remained challenging. Historically, invasive imaging approaches such as radionuclide cisternography or intrathecal gadolinium have been required to visualize CSF movement,5–7 whereas noninvasive methods such as phase-contrast MRI primarily capture fast oscillatory flow driven by cardiac and respiratory pulsation in central CSF channels and provide limited information on slower, dispersion-like transport components.8,9 Diffusion MRI-based metrics offer indirect signatures of glymphatic activity10,11 but do not directly quantify meningeal CSF transport. As a result, existing noninvasive approaches provide only partial characterization of CSF dynamics and are poorly suited for probing slow, regionally heterogeneous CSF transport within meningeal compartments.

Schematic visualization of major anatomical components relevant to the meningeal region, including the skull (1), dura mater (2), parasagittal dura (3), superior sagittal sinus (4), arachnoid granulations (5), meningeal lymphatic vessels (6), subarachnoid space (7), gray matter (8), and white matter (9). The illustration is not to scale and is intended solely to indicate the relative anatomical organization of these structures rather than their precise spatial geometry.
Time-spatial labeling inversion pulse (Time-SLIP) MRI overcomes these limitations by allowing endogenous visualization of CSF movement without exogenous tracers.12–14 Recent applications of Time-SLIP have demonstrated detectable CSF motion within the parasagittal dura (PSD) and superior sagittal sinus (SSS), and have reported age associations and physiological modulation (e.g. exercise) in Time-SLIP-derived metrics.15,16 These findings highlight the parasagittal region as a key anatomical interface where CSF-labeled signal can be observed within meningeal compartments (Figure 1). However, prior analyses have largely treated the parasagittal region as a single unit, limiting insight into potential subregional differences. Interpretation of Time-SLIP signal dynamics is complex, reflecting a mixture of rapid bulk displacement and slower, more dispersed components. A single Γ-variate function has been previously proposed to model these dynamics.15,16 Neurofluids encompass blood, CSF, and ISF, which interact through coupled transport pathways that support solute movement and clearance. Diverse experimental and theoretical work on neurofluids suggests that CSF motion may involve multiple dynamical regimes including fast bulk displacement and slower perfusion-like or exchange phases.17–24 A single component model may therefore obscure distinct transport mechanisms operating on different timescales, particularly when regional differences in anatomy and drainage pathways are present. Separating these components analytically may assist in interpreting how aging affects CSF transport processes. Motivated by this, a bi-component analytical model was recently introduced that describes Time-SLIP signal evolution as the sum of a fast Gaussian bulk-displacement term and a slower Γ-variate component, validated with controlled phantom flow and preliminary human measurements.25,26
Despite these advances, aging effects have not been examined at a regional level of the meninges, and it remains unknown whether age alters specific CSF transport parameters such as timing, amplitude, width, or the relative weighting of fast and slow components, and whether any such changes occur globally or vary across distinct meningeal compartments. In particular, it is unclear whether age-related changes are uniform across upper, middle, and lower parasagittal dura regions or whether aging is associated with redistribution of CSF among these compartments. The present study substantially extends our previous work15,16 by applying a recently introduced, phantom-validated, data-driven bi-component model 26 to a larger adult cohort and anatomically defined parasagittal subregions. This design enabled separation of fast bulk-displacement and slower perfusion-like component and, together with linear mixed-effects modeling, provided a region-resolved framework to test whether aging is associated with simple global decline or with redistribution of meningeal CSF transport dynamics across parasagittal compartments.
Methods
Participants
Sixty-four healthy adults (36 males, 28 females; age 19–86 years) were recruited under approval of the University of California San Diego Institutional Review Board (IRB #200335), and all participants provided written informed consent prior to enrollment. The study was conducted in accordance with the ethical principles of the Declaration of Helsinki. Participants self-reported no prior diagnosis of neurodegenerative, cardiovascular, or diabetes mellitus. Participants also completed a brief questionnaire to provide a rough assessment of habitual physical activity level, as prior work has shown that physical activity can influence intrinsic CSF outflow. 16 In addition, MRI examinations were scheduled around midday to reduce variability of circadian effect. 27 The cohort was selected to span early to late adulthood to enable assessment of age-associated trends across the adult lifespan. Participants were instructed to abstain from vigorous exercise and maintain regular sleep and hydration prior to scanning.
Imaging
All MRI imaging was performed on a 3 T clinical scanner (Vantage Galan; Canon Medical Systems, Japan). Time-SLIP data were acquired in the coronal orientation using a three-dimensional single-shot fast spin-echo (SSFSE) readout with zigzag centric ky–kz Cartesian encoding and exponential refocusing flip angles to preserve signal from slow-moving fluid. Imaging parameters included TEeff/TR = 30/5400 ms, echo train spacing of 5 ms, excitation and refocusing flip angles of 90°/150°, Spectral Adiabatic Inversion Recovery fat suppression, a field of view of 25 × 25 cm2, acquisition matrix 368 × 368, acquired/reconstructed resolution 0.68 × 0.68/0.34 × 0.34 mm2, and 20 contiguous slices with 1 mm thickness. Data were acquired ungated, with phase encoding in the left–right direction and readout in the superior–inferior direction, allowing sensitivity to intrinsic CSF motion. For each TI = 50–3000 ms, paired Tag and Control volumes were acquired using identical acquisition geometry, with each 3D Time-SLIP series requiring ~90 s. The tagging slab was prescribed in an oblique parasagittal orientation parallel to the left side of the superior sagittal sinus to preferentially label CSF flowing toward parasagittal meningeal pathways. SIR was calculated as (Tag − Control)/M0, where M0 was defined as the Control image acquired at the longest inversion time. Additional coronal 3D T2-weighted SSFSE (MPV) and FLAIR reference series with matched geometry were acquired and used for ROI delineation (Supplementary Figure S1). For 3D MPV, the acquired in-plane resolution/reconstructed pixel size was 0.51 × 0.51/0.25 × 0.25 mm2 (with deep learning reconstruction 28 ), and for FLAIR 0.63 × 0.60/0.57 × 0.57 mm2.
Bi-component modeling
For each region, signal increase ratio as a function of inversion time was fitted to a bi-component model comprised of Gaussian bulk-displacement term and a Γ-variate perfusion-like transport term (equation (1)) with physiologically motivated parameter bounds and ordering constraints.

To maintain physiological plausibility and limit overparameterization, model parameters were fitted under bounded constraints informed by expected bolus transit and relaxation-driven decay. The Γ-variate term was implemented with a fixed apparent relaxation time (T1app = 2000 ms) rather than treating it as an additional free parameter, and the Gaussian arrival time was constrained to precede the Γ-variate arrival time to preserve physical ordering of propagation. The Gaussian component was further restricted to a finite temporal support window (via an indicator function), limiting it to waveform shapes consistent with compact bolus passage. To explicitly guard against overfitting, a Gaussian-only fit was computed in parallel and the Γ-variate contribution was retained only when it produced a clear improvement in goodness-of-fit; otherwise, the algorithm suppressed the Γ-variate term and defaulted to a single-component Gaussian model (Supporting Information).
Regions of interest, analysis, and statistics
Regions of interest were manually delineated by an experienced neuroradiologist (HNJ) based on predefined anatomical landmarks, with the vertical extent of the SSS used to define upper, middle, and lower compartments. The upper and middle compartments were further subdivided into left (LU, LM) and right (RU, RM) regions using the midline of the entire SSS (eSSS), whereas the remaining lower compartment was defined as Low (L). ROI placement was guided by co-registered 3D T2-weighted (MPV), FLAIR, and Time-SLIP images, with a representative example provided in Supplementary Figure S1. Because these ROIs were intended to represent coarse anatomical compartments rather than fine microanatomical structures, the delineation scheme was chosen to maximize consistency across participants. Given that not all model-derived parameters were normally distributed, summary statistics are reported as both mean ± SD and median with interquartile range to provide complementary measures of central tendency and dispersion. Normality of continuous variables was assessed using the Shapiro–Wilk test. Age was also not normally distributed, as expected in a large cross-sectional cohort with greater representation at younger ages, and was therefore treated as a continuous variable. Linear mixed-effects models were used for inferential analysis due to their robustness to moderate departures from normality and their ability to accommodate unbalanced designs and repeated measurements. Models included random intercepts for participants and fixed effects of region, continuous age, gender, and their interaction to assess regional differences and age-associated effects in model-derived parameters. Type III tests were used to evaluate fixed effects, and only statistically significant effects were further examined. Statistical analyses were implemented in MATLAB (MathWorks, Natick, MA, USA) and SPSS (IBM Corp., Armonk, NY, USA) using two-sided significance thresholds of p < 0.05.
Data and code availability
All analysis code used in this study is publicly available at GitHub (https://github.com/vmalis/TimeSLIP-CSF-transport). An anonymized Time-SLIP MRI test dataset supporting the findings of this work is available via Zenodo (https://doi.org/10.5281/zenodo.17982328).
Results
Age effects derived from the LMM are summarized in Table 1. Several parameter–ROI combinations showed significant associations with age (p ⩽ 0.05). Table 1 is organized by model parameter, with entries within each parameter group ordered from the most to the least statistically significant age association; all listed parameter–ROI combinations met the significance threshold (p ⩽ 0.05). Several parameters exhibited region-specific age associations. Notably, the Г-variate component perfusion parameter f decreased with age in the left upper region, whereas it increased with age in lower, SSS, eSSS, and right middle. Age-related effects on peak height metrics were also region dependent: PHΓ increased with age in SSS but decreased with age in left upper and right upper, while PHG increased with age in left middle. Full width at half maximum decreased with age in left middle and right upper. Together, these results demonstrate that multiple aspects of CSF transport dynamics exhibit age dependence and that both the magnitude and direction of age effects vary across meningeal regions.
Summary of age effects from the linear mixed model.
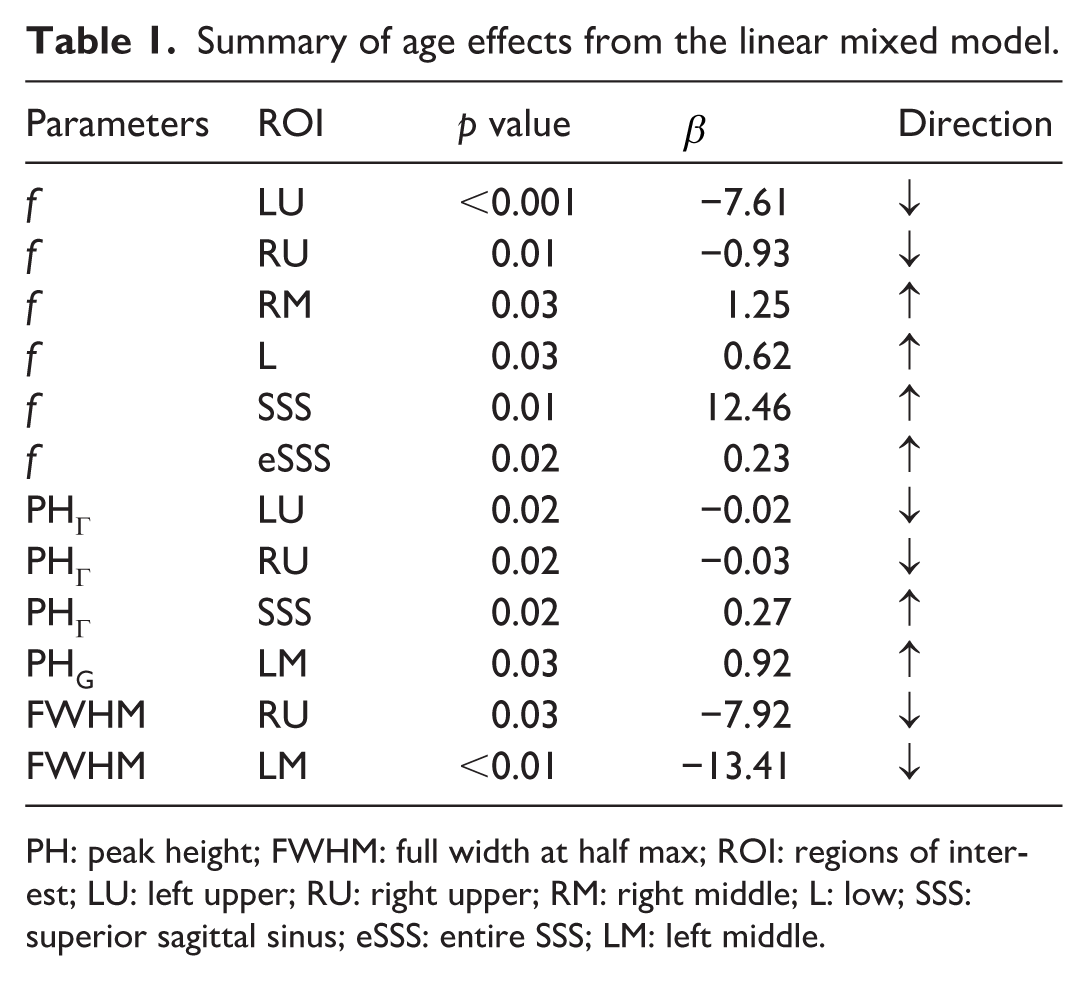
PH: peak height; FWHM: full width at half max; ROI: regions of interest; LU: left upper; RU: right upper; RM: right middle; L: low; SSS: superior sagittal sinus; eSSS: entire SSS; LM: left middle.
The bi-component model provided excellent fits to the signal increase ratio (SIR) time courses in all participants and regions of interest (ROIs). All model parameters were constrained to nonnegative fitting ranges (Supplementary Table S1). Across the cohort, the bi-component model showed the mean R2 = 0.97 ± 0.02, with no convergence failures. The average bi-component model parameters (arrival time Δt and perfusion-like parameter f) and characteristic signal metrics—including time to peak (TTP), peak height (PH), raw maximum signal (SIRMAX), area under the curve (AUC), and full width at half maximum (FWHM)—are summarized in Table 2. Subscripts G and Γ denote parameters derived from the Gaussian and Γ-variate components, respectively, whereas parameters without subscripts correspond to the aggregate bi-component signal. On average, the fast Gaussian component delay was about 300 ms earlier than the Γ-variate (ΔtG = 441 ms, ΔtΓ = 731 ms), and their peaks were clearly separated in time (TTPG = 1224 ms vs TTPΓ = 2728 ms). The bi-component peak occurred at TTP = 1477 ms. Peak heights and perfusion-like parameter f showed substantial variability across ROIs (average values: PH = 34%, and median f = 49.6 mL/100 g/min), with the relatively large spread of f reflecting a skewed distribution of nonnegative values rather than the occurrence of negative estimates.
Summary of all quantitative metrics across the cohort.
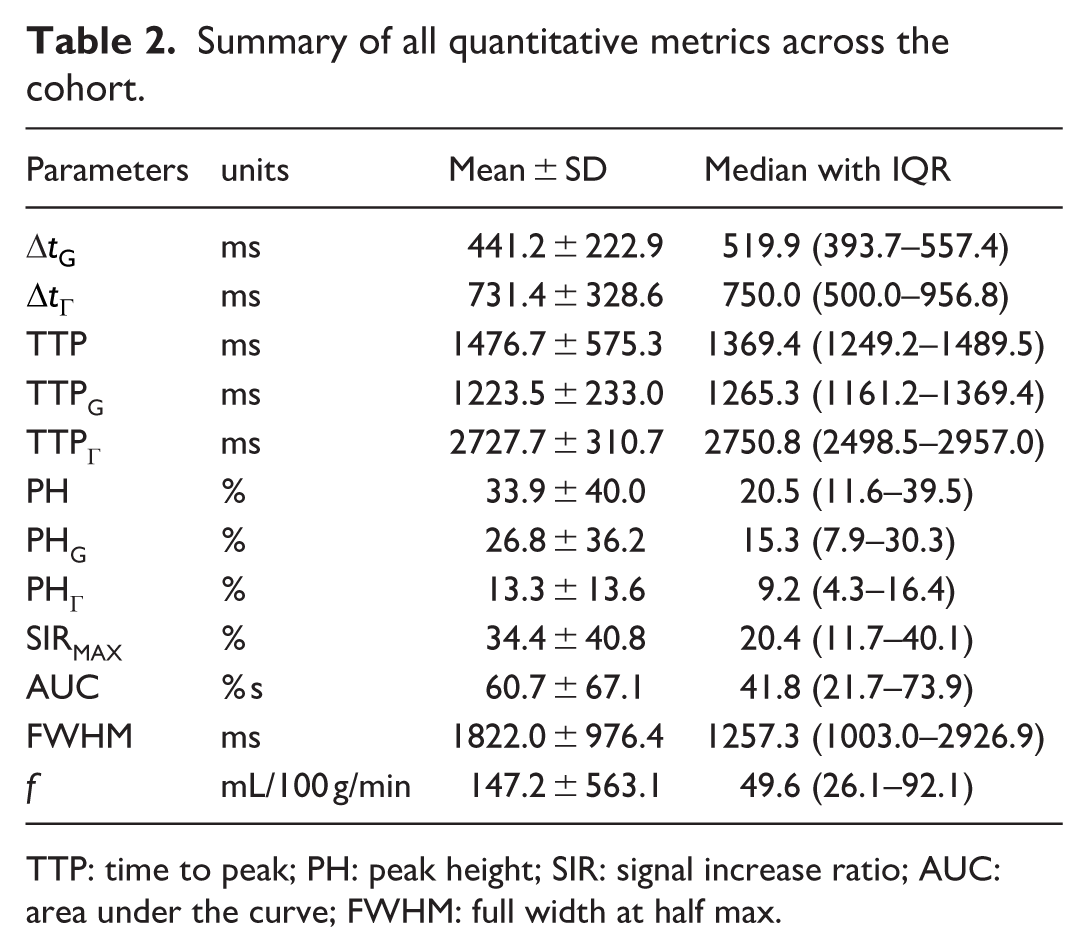
TTP: time to peak; PH: peak height; SIR: signal increase ratio; AUC: area under the curve; FWHM: full width at half max.
Figure 2 illustrates the segmentation into lower (L), left-middle (LM), left-upper (LU), right-middle (RM), and right-upper (RU) regions, together with the SSS and entire SSS (eSSS) regions. Panel B shows the measured SIR time course and corresponding bi-component model fit for the eSSS ROI in a representative participant (male, 22 years old), illustrating the close agreement between measured data and fitted curves. The rest of Figure 2 shows individual fit components with their respective parameters denoted for each plot: (c) bi-component model, (d) gaussian component, and (e) Г-variate.

(a) Segmentation of parasagittal dura into L, LM, LU, RM, RU, SSS, and eSSS regions overlaid on a representative anatomical image, (b) measured SIR values and the corresponding bi-component model fit for the eSSS region in a healthy 22-year-old participant, and (c–e) individual bi-component, Gaussian, and Γ-variate curves illustrating the separation of fast and slow signal components and their associated parameters.
Acquired Tag and Control images along with the subtraction colormap, corresponding M0 image and SIR colormaps over multiple selected inversion times for representative subject (female, 27 years old) demonstrating progressive spatially localized signal increase and washout of tagged signal (Figure 3). At inversion time TI = 1350 ms, the subtraction maps (Tag − Control) and corresponding SIR images display maximal signal intensity within the defined ROIs.

Tag and Control images, Tag − Control subtraction maps, M0 images, SIR colormaps, and zoomed SIR overlays displayed across selected inversion times (TI = 500–3000 ms). These panels depict the evolution of the tagged signal over time and the spatial localization of signal changes within the predefined region of interest.
Figure 4 summarizes spatial heterogeneity of CSF transport metrics across ROIs using pairwise comparison heatmaps. These matrices display pairwise ROI differences for arrival times, TTP and PH for bi-component model as well as each of the model components; SIRMAX, AUC, and perfusion parameter f, with only statistically significant contrasts (Type III linear mixed model (LMM) tests, p < 0.05) shown. In each heatmap, the x- and y-axes correspond to the analyzed ROIs, with each cell representing the mean difference between the ROI indicated by the row and that indicated by the column; color intensity reflects the magnitude and direction of the difference (warmer colors indicating higher values and cooler colors indicating lower values for the row ROI relative to the column ROI), and numerical labels denote the associated p values for statistically significant contrasts. Numerous significant differences are present for each parameter, indicating that parasagittal dura subregions and sinus regions differ not only in timing but also in amplitude and integrated signal magnitude. Notably, spatial patterns observed for the raw peak metric SIRMAX closely mirrored those of the bi-component peak height, indicating strong agreement between model-derived and directly measured peak signal characteristics. In addition, several metrics showed systematically higher values in left-sided ROIs compared with their right-sided counterparts, consistent with the left-sided positioning of the labeling slab during acquisition.

Heatmaps of pairwise ROI comparisons displaying only statistically significant contrasts identified by type III tests of the linear mixed model (p < 0.05). ROIs: L, LM, LU, RM, RU, SSS, and eSSS.
Discussion
Heterogeneity was observed across multiple model-derived parameters, including the relative contribution of the perfusion-like component, peak height, and temporal width, indicating that aging influences several distinct aspects of CSF transport dynamics. The observation that upper and lower parasagittal dura exhibit opposite age trends in the perfusion-like signal component suggests that specific compartments may become vulnerable while others compensate or maintain function. These opposing trends were most evident between upper (LU) and lower (L) parasagittal dura compartments, with intermediate behavior observed in middle parasagittal dura regions, consistent with age-related redistribution rather than uniform decline of CSF transport. Differences between upper and lower parasagittal dura may reflect underlying anatomical heterogeneity of CSF egress pathways. 29 In particular, the lower PSD lies in closer proximity to the superior sagittal sinus and known CSF absorption structures, whereas upper PSD regions are anatomically more distant. Prior anatomical studies report a higher density and age-related enlargement of arachnoid granulations along lower parasagittal regions adjacent to the superior sagittal sinus, suggesting that age-related changes in granulation-mediated CSF transport or exchange may preferentially influence lower compartments. 30 Such age-dependent changes in arachnoid granulations provide a plausible structural basis for the increasing perfusion-like transport metrics observed in lower PSD with advancing age. Structural heterogeneity of the dura, arachnoid barrier cells, and meningeal lymphatic vessels provide plausible anatomical substrates for such divergent trajectories. The age-related decrease in f in the upper PSD may reflect reduced contribution of bridging-vein-associated delayed exchange pathways in this more anatomically distant compartment. Recent studies identified arachnoid cuff exit (ACE) points as bridging-vein-associated sites of CSF-dura exchange, and at the spatial resolution of the present MRI data the observed parasagittal signal may plausibly arise from the bridging-vein region or adjacent perivascular space near these structures.31,32 Under this interpretation, the opposite age trends between upper and lower PSD may reflect redistribution of delayed perfusion-like transport across parasagittal compartments rather than uniform change across the entire PSD. Together, these features emphasize that parasagittal dura subregions represent functionally distinct CSF transport compartments whose relative contributions may shift with aging.
We also considered whether gross structural differences in PSD size could contribute to the observed age-related transport effects. In the present cohort, PSD ROI area measured on the analyzed slice did not show a significant association with age (Supplementary Figure S2), despite prior reports of age-related enlargement in parasagittal dural structures. In addition, model parameters did not show a significant correlation with ROI area (Supplementary Table S2), suggesting that the observed age-related transport effects are not explained simply by gross regional size differences in the current dataset. ROI areas were generally larger in males in the present cohort, which is consistent with prior reports.
33
However, the linear mixed-effects analysis did not show broad gender effects, with only an isolated main effect observed for ∆
Extending our prior work, which demonstrated an overall age-related decline in intrinsic CSF outflow,
15
the present study applies a novel data-driven bi-component model to provide the first region-resolved characterization of CSF–ISF transport with non-contrast MRI and shows that age-related effects are both region-specific and component-specific, with stronger trends observed in the slower perfusion-like term rather than in the rapid bulk-displacement component. The bi-component model offers a compact, physiologically motivated description of CSF–ISF transport signal. The fast Gaussian component may be interpreted as rapid passage of CSF-dominant fluid through more direct outflow routes toward the PSD, such that larger values of parameter A indicate stronger immediate clearance, shorter ∆
All participants were healthy and imaged under controlled pre-scan conditions, minimizing variability from acute physiological factors. Because model parameters were derived from normalized signal increase ratios, differences in raw signal amplitude related to tag position do not bias age trends. Time-SLIP acquisitions were ungated, and we cannot fully exclude contributions from age-related changes in vascular pulsatility; however, the multi-inversion time sampling and constrained model fit reduce sensitivity to waveform differences. Time-SLIP does not directly quantify cerebrospinal fluid removal from the intracranial space, but instead captures the spatiotemporal evolution of labeled CSF signals, which may contain both pure CSF and CSF–ISF mixture with brain metabolic wastes. The meninges is known to be brain waste egress sites with presence of meningeal lymphatic vessels. 34 A few considerations are therefore important for interpreting these measurements. First, the observed signal dynamics may reflect contributions from both cardiac- and respiration-driven CSF motion. Second, signal contamination from venous blood in the superior sagittal sinus cannot be completely excluded; however, phantom and in-vivo validation with a T2-preparation module suggested that venous contribution to the measured Time-SLIP signal in the SSS region is minimal (≈8%). 26 Third, the tagged CSF signal exhibited two reproducible temporal behaviors across regions: an earlier, bulk-displacement-like component that was most prominent in sinus-adjacent regions (SSS/eSSS), and a later, more dispersed perfusion-like component observed within parasagittal dura subregions. The physiological origins of these components and the factors differentiating upper and lower parasagittal compartments cannot be determined from the present data without gadolinium-based contrast agent (GBCA) 35 ; however, the opposing age associations observed between these regions indicate that aging differentially alters meningeal CSF transport dynamics rather than producing a uniform global effect.
The region-specific and opposing age associations observed across parasagittal dura subregions argue against a purely global pulsatility-driven explanation and instead suggest differential remodeling of meningeal CSF transport dynamics with aging.
Manual regions of interest were drawn by an experienced neuroradiologist and focused on coarse anatomical compartments, limiting subjectivity. This approach was intended to prioritize anatomical reproducibility across participants rather than resolve fine-grained microanatomical variability.
Limitations of this study include the cross-sectional design and the absence of direct links to molecular or cognitive markers, and the lack of formal inter-rater reliability assessment for ROI delineation. Nonetheless, the broad adult age span and consistent regional patterns suggest genuine physiological aging of meningeal CSF transport pathways. The observed sensitivity of PSD subregions to aging further highlights the utility of regional CSF transport metrics as potential markers of neurofluid system remodeling. These data and analysis framework provide a basis for future work relating CSF transport metrics to neurodegenerative disease, vascular risk and sleep.
Supplemental Material
sj-pdf-1-jcb-10.1177_0271678X261455452 – Supplemental material for Meningeal CSF transport varies across parasagittal dura subregions with age in humans
Supplemental material, sj-pdf-1-jcb-10.1177_0271678X261455452 for Meningeal CSF transport varies across parasagittal dura subregions with age in humans by Vadim Malis, Hye Na Jung, Yoshiki Kuwatsuru, Won C Bae and Mitsue Miyazaki in Journal of Cerebral Blood Flow & Metabolism
Footnotes
Acknowledgements
We would like to thank Drs. Shinji Naganawa and Toshiaki Taoka of the Nagoya University for their valuable and insightful discussions regarding the possible physiological interpretation of these results.
Author contributions
VM implemented the analysis framework and performed data analysis, wrote and prepared the manuscript. HNJ and YK defined regions-of-interest. WCB performed data sorting. MM originated the study concept, performed data acquisition, and revised the manuscript. All authors performed data acquisition, reviewed, and approved the final version.
Funding
The authors disclosed receipt of the following financial support for the research, authorship, and/or publication of this article: This work was supported by NIH grants R01AG076692 and R01AG087407 (MM) and a grant by Canon Medical Systems, Japan (35938).
Declaration of conflicting interests
The authors declared the following potential conflicts of interest with respect to the research, authorship, and/or publication of this article: MM received a research support grant from Canon Medical Systems, Japan. VM, HNJ, YK, and WCB declare no competing interests.
Supplemental material
Supplemental material for this article is available online.
References
Supplementary Material
Please find the following supplemental material available below.
For Open Access articles published under a Creative Commons License, all supplemental material carries the same license as the article it is associated with.
For non-Open Access articles published, all supplemental material carries a non-exclusive license, and permission requests for re-use of supplemental material or any part of supplemental material shall be sent directly to the copyright owner as specified in the copyright notice associated with the article.