
Abstract
The academic impact of the transition from elementary to middle school has significant consequences for many early adolescents. This study examines academic growth across the transition, as well as sociodemographic moderators. Rather than defining the transition effect as a decline in student achievement between fifth and sixth grade, these data demonstrate the transition effect as an interruption in students’ growth in achievement during this interval. Results confirm larger interruptions for vulnerable students (e.g., low income, special education) despite closing the gap effect over the third- to eighth-grade interval.
Since the 1970s (Blyth, Simmons, & Bush, 1978), school transitions have been receiving increasing attention in educational research, with the elementary to middle school transition at the forefront of these inquiries. This transition is especially significant, as roughly 88% of public school students take part in the experience (Association for Middle Level Education, 2002). In addition, it marks the second dramatic shift (the first being the entrance into formal schooling) in students’ lives, and is characterized by rapid personal growth and change. Concurrent with the transition, children are becoming increasingly autonomous learners with burgeoning abilities to think abstractly and metacognitively (Luna, 2009). Students’ social relationships with peers begin to take precedence over those with parents and teachers (Ryan & Shim, 2008), though positive relationships with adults at home and at school remain integral to student success (Hill & Tyson, 2009; Sakiz, Pape, & Hoy, 2012).
Mounting concerns regarding student growth and well-being during this formative time period are due to the fact that many students experience disruptions during the transition. For example, studies have found declines in school engagement (Galván, Spatzier, & Juvonen, 2011) and self-concept (Parker, 2009) along with increasing instances of disciplinary action (Theriot & Dupper, 2009) including increased aggression and peer victimization (Williford, Brisson, Bender, Jenson, & Forrest-Bank, 2011). For some students, mental health issues such as depression were exacerbated during the middle school transition (Goodwin, Mrug, Borch, & Cillessen, 2012). Although these data are not universal (Hill & Tyson, 2009; Parker, 2009), the impacts of transition appear pervasive and significant, especially considering predictors of future school failure also increase during the transition, such as absence from school (Eccles & Roeser, 2009).
Academic Outcomes
One of the more prominent concerns is the decline in academic performance across the elementary to middle school transition, though the extant literature has not been conclusive. For example, West and Schwerdt (2012), examining Florida public school students, found declines in both reading and math standardized test scores during the middle school transition year, regardless of whether the transition occurred in sixth or seventh grade (based on school configuration). These students fared worse than their counterparts who attended schools with K-8 models, thus experiencing no differentiated transition. Whitley, Lupart, and Beran (2007), however, found that Canadian students’ math achievement declined between fifth and seventh grade irrespective of taking part in a school transition.
Bellmore (2011), studying the effects of peer rejection and popularity on academic achievement across the transition, found a global decline in grade point average (GPA) among students starting middle school in sixth grade that persisted throughout middle school regardless of social well-being. On the other hand, Lee (2010), in a meta-analytic study of national academic achievement over time, found that students in middle school do not exhibit an academic decline so much as a flattening out. Although students in elementary school exhibited significant academic gains, middle school students showed little or no gains.
Perhaps the disparity in findings can be attributed, in part, to the different methodologies used by the various authors. For instance, Whitley et al. (2007) analyzed teacher, parent, and student survey responses regarding ratings of students’ academic achievement at two points in time (once before the transition and once after). This data set relies upon the subjective responses of survey respondents and does not allow for insight into student growth patterns outside of the transition itself.
On the other hand, West and Schwerdt (2012), Bellmore (2011), and Lee (2010) utilized quantitative longitudinal achievement data. These approaches, at first glance, mitigate previously mentioned concerns associated with subjective survey responses and lack of purview into achievement patterns over time. In the case of Bellmore (2011), however, student GPA is the achievement measure used to analyze performance over time. One limitation of GPA is that it, too, can fall prey to subjectivity, as this construct may represent differences between schools, teachers, and classes as opposed to individual students (Bellmore, 2011). West and Schwerdt (2012) investigated math and reading scores on state standardized achievement tests, but solely looked at a drop in test scores at transition times as opposed to changes in growth trajectory.
Finally, although Lee (2010) studied trends in student growth trajectory over time, this research relies upon outcome data from disparate achievement tests across multiple states and grade levels. It assumes that, “there is sufficient continuity of both curriculum and assessment across grades K–12 in reading and math to warrant vertical scaling for a common scale in each subject” (Lee, 2010, p. 809).
We utilize a common, objective, and longitudinal measure of student growth trajectory to track student growth over time as well as assess when that growth has been interrupted. This type of data allows for analysis of expected student growth in learning as compared with actual student growth. Given this information, the effects of the elementary to middle school transition on academic growth and achievement can be more precisely estimated.
Moderating Factors
In addition to studying the academic impact of the transition, it is important to explore the factors that moderate transition outcomes. A host of factors have had significant impact on this transition including student race (Akos & Galassi, 2004; Benner & Graham, 2009; Wampler, Munsch, & Adams, 2002), safety, academic environment, teacher expectations (Rice, 2001), socioeconomic status (SES), and interactions between family and school (Gutman & Midgley, 2000). The impact that a transition has on a student’s academic and psychological well-being is both a constellation and culmination of various factors that have negative and positive correlations with student achievement during transitional years. In fact, it has been suggested that many of the psychological factors relate to achievement growth (Gutman & Midgley, 2000). Next, we illustrate the literature that has examined key moderators in transition outcomes.
Race
Wampler et al. (2002) looked at the impact of race on school transition among Black, Hispanic, and White students, and discovered three distinct patterns of academic achievement across the first year of the transition. White students exhibited a slow, continual decrease in grades throughout the year, while Black students’ grades remained fairly constant, and Hispanic students showed a sharp drop in grades followed by a slight upturn toward the end of the school year.
Other authors, however, have found that the transition to middle school for Black students correlates with a decline in math scores and an increase in the relationship between risk factors and behavior issues (Burchinal, Roberts, Zeisel, & Rowley, 2008). Additional research has demonstrated that Hispanic students tend to have significantly more difficulty across the middle school transition, and view their transition as more problematic than their non-Hispanic peers (Akos & Galassi, 2004).
In sum, the exact nature of the effect of race on the elementary to middle school transition is tentative, and findings have been mixed. What is clear, however, is that race appears associated with transition outcomes in various ways.
SES
Another factor shown to have an impact on academic achievement across the transition to middle school is SES. Niehaus, Rudasill, and Rakes (2012) found a downward progression in GPA among students of low SES across the transition that was mediated by how students perceived school support. It can be difficult, however, to hone in on the effects of SES as a unique factor because it is often taken together with race as a co-occurring variable in social and educational research. For example, Gutman and Midgley (2000) completed a study that focused on students who were Black, of low SES, and transitioning to the middle school level, finding a general decline in GPA across the transition.
Gender
In addition to race and SES, some research points to gender differences in academic outcomes during the middle school transition, with females demonstrating steady academic achievement across the transition relative to males, who have exhibited declines (Akos & Galassi, 2004). Holas and Huston (2012), however, found no clear relationship between gender and academic outcomes. The measure of academic achievement, however, in that study was tied in to factors of school engagement and perceived competence. Kingery, Erdley, and Marshall (2011) also did not find gender to be a factor in academic outcomes across the transition, but they did note a decline in achievement for both males and females.
Special Education and Family Structure
To date, the literature regarding the academic outcomes for special education students as a result of the elementary to middle school transition has been limited. Anderman (1998) found that students with learning disabilities (LD) underperformed on math and science achievement tests and class grades across the middle school transition when compared with their peers without LD. One confounding variable, though, was that many of the students identified with LD were also of low SES, which has been shown to contribute to more difficult school transitions. Finally, family structure has been shown to affect students’ socioemotional well-being in the transition from elementary to middle school (Duchesne, Ratelle, Poitras, & Drouin, 2009; Hines, 2007), though little is known about the academic effects of this variable.
Research Questions
For the most part, the factors mentioned above have been shown to moderate outcomes, both negative and positive, for students. The reviewed studies have utilized varied research methodologies. Many studies lack longitudinal data sets for analysis, or account for confounding variables. The aim of the present study, then, in addition to exploring the magnitude of the elementary to middle school transition effect, is to examine sociodemographic factors that moderate this transition effect. We use growth modeling to decompose changes over time into linear and quadratic components, a component related to a state policy confounder and the transition to middle school, and examine the moderating influence of sociodemographic factors on both the linear and transition components. We use data collected from 14 middle schools in a medium-sized urban district to investigate the following questions:
Based on previous research, we hypothesize that the transition will have a negative academic effect and that sociodemographic factors will moderate this effect.
Method
Data Source and Research Design
This study consists of a secondary analysis of a cohort of students in schools participating in an experimental evaluation of a middle school intervention conducted in a medium-sized urban district in North Carolina. This study included all students enrolling in these 14 middle schools in sixth grade in 2006-2007. There were 3,295 students in this cohort included in this analysis: 51% were males; 31% Black, 16% Hispanic, 47% White, and 6% other non-White races and ethnicities; 54% received either free or reduced-price lunches at any time during the study period; 32% reported that they lived in single-parent homes; 16% were academically gifted; and 20% were considered special education students. Administrative records contained information only on students while they were within the district. Surveys provided information on the family structure of each student. All data collection procedures received Institutional Review Board (IRB) approval.
Seven of 14 middle schools received the intervention; seven acted as controls. Prior to randomization, the sample was stratified according to Title I status such that an equal number of the six Title I schools were in the treatment and control groups. The intervention, CareerStart (Orthner, Akos, Jones-Sanpei, Mercado, & Woolley, 2010), provided lessons consistent with the North Carolina standard course of study (SCOS) that were enhanced to make the material more relevant to students’ lives through examples of jobs and careers. Teachers were given the lesson material and strongly encouraged by supportive administrators at the school and district level to incorporate these lessons into their classrooms. The intervention has been investigated in previous research (e.g., Orthner, Jones-Sanpei, Akos, & Rose, 2013) and the treatment has been found to be a significant predictor of end-of-grade math achievement (Woolley, Rose, Orthner, Akos, & Jones-Sanpei, 2013), increasing math achievement on average by 0.61 points on achievement test, a one quarter of a standard deviation effect size or one third the size of the average annual rate of growth in math achievement. Consequently, we control for the treatment in this study by including a covariate indicating whether a student was in a treatment or control school. This decision was re-examined in a robustness test that is described in the analysis.
Students’ math and reading end-of-grade test score performance (North Carolina system of assessment—http://www.ncpublicschools.org/accountability/) was obtained from the district, which provided administrative data files extending back to third grade. Students were subsequently followed through the end of eighth grade. The administrative data also included sociodemographic information such as race, gender, free/reduced-price lunch, academic giftedness, and special education.
Measures
Dependent variables
Dependent variables consisted of end-of-grade math and reading scale scores from the elementary and middle school years, ranging from third to eighth grade. This provided as many as three pre-transition time points. Additional time points provide greater evidence of the learning trajectory and strengthens inferences related to the expected trajectory of each student by minimizing the influence of random disturbances from year to year, missing measurements, extreme values, and regression to the mean (Raudenbush, 2001). These were entered as pooled time-series or panel data, with one record per student per measured time point.
These six exams were used to plot estimates of growth in learning. North Carolina’s end-of-grade exams are normed such that all six grade levels are on a common metric, making it possible to use the end-of-grade exam scores to measure growth in learning over the six grade levels from third through eighth grade. Students are expected to meet higher growth targets from 1 year to the next. The exams have been renormed several times, with new score ranges and expected growth targets replacing earlier versions. Both the math and reading exams were renormed during the study period, math in 2006, when this cohort was in fifth grade; and reading in 2008, when this cohort was in seventh grade. To facilitate comparisons and measure growth across all years, earlier years were converted into the later metric. The resulting year-to-year means in test scores were carefully examined for extreme changes spanning the revised scale.
Independent variable: Transition
The focus of this analysis was on a time-varying variable labeled “transition” that indicated that a student had experienced the transition to middle school. It had a value of zero for the elementary school years, and a value of one for the middle school years. Although the transition occurs between fifth and sixth grades, students’ learning trajectories were not expected to return to pre-transition levels in seventh and eighth grade. The transition variable as coded implies a comparison between pre- and post-transition growth in achievement, which is consistent with the research questions of this study. The transition effect coefficient was hypothesized to be negative, based on the extant literature (e.g., West & Schwerdt, 2012), implying that for all students transition was associated with a net decrease in performance relative to students’ prior trajectories.
Time-varying covariates
In order to obtain an unbiased estimate of the transition effect, several other time-based indicators, capturing forms of overall growth and time-based confounders, were modeled as well. A measure of time spanning the six grade levels, the linear growth time variable, was modeled, with values ranging from −2 to 3, corresponding to grade levels 3 through 8 (“centered” at zero on fifth grade). This linear growth effect captured the children’s annual rate of change in exam performance. A quadratic time variable was also included where possible to allow for change in the rate of change over time.
A covariate was modeled to account for the unique effects of specific grade levels in the North Carolina testing regime from 2002 to 2010, in which students who were not proficient on third, fifth, or eighth grade end-of-grade exams could only be promoted to the next grade level with special approval from principals. We refer to this as the “gateway” policy that created incentives for principals, teachers, and students to put greater emphasis on exam proficiency during these grade levels. This may have affected the fifth-grade exam, which directly precedes the transition to middle school, potentially inflating the performance of students in fifth grade relative to sixth grade. We therefore modeled a variable “gateway” that has a value of 1 in third, fifth, and eighth grades, and value of 0 in the other three grade levels.
Time-invariant moderators and student and school covariates
To address the comparability of the student populations, account for the CareerStart treatment, and estimate moderators of the transition effect, we included several time-invariant covariates, including student age, race (Hispanic, Black, and all other non-White), gender, free/reduced-price lunch (as a proxy for low income), number of parents in home, academic giftedness, and special education. Each of these variables was entered as a covariate as well as interacted with the transition effect and with the linear growth parameter. The interaction with the transition effect was done in separate models for each sociodemographic moderator to isolate the effect of each moderator on the transition effect. Conversely, all interactions between sociodemographic factors and the linear growth parameter were included in every model. In addition, student age and two school variables were included: Title I status and CareerStart treatment assignment.
Analysis
End-of-grade trends
Serial cross sections of end-of-grade performance for each demographic over the six grade levels were constructed by taking the mean end-of-grade math and reading scores in each grade level for each of the categories used as the moderator variables. These trends show the change in the average performance of each demographic from year to year without adjustments for student migration into and out of the sample between years. Unadjusted differences between each grade level were calculated for each group, with the change from fifth to sixth grade highlighted.
Unconditional difference-in-difference, fifth to sixth grade
Unconditional difference-in-difference estimates of the fifth to sixth grade change between each focal demographic group and its reference group were estimated (Angrist & Pischke, 2009). First, the difference between fifth- and sixth-grade achievement for individual students was estimated. Subsequently, the average change for persons in the focal group was subtracted from the average change for persons in the reference group. The difference-in-difference was tested using an independent sample t test. In contrast to the end-of-grade trend, the difference-in-difference estimate is longitudinal; only students who appear in both fifth and sixth grade are included. The estimates differ from those of the end-of-grade trend largely due to ingress and egress of students from 1 year to the next.
Multilevel growth modeling
Conditional difference-in-difference models were estimated using multilevel growth modeling. Because the data were obtained from a pooled time-series or panel design, multilevel modeling of time “nested within” students was an appropriate choice for estimating the transition effect (Raudenbush & Bryk, 2002). The multilevel growth model also enabled us to estimate a conditional difference-in-difference using the coefficient of an interaction between the transition and the variable identifying the focal group (e.g., Robinson, 2008). The difference-in-difference was defined as the added effect of the transition on one focal group (e.g., females) over the reference group (e.g., males) controlling for all influences common to both groups. Multilevel growth models of repeated measures such as the six grade levels of end-of-grade scores improve upon the unconditional difference-in-difference estimate in several ways. First, with six grades (rather than just fifth and sixth) reliability is improved, reducing the influence of extreme values in any given year and adjusting for regression to the mean. Second, covariates could be used to control for shared variance between each demographic group. Third, the repeated measures approach allowed us to decompose time trends into several constituent parts, such as those due to underlying development (linear and quadratic growth), differential growth between demographic groups in underlying development (moderation of linear growth), the gateway effect, and the transition.
Models were run in SAS 9.1.3 using the MIXED procedure, using restricted maximum likelihood and the Kenward-Roger method of calculating denominator degrees of freedom (SAS Institute Inc., 2000-2004).
Missing data
Nearly all of the missing values were on the dependent variable (with rates of about 20% each: 3,984—of 19,770 total records, comprising students by six time points—missing math and 3,786 missing reading). Among the covariates, 28 children were missing race, 43 were missing gender, and 27 were missing information on number of parents in the home (approximately 1% of the sample). Missing values of the dependent variable are analyzed using full information maximum likelihood (FIML), which minimizes bias when data are missing at random (MAR; Allison, 2002), and the missing data can be ignored. However, to ensure that parameters were not biased, the main analyses consisting of the difference-in-difference models presented in Table 5 were run on data subjected to multiple imputation. Imputation models consisted of the analysis variables as well as several auxiliary measures (Shafer & Graham, 2002) collected in the CareerStart evaluation that were not related to the current analysis (e.g., measures of teacher quality, student engagement, and valuing). The results of a comparison between models run on imputed and non-imputed data suggested that the threat of bias from missing data was negligible. The total number of records used in the reading models was 15,936; in the math models, it ranged from 10,975 (fifth to eighth grade only) to 15,782 (all grade levels).
Robustness
Several decisions that were made in this analysis were subjected to robustness tests. First, because treatment assignment and school title I status were actually school-level variables, we estimated models that account for the nesting of students within schools. Second, although no moderating effects of the CareerStart treatment have been observed (see, for example, Woolley et al., 2013), we estimated models in which the models were run only on the control students. Informed by the results reported below, we also estimated models of each moderation effect without student or school covariates to determine whether the presence of the covariates or the reliability of using repeated measures could explain the transition findings. Finally, we estimated two variations on the model for math achievement in order to examine the sensitivity of the findings to the renorming that occurred between fourth and fifth grade. First, we estimated models that both did and did not include third- and fourth-grade performance. Second, using models that included all grade levels, we re-estimated the transition and moderation effects using standardized math scores. Because the standardization is done within each grade level, this eliminated the overall transition effect but may nevertheless show whether certain groups of students over- or under-perform relative to the average.
Results
Trends of End-of Grade Scores
The trends presented in Figure 1, which are unadjusted mean reading and math end-of-grade scores by grade level, reveal several key characteristics of end-of-grade performance. First, on average, children improve every year, including in the transition from fifth to sixth grade. At first glance, these data suggest an absence of an academic transition decline. Relative to the other grade-to-grade advancements, however, the fifth- to sixth-grade change is substantially diminished. This reveals the transition effect not as a reduction in performance, but a diminution in improvement that results in performance that is lower than would be expected given prior performance. Second, for math, there appears to be a renorming artifact even after adjusting the third- and fourth-grade scores to the latter scale; this artifact greatly inflates the change from fourth to fifth grade. Alternatively, the graph shows that for reading, which was renormed prior to seventh grade, there was no noticeable renorming artifact after converting the earlier scores to the newer metric.
Trend in reading and math renormed end-of-grade test scores by grade level.
Tables 1 and 2, which contain unadjusted means of reading and math end-of-grade scores by grade level and sociodemographic, differentiate the trends from Figure 1. These cross-sectional trends in the exam scores support the findings of Figure 1 for each demographic group that performance increases even in the transition from fifth to sixth grade. They also demonstrate the reduction or smaller magnitude of growth in the transition year. Furthermore, these trends demonstrate that students conform to findings highlighted in a portion of the previous literature about the patterns across demographics: Black and Hispanic children underperformed and experienced less growth from fifth to sixth grade as compared with White and other non-White children; the same pattern emerged for low-income students relative to higher income peers; for children living with single parents relative to children living with two parents; and for special education students relative to students not classified as special education. Conversely, the academically gifted outperformed those not classified as academically gifted and experienced more improvement from fifth to sixth grade. The findings for gender were more complex. Females had better reading scores than males in both grades and higher improvement. In addition, females had lower math scores but more improvement from fifth to sixth grade.
Mean Reading End of Grade Scores and Year-to-Year Change, All Demographics.
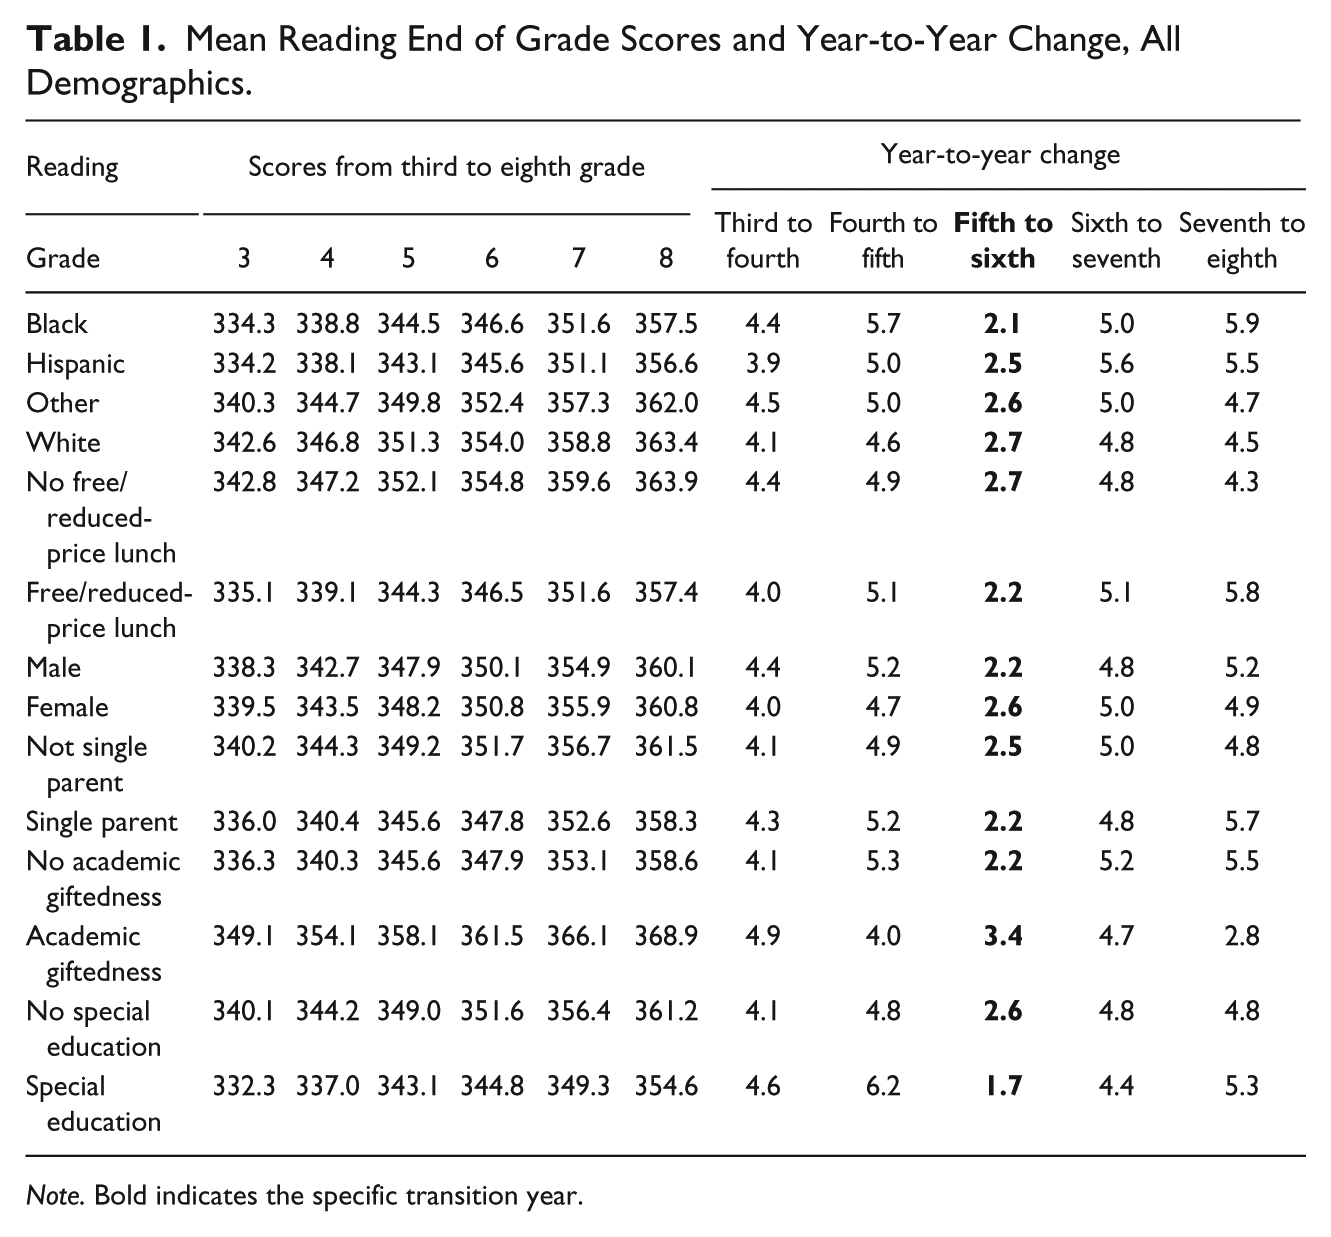
Note. Bold indicates the specific transition year.
Mean Math End of Grade Scores and Year-to-Year Change, All Demographics.

Unconditional Difference-in-Difference, Fifth to Sixth Grade
Unconditional difference-in-difference estimates in Table 3, which adjust for student ingress and egress between grade levels, confirm the findings of the trends in Figure 1 and Tables 1 and 2, showing that all demographic groups improve in performance from fifth to sixth grade. A statistical test shows that some of these increases (mostly in reading) were not statistically different from zero, and overall, the gains were smaller than those observed in the cross-sectional analysis. They also confirm, much like Tables 1 and 2, previous findings on demographic patterns: Black and Hispanic students experienced less growth in math than White students (t = 2.952, p < .01; t = 2.525, p < .05, respectively); females experienced more growth than males in math (t = −3.843, p < .001) and reading (t = −2.243, p < .05); students from low-income families experienced less growth in math than higher income students (t = 4.865, p < .001); students of single parents experienced less growth in math than students in two-parent households in math (t = 3.112, p < .01); academically gifted students showed higher growth than those not classified as academically gifted in math (t = −5.709, p < .001) and reading (t = 3.373, p < .001); and students receiving special education services experienced less growth in both math (t = 2.094, p < .05) and reading (t = 3.511, p < .001).
Difference-in-Difference Estimates, Fifth to Sixth Grade.

p < .05. **p < .01. ***p < .001.
Regression and Conditional Difference-in-Difference Results
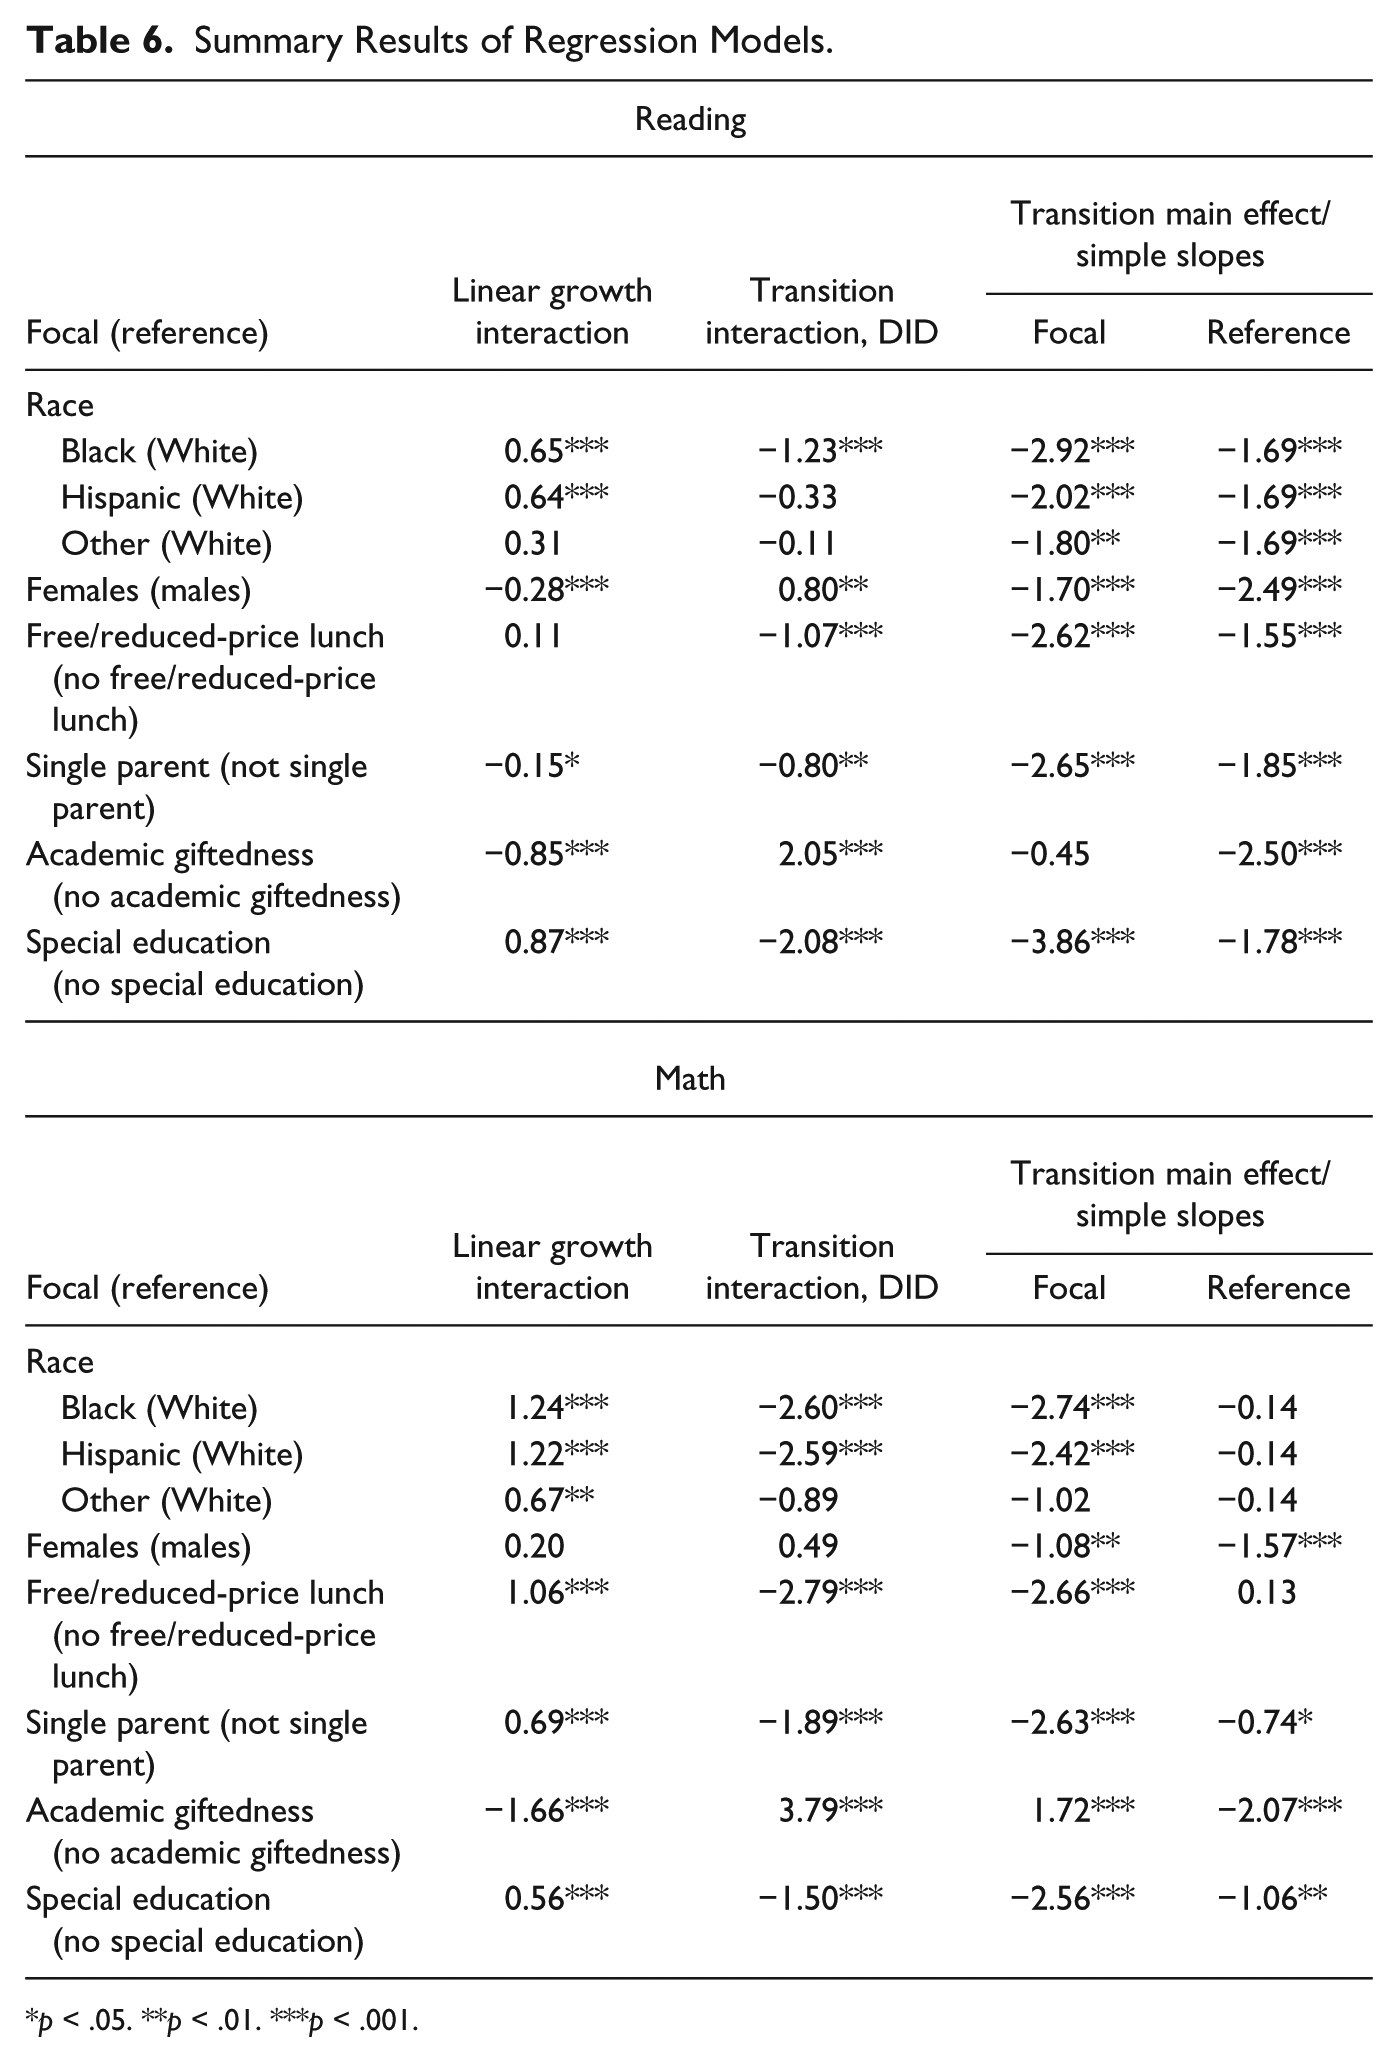
Results of the hierarchical linear modeling (HLM) analysis are provided in Tables 4 through 6. Tables 4 and 5 report findings for reading and math with and without the transition effect, respectively. In all of these models, the interactions defining the difference-in-difference and the moderation of linear growth are excluded. In Table 6, the first column contains the coefficient capturing the moderation of linear growth by the demographic group. Furthermore, the constituent parts of the transition effect are reported in accordance with Aiken and West (1991) and Bauer and Curran (2005). These terms include the conditional difference-in-difference (column 2), and the “simple slopes” or the marginal or main effect of the transition for each group (Bauer & Curran, 2005). These simple slopes represent the total effect of the transition for each focal group (column 3) and its reference (column 4), with the difference-in-difference being their difference. Because it is possible for the difference-in-difference to be a statistically significant difference but either of the two transition effects themselves to not be significantly different from zero, or vice versa, all terms were tested. The tests of the simple slopes in columns 3 and 4 evaluate the null hypothesis that the reported transition effect is not different from zero; in column 2 a better description of the null hypothesis is that the transition effect for the focal and reference groups are not different.
Reading Models Without Moderation/Difference-in-Difference.
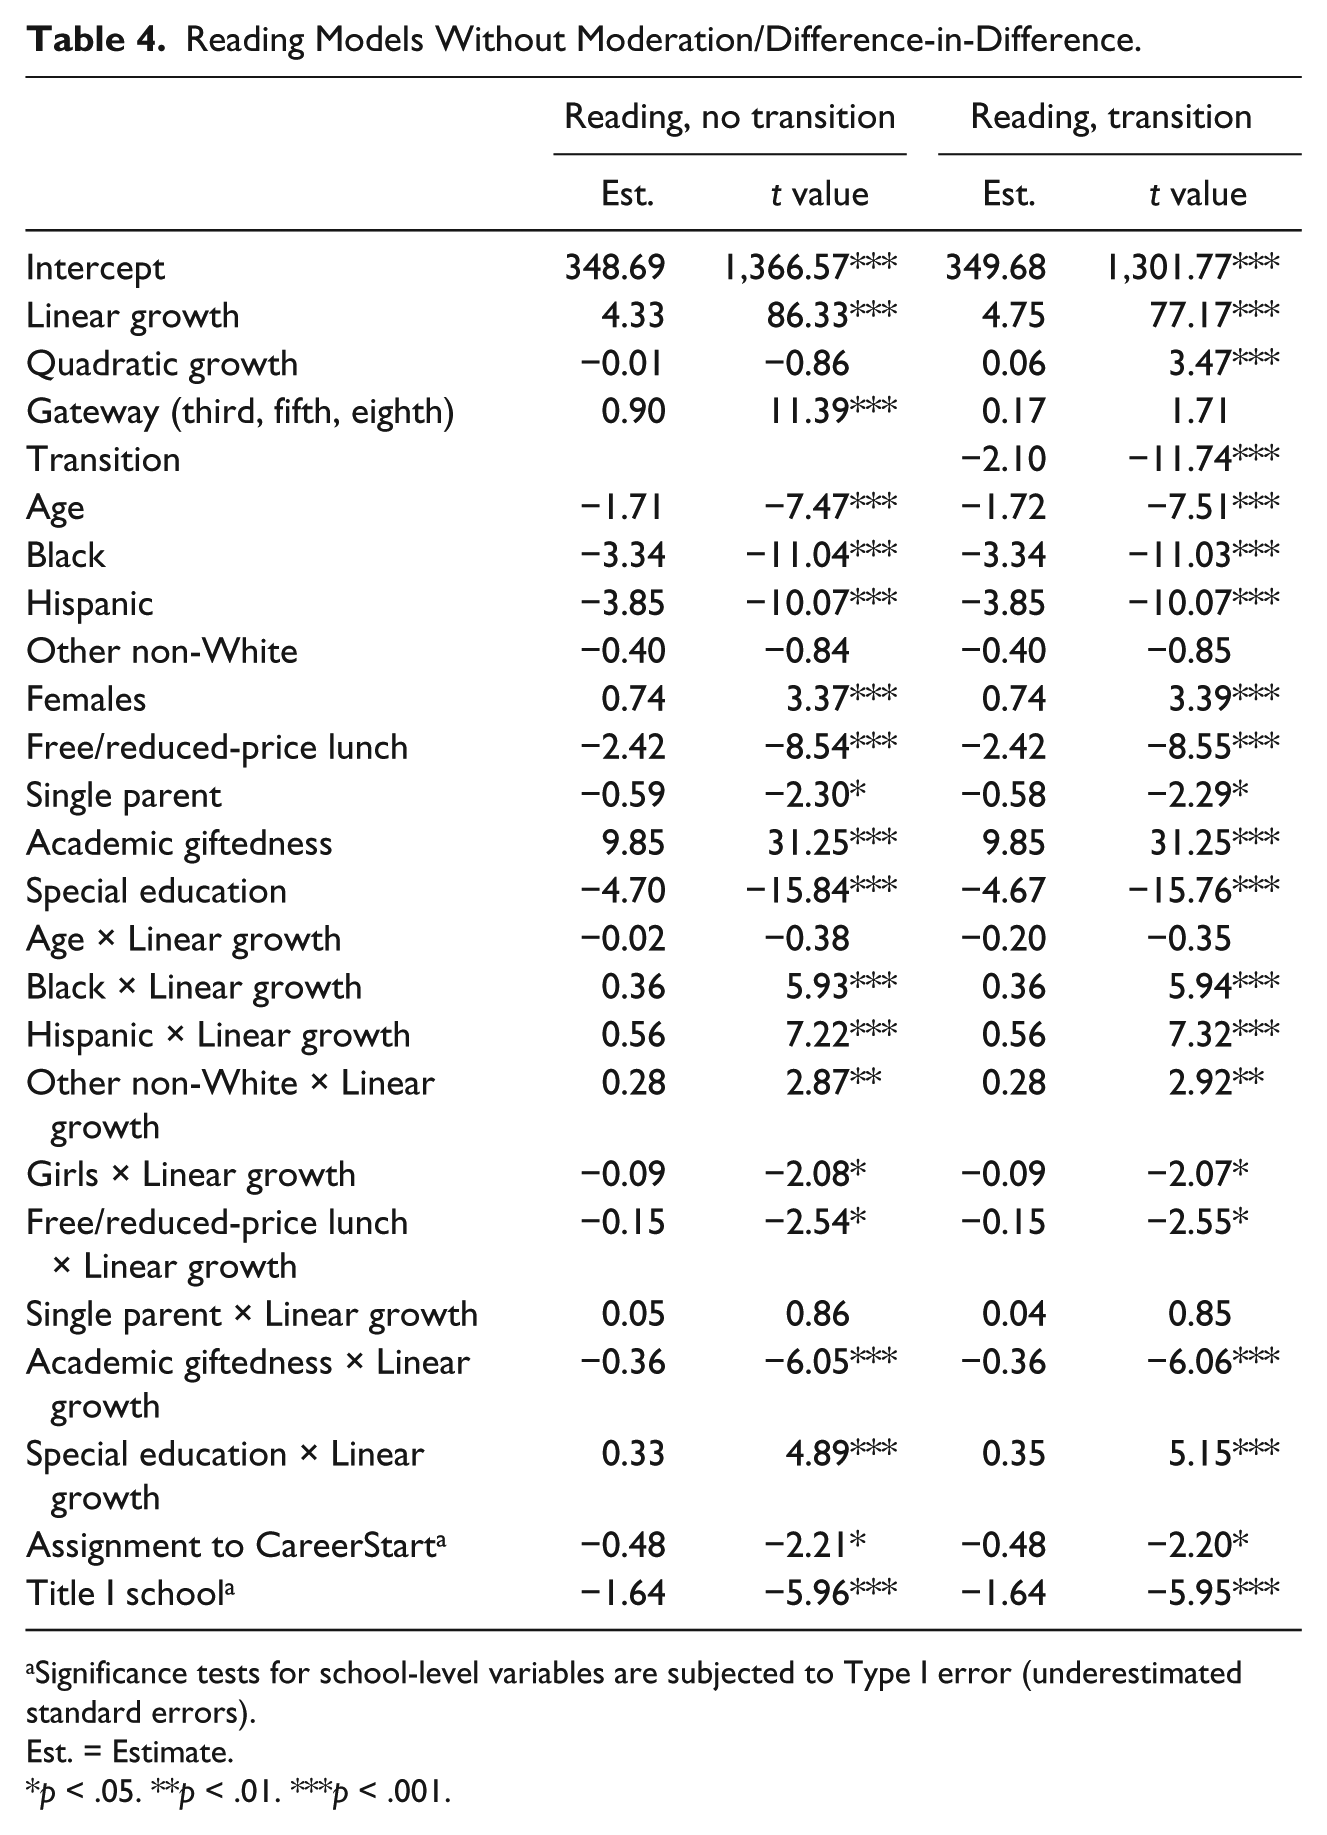
Significance tests for school-level variables are subjected to Type I error (underestimated standard errors).
Est. = Estimate.
p < .05. **p < .01. ***p < .001.
Math Models Without Moderation/Difference-in-Difference.
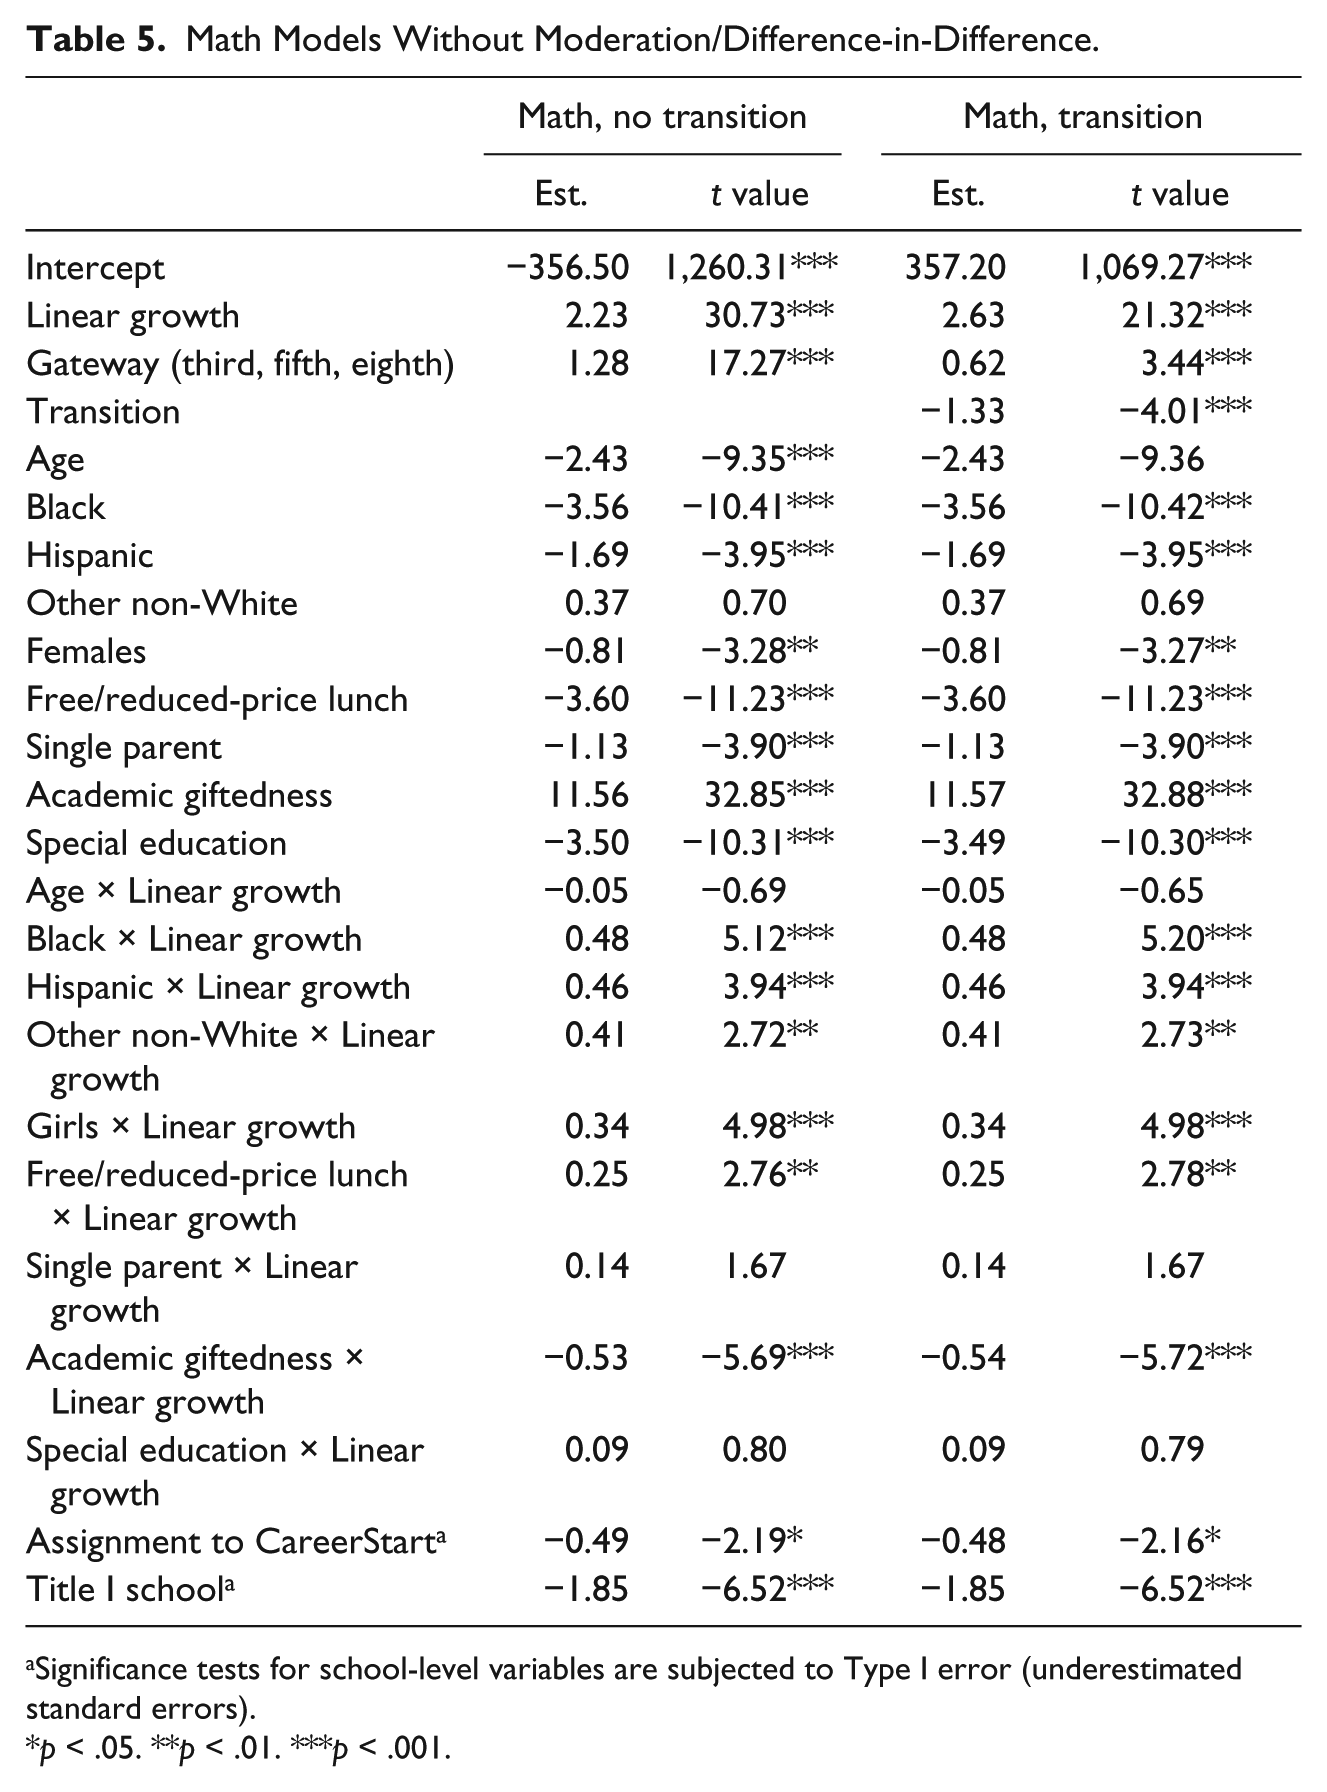
Significance tests for school-level variables are subjected to Type I error (underestimated standard errors).
p < .05. **p < .01. ***p < .001.
Summary Results of Regression Models.
p < .05. **p < .01. ***p < .001.
Linear growth interaction
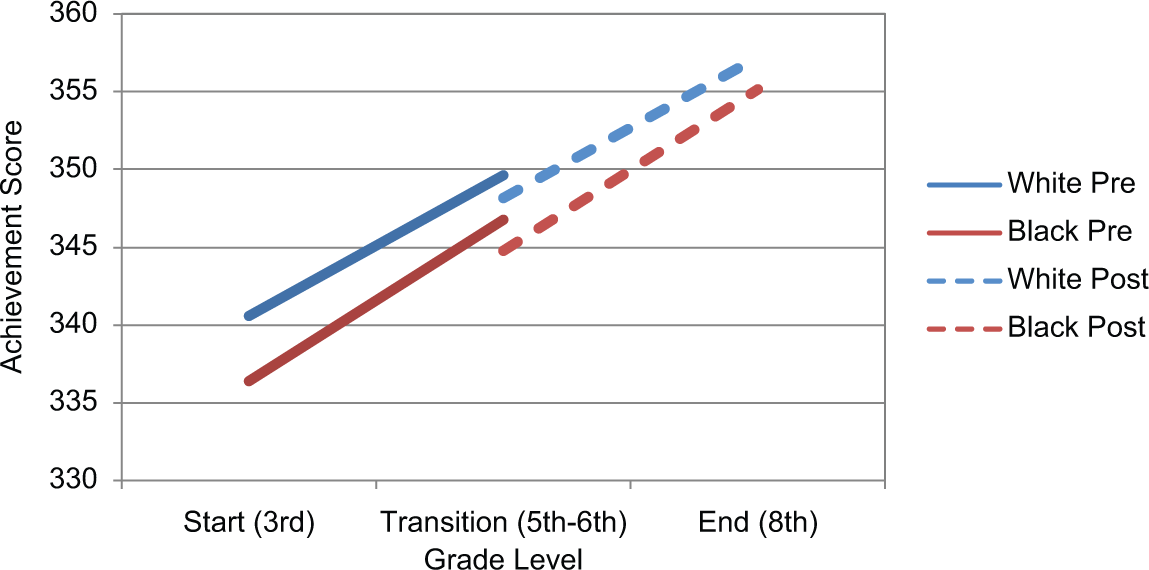
Among the controls in each model were terms containing an interaction between each sociodemographic variable and the linear time trend. Based on the data trends from sociodemographic moderators, differences in learning trajectories (slopes) for sociodemographic groups narrowed in a way that is consistent with efforts to close the achievement gap of youth from disadvantaged backgrounds, particularly minorities. Figure 2 provides an example of how the gap between Black and White youth narrows over the six grade levels. We hypothesized that students from disadvantaged backgrounds would have greater rates of learning over time consistent with closing the achievement gap effects and estimated models with sociodemographic moderation of the linear growth parameter. The average performance of each group reported in Table 1 provides the context for these findings. On reading achievement, our results (Table 5, column 1) confirm that this was the case for Black students, Hispanic students, students receiving special education services, and students not classified as academically gifted. Contrary to other sociodemographics, children with single parents experienced lower linear growth than children from two-parent homes on reading achievement. On math achievement, the results also demonstrate closing the gap trends for Black students, Hispanic students, and students from other non-White races relative to White students, students receiving free or reduced-price lunches, students from single-parent families, students receiving special education services, and students not classified as academically gifted. Gender demonstrated a closing the gap effect with males closing gaps in reading and females closing gaps in math.

Predicted trends for White and Black students.
Overall transition
Tables 4 and 5 shows that the overall adjusted transition effect was negative, large, and significant for both reading (−2.10) and math (−1.33). This confirms our hypothesis that children experience an interruption to their learning trajectories, reflecting a decrease in the expected rate of learning when moving from elementary to middle school. However, these findings also demonstrate that student growth is on average positive over these 6 years with a 4.8 point per year improvement in reading and 2.6 point per year improvement in math. As previously noted, these seemingly contrary findings are consistent with a transition effect defined as a decrease in the expected magnitude in improvement, not in actual scores. In fact, as Figure 1 and Tables 1 to 3 indicated, on average, all groups of students improved from fifth to sixth grade. The regression adds multiple time points, improving reliability and adjusting for regression to the mean. The unconditional difference-in-difference estimates cannot be adjusted for regression to the mean, an effect that is pervasive throughout studies of social and behavioral measures in which extreme scores in one period are invariably attenuated in later periods. The model also includes covariates to adjust for shared variance between (for example) race/ethnicity and gender. Finally, the combined findings of Tables 1 to 4 and Figure 1 also suggest that the average rate of change from year to year is driven primarily by the non-transition years. The adjusted transition effect represented in the regression models therefore represents a conditioned estimate of the amount by which students “fall off” of a reliably estimated long-term growth trend due to the change from elementary to middle school.
In order to circumvent the renorming artifact in math observed in Figure 1 (and reflected in Tables 1 and 2 as well), the math regression reported in Table 5 includes only Grades 5 through 8. A robustness test in which the third and fourth grades were included in the models almost tripled the observed transition effect to −3.56. However, it is not clear what portion of this was due to the renorming artifact and what part may be due to the higher reliability from adding additional pre-transition measures. Furthermore, with six periods, the math model could accommodate the quadratic term (−1.12; p < .001), and this reduced the transition effect to 0.70 (p < .05). Figure 1, which shows immense growth from fourth to fifth grade that inflates the pre-transition trajectory but shows lower average performance in the earlier grades, suggests that a renorming artifact is possible. A second robustness test in which math scores were standardized within each grade level nullified the overall transition effect as expected.
Transition interaction/conditional difference-in-difference
Column 2 of Table 6 reports the transition effect difference-in-difference, showing that nearly all of the characteristics were significant moderators of the transition effect for reading and math. In reading, Black children had a negative and significant interaction coefficient, which indicated that relative to White children these children experienced a more substantial interruption in growth (DID = −1.23; p < .001). This effect is demonstrated in Figure 2; the difference between the solid blue and red lines (pre-transition) is less than the difference between the dashed blue and red lines (post-transition). For math, both Black (DID = −2.60) and Hispanic (DID = −2.59) children differed significantly (p < .001) from White children on their transition experience. Gender was a significant moderator for reading, with females having a less pronounced transition effect (DID = 0.80; p < .01), whereas for math, females and males did not significantly differ. Children receiving free or reduced-price lunch had significantly (p < .001) greater interruptions in both reading (DID = −1.07) and math (DID = −2.79) than children not receiving free or reduced-price lunch. Children living with single parents experienced worse transitions than children from two-parent homes in both reading (DID = −0.80; p < .01) and math (DID = −1.89; p < .001). The transition effects for academically gifted children were significantly (p < .001) less than those for children not classified as either academically gifted or in need of special education services in both reading (DID = 2.05) and math (DID = 3.79); alternatively children receiving special education services experienced significantly (p < .001) worse transitions than other children not classified as academically gifted in both reading (DID = −2.08) and math (DID = −1.50).
Transition main effects/simple slopes
Examining the size and significance of the transition effect for each demographic in the third and fourth columns of Table 6 tell us whether the transition is significant for that group (which is different from examining whether the transition differs between groups as in the case of the difference-in-difference). For reading, all of the reference groups (White children; males; students not from low-income families; two-parent homes; children not classified as academically gifted or receiving special education services) experience a transition that was significantly less than zero. The same was true of all of the focal groups except for academically gifted. For math, only males, children from two-parent homes, and children not classified as academically gifted or receiving special education services had transitions that were significantly different from zero. Alternatively, all of the focal groups experienced a significantly negative transition effect, except for children from other non-White races.
Robustness tests
Most of the robustness tests support these findings. Removing covariates from the models did not change the findings substantively. Removing students in the CareerStart treatment schools also did not alter the estimates. Reconsidering the choice to remove third- and fourth-grade performance from the math models altered the math findings considerably. Black (DID = −1.3) and Hispanic (DID = −1.5) children, children from low-income families (DID = −1.4), children of single parents (DID = −1.1), and academically gifted children (DID = 1.6) all had relatively less extreme but still significant transition effects than in the findings for the models with these grades removed. Females experienced a significant positive transition relative to males (DID = 0.6, p < .05). The reduction in magnitude for children receiving special education services was sufficient to render it not significant. However, it was not clear the extent to which these observed transitions were due to more reliable trends (taking into account additional years) or due to the renorming artifact, which would be expected to decrease the magnitude of the transition (see Figure 1). A second robustness test for the math regression models standardized math end-of-grade performance within grade level, yielding z scores for all six grades. Effects for Black (DID = −0.09, p < .05), Hispanic (DID = −0.10, p < .05), and low-income children (DID = −0.08; p < .01) and children living with single parents (DID = −0.08; p < .05) were negative and significant; other effects (academic giftedness and special education) observed in the main models were not reproduced in this version. We comment on this further in the discussion.
Discussion
In this study, we attempted to explore questions around the direction and size of the elementary to middle school transition effect on academic performance, and whether sociodemographic factors moderate that effect. These data demonstrate large, negative, and significant transition effects for both reading and math achievement. Although students demonstrated growth in achievement scores across the transition in both subjects, this growth was slower than expected during the elementary to middle school transition when we consider students’ growth trajectories. This aligns with much of the previous literature (e.g., Bellmore, 2011; West & Schwerdt, 2012) that suggests academic challenges in the transition.
However, these data imply that the academic transition effect for the elementary to middle school transition should be defined not as a reduction in performance, but an interruption of expected growth reflecting lower than expected performance. To put these magnitudes in perspective, in reading, the average growth is 4.75 points per year (Table 4) and therefore a loss of 2.10 points represented a loss of 44% of 1 year’s worth of learning. In math, the average growth (Table 5) was reported as 2.63, and a loss of 1.33 translates into a loss of 51% 1 year’s worth of learning. In a post hoc analysis, we conducted a statistical test of the magnitudes of the math and reading transitions and found that the reading transition was larger by 0.77 (t = 2.07; p < .05), which translated into a rate of growth for reading that was 18% higher.
Regarding the moderating effects of sociodemographic factors, we found a greater negative transition effect for all of the factors associated with vulnerability in the previous literature (e.g., Gutman & Midgley, 2000). Minority, low income, males, and students from single-parent families and special education status all demonstrated interruptions in growth in large magnitudes as compared with reference groups. Alternatively, students identified as gifted either experienced no interruption at all (reading) or experienced an improvement (math). The magnitude of these differences are almost all statistically significant and range from a loss of 3.86 points (special education/reading) to a gain of 1.72 (gifted/math). The fact that sociodemographic moderators impact the transition effect to this extent is practically meaningful and requires further investigation utilizing methodology that can unpack and compare the transition experience among various groups.
These data also lend support for utilizing longitudinal data. Methodological differences may explain the lack of significance found in some studies (e.g., Gordon, 2011), as mean scores may not significantly decline in the transition year. Examining multi-year trends in school performance is necessary for more precise measures of transition effects. Growth trends are a more reliable estimate of change for students because they eliminate uninformative year-to-year random variation and in particular they adjust for the influence of extreme scores.
Another significant finding that emerged from the data analysis is a closing the gap effect in academic growth from Grades 3 to 8 and how it impacts transition findings. The difference between the slopes of linear growth differed significantly between White and minority students, showing that the racial achievement gap narrows over time within this cohort. In fact, except for other non-White students in reading, all of the sociodemographic moderators demonstrated slopes that were statistically significant, with the groups identified as underperforming in much of the previous literature showing greater increases. Although some research (Gorey, 2009) has connected comprehensive school reform to narrowing Black and White achievement gaps over the elementary and middle school years, it is prudent to interpret these data cautiously. Significant gaps exist when test scores begin to be available (third grade) and still persist into eighth grade. It may simply represent that lower performing groups have more growth potential. Even so, inclusion of the differences in linear growth in the models had a pronounced effect on the findings for the transition. When this interaction between sociodemographic and linear growth is not included in the models, the trends for both groups appear parallel, and the differential growth rate experienced by traditionally lower performing groups manifests on the transition causing the transition effect (loss of growth) for these groups to appear more moderate, that is, the transition effect for minority students was shown to be significantly less pronounced than for White students. When the interaction is added, the change over time is properly decomposed into a larger rate of growth over time with a larger and more negative transition effect for the traditionally lower performing groups.
In addition to sociodemographic differences, these data demonstrate a larger interruption in growth for math as compared with reading in the transition. The renorming in math makes it difficult to speculate about subject area differences, even though previous literature (e.g., Vaughn et al., 2010) showed that reading growth in late elementary and middle school is harder to impact than math. Further research should further examine subject area trends in performance in the transition, including curriculum articulation and classroom pedagogical differences in elementary and middle schools.
Considering the transition effect on sociodemographics within subjects, it appears that both subject and sociodemographics provide a complex constellation to consider in terms of academic growth and the elementary to middle school transition. Research has long examined subject area achievement difference by gender (e.g., Lubienski, Robinson, Crane, & Ganley, 2013) and race (e.g., Froiland & Oros, 2012). Although these data do not allow for deeper investigation or attribution of achievement differences across the transition, it is reasonable to suspect that programming or intervention to support students in the transition may need to differentiate by subject area and sociodemographic or context considerations. Future research should examine these interactions to confirm directional findings and explore causal factors.
Any disruption in growth supports the recurring call for more attention to developmental (e.g., puberty, the development of abstract thinking, emotional, and self-regulation) and contextual changes across the elementary to middle school transition. Previous research indicates the significant impact that development has during the transition, requiring shifting interpersonal and behavioral strategies to keep students engaged in school (Eccles & Roeser, 2009). Furthermore, interruptions in expected growth should raise concern about the lack of continuity between the elementary and middle school context. Scaffolding these environments, including stage-environment fit (Eccles & Roeser, 2009) approaches (e.g., developmentally responsive teaching) or common core curriculum articulation, classroom practices (e.g., cooperative learning, project-based learning; Reys, Reys, Lapan, Holliday, & Wasman, 2003), homework expectations, as well as organization and learning needs (Akos & Galassi, 2004), may buffer disruptions in growth. Previous research and these data suggest sociodemographic moderators impact academic growth in subject areas in complex ways and school districts will need to examine local data trends in context to discover effective interventions and provide targeted and perhaps differentiated support for all students to thrive.
Design Limitations and Implications for Future Research
This study had several strengths, including that it used a large, diverse population of students and longitudinal data in the form of standardized test scores as a proxy for learning. These aspects enabled us to clarify that transition is not a reduction in performance, but an interruption in growth resulting in lower than expected improvement. Furthermore, because the data included survey measures (e.g., number of parents in household), it enabled us to examine risk factors not typically available in administrative data.
However, the study had several limitations. First, the study may have limited generalizability given that it pertains only to one particular urban district. Second, the findings for the transition effect for math are not as conclusive as we would like given the problems with renorming, which also impacted moderation findings. These problems can be addressed in follow-up studies that limit the number of moderators to be examined, but that incorporate additional cohorts of students from a larger geographical area. Finally, these findings are descriptive and although we speculate on possible influences and use a method (difference-in-difference) that can be used in quasi-experimental causal research, we have made no effort to ascribe causality to any student, teacher, or school characteristics that may drive the transition effect.
Although many factors have been examined (e.g., teacher preparation for early adolescents, Theriot & Dupper, 2009; age or varied grade level gateways, Cook, MacCoun, Mushkin, & Vigdor, 2008; Lippold, Powers, Syvertsen, Feinberg, & Greenberg, 2013; or K-8 configurations, Rockoff & Lockwood, 2010), understanding the root cause of transition effects is an ongoing challenge. Further research must unpack the transition to prevent the cascade of negative impacts that are attributed to the transition. In addition, the trends in performance after the transition effect should be re-examined with the transition effect as a predictor to determine whether the magnitude of the transition has a long-term effect on the rate of growth or an impact on later transitions (e.g., middle to high school transition).
Footnotes
Declaration of Conflicting Interests
The author(s) declared no potential conflicts of interest with respect to the research, authorship, and/or publication of this article.
Funding
The author(s) received no financial support for the research, authorship, and/or publication of this article.