
Abstract
Observational methods are increasingly used to assess the impact of school-based interventions. Yet, few studies have used observations in nonclassroom settings, such as hallways or the cafeteria, or explored aspects of the school context that may be related to the observed behavior. The current study used a multilevel approach to examine associations between observed rule violations and contextual predictors, including characteristics of observations (e.g., location and number of students present) and schools (e.g., perceived management, discipline referrals). Analyses were conducted on data from 37 elementary schools. Within schools, rates of physical and verbal violations varied by location and significantly higher rates of rule violations were observed in areas with high student density. Between schools, only a negative association for observed verbal violations and staff perceptions of the status of nonclassroom management systems was significant. The significance and relevance of these findings for both educators and applied researchers are discussed.
Behavior problems are significant concerns in schools because they impair school functioning at multiple levels; this in turn negatively impacts staff, teachers, and students. Problem behaviors are the most common reasons for office referrals and suspensions (Irvin et al., 2006; Pas, Bradshaw, & Mitchell, 2011; H. M. Walker, Horner, Sugai, & Bullis, 1996) and also contribute to teacher and staff turnover (Ingersoll, 2001). Verbally and physically aggressive behavior problems challenge teachers’ ability to manage their classrooms; not surprisingly, they are also related to psychosocial adjustment problems for elementary school students (Ialongo et al., 1999; Snyder et al., 2003), and negatively impact students’ ability to learn. In contrast, student engagement and on-task behaviors in the classroom have been linked with better reading and math achievement (Rudasill, Gallagher, & White, 2010).
Approximately 37% to 53% of incidents of problem behavior occur outside the classroom and within common areas, such as the hallway or cafeteria (Leff, Costigan, & Power, 2004; Lockwood & National Institute of Justice, 1997; Spaulding et al., 2010). Problem behaviors in nonclassroom settings, such as hitting or making derogatory remarks, are typically recognized as rule violations that disrupt the order and safety of the school environment (Pellegrini, 2001). They may also diminish students’ and adults’ perceptions of order within a school (Plank, Bradshaw, & Young, 2009) and psychologically influence not only the targets of the violations but also those who witness the violations. For example, sixth graders who witnessed other students being harassed had increased feelings of anxiety and school dislike (Nishina & Juvonen, 2005). The current study used a multilevel approach to examine associations between rates of observed rule violations in nonclassroom settings in relation to the characteristics of observations (e.g., location and number of students present) and schools (e.g., perceived management systems, total school enrollment). Such work on “hot spots” for problem behavior has important implications for both educators and applied researchers interested in improving school climate.
Behavior Problems in Nonclassroom Settings
Students are typically allowed greater independence in nonclassroom settings (e.g., begin to change classes, visit lockers) as they transition into early adolescence; this increases opportunities for rule violations, as there is typically less supervision during these times. In fact, there is a general peak in the rates of peer-directed aggressive behavior and diminished perceptions of safety through elementary into middle school (Bradshaw, Sawyer, & O’Brennan, 2007; Pellegrini & Bartini, 2000). As a result, early adolescence is a particularly vulnerable time for exposure to rule violations in nonclassroom settings. Yet, relatively little is known about nonclassroom contexts in elementary schools. Research does show that elementary school students receive a large portion of disciplinary referrals from nonclassroom settings (Irvin et al., 2006; Irvin, Tobin, Sprague, Sugai, & Vincent, 2004; Spaulding et al., 2010), but few observational studies have validated the high prevalence of physical and verbal rule violations across school settings or examined aspects of the school context associated with observed rule violations. A better understanding of elementary students’ experiences in nonclassroom settings is needed in order to identify factors associated with rule violations that may have implications for behaviors in early adolescence.
Assessing Nonclassroom Settings
Much of the extant research on nonclassroom settings in elementary school has focused on survey data from teachers, staff, and students to assess school safety and student behavior (Mitchell, Bradshaw, & Leaf, 2010). Although surveys and administrative data can be efficient approaches to assessing student behavior, there is likely variation in staff members’, teachers’, or students’ sensitivity to rule violations and inclination to report them (Waasdorp, Pas, O’Brennan, & Bradshaw, 2011). Moreover, survey responses typically describe behaviors that occur in multiple school contexts or average behaviors across school settings; asking students or staff about each context individually can quickly become costly and time intensive (LaRusso, Brown, Jones, & Aber, 2009). An alternative measurement approach is the use of standardized observations, which can provide objective assessments of behavior in school settings and allow for the documentation of detailed information about the context for the behavior.
A growing number of measures has been developed which provides structured observational data on student behavior in nonclassroom settings such as playgrounds (see review in Leff & Lakin, 2005) and the cafeteria (McCurdy, Lannie, & Barnabas, 2009). A few studies have described the prevalence of rule violations in nonclassroom settings in elementary schools. For example, one study reported an average of four disruptive behaviors observed per minute in elementary school cafeterias (McCurdy et al., 2009). In studying nonclassroom problem behaviors, it is important to distinguish between physical and verbal rule violations because there are differences in the ways that students and adults observe and respond to these violations. For example, school staff typically rate verbal or social/emotional confrontations as less problematic or severe than physical aggression (Hazler, Miller, Carney, & Green, 2001). Observational studies can supply more objective comparisons of rates of physical and verbal harassment. One such observational study found that kindergarten and first-grade students were targets of physical or verbal harassment by peers on the playground at comparable rates, experiencing one type of harassment or the other about once every 3 to 6 minutes (Snyder et al., 2003).
Characteristics of Observations and Schools Associated With Rule Violations
Additional research is needed to better understand the extent to which observed rule violations are associated with characteristics of observations and schools. Most observational studies of nonclassroom contexts have focused on a single location within a school (McCurdy et al., 2009; Snyder et al., 2003), but the identification of “hot spots” for rule violations across multiple nonclassroom locations could be useful for planning intervention efforts. Observational data could also be used to explore overcrowding within nonclassroom spaces. Although interviews with middle school students identify crowding as a reason for feeling unsafe in a particular location, elementary students did not raise this as a concern (Astor, Meyer, & Pitner, 2001). Observational data are not available to confirm student perceptions of crowding in relation to rule violations and students’ problem behaviors.
Characteristics of schools could be associated with observed rule violations as well. Rule violations may vary as a function of staff perceptions of behavior management and school-level indicators of disorder, such as enrollment, faculty turnover, and the proportion of low income students. For example, active supervision and proactive management of nonclassroom settings have been linked with reduced problem behaviors such as running, hitting, yelling (Colvin, Sugai, Good, & Lee, 1997), physical aggression, spreading of rumors, and property vandalism (Blosnich & Bossarte, 2011). Therefore, lower rates of rule violations should be observed if staff members perceive that there are systems in place to manage behavior in nonclassroom settings. Research has demonstrated that teachers’ assessments of the presence of classroom management are important; for example, one study found that students were 60% more likely to have received 20 or more disciplinary referrals if they were in classrooms rated by the teacher as having poor classroom management (Pas et al., 2011). From this, one might expect a parallel association for nonclassroom contexts, such that more frequent rule violations were hypothesized to occur when there is poor management in nonclassroom contexts than when there is effective management. The association between staff members’ ratings of whether systems are in place to prevent rule violations in nonclassroom settings and observed rule violations in those settings has not yet been examined. However, further information about the extent to which staff perceptions of whether effective management is in place map onto researchers’ observations of rule violations would be useful for informing schoolwide prevention and behavior management efforts.
Another characteristic of schools that we expected to be associated with rate of observed rule violations was the rate of office discipline referrals. Although most schools do not regularly collect observational data of nonclassroom settings, many schools do keep track of discipline referrals. We expected higher rates of discipline referrals to be predictive of higher rates of observed rule violations across the nonclassroom settings. Previous research demonstrates that higher rates of office discipline referrals are associated with problems such as student misbehavior, victimization, academic failure, juvenile delinquency, and behavioral disorders (for a review see Irvin et al., 2004). In elementary school, referrals occur most frequently for students who are fighting (32.4% of all referrals) or defiant (29%; Spaulding et al., 2010). Discipline referrals are frequently tracked electronically in large databases (Spaulding et al., 2010); teacher report has also been demonstrated as a valid source for tracking discipline referrals (Pas et al., 2011). Finally, characteristics of schools such as total student enrollment, faculty turnover, and the percent of students eligible for free/reduced meals were expected to be positively related to the frequency of rule violations, given that prior research has suggested that these variables are common indicators of school disorder (Barnes, Belsky, Broomfield, & Melhuish, 2006; Cushing, Horner, & Barrier, 2003; Ingersoll, 2001). However, few studies have examined the extent to which these school-level variables are associated with observations of behavior problems in nonclassroom settings.
The Current Study
The purpose of the current study was to examine school contextual predictors (e.g., location, density, perceived management systems and discipline referral rates) of student rule violations in observed nonclassroom contexts. The data for this study come from 37 elementary schools across five Maryland school districts participating in a randomized controlled trial of a schoolwide prevention strategy called Schoolwide Positive Behavior Interventions and Supports (SW-PBIS; Horner, Sugai, & Anderson, 2010; Sugai & Horner, 2006). Although intervention status was not of interest in the current study, we included it as a covariate in the analyses. We used multilevel modeling to examine the relationships between characteristics of observations (e.g., location and number of students present) or schools (e.g., perceived management systems, total school enrollment) and observed physical and verbal rule violations across nonclassroom settings using the Student Interaction in Specific Settings (SISS) tool (Cushing et al., 2003). With regard to the specific characteristics of the observation area, we predicted that higher density areas would have higher rates of observed rule violations and that the highest rates of physical and verbal rule violations would take place on the playground. Between schools, we were particularly interested in staff perceptions of behavior management systems as a potential contextual influence on students’ nonclassroom problem behaviors. Specifically, we hypothesized that staff reports of effective behavior management systems being in place in nonclassroom settings would be associated with lower rates of observed student rule violations. We also hypothesized that higher rates of office discipline referrals, enrollment, faculty turnover, and percent of students eligible for free/reduced meals would be associated with higher rates of observed student rule violations. This research is intended to inform future use of observational measures of students’ behavior problems in various “hot spots” across the school, which may in turn be instructive for evaluating the impact of schoolwide prevention programs (Rusby, Crowley, Sprague, & Biglan, 2011).
Method
Sample
The 37 elementary schools (kindergarten through grade 5) enrolled in the project over the course of 2 consecutive years. All data for the current study were collected in the spring (i.e., April-May) of the final year of the project. The school enrollment averaged 472.35 (SD = 134.64) and the average student: teacher ratio was 21.15 to 1 (SD = 4.84). Staff members (n = 1,660) were 91% female, 88% Caucasian, 10% Black, and 49% were under the age of 40. Many participating staff members were classified as general educators (50%), but administrators (4%), special educators (9%), and student support staff members (37%) were also included. The following roles were included in the student support staff category: nurse, counselor, school psychologist, teacher assistant, and family/community member volunteer. The teachers averaged 11.5 years of teaching experience and mean faculty turnover rates were 14.54 (SD = 12.19). Of the 37 elementary schools, 21 were randomly assigned to implement SW-PBIS and 16 served as comparisons. On average, students in the 37 elementary schools were 47% female, 48% Caucasian, 43% Black, 4% Hispanic, and 5% Other. Student mobility (i.e., sum of the percent of students new to a school and the percent of student withdrawals) averaged 23.04 (SD = 10.10). Parents were informed in writing about the purpose of the study and could indicate using a waiver of active consent process that they did not want their child to participate in the data collection activities. Because of the de-identified nature of the observations, all students were included that were observed, regardless of whether or not passive parental consent for participation was obtained. All procedures were institutional review board (IRB) approved.
Measures
Student Interaction in Specific Settings
Students’ rule violations were observed using the SISS (Cushing et al., 2003) tool. Trained observers, blind to treatment condition, conducted at least sixty 5-minute observations of a 10 foot × 20 foot physical space per school (
Observations were scheduled systematically, such that hallways were only observed during transition periods, the cafeteria was only observed during lunch, and the playground was only observed during recess. Observers were instructed to select a mix of areas within each location type. In the cafeteria, observed spaces could be a combination of lunch tables or the lunch line. Observers were instructed to observe all lunch periods (many containing different grade levels), but were not allowed to observe the same table/location within the cafeteria twice during the same lunch period. For playground observations, observers were instructed to select a piece of playground equipment to watch and, as appropriate for a 10 foot × 20 foot space, the area surrounding the piece of equipment. Observers were instructed to select a mix of different hallways to observe during transition periods. During arrival and departure times, observers may have watched areas close to the school entrance as well as further away, such as at the flagpole. Observers were not given specific instructions regarding the number of students to expect in selected areas, with just one exception. If there were zero students within the 10 foot × 20 foot space for one full minute, observers were allowed to switch to the closest space that did have students. The above guidelines resulted in a mix of high and low student density observations.
Observers coded for the occurrence of 11 types of rule violations which varied from minor rule violations to high intensity behaviors. Rates of students’ physical and verbal rule violations were the outcomes of interest. A summary score for physical rule violations was created by summing the number of tallied instances including violations such as running (moving swiftly so both feet leave the ground or taking stairs two at a time), consuming food/drink in areas where it was not allowed, and littering (discarding rubbish outside trash/recycling containers). Physical rule violations also included moderate and high intensity behaviors such as inappropriate affection (affection displayed toward another beyond handholding), property misuse (physical contact or destruction of property), horseplay (nonserious physical contact), or aggression (physical contact from one student to another where injury may occur). The summary score for verbal rule violations was created by summing the number of tallied instances of teasing (making fun by name-calling or gestures), sustained noise or talking back to an adult, profane language or gestures, or verbal abuse (sustained profanity, sexual or derogatory comment directed at another person who was present). Operational definitions of all observational codes are listed in the appendix. Observers received training on school rules prior to observations and did not code behaviors unless they were rule violations. For example, running is typically acceptable behavior on an elementary school playground and would not have been coded as a rule violation in this context. Likewise, consumption of food was not considered a rule violation in the cafeteria. Because the number of students present in a nonclassroom area could vary over the course of the observation, raters noted whether 10 or more students were ever present in the area being observed as an indicator of student density (472 of 2,291 observations were “high” density).
Earlier work by Cushing et al. (2003) in 23 elementary and middle schools demonstrated that the SISS is a reliable and valid measure for this purpose, and that the SISS captured stable patterns of behavior after collecting 5 hours of 5-minute segments. Within these guidelines, observers in the current study conducted 60 or more 5-minute observations per school. Observations were completed across at least three separate days during a 2-week period for each school. A total sample of 2,291 five-minute segments was used for the current study.
A cadre of observers was hired and trained to use a standardized procedure for selecting the locations of the observations and conducting the observations. The vast majority of observers were undergraduate and graduate research assistants. Observers were trained on the SISS following a three-stage process: (a) an initial day-long didactic training session at the school, (b) on-site practice for a full day, and (c) booster sessions, if needed. Observers also received training on how to select a 10 foot × 20 foot observation field during the didactic session; measuring tape was available. Each observation field was approximately the size of a lunch table or a section of the hallway. Each observer received a manual, which included operational definitions of all codes and step-by-step observational recording procedures. A series of 21 vignettes, which included the types of rule violations, was presented to the observers and followed by live practice in schools.
Observers were calibrated by trainers at the schools. For the set of 10 observations, the trainer selected a space, and the observer and trainer coded independently. Percent agreement equaled the total number of agreements divided by the total number of agreements and disagreements, multiplied by 100% (Barlow & Hersen, 1984). Observers were considered calibrated once they met a criterion of 85% agreement with the trainer. Each observer was also recalibrated to prevent drift, during which 10 observations were conducted, which was approximately 17% of the total number of observations conducted. The recalibrations were performed on-site, during data collection, by one of the trainers to ensure that the 85% agreement was maintained. All observers reached agreement at levels of 90% or above during initial and follow-up calibration sessions. Weighted kappas calculated from initial reliability averaged .99 and from recalibration sessions averaged .98 (Fleiss & Cohen, 1973). Weighted kappas describing interrater reliability for individual behaviors and composite behaviors (verbal, physical, combined) are provided within Table 2.
Effective Behavior Survey
The Effective Behavior Survey (EBS; Lewis & Sugai, 1999; Sugai, Todd, & Horner, 2000) asks staff to evaluate their school’s behavior support systems at four levels: schoolwide, nonclassroom, classroom, and individual student. The scale was developed to support schools in planning and evaluating behavior support systems. Staff members rated items on a 3-point scale, indicating whether the support is in place (0), partially in place (1), or not in place (2) for the school. The subscale indicating the current status of supports in nonclassroom settings was used for the current study. Sample items from this subscale include “Staff/volunteers actively supervise (move, scan, and interact with) students in nonclassroom settings,” and “Scheduling of student movement ensures appropriate numbers of students in nonclassroom spaces.” The nonclassroom subscale represents the average score across nine items, such that a higher score indicates more positive behavior supports. The reliability and validity of the EBS and its subscales have been demonstrated through previous research (Safran, 2006; Walker, Cheney, & Stage, 2009). Safran (2006) found the internal consistency reliability for the total scale to be moderate to high, but the reliability for the nonclassroom subscale was not as strong (α = .60). However, the reliability for nonclassroom subscale with the current sample was much stronger (nine-item α = .86). All full- and part-time instructional and support staff members were asked to complete the EBS; eligible support staff members included nurses, counselors, school psychologists, teacher assistants, and family/community member volunteers. Approximately 82% of all eligible staff members completed the EBS. Individual-level data were aggregated to create a score at the school level.
Office discipline referrals
Classroom teachers completed the Teacher Observation of Classroom Adaptation–Checklist (TOCA-C; Koth, Bradshaw, & Leaf, 2009), which is a checklist version of the Teacher Observation of Classroom Adaptation (Werthamer-Larsson, Kellam, & Wheeler, 1991). A single item is of greatest interest here; the item asks how often each student has been sent to the principal’s office for disciplinary reasons since the start of the year. Teachers were asked to report whether the student had been sent to the principal’s office 0, 1, or 2 or more times. These data were then dichotomized into a “low” referral rate for 0 or 1 disciplinary referrals and a combined “medium/high” referral rate for 2 or more referrals. Previous research has indicated this teacher-report measure of discipline referrals to be a valid indicator (Pas et al., 2011). The TOCA-C was completed for 93% of students from grades kindergarten through 5. Data for students within each school were aggregated such that the score for the current study represents a school-level average. This average follows a normal distribution (
School-level characteristics
Several school-level demographic indicators were obtained from the Maryland State Department of Education, including school enrollment, faculty turnover as measured by the percentage of new faculty from the previous school year to the current school year, percentage of students eligible for free and reduced meals, and intervention condition (0 = control, 1 = SW-PBIS). Study cohort was also included, as the schools were enrolled in the project over the course of two consecutive school years. Descriptive statistics and correlations of school-level characteristics are provided in Table 1.
Means, Standard Deviations, Ranges, and Correlations for School-Level Characteristics (n = 37 Schools).
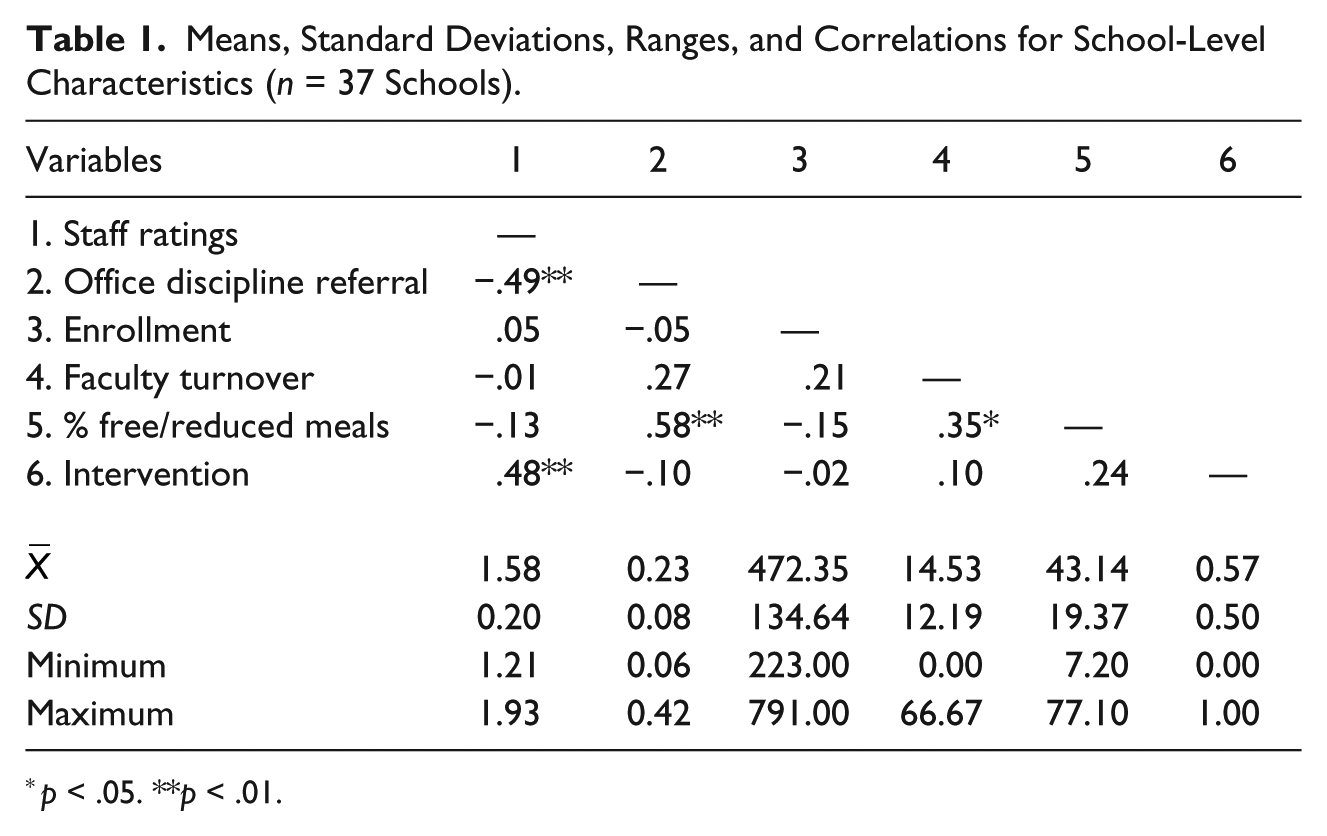
p < .05. **p < .01.
Analysis
Multilevel modeling was selected for the analysis because the data are nested, with observations being nested within schools (Raudenbush & Bryk, 2002). Two-level models were estimated using SAS Proc Mixed software 9.3 (SAS Institute Inc., 2011) to examine the relationships between characteristics of observations or schools and observed rule violations. Three outcomes were investigated: verbal rule violations, physical rule violations, and verbal and physical violations combined.
The three outcome variables were positively skewed, such that the mean rate of behavior was greater than the median for each (see Table 2, for skewness and kurtosis). The variance was greater than the mean for each, indicating overdispersion as well. Two steps were taken to appropriately deal with the nonnormal distributions of the outcome variables. First, each outcome was capped for the highest 1.5% of values. Only 1.5% of observations had verbal rule violation rates of 5 or greater, so verbal disruptions were capped at 5. Likewise, physical rule violations were capped at 19, and the combination of physical and verbal was capped at 22. Second, the distribution of each outcome was accounted for during analysis through the use of a negative binomial model. The results of analyses using a normal, Poisson, and negative binomial distribution were compared, but the fit indices (i.e., −2 log likelihood, Akaike Information Criterion, Bayesian Information Criterion, Pearson chi-square/degrees of freedom) showed that the negative binomial model was the most appropriate approach. Because regression coefficients in a negative binomial model are reported on a log scale, we transformed coefficients to incidence rate ratios (IRRs), which were calculated through an exponential function, raising the constant e, which is approximately 2.71828, to the power of each coefficient.
Average Observed Rule Violations During a 5-Minute Observation (n = 2,291).

Student density (ever 10+ people) was dichotomous, so reliability was calculated by dividing the number of exact agreements with the total number of agreements and disagreements. Reliability for this variable is .81.
At Level 1, we modeled the associations between rule violations and characteristics of the observation: student density in terms of whether 10 or more students were ever present in the area being observed, and location for the observation (cafeteria, hallway, playground, arrival, or departure areas). Location was entered as four dummy-coded variables; the playground was used as the reference location. A random effect was included for density, as the relationship between density and observed frequency of rule violations could vary between schools.
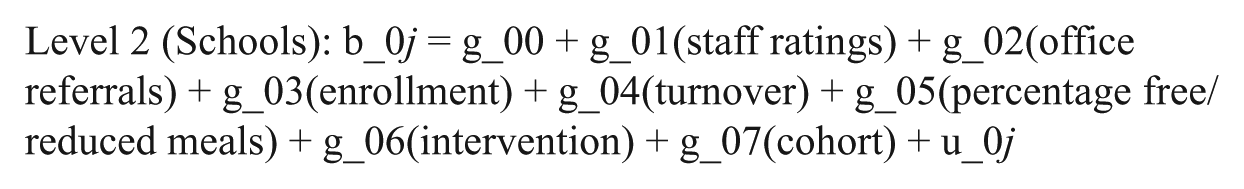
We also examined associations between observed rule violations and characteristics of schools at Level 2 in all conditional models. This included relationships with staff perceptions of behavior management systems in nonclassroom settings from the EBS and teacher reports of office discipline referrals for each student. Also at Level 2, we included total school enrollment (grand mean centered), faculty turnover rates, percentage of students eligible for free/reduced meals, intervention condition, and study cohort.
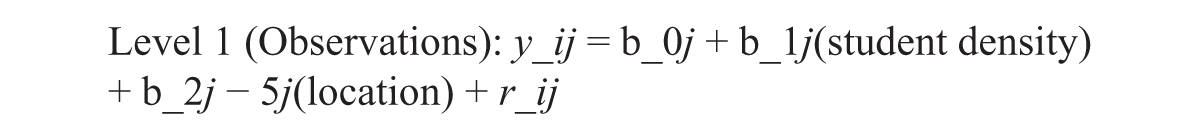
We entered a series of models to closely examine Level 1 predictors. The first model was unconditional. In the second model, we only included location at Level 1 and added all predictors at Level 2. In the third model, we included a fixed effect for density. We added a random effect for density in the fourth model. In the fourth and final model, observed (verbal, physical, combined) rule violations for observation i in school j includes the intercept or average rate of rule violations, plus the contributions of location and density. The intercept is further defined at Level 2 by staff reports of behavior management systems, teacher-reported office referrals, enrollment (grand mean centered), faculty turnover, percent free/reduced meals, intervention condition, and cohort. The intercept and density were allowed to vary across schools. The equations are as follows:

Three sets of analyses were conducted in addition to the multilevel modeling. Prior to multilevel analyses, we estimated correlations among school characteristics at Level 2 to check for multicollinearity (see Table 1). Second, we were interested in the differences in rates of observed rule violations between nonclassroom locations. To assess this while appropriately adjusting for the other effects in the multilevel model, we conducted a Type III F test and then examined all pairwise comparisons using the Tukey-Kramer method (Hayter, 1989). Third, we examined whether there were differences in observed density between nonclassroom locations using a simple ANOVA followed by the Tukey method to test pairwise differences.
Results
Across the 2,291 observations conducted in the 37 elementary schools, an average of 3.90 (SD = 4.81) rule violations was observed every 5 minutes in nonclassroom locations. The vast majority of observed behaviors were physical in nature (
Conditional models are presented in Tables 3 to 5. IRRs are reported for each predictor to ease interpretation. At Level 1 (observations), we were interested in relationships between observed rule violations and features of observations. Location of observation played an important role for all outcomes. The incident rate for the hallway was significant for all outcomes. For example, for verbal rule violations, the incident rate for the hallway was 0.49 times the incident rate for the reference location, the playground, holding the other variables constant. Similarly, the incident rate for physical rule violations in the hallway was 0.62 times the incident rate for the playground. Student density was also significantly related to observed frequency of violations for all outcomes. If there were ever 10 or more students in the defined observation space, the rate of observed violations was significantly higher (p < .0001). The percent change in the incident rate of verbal rule violations was 183% whenever 10 or more students are present; the percent change in the incident rate was 218% for physical rule violations. At Level 2 (schools), the rate of observed verbal rule violations was negatively associated with staff perceptions of behavior management systems in nonclassroom areas (B = −3.08, p < .05, IRR = 0.05). When staff reported more systems being in place to manage behavior in these areas, significantly fewer verbal violations were observed. This predictor was also significant in initial models for physical rule violations, but the finding did not hold when a random effect for density was added. Office discipline referral rates did not significantly predict observed rule violations.
Fixed Effects Estimates and Variance-Covariance Estimates for Models of Verbal Rule Violations.
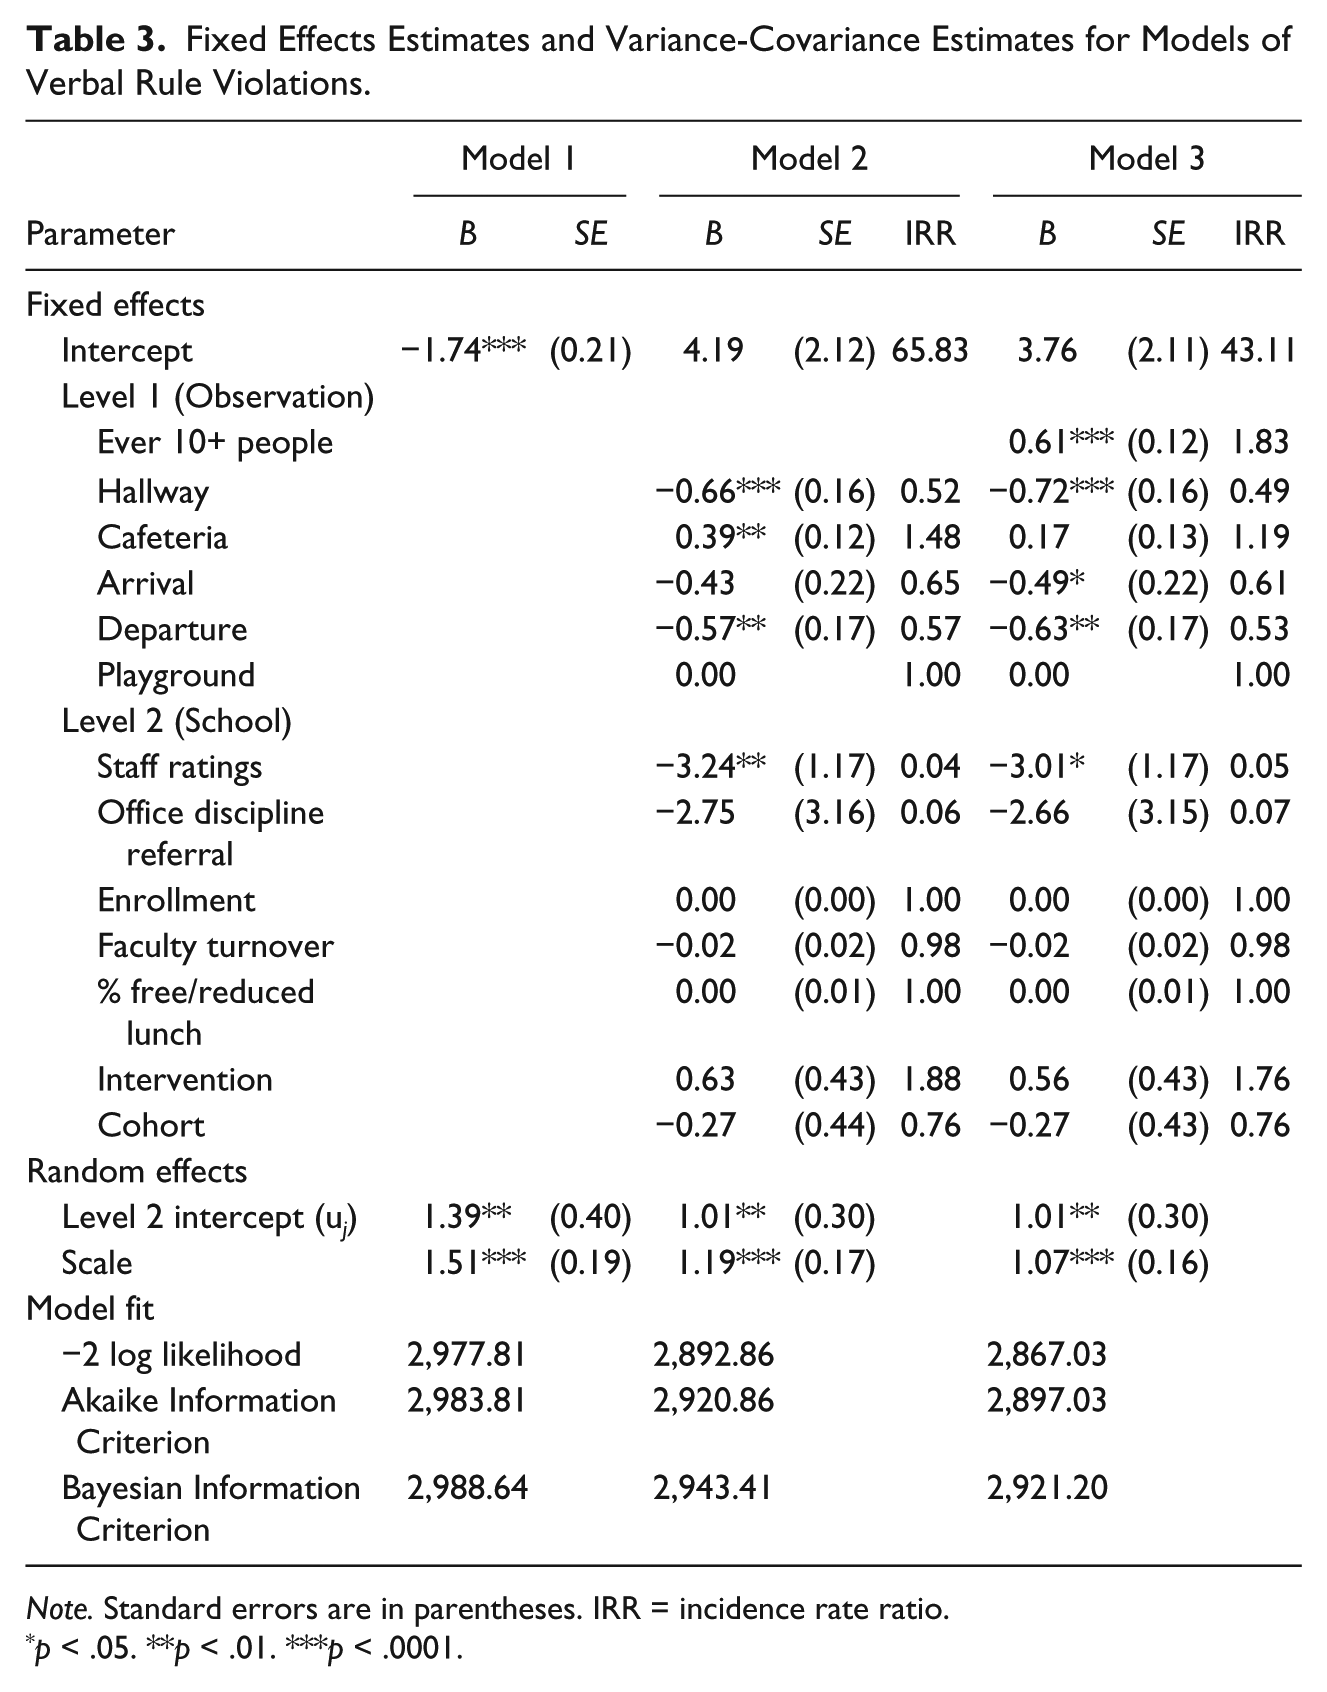
Note. Standard errors are in parentheses. IRR = incidence rate ratio.
p < .05. **p < .01. ***p < .0001.
Fixed Effects Estimates and Variance-Covariance Estimates for Models of Observed Physical Rule Violations.
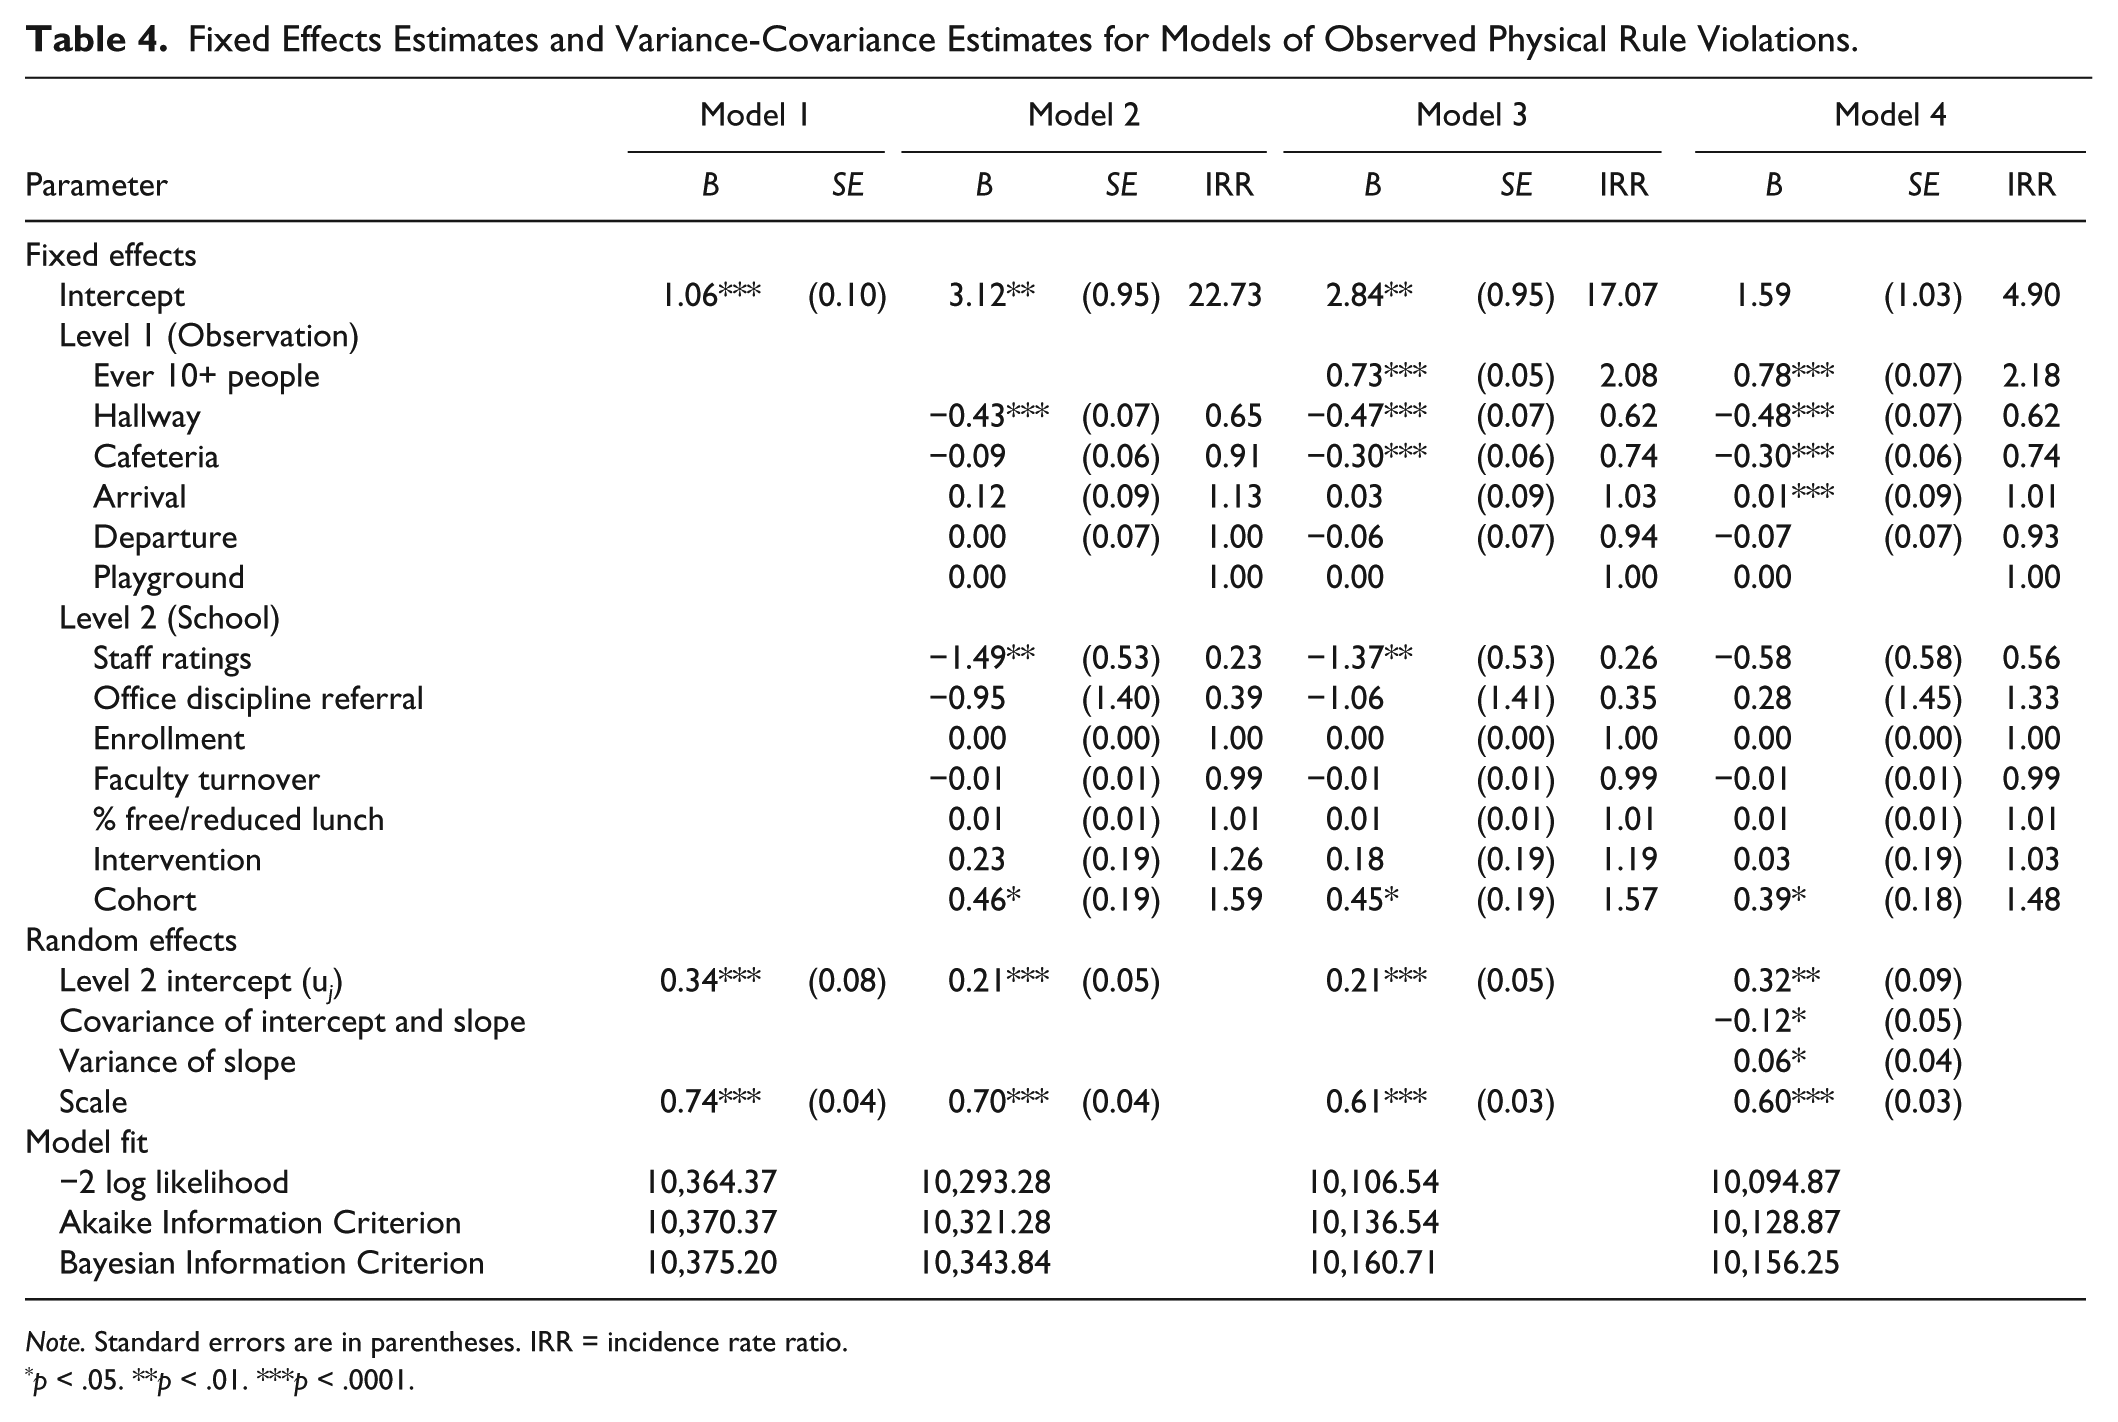
Note. Standard errors are in parentheses. IRR = incidence rate ratio.
p < .05. **p < .01. ***p < .0001.
Fixed Effects Estimates and Variance-Covariance Estimates for Models of Observed Physical and Verbal (Combined) Rule Violations.
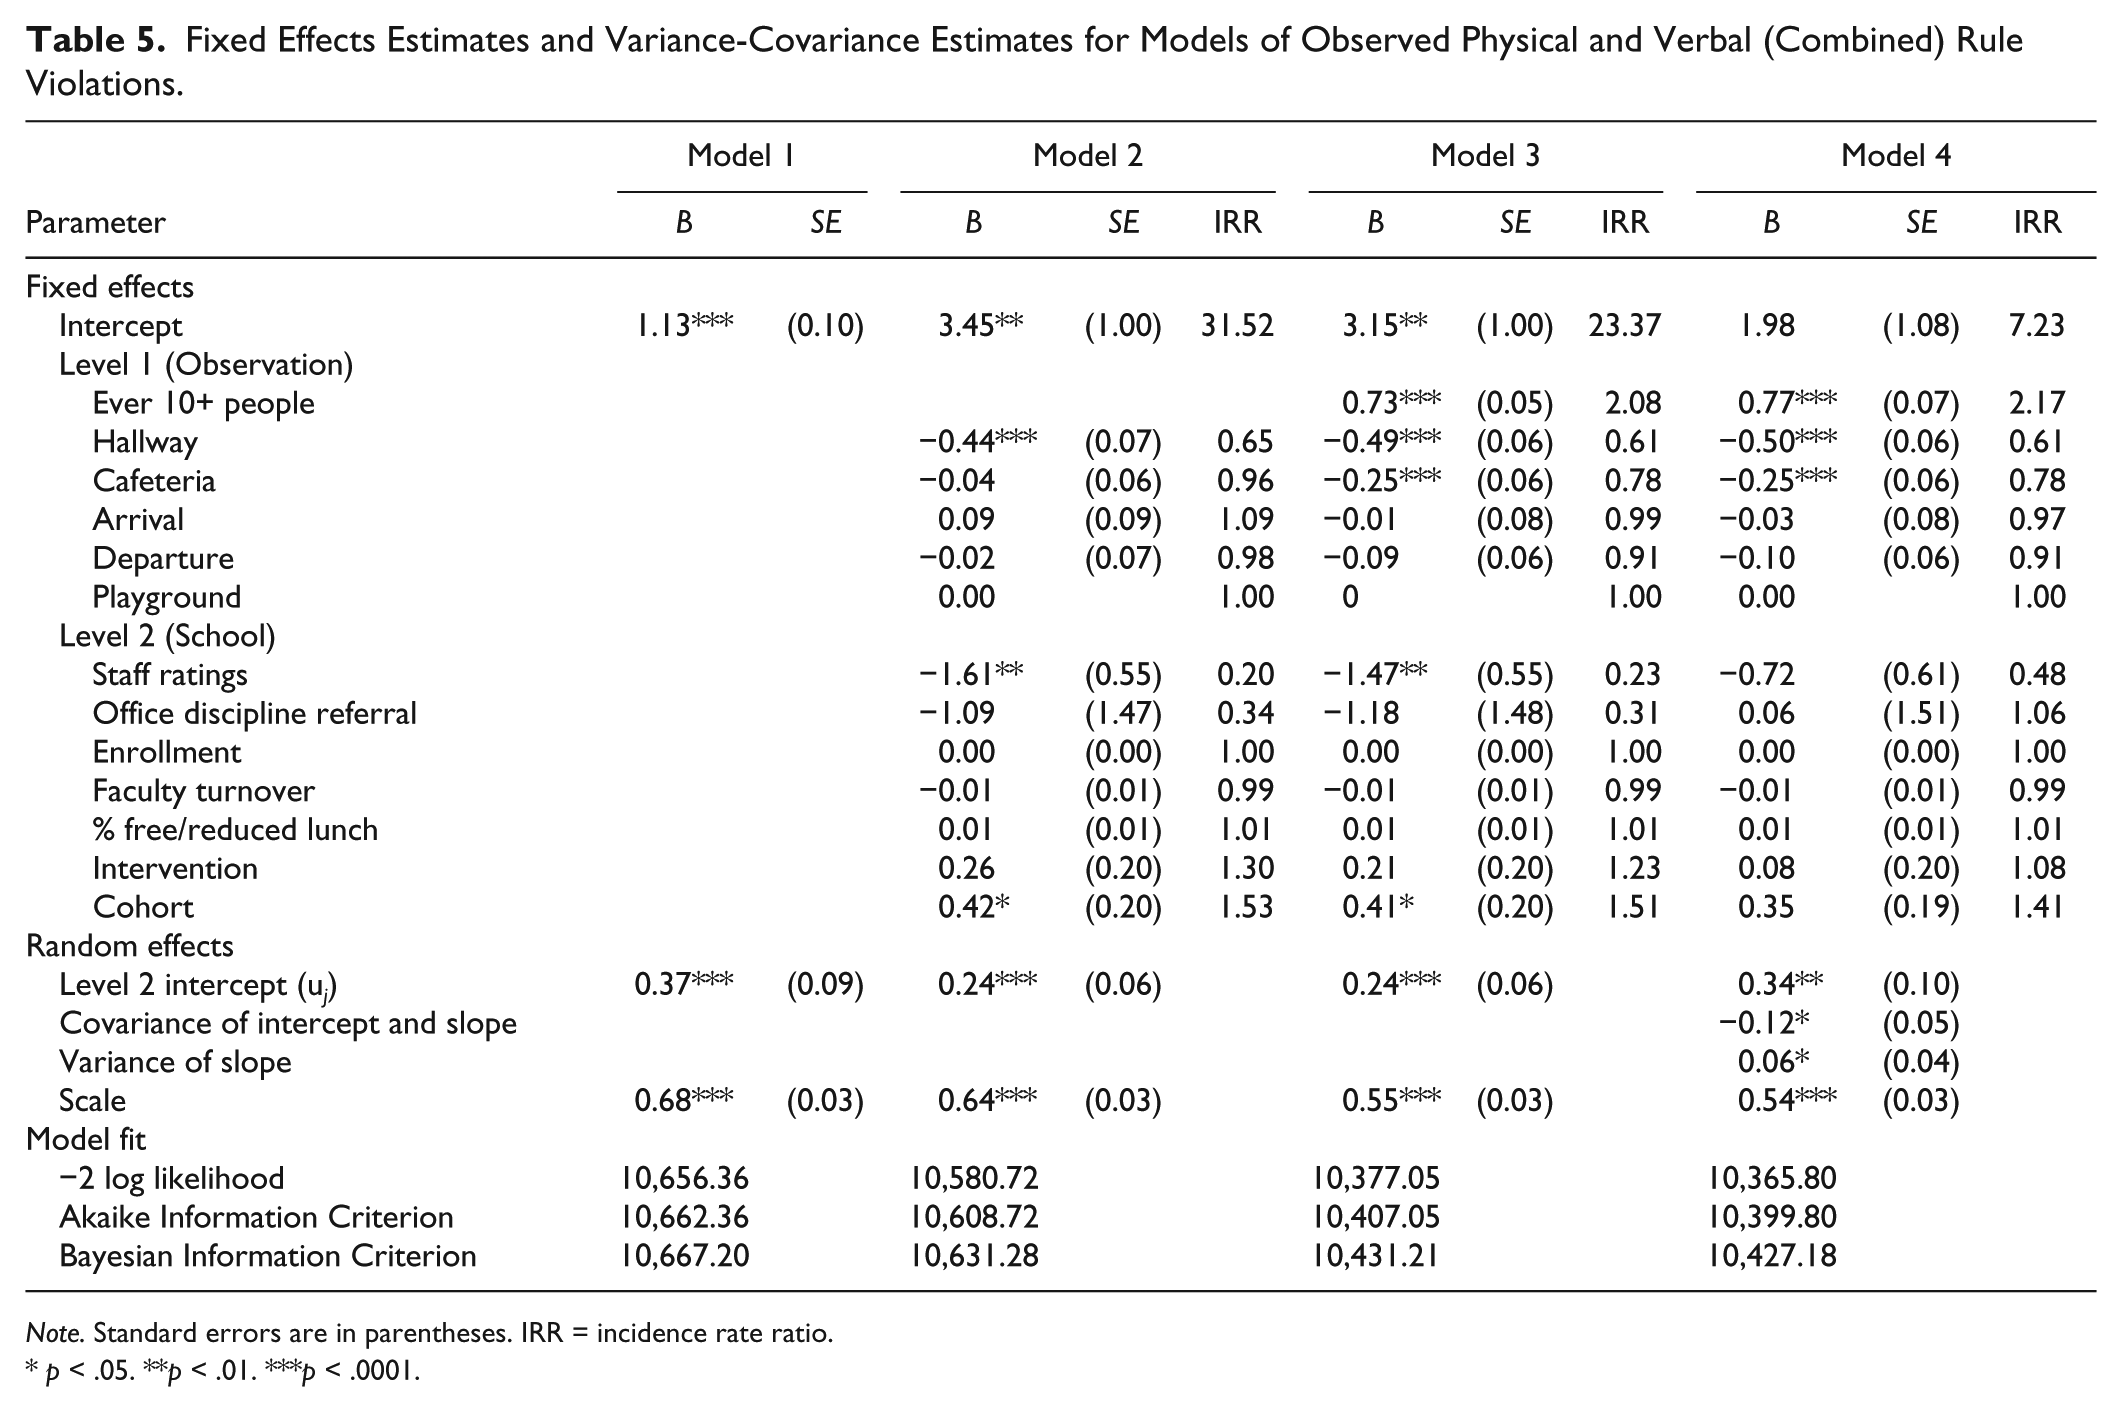
Note. Standard errors are in parentheses. IRR = incidence rate ratio.
p < .05. **p < .01. ***p < .0001.
Random effects were also estimated. Schools significantly differed in average observed rule violations across both outcomes, over and above characteristics of observations and of schools. In the physical model, a random effect was also included for student density. In this model, significant variability in the slope tells us the relationship between student density and observed rule violations varies between schools. There was also a significant association between the intercept and slope, meaning that the association is related to the average level of observed violations within the school. A random effect for student density could not be included in the model estimating verbal violations due to limited variance for this outcome.
Finally, we examined model fit for each of the models and included −2 Log Likelihood, Akaike Information Criterion, and Bayesian Information Criterion in Tables 3 to 5. The addition of density to the model improved model fit substantially for all outcomes. The inclusion of a random effect for density in the models for physical and combined rule violations also improved model fit, but only slightly.
A Closer Look at Rule Violations Between Locations
We examined pairwise differences in the frequency of rule violations between nonclassroom locations. Significant differences between locations are depicted in Figure 1. Physical rule violations were observed at the highest rate at arrival, although this frequency was not statistically significantly different from observed physical rule violations during departure periods or on the playground. Verbal rule violations were observed most frequently in the cafeteria, at a rate that was not significantly different from the rate of verbal violations on the playground.

Average observed rule violations during a 5-minute observation by location.
We also explored differences in observed density between locations. Although density was a significant predictor of observed rule violations in the multilevel models, the locations where violations were observed most frequently were not always the locations with the greatest percentage of high-density observations. The occurrence of high student density was significantly different across the five locations, F = 32.34 (p < .0001). Post hoc multiple comparison analysis using the Tukey method revealed that density was high more frequently in the cafeteria relative to every other location. Density on the playground was high less frequently than in the cafeteria or at arrival or departure. Therefore, physical rule violations occurred even at the location where density was observed the least frequently (playground), and verbal rule violations occurred most frequently at the locations where density was observed both the least (playground) and the most (cafeteria) frequently.
Discussion
This article used a multilevel approach to examine school contextual factors associated with rates of physical and verbal rule violations in nonclassroom settings. In addressing the school context across observations both within and between schools, some hypotheses were supported but others were not. The nonclassroom location and level of student density within that location during the observation were associated with higher rates of rule violations. Significantly higher rates of physical and verbal violations were observed in areas with high student density. Higher rates of physical violations also occurred on the playground and at arrival and departure times than in the hallways or cafeteria. The cafeteria and the playground were similar as the locations with the highest rates of verbal violations. With regard to the school-level associations, staff perceptions of effective behavior management systems were significantly associated with observed verbal rule violations. This was also true for physical and combined rule violations until a random effect for density was added to the models. However, office discipline referrals, enrollment, faculty turnover, and percent of students eligible for free/reduced meals were not associated with higher rates of observed student rule violations.
Characteristics of Observations
Direct comparison of rates of rule violations in nonclassroom settings can be difficult because few studies observe behavior across multiple contexts or locations within a school. In this analysis, there was more variation in frequency of observed violations between observations within school than between schools. To understand differences between observations within a school, we examined the relationship between characteristics of observations and frequency of observed behaviors. One important contextual factor was density.
High-density areas (i.e., 10 or more students present within the 10 foot × 20 foot physical space) were associated with higher rates of observed violations. Surveyed middle school, but not elementary, students have reported feeling unsafe in crowded areas (Astor et al., 2001). To our knowledge, this is the first study to examine the association between observed density and observed rule violations and the first study to do so in elementary settings. We believe this association suggests that a perception of high-density areas as dangerous due to high rates of violations, or as opportunities to commit rule violations, begins in elementary school. It is possible that this perception continues, and perhaps even becomes magnified, when students transition to middle school. The association between density and violations was even stronger for schools with higher rates of observed physical violations on average. It is possible that in schools where physical rule violations are more prevalent on average, contexts with high student density reinforce opportunities for disruption by being more difficult to monitor. These contexts may also create a culture of resignation among students and/or staff if rule violations go unchecked.
The current study makes an important contribution to the literature on observational studies because it compares rates of rule violations across multiple nonclassroom locations within a school. The variation in frequency of physical and verbal violations across locations was more nuanced than we anticipated. Because elementary student report data (Vaillancourt et al., 2010) and elementary office discipline referrals (Spaulding et al., 2010) identify the playground as the most problematic setting, we anticipated that the observational data would coincide. We did observe a high rate of violations on the playground for both physical and for verbal rule violations. However, physical rule violations occurred at a similar rate in arrival and departure areas as they did on the playground, and verbal rule violations occurred at a similar rate in the cafeteria as they did on the playground. There are discrepancies between this study and Spaulding et al. (2010) in ranking the other locations as well; but direct comparisons are difficult due to differences in the types of problem behaviors that were tracked and in the locations identified. In addition, the locations where violations were observed with greatest frequency were not consistently associated with high-density observations. This suggests that although high-density observations were associated with higher rates of rule violations of all types, the mechanism explaining this association may not be straightforward. Future research may want to examine the types of interactions occurring between adults and students during these high-density periods more closely.
Direct comparison between rates of rule violations in this study and other studies is difficult for several reasons. For example, the data indicated an average of 3.53 physical rule violations and 0.38 verbal rule violations per 5-minute observation period; this translates to a per-minute rate of violations of any kind of 0.78. This is lower than the rate presented by McCurdy et al. (2009), who reported 4.73 problem behaviors per minute in an elementary school cafeteria. It is more consistent with Snyder et al.’s (2003) findings that individual children, particularly boys, were targets of peer physical or verbal harassment once every 3 to 6 minutes. However, Snyder et al. included behaviors such as hitting, kicking, pushing, pinching, teasing, and threats, and McCurdy et al. included play-fighting, screaming, throwing objects, and out-of-seat behavior. The SISS captures many, but not all, of these behaviors, and discrepancies in rates of rule violations may be explained by differences in definitions for problem behaviors.
Alternatively, discrepancies in rates may reflect differences in measurement design. For example, whereas with the SISS, observers focused on a 10 foot × 20 foot physical space, McCurdy et al. (2009) rotated among randomly selected lunch tables, and Snyder et al. (2003) focused on target students. As a result of these differences in observation field and protocol, it is difficult to compare findings across observation systems. Moreover, the selection of an observation space or person is particularly challenging in nonclassroom locations as they can be large, open/un-bounded, or poorly defined spaces where many students and adults can walk through. This is in contrast to classroom observations, which typically focus on specific students or adults who remain in the room for the duration of the observation period. Of the available methods for observing nonclassroom settings, we believe the selection of 10 foot × 20 foot physical space used by the SISS works well for assessing nonclassroom behaviors among a general population of students across a variety of locations. The selection of target students is logistically more complex for researchers and practitioners to implement. Decisions must be made to select a sample of target students that is representative of the student population. Also, this method requires observers and target students to be available at the same dates and times. Rotation among randomly selected lunch tables is also methodologically limiting, as cafeterias can vary greatly in the size, shape, and arrangement of lunch tables. The SISS facilitates standardization of the size of the space across nonclassroom locations and across schools. It also permits the inclusion of all students within that space, making it possible to capture the experience of typical students in each setting.
Characteristics of Schools
Although there was some variation in observed behavior between schools, we found few significant relationships between school characteristics and the frequency of observed rule violations. One exception to this was a negative association between frequency of observed verbal rule violations and the school average for staff perceptions of behavior management systems being in place for nonclassroom settings. When staff members perceived effective behavior management systems to be in place, fewer verbal violations were observed. The associations for the physical and combined violations were significant in initial models, but not once a random effect for density was added in the final models. A possible explanation for these nonassociations could be that staff members do not recognize the same violations as being problematic (Bradshaw et al., 2007; Hazler et al., 2001). For the SISS, a wide variety of behaviors, from littering to aggression, were counted as physical rule violations. The lack of association may be explained by differences in perceptions of what constituted a rule violation. Perhaps a significant association existed for verbal rule violations because there was better alignment between rule violations as the SISS defined them and the staff perceived them. Previous research found that teachers’ assessments of classroom management were associated with office discipline referrals (Pas et al., 2011), but staff assessments of management in nonclassroom settings had not been examined. Surveys are less expensive to administer, so it would be helpful if their findings converged with observational assessments. However, the current findings suggest that more precision in staff surveys may be needed.
Contrary to expectations, there were not significant associations between observed rule violations and other school-level characteristics, including office discipline referrals, total enrollment, faculty turnover, percent of students eligible for free or reduced meals, and intervention status. The small sample of schools (n = 37) may explain why so few school-level associations were found. That the majority of variation in the outcomes existed across observations within schools instead of between schools may also have contributed. Finding that the majority of variation in nonclassroom rule violations occurred within schools instead of between schools is consistent with previous research on classrooms. Rivkin, Hanushek, and Kain (2005) found that much of the variation in teacher quality exists not between schools, but within schools. Several additional possible explanations for nonassociations are explored below.
More specifically, we had hypothesized a positive relationship between observed violations and discipline referrals based on previous evidence that discipline referrals were associated with student misbehavior, victimization, and behavioral disorders (Irvin et al., 2004); however, no significant associations were identified. There are a number of possible reasons for these discrepancies. For example, it is possible that the observers witnessed rule violations that school staff members do not typically report. The SISS rule violations included behaviors that varied widely in severity and adults may not typically report less severe violations such as teasing or running, partly explaining the nonassociation. The lack of significant associations for enrollment, faculty turnover, and the percent of students eligible for free/reduced meals also surprised us given evidence of positive associations in prior work (Barnes et al., 2006; Cushing et al., 2003; Ingersoll, 2001). However, there is research in middle and secondary settings indicating these associations are not always positive or significant (Gottfredson, Gottfredson, Payne, & Gottfredson, 2005; Rusby et al., 2011). Although it seemed reasonable to expect office referrals to converge with observed rule violations, such relations did not emerge. Some researchers suggest that inconsistency in ratings from different reporters (LaRusso et al., 2009), or differences between observers with different backgrounds (Camburn & Barnes, 2004) may be substantively meaningful. The lack of an association reminds us that school settings are complex and difficult to measure. There is “a tension between maximizing consistency in reporting across multiple respondents on one hand, and capturing potentially important fine-grained distinctions on the other” (Camburn & Barnes, 2004, p. 67).
Limitations
It is important to consider limitations when reviewing these findings. We were not able to collect systematic information about the background of individual students observed within a space, such as the age or grade level of the students being observed. This is unfortunate as characteristics such as risk factors for behavior problems could be interesting. During observations, we learned that it was not always feasible to identify how many students from each grade were represented within a space, particularly as students could pass in and out of the observation space during the 5-minute observation period. In fact, grade levels were mixed within nonclassroom locations for approximately 37% of observations. As a result, we left this information out of the current analysis. We also did not collect data on adults’ actual management of nonclassroom settings. Staff perceptions were analyzed at the school level, but adult behaviors were not observed.
At the school level, the data were collected across two different cohorts of schools, and cohort was a significant predictor in some of the models. It is unclear why cohort was associated with outcomes, other than it possibly served as a proxy for some unmeasured variables at the district level, as there was some confounding of school district and cohort. Unfortunately, too few districts were available to analyze the data in a three-level model. Finally, future research should examine whether rule violations observed in nonclassroom settings are associated with students’ rule violations in nonclassroom settings as they transition into middle school. Unfortunately, data on this transition were not available in the current study.
Implications for Schools
Taken together, the findings of this study emphasize the importance of increasing supervision and prevention strategies by location and times of increased student density. Observations of nonclassroom settings can help schools identify hot spots, locations, and times of increased problem behavior. Moreover, the SISS is a measurement tool that is reasonably feasible for school practitioners to use. Operational definitions are straightforward and minimal observer training is required to achieve high levels of reliability. Educators can use data from the SISS to target behavioral interventions. These efforts may be particularly helpful for schools with higher baseline levels of observed rule violations. Strategies which provide enhanced adult supervision, prevent rule violations, and deal with challenges such as density may also be important to use to address behavior problems in nonclassroom settings (Lewis & Sugai, 1999; Newcomer, Colvin, & Lewis, 2009). For example, Newcomer et al. (2009) recommend adjusting the physical environment to move or eliminate objects that slow traffic flow or obstruct vision lines. Transition times can be staggered to prevent large groups of students in an area at one time. They also recommend that adults manage behavior proactively, including strategies like introducing and reviewing routines such as waiting in line, monitoring, movement, and increasing positive interactions between adults and students. Although SW-PBIS was not associated with lower rates of observed rule violations in the current study, a number of other studies have reported improvements in observed student behavior in nonclassroom settings in response to strategies associated with SW-PBIS, including pre-correction, active supervision, and group contingency programs (Colvin et al., 1997; Fabiano et al., 2008; Lewis, Powers, Kelk, & Newcomer, 2002). Studies of the impact of SW-PBIS specifically have shown reductions in teacher-reported student aggression and disruptive behaviors (Bradshaw, Waasdorp, & Leaf, 2012), student suspensions (Bradshaw, Mitchell, & Leaf, 2010), and office discipline referrals (Bradshaw et al., 2012; Bradshaw et al., 2010), as well as improvements in behavior management (Bradshaw et al., 2010). Further work is needed to better understand the potential impact of SW-PBIS on rule violations in nonclassroom settings.
The SISS could also help schools recognize if specific types of rule violations are occurring in certain locations more than others. Management strategies could then be targeted by location. For example, high rates of physical rule violations on the playground may call for additional sports equipment or facilitation of physical activities other than horseplay. Similarly, high rates of verbal rule violations in the cafeteria highlight opportunities for meal-time conversations about appropriate alternatives for expressing emotion and respectfully communicating with peers.
Future research should consider comparing behaviors observed in nonclassroom settings with those occurring in classrooms, which may elucidate different patterns of contextual influence. Such work may help identify features of the school contexts that prevent or foster rule violations across different school settings. Future work could also collect data on the presence or behaviors of adults in the observed nonclassroom settings, such as increased supervision or the interactions between adults and students (Leff, Power, Costigan, & Manz, 2003). Finally, future work should examine associations between nonclassroom climates in elementary school and students’ behaviors within nonclassroom contexts as they transition into middle school. For example, the presence or absence of rule violations in elementary nonclassroom settings may be related to students’ behavior in these settings in early adolescence.
Conclusion
These findings advance our understanding of contextual influences on students’ behavior in nonclassroom settings, and highlight the importance of school level and organizational influences, as well as proximal factors, such as density or the location of the behaviors. This study also illustrated the variation in behavior across contexts within the same school. These findings suggest that observation tools such as the SISS may be helpful in identifying locations in need of increased adult supervision, as well as potentially determining impacts of schoolwide prevention programs. Although this particular measure was developed for research purposes, future research will focus on adapting these approaches for school personnel interested in identifying hot spots within the school in order to target resources for reducing rule violations.
Footnotes
Appendix
Declaration of Conflicting Interests
The author(s) declared no potential conflicts of interest with respect to the research, authorship, and/or publication of this article.
Funding
The author(s) disclosed receipt of the following financial support for the research, authorship, and/or publication of this article: This research was supported in part by grants from the Centers for Disease Control and Prevention (R49/CCR318627, 1U49CE 000728, and K01CE001333-01), the National Institute of Mental Health (1R01MH67948-1A, T32MH019545), and the Institute of Education Sciences (R305A090307).