



Abstract

Keywords
As pressure builds to assess students, teachers, and schools, educational practitioners and policy makers are increasingly looking toward student perception surveys as a promising means to collect high-quality, useful data. For instance, the widely cited Measures of Effective Teaching study lists student perception surveys as one of the three key measures of teachers’ efficacy and describes these measures as a source of potentially valuable feedback for teachers (Cantrell & Kane, 2013). When one factors in the low cost with their prospective utility in assessing teachers and fostering teaching effectiveness, it seems clear that surveying students will increase dramatically in the coming years.
Within this context, researchers who survey early adolescents must navigate the confluence of three tensions. First, responding to survey items requires an array of cognitive skills that early adolescents are still mastering (Downer, Stuhlman, Schweig, Martínez, & Ruzek, 2014). Second, unlike national, public opinion surveys, school-based surveys need to provide accurate data for small samples. For instance, a middle school teacher may have 100 students divided between her sixth, seventh, and eighth-grade science classes; an elementary school teacher may only have 20 students total. Third, for the full promise of surveys to be realized as a tool for improving schools, the survey scales need to be practitioner friendly: short, easy to administer, and straightforward to interpret (Hamre & Cappella, 2015, Kosovich, Hulleman, Barron, & Getty, 2014).
Each of these factors—cognitive capacity, small samples, and practitioner-friendly measures—increases the pressure for every detail within a survey to be just right: Poor item design tends to be more problematic for those with lower levels of education (Krosnick, 1999b). Measurement error has greater potential to skew results in smaller samples. Shorter scales place a premium on selecting exactly the right items and wording them the right way.
For many researchers, these tensions are often compounded by pressures from academia. Specifically, researchers often feel compelled to claim that they are using “validated” measures—that is, scales that have had psychometric properties reported on in previous studies. This habit is unfortunate for two reasons. First, validated survey scales are mythical. Validation is an ongoing and indefinite process (Messick, 1995). The best scientists can hope for is to accumulate increasing evidence that scores from a particular scale allow for valid inferences to be made about certain outcomes for certain populations in certain contexts. No supreme arbiter exists to rule whether or not sufficient evidence has been achieved. Second, strict reliance on previous measures retards innovation in measure development. Reliance on older instruments, which do not avail themselves of recently discovered best practices, introduces measurement error that could easily be avoided.
The goal of this article, then, is to diagnose some of the most commonly arising problems in survey measures and offer ideas for remediation. To maximize the utility of this article for researchers and practitioners, I focus on seven frequently observed, especially problematic violations of best practices in survey design. I selected these seven survey sins according to three criteria. First, the problems need to be nonobvious. For example, the sin of using obfuscating diction in lieu of clear, simple wording is not on the list. Most survey designers know this guideline. (Problems arise because survey designers believe their items are clear and simple, their respondents do not). Second, correcting the sin needs to provide reasonable return on investment in terms of reducing measurement error. Increasing evidence suggests that formatting items within a grid or matrix layout encourages respondents to satisfice (Tourangeau, Conrad, & Couper, 2013). However, survey researchers need to establish more robust evidence that this sin causes substantial measurement error to warrant inclusion on this list. Third, remediation of each sin should cost little time and effort. In a perfect world survey designers would always go through a rigorous process when designing new scales (e.g., Gehlbach & Brinkworth, 2011), I delimit the focus of this article to relatively easy, simple improvements for writing and formatting items.
Sin 1: Mismatching Item Type With Desired Data
In subtle ways, survey designers too often mismatch the type of item that they pose with the type of data that they desire. Imagine a middle school administrator wants to learn which sports activity (soccer, basketball, or track) students would like to prioritize as a new extracurricular offering at their school. Research questions about priorities are typically best assessed with ranking, rather than rating, items. Because the school administrator needs to pick one sport to invest in, the underlying research question is ultimately about preferences between alternatives rather than overall liking of each option. Furthermore, ranking items require respondents to think more deeply and are frequently more reliable than rating items (Krosnick, 1999a).
Other mismatches between item type and desired data arise because of how respondents interact with items. “Check-all-that-apply” item formats regularly give researchers incomplete, low-quality data. Particularly in longer “check-all-that-apply” lists, respondents typically disproportionately check off more boxes toward the top of the list. Presumably, after checking off a few of the first choices, respondents feel they have done a good enough job answering the item and move on to the next item after merely skimming the latter choices. By contrast, asking respondents a forced-choice “yes” or “no” in response to each item provides more complete, high-quality data (Dillman, Smyth, & Christian, 2014; see Figure 1 for an illustration).

A contrast between “check-all-that-apply” (problematic) and forced-choice (preferred) formats.
On other occasions, survey designers use item formats that are simply too challenging for respondents, thereby creating a mismatch between the items and the cognitive level of the targeted respondents. For instance, although ranking items tend to be more reliable than rating items, there is a point at which the cognitive task of ranking multiple items becomes overwhelmingly complex for respondents (Krosnick, 1999a). Researchers who ask young adolescents to rank 12 qualities that are important in a teacher are likely to be sorely disappointed in the quality of the responses; by contrast, asking about a list of 4 or 5 qualities is likely to result in much higher quality data.
As a final instance of item type/desired data mismatch, survey designers may try to accomplish too much with a single item. In particular, researchers are often eager to ask close-ended questions for ease of analysis, but do not want to overlook important categories. For instance, suppose a social studies teacher wishes to understand student preferences for different potential topics of study. The survey might ask students to rate Ancient Egypt, Greece, Medieval Europe, Vikings, and “Other.” The data produced from the “Other” category rarely provides useful information. For one thing, the responses to “Other” are inevitably different and hard to compare. In addition, the first five categories send strong signals to students about what types of answers might be reasonably included in “Other.” For example, “The Roman Empire” seems like an appropriate response, but “Charlemagne” seems too specific. Students might assume “World War II” is inappropriate because it is too modern. Thus, a good rule of thumb in these types of situations is that close-ended questions are more effective item formats when the universe of possible categories or responses is well-known; when the universe is not well-known, a separate open-ended item is usually a better way to establish the range of responses for a given population.
Sin 2: Using Agree-Disagree Statements
Survey design textbooks have long disparaged the practice of designing items as a statement and asking respondents to respond with strongly disagree, disagree, neither agree nor disagree, agree, and strongly agree (Converse & Presser, 1986; Dillman et al., 2014; Fowler, 2009). Instead, most experts recommend that survey designers pose questions and provide response options that signal the underlying construct. For example, responses to “How much do you enjoy your science class?” might stress the idea of enjoyment: do not enjoy at all, enjoy a little bit, enjoy some, enjoy quite a bit, and enjoy a tremendous amount.
Despite their tremendous popularity, statements with agree-disagree response anchors may increase measurement error for a host of reasons. Converse and Presser (1986) note that “strongly” is an unfortunately ambiguous modifier that confounds extremity of one’s opinion (how close to an endpoint respondents place themselves on a continuum) with the certainty of one’s opinion (how sure respondents are of their opinion, regardless of its location on the continuum). A second possibility is that, because “agree-disagree” response options are bipolar (i.e., ranging from a negative to a positive), they do not achieve the precision that a set of unipolar response options would (e.g., scales ranging from a theoretical zero to a positive extreme). In other words, respondents may feel as though they simply do not have enough choices to accurately represent where they lie on the continuum. Third, respondents may “satisfice” (Krosnick, 1991) by putting forth suboptimal effort in completing the survey. Specifically, this item design may entice respondents into making snap judgments, thereby obviating or truncating the memory search (Tourangeau, Rips, & Rasinski, 2000). Fourth, many respondents react to these statements by agreeing with them (a phenomenon known as acquiescence) regardless of their content (Fowler, 2009; Krosnick, 1999a). By contrast, survey designers who pose questions that they want respondents to answer are mirroring what happens in every day conversation—something respondents are presumably practiced at and comfortable with.
Sin 3: Going Negative
Survey designers introduce negatives in survey scales through two (related) routes—both to the detriment of data quality. In an effort to keep respondents focused and alert while completing a questionnaire, survey designers sometimes include reverse-scored items as a part of a survey scale (i.e., a series of items designed to measure an underlying construct). For example, in developing a scale to assess classroom interest, a designer might create items such as “How interesting do you find the homework for this class?” “How easy do you find it to pay attention during discussions?” and so on. To prevent respondents from drifting into autopilot mode, they might also include an item such as “How frequently do you get bored during class?” Thus, the first two items would be scored normally—responses indicating greater interest or greater ease would indicate greater interest. However, for the third item, the scoring would be reversed—responses indicating less boredom would be scored to indicate more interest. The logic is compelling. Particularly, when occurring early in a questionnaire, this technique of including reverse-scored items should send a signal to respondents that they need to pay attention to each and every item to accurately convey their true opinions.
Despite their theoretical appeal, these items tend to perform poorly in practice. They often wreak havoc with the factor structure and reliabilities of scales (Swain, Weathers, & Niedrich, 2008). Furthermore, in a study of fourth to sixth graders (Benson & Hocevar, 1985), this technique of intermixing positive and negative items appeared to have particularly negative repercussions for scale validity. So why does this great idea in theory not work out empirically? One reason appears to be that ostensibly opposing attitudes often turn out to be orthogonal rather than arraying at each end of the same continuum (Cacioppo & Berntson, 1994). In one particularly clear illustration, Lepper, Corpus, and Iyengar (2005) show that intrinsic and extrinsic motivation can easily coexist by redesigning a widely used survey scale. Furthermore, the absence of one quality (such as a positive teacher-student relationship) does not necessarily connote the presence of the opposite quality (i.e., a negative teacher-student relationship; Gehlbach, Brinkworth, & Harris, 2012). Students (or teachers) might easily be low on both. Rather than using reverse-scored items, presenting respondents with a survey that intersperses items from scales of more socially desirable traits with items from less socially desirable scales seems like a more reasonable approach (Gehlbach & Barge, 2012).
Negativity creates comparable problems at the item level. Negative words and phrases appear more difficult to process cognitively (see Wegner’s [1994] research on ironic effects). In fact, Swain et al. (2008) suggest that because of the cognitive complexity required to answer them, negative items take longer to answer and cause more misresponse than positively phrased items. One of the deadliest survey sins may be the blending of negatively phrased items with the aforementioned agree-disagree format. For example, imagine a group of seventh graders faced with, “My race does not affect how I am treated at school.” If they feel that their race frequently causes them to be discriminated against, they must disagree or strongly disagree with this negative statement to convey that, yes, they do feel discrimination.
Sin 4: Using Too Few Response Options
Most close-ended survey items require respondents to select a response from a modest number of choices. The question of exactly how many of these response options there should be has garnered much attention from survey design researchers. Presenting too few response options precludes respondents from accurately mapping their true opinion onto one of the response options; presenting too many prevents respondents from distinguishing between adjacent choices.
The current consensus from most studies appears to be that unipolar items should have five response anchors and bi-polar scales should have seven (Dillman et al., 2014). It is also worth noting that the cost of having too few response anchors (in terms of measurement error) seems to be greater than the cost of having too many (Weng, 2004). An important caveat to mention is that there is a dearth of research identifying developmental differences in the appropriate number of response anchors. Thus, future research could reaffirm the five- and seven-point guidelines described above for adult populations while leading to different recommendations for younger populations.
Sin 5: Mislabeling Response Options
An important, related sin to using too few response options occurs when survey designers fail to label the different anchors appropriately. Each and every response option should be labeled (Dillman et al., 2014; Krosnick & Fabrigar, 1997). This practice increases the likelihood that each response option has the same weight visually to the respondent and removes ambiguity as to the meaning of unlabeled response options.
Furthermore, because numbers tend to evoke meaning to respondents, they should be omitted from response options. 1 Because numbers lack clear, consistent meanings across respondents and across different items, they cannot be effectively used by themselves. However, even when used in concert with verbal labels, they can cause problems. For example, in asking students how much they anticipate learning in a course, one might offer five response options that could range from 1 = almost nothing to 5 = a tremendous amount or −2 = almost nothing to 2 = a tremendous amount. For many respondents, the value of “1” might reasonably reflect “almost nothing” but “−2” may suggest the loss of learning over the duration of the course—a very different connotation (and an unlikely response). In sum, because numbers may suggest different meanings than their corresponding verbal labels and because some respondents will inevitably attend to the numbers more than others, numeric labels on response options represent an additional source of potential measurement error.
Sin 6: Improper Balance and Spacing of Response Options
Three balance and spacing issues within response options can cause easily avoidable measurement error in survey items: conceptual, numeric, and visual. Conceptual spacing refers to the distance between concepts for a set of response options. In top portion of Figure 2, the meanings of “rarely” and “once in a while” are similar, whereas the meanings of “once in a while” and “quite frequently” are conceptually much further apart despite the adjacent positioning of each pair. Numeric balance refers to the idea that respondents will take cues as to what normal or average is based on the middle response option(s). Thus, in the top of Figure 2, there is an implicit suggestion that “once in a while” represents a normal amount of class participation simply because that response option is the third of five response options. This sends a mixed signal to respondents given that “once in a while” will not seem conceptually like a middle choice to most respondents (especially in contrast to “Sometimes” as presented in the bottom of Figure 2). Finally, Figure 2 also illustrates how different response options can take up different amounts of visual space (e.g., by using “Auto-fit contents” rather than “Distribute columns evenly” in Microsoft Word documents) and create imbalance among answer choices. This practice can lead to mixed messages for respondents as to where the midpoint lies. In sum, misalignment between the conceptual, numeric, and visual midpoints muddies the meaning of each response option.
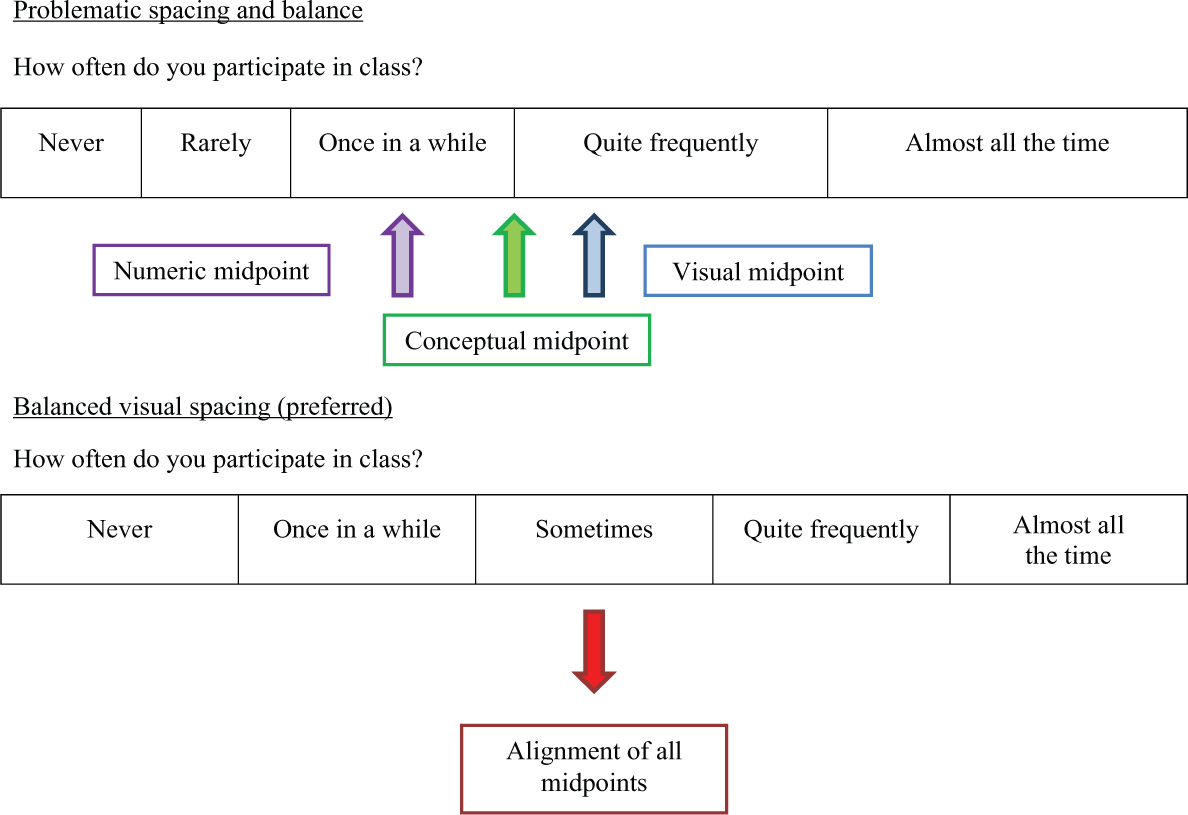
Spacing and balance contrasts between different types of response anchors.
Another visual spacing problem can arise with the inclusion of no opinion, don’t know, and N/A response anchors (Tourangeau et al., 2013). By failing to put a divider or extra spacing between the substantive and non-substantive response anchors, survey designers can again confuse respondents by misaligning the conceptual, numeric, and visual midpoints (see Figure 3). Tourangeau, Couper, and Conrad (2004) offer a cautionary note that if these non-substantive response options are offered, 2 respondents maybe more drawn to selecting them (see the top item in Figure 3) than when they are more visually distinct (see the preferred examples).
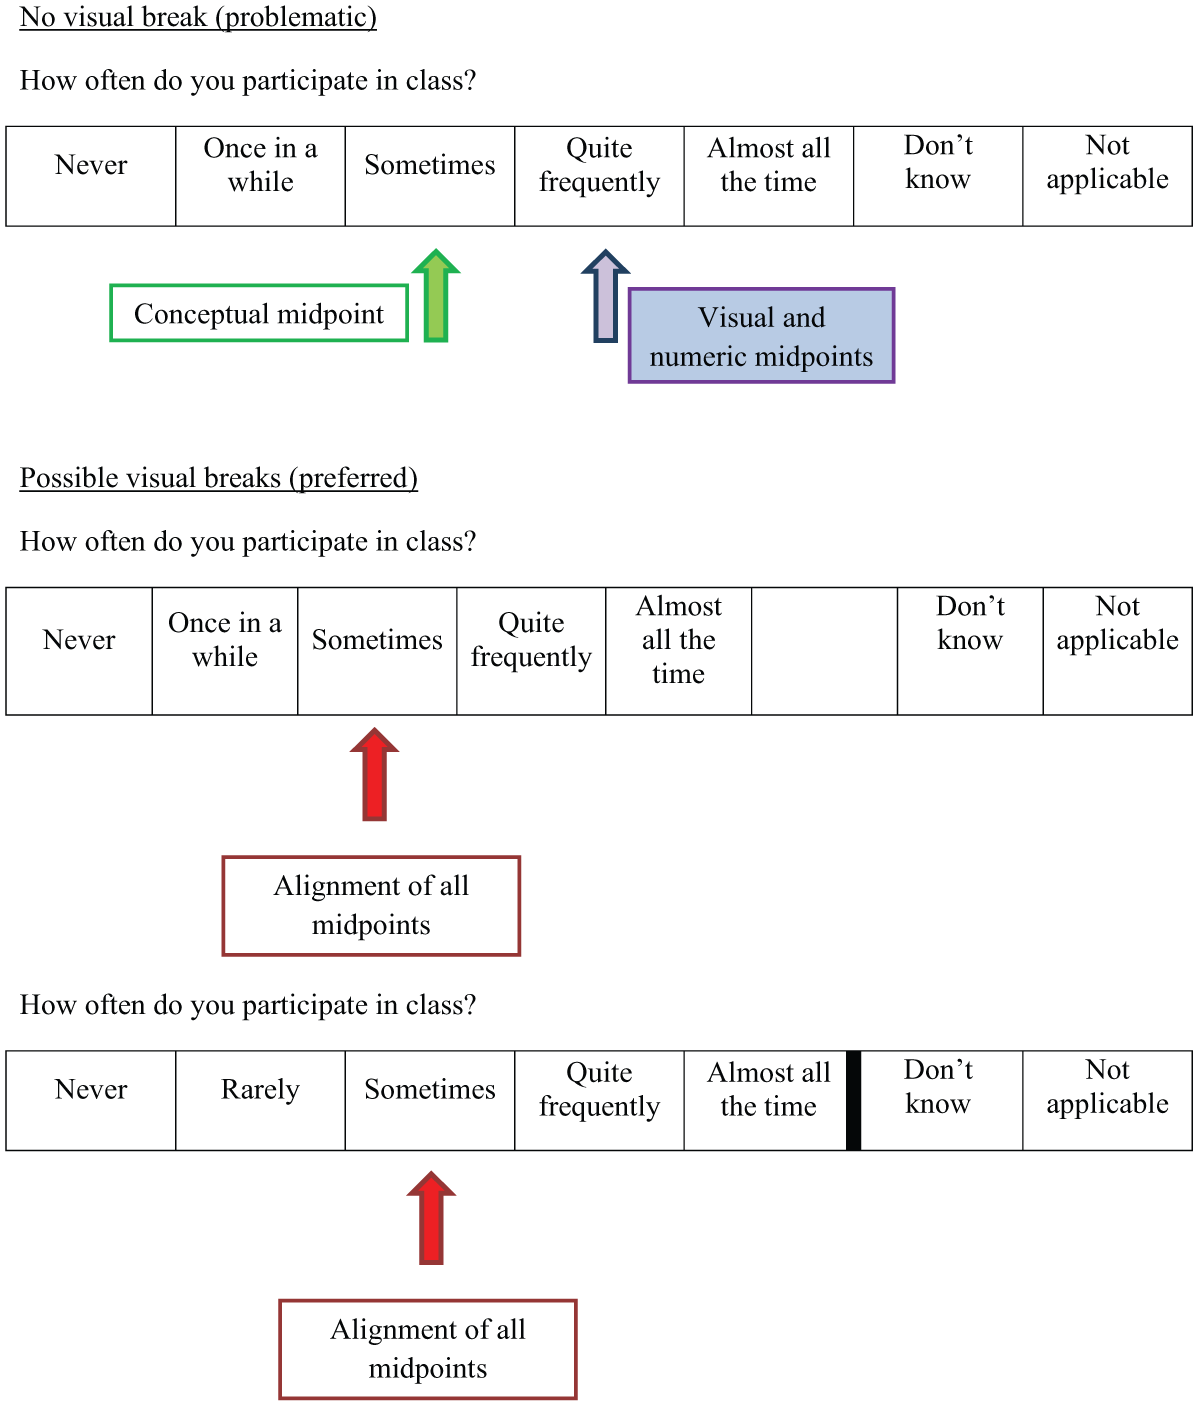
Visual spacing between substantive and non-substantive response anchors.
Sin 7: Using Double-Barreled Items
At first blush, this sin may strike readers as obvious. Items in which a survey designer tries to ask more than one item at a time are double-barreled (Dillman et al., 2014). By looking for conjunctions, readers can easily spot classic double-barreled items such as “How much pressure do you feel to drink alcohol or take drugs outside of school?” or “How important is it to you to get good grades and please your parents?” They introduce measurement error because respondents who feel differently about each part of the item cannot answer accurately. Respondents who feel lots of pressure to drink but little pressure to do drugs are put in a bind by the first item. Some may respond by focusing on the alcohol, others by focusing on the drugs, and others by mentally averaging their two responses.
However, double-barreled items can also emerge in the response options. For example, the item “What is your current occupational status?” could be paired with the following response options: full-time employment, full-time student, part-time employment, part-time student, unemployed, and retired. Many combinations of these response options are possible. A full-time student might work part-time, some part-time students might consider themselves unemployed, and so forth. The survey designer needs to divide the question in such a way (e.g., into an item about employment status and an item about student status) that produces mutually exclusive and exhaustive response options.
More subtle still, double-barreled items can take the form of a presupposition that may not be true for a given population. For instance, “When your teacher gives you particularly challenging homework, how likely are you to give up before completing it?” presupposes that the teacher (a) gives at least some homework that (b) the respondent finds challenging. Even if these presuppositions are true, some respondents may give up on their homework for reasons besides the difficulty of the work. In all cases, respondents are likely to respond to these confusing items in different ways resulting in extra measurement error.
Implications for Surveying Early Adolescents
Table 1 summarizes these survey sins and routes to redemption. In general, the suggestions for redressing these sins are low cost and easily implemented. Particularly, given early adolescents’ level of cognitive development, the small number of students used for many analyses, and the pressure to have practitioner-friendly measures, the need to mitigate these seven sources of measurement error is extremely high. Hopefully, the realization that validation is a process rather than an achieved end-state gives survey designers license to adapt and improve existing measures more liberally than in the past.
Overview of Survey Sins and Suggestions for Remediation.

Because this special issue focuses on the nexus of developmental science and educational practice (Hamre & Cappella, 2015), it seems important to acknowledge that real world contexts sometimes complicate adherence to these scientific best practices. For example, in trying to identify the item type that would match the data they sought, McCormick, Cappella, Hughes, and Gallagher (2014) face a challenge in determining the best way to solicit friendship nominations. Should students rate every child in their class, rank a subset of peers, or simply list their friends in an open-ended item? This question lacks an easy answer—especially because the optimal approach might differ for research conducted in a small, intimate private school versus a large urban public school. Kosovich et al. (2014) pose negative items in their scale assessing cost. However, the underlying construct—the inability to do things due to a lack of time—seems fundamentally negative. Perhaps the cognitive costs of using negative items with middle school students are outweighed by better face validity for this particular construct. Frazier et al. (2014) borrow scales for their study that use different numbers of response options. In selecting the Patterns of Adaptive Learning scales in their study, Ruzek, Domina, Conley, Duncan, and Karabenick (2014) use a set of measures that uses partially labeled response options that combine numeric and verbal labels. But what should these researchers have done? Had they changed the items into questions, increased the number of response options, fully labeled the response options, or removed the numbers, they might have more accurately measured their underlying constructs of interest. However, they would have lost the opportunity to compare their data with other studies conducted with these scales.
In most cases, it should be relatively straightforward to adhere to the scientifically grounded best practices described in this article. However, when challenging dilemmas such as these arise, researchers need to make these trade-offs thoughtfully. In each of the aforementioned illustrations, research could be tremendously informative in facilitating decisions about how much measurement error is likely to result from particular choices. Unfortunately, scholarship on best survey design practices has rarely been conducted (or replicated) on early adolescents.
In the coming years, surveys administered to early adolescents are likely to proliferate. Thus, we urgently need research on the best approaches to designing surveys for this unique and important population to keep pace. In the meantime, hopefully, these sins and the ideas for redressing them provide researchers with some low-cost approaches to improving their measures in most situations.
Footnotes
Acknowledgements
I am particularly grateful to John Redos—the insightful feedback he provided on an early draft of this manuscript improved it greatly. Joe McIntyre also provided valuable assistance in preparing this manuscript.