
Abstract
Psychological sense of community among early adolescents has been investigated using instruments developed for adolescents/adults or ad hoc scales. The aim was to contribute to the validation of a scale of Sense of Community in Early Adolescents (SoC-EA) using a 3-year longitudinal study. Participants were 576 Italian students attending middle schools. Participants filled out a questionnaire 3 times, in the second term of their first, second, and third middle school years. Results provided support for a five-factor model and both bifactor and exploratory structural equation modeling (ESEM) models had excellent fit. The SoC-EA can be scored according to each subscale or a total score. In addition, the SoC-EA demonstrated (a) longitudinal measurement invariance across the middle school years; (b) good internal consistency, test-retest reliability, and test-retest correlation across the 3 years; and (c) adequate construct validity. Findings support the use of the SoC-EA to measure sense of community in early adolescence.
Building upon the pioneering work of Sarason (1974), McMillan and Chavis (1986) defined sense of community (SOC) as “a feeling that members have of belonging, a feeling that members matter to one another and to the group, and a shared faith that members’ needs will be met through their commitment to be together” (p. 9). Four dimensions were conceptualized in their definition of SOC: membership (e.g., feeling of belonging), influence (e.g., perceived influence over the group as well as group influence over its members), integration and fulfillment of needs (e.g., perception that membership in the group will provide the necessary resources for satisfying member’s needs), and shared emotional connection (e.g., shared history and bonds developed through positive interactions over time). SOC has been linked to many important psychological outcomes including individuals’ well-being (e.g., Prati, Albanesi, & Pietrantoni, 2016; Prati, Cicognani, & Albanesi, 2018; Prezza, Amici, Roberti, & Tedeschi, 2001), participation (Chavis & Wandersman, 1990; Talò, Mannarini, & Rochira, 2014), social support (e.g., Chiessi, Cicognani, & Sonn, 2010; Cowman, Ferrari, & Liao-Troth, 2004; Pretty, Andrewes, & Collett, 1994; Pretty, Conroy, Dugay, Fowler, & Williams, 1996; Vieno, Santinello, Pastore, & Perkins, 2007), and civic engagement (e.g., Albanesi, Cicognani, & Zani, 2007; Talò, 2017).
SOC Among Early Adolescents
Due to peculiar developmental processes arising in early adolescence, it appears critical to investigate the emergence and change of SOC among early adolescents. Although initial forms of sense of belonging to their life contexts are likely to emerge earlier in childhood (e.g., Ross, 2005), several distinctive features of early adolescents’ development are likely to shape SOC of youth in this life period in relatively distinct ways, as compared to both childhood and later adolescence. Typically, as they move into middle school, children experience progressively lower level of parental control and increasing opportunities to move in autonomy through their local environment (Eccles et al., 1991; Pacilli, Giovannelli, Prezza, & Augimeri, 2013). These experiences are vital to broadening their knowledge and understanding and forming social bonds with other people in three spheres: school, neighborhood, and leisure (Albanesi et al., 2007; Chawla, 1992; Eccles et al., 1991; Pacilli et al., 2013; Prezza & Pacilli, 2007). Therefore, one of the pivotal developmental tasks for early adolescents concerns the transition from the protected sphere of the family to the public places that make up the community as a cognitive and relational context (Ayllón, Moyano, Lozano, & Cava, 2019; Giardiello, 2016; Lenzi et al., 2012; Witherspoon & Hughes, 2013). Typically, children experience progressively lower level of parental control and increasing opportunities to move in autonomy through their local environment and establish new relationships with peers and adults (Eccles et al., 1991; Pacilli et al., 2013). In Italy, for example, children attending middle school (but not primary school) may move to and from school without being accompanied, upon written parental consent. Because experiences in and perceptions of their community may shape developmental outcomes of youth (e.g., Brody et al., 2001; Cook, Herman, Phillips, & Settersten, 2002; Lenzi et al., 2012; Tarantino et al., 2017; Vieno, Nation, Perkins, Pastore, & Santinello, 2010; Witherspoon & Hughes, 2013), it is important for researchers to dispose of tools that allow a reliable and valid assessment of SOC in this developmental period.
Measuring SOC Among Early Adolescents
Whereas most of the scales have been designed and used for adults, attempts to develop and validate a scale of SOC in adolescents have also been made (Chiessi et al., 2010; Cicognani, Albanesi, & Zani, 2006; Cicognani, Zani, & Albanesi, 2012). Specifically, the SOC scale for adolescents (SoC-A; Chiessi et al., 2010) includes five factors (i.e., satisfaction of needs and opportunities for involvement, support and emotional connection with peers, support and emotional connection in the community, sense of belonging, and opportunities for influence) that were consistent with the theory of McMillan and Chavis (1986) even though with some specificities related to the developmental period of adolescence. Among adolescents the factor “emotional connection” appeared to split into two dimensions, related to the broader community (“support and emotional connection with the community”) and the peer group (“support and emotional connection with peers”), indicating that for young people the peer group constitutes a specific subcommunity. Moreover, the dimension of “influence” was replaced by “opportunities for influence” as young people have infrequent opportunities to exert influence over their communities but the perception of enjoying such opportunities is an important constituent of their SOC.
A handful of studies investigating SOC has also been conducted among early adolescents, that is, in the age span between 10 and 14 years (e.g., Chipuer, Bramston, & Grace, 2003; DiClemente et al., 2016; Giardiello, 2016; Seider, Novick, & Gomez, 2013; Tarantino et al., 2017; Vieno et al., 2007). However, such works relied on measures developed for adults or ad hoc scales to assess SOC among early adolescents. It remains, therefore, unclear whether such instruments could be used to reliably capture the peculiar nature and the experience of SOC of youth of this age, as several distinctive features of early adolescents’ development are likely to shape SOC of youth in this life period in relatively distinct ways.
The Present Study
In light of these considerations, it appears critical to develop tools that allow a reliable and valid assessment of SOC among early adolescents, by capturing aspects of this construct that are relevant to youth of this age. Given the rapidity of physical, cognitive, and relational changes occurring in this developmental phase, it is also important to ensure that measurement tools preserve good psychometric properties throughout the age span of interest.
To this end, the main aim of the present study was to contribute to the validation of a scale of Sense of Community in Early Adolescents (SoC-EA) using the items of the SoC-A (Chiessi et al., 2010). Regarding construct validity, there are several constructs that highly correlate with SOC. These include well-being, social support, satisfaction with the classroom environment, and students’ relationships with their teachers. Psychological SOC is strongly related to social support (e.g., Chiessi et al., 2010; Cowman et al., 2004; Pretty et al., 1994; Pretty et al., 1996; Vieno et al., 2007) and well-being (e.g., Chiessi et al., 2010; Chipuer et al., 2003; Cicognani, Pietrantoni, Palestini, & Prati, 2009; Prati et al., 2016; Prati & Cicognani, 2018; Prati et al., 2018). However, well-being and SOC are clearly different concepts from a theoretical point of view (Jorgensen, Jamieson, & Martin, 2010; Vieno et al., 2007). Also, social support is related with but different from SOC because the latter “has to be taken beyond individual relationships” (Hill, 1996, p. 434) and because social support is considered an antecedent of SOC (Vieno et al., 2007). We included satisfaction with the classroom environment and students’ relationships with their teachers because the classroom context and student-teacher relationships play a significant role among early adolescents (e.g., Dotterer & Lowe, 2011; Hamm & Faircloth, 2005; Longobardi, Prino, Marengo, & Settanni, 2016; Patrick, Ryan, & Kaplan, 2007). In addition, satisfaction with the classroom environment and students’ relationships with their teachers were used to establish discriminant validity in the validation of a measure of school SOC among adolescents (Prati, Cicognani, & Albanesi, 2017). Based on previous research (e.g., Chiessi et al., 2010; Prati et al., 2017), we expected that the magnitude of the correlation coefficients would be higher between SoC-EA and well-being than between SoC-EA and other study variables. Finally, the extent of pubertal development is considered a good indicator of individual differences in physical maturation among early adolescents (e.g., Eccles et al., 1993) and pubertal development is a particularly impressive case of interindividual variation during early adolescence: “whereas some early adolescents appear physically almost fully grown, others still remind one of a child, and yet both may attend the same classroom and share the same chronological age” (Weichold, Silbereisen, & Schmitt-Rodermund, 2003, p. 241). Therefore, pubertal development was included in analyses to explore whether SOC varies with different degrees of pubertal development.
To achieve the aim of the present study, five research objectives have been formulated as follows: (a) to determine the factorial structure of the SoC-EA; (b) to examine the longitudinal measurement invariance of the SoC-EA across 3 years of early adolescence (11-13 years); (c) to investigate changes in factor means over time; (d) to evaluate internal consistency, test-retest reliability, and test-retest correlation across the 3 years; and (e) to establish construct validity using measures of well-being, social support, satisfaction with the classroom environment, relationships with teachers, and pubertal development across the 3 years. Finally, given that minority status (e.g., Evans, 2007), gender (e.g., Chiessi et al., 2010), and type of area (urban vs. rural; Roussi, Rapti, & Kiosseoglou, 2006) may be associated with SOC, we conducted a preliminary analysis to assess their possible influence on SOC scores.
Method
Participants and Procedure
Participants were students attending six middle schools located in Northern Italy. All the schools involved in the study were public or publicly funded. Three schools were located in the urban area of the chief town of the district. The other three schools were located in suburban and rural areas between 10 and 25 km from the chief town and served villages and small towns. Data stem from a wider longitudinal study on adolescents’ development and well-being that was promoted by the Local Health Authority and by the Municipality of Cesena, Italy. All the schools in the district were invited to participate. Six schools accepted to take part in the study, whereas three schools rejected the invitation. Schools which did not take part in the study were located in areas that were fully comparable to those of participating schools. Both urban and rural areas are located in the Emilia-Romagna region closer to both the Adriatic Sea and the Apennine Mountains.
Permission to conduct the study was accorded by the Ethical Committee of the local University of Bologna. School principals and councils, parents, and students were thoroughly informed about the aims of the study and the voluntary nature of their participation. Participants did not receive any compensation. Consent was required from both parents, except for students with one parent only. Only students with signed parental informed consent were recruited. We do not have information regarding the response rate, because schools provided us with the number of students whose parents accepted to take part in the study, and not of those who refused to. We distributed the surveys to all enrolled students (N = 614) and 576 participants completed all three waves (attrition rate was about 6%). Given that attrition rate was rather low, in the present study, we included the 576 complete cases. Therefore, the numbers of participants did not vary over the three waves. Data collection occurred in classrooms during regular schooltime. Participants completed a survey questionnaire 3 times, in the second term of their first (
Female students were 282 (49%). Participants for whom both parents were born in Italy were 453 (80.9%), whereas for the remaining participants at least one parent (n = 46, 8.2%) or both parents (n = 61, 10.9%) were born in another country. Examples of countries of origin of parents who were not born in Italy were as follows: Morocco, Albania, Romania, and Switzerland. The percentage of participants with parents who were born in another country did not vary between school, χ2(7, N = 560) = 11.27, p = .127. The highest level of education completed by the participants’ mother ranged as follows: six (1.0%) completed primary school, 45 (7.8%) completed middle school, 146 (25.3%) graduated from high school, 146 (25.3%) earned a graduate degree, while the remaining participants (n = 233, 40.5%) were not able to provide such information. Regarding the highest level of education completed by the participants’ father in our survey, 10 (1.7%) completed primary school, 60 (10.4%) completed middle school, 110 (19.1%) graduated from high school, 143 (24.8%) earned a graduate degree, while the remaining participants (n = 263, 43.9%) were not able to provide such information. Post hoc informal interviews with participants revealed that this information was difficult to remember and, therefore, almost half of the participants left this question unanswered.
Measures
SOC
We used the brief scale of Sense of Community in Adolescents (Chiessi et al., 2010; Cicognani et al., 2006; Cicognani et al., 2012). The scale includes 20 items corresponding to five factors: support and emotional connection in the community, support and emotional connection with peers, satisfaction of needs and opportunities for involvement, sense of belonging, and opportunities for influence. Responses were measured using a 5-point scale from 1 (not at all true) to 5 (completely true). Participants filled out the questionnaire with reference to their residential neighborhood (Cicognani, Klimstra, & Goossens, 2014).
Students’ relationships with their teachers
We used three items to assess students’ relationships with their teachers (Cicognani & Albanesi, 2015; Prati et al., 2017). The scale includes the following items: “My teachers are fair and just,” “I have a good relationship with teachers,” and “My teachers are interested in me as a person.” In the present research, Cronbach’s alpha coefficient for this scale was .82 (T1), .82 (T2), and .82 (T3).
Satisfaction with the classroom environment
A three-item scale was used to measure satisfaction with the classroom environment (Cicognani & Albanesi, 2015; Prati et al., 2017). The following items make up the scale: “The students in this class really care about each other,” “In my classroom, I feel good,” “In my classroom, I feel like a stranger” (reversed). In the present study, the alpha coefficient for this scale was .51 (T1), .64 (T2), and .70 (T3).
Well-being
Nine items from the Mental Health Continuum–Short Form (Keyes, 2006; Keyes et al., 2008; Lamers, Westerhof, Bohlmeijer, ten Klooster, & Keyes, 2011; Petrillo, Capone, Caso, & Keyes, 2015) were used to assess participants’ well-being. The instrument measures positive mental health, and participants are required to report their experiences in terms of emotional, psychological, and social well-being in the past month on a 6-point scale from 1 (never) to 6 (always). In the current research, internal consistency for this scale was .82 (T1), .87 (T2), and .88 (T3).
Social support
We used eight items from the Family and Friends subscales of the Multidimensional Scale of Perceived Social Support (Zimet, Dahlem, Zimet, & Farley, 1988) to assess the perception of the adequacy of support from family and friends, respectively. Each item was scored on a 5-point scale ranging from 1 = not at all true to 5 = completely true. In this study, reliability of the Family subscale was .79 (T1), .85 (T2), and .86 (T3), and reliability of the Friends subscale was .88 (T1), .88 (T2), and .90 (T3).
Pubertal development
Pubertal development was assessed with the Pubertal Development Scale (PDS; Petersen, Crockett, Richards, & Boxer, 1988). The PDS is a self-report measure that assesses the rate of change in secondary sexual characteristics. The PDS comprises five items. Three items assessing changes in body hair, skin, and growth spurt are administered to both boys and girls. Two items about change in voice and facial hair are administered to boys only, whereas one item about breast development and one concerning menarche are presented to girls only. Response scale ranges from 1 (no change) to 4 (complete development). A sum score was calculated and used for analyses. Reliability was .56 (T1), .60 (T2), and .64 (T3) for boys, and .68 (T1), .74 (T2), and .72 (T3) for girls.
Statistical Analyses
To determine the factorial structure of the SoC-EA, we used the data from the last year (T3) because the age of participants more closely resembled that of adolescents involved in the validation of the SoC-A (i.e., from 14 to 19 years; Chiessi et al., 2010; Cicognani et al., 2012). The factor analyses (both confirmatory factor analysis [CFA] and exploratory structural equation modeling [ESEM]) were conducted with Mplus 8.3 using mean and variance adjusted weighted least squares estimation method (WLSMV). Although a five-factor structure was hypothesized a priori following the conceptual model outlined by Chiessi et al. (2010), we tested six ESEM models with one to six correlated factors (Models 1-6). The ESEM models were estimated with an oblique geomin rotation. We determined the optimal number of factors by using the comparative fit index (CFI), Tucker-Lewis index (TLI), and root mean square error of approximation (RMSEA).
We then contrasted the ESEM representation of the SoC-EA with a CFA model that relies on the highly restrictive independent cluster model (ICM-CFA), a hierarchical CFA model (H-CFA), a bifactor CFA model (B-CFA). In the ICM-CFA model, factors were allowed to correlate, each item was only allowed to load on its corresponding factor, and no cross-loadings on other factors were allowed. In the H-CFA model, each factor was allowed to load on a higher order CFA factor and these factors were not allowed to correlate with each other. In the B-CFA model, each item was allowed to simultaneously load on one general factor as well as on its corresponding factor, with no cross-loadings and no correlations allowed across factors (i.e., they were specified as orthogonal).
We then tested the longitudinal measurement invariance by following four consecutive steps: configural invariance test, weak measurement invariance test (item factor loading invariance), strong measurement invariance test (item threshold invariance), and strict measurement invariance test (items’ uniquenesses). Although it is possible to test measurement invariance using more advanced levels, such as variance and covariance invariance, they “represent very strict standards that are often difficult to fulfill in practice” (Chen, 2007, p. 466). Measurement invariance tests were evaluated through the examination of changes in fit indices. A change of .010 or more in CFI and a change of .015 or more in RMSEA between the less restrictive and more restrictive models would indicate noninvariance (Chen, 2007; Cheung & Rensvold, 2002). Changes in CFIs and RMSEAs are considered more trustworthy than the chi-square difference tests which are sensitive to violation of the normality assumption and to sample size (Chen, 2007; Cheung & Rensvold, 2002). Therefore, although Δχ2 were reported, we gave priority to changes in fit indices. Although goodness-of-fit indexes have been recommended for the comparison of nested invariance models tests of weak, strong, and strict measurement invariance (Chen, 2007), the Δχ2 tests is preferable for tests of latent mean invariance (Fan & Sivo, 2009).
To determine the reliability of items, we computed Cronbach’s alpha as well as omega (ω; i.e., the proportion of variance that is attributed to both the general and group factors) and omega hierarchical (ωH; i.e., the proportion of variance that is attributed to the general factor) using the bifactor models which allow the partitioning of the diverse sources of variance into the general and group factors. As per Rodriguez, Reise, and Haviland (2016), the comparison of ω and ωH allows us to determine the amount of reliable variance of items attributable to the general factor (ωH divided by ω) and that attributable to the group factors (ωH subtracted from ω). According to Reise, Bonifay, and Haviland (2013), to justify the use of a total score despite the presence of clear multidimensionality in the data, a minimum of 75% variance accounted for by the general factor would be preferred.
We assessed the 3-year test-retest reliability using the intraclass correlation (ICC) coefficient two-way random model, that is, ICC(2,1) according to Shrout and Fleiss (1979), testing for absolute agreement based on a mean-rating (k = 3). Test-retest correlation was assessed using Pearson’s correlation. We followed recommendations by Cicchetti (1994) for interpreting test-retest reliability as poor (≤.40), fair (.41-.59), good (.60-.74), and excellent (≥.75). The effect size of the correlation coefficients was interpreted following the guidelines by Cohen (1988): about .10 = small effect, about .30 = medium, about .50 = large. We carried out reliability and correlation analyses using IBM SPSS Statistics 25, while ω and ωH were calculated using Mplus 8.3.
Results
Preliminary Analysis
To determine the potential effects of gender and migrant status on SOC, we performed a preliminary analysis that examined the association between gender and migrant status on SOC. We used generalized estimating equations to account for multiple survey measures. The results revealed that SOC scores were not predicted by gender, β = 0.04, 95% confidence interval (CI) = [− 0.07, 0.14], p = .410; migrant status, β = 0.27, 95% CI = [− 0.13, 0.18], p = .731; or type of area (urban vs. rural), β = 0.42, 95% CI = [− 0.06, 0.15], p = .437.
Factorial Structure of the SoC-EA
The ESEM with five factors (CFI = .990, TLI = .982, RMSEA = .050) was better-fitting compared to the ESEMs with one (CFI = .846, TLI = .828, RMSEA = .154), two (CFI = .893, TLI = .866, RMSEA = .136), three (CFI = .932, TLI = .903, RMSEA = .116), and four factors (CFI = .969, TLI = .949, RMSEA = .084). Although the six-factor model was also well fitting (CFI = .995, TLI = .989, RMSEA = .040), comparison of the five- and six-factor models did not provide evidence of the superiority of the six-factor model according to the ΔCFIs and ΔRMSEAs over the recommended 0.01 and 0.015 increase thresholds, respectively. The six-factor solution was similar to the five-factor solution except that the sixth factor included Item 17 only (“In this place, young people can find many opportunities to amuse themselves”). On the basis of theoretical expectations regarding the number of factors, we retained the more parsimonious five-factor model for subsequent analyses.
Both the B-CFA (CFI = .977, TLI = .971, RMSEA = .063) and the ESEM (CFI = .990, TLI = .982, RMSEA = .050) solutions provided excellent fit to the data, and a better representation of the data than the competing H-CFA (CFI = .952, TLI = .945, RMSEA = .088) and ICM-CFA (CFI = .904, TLI = .940, RMSEA = .091) models.
The pattern of item factor loadings is presented in the supplementary file Online Appendix 1. Items 5, 10, and 17 had non-negligible cross-factor loadings. Item 5 had a cross-factor loading (.368 and .324) with slightly higher loading for Opportunity for Influence (Factor 4) than Support and Emotional Connection with Peers (Factor 2). Item 10 had a cross-factor loading (.324, .289, .283) with slightly higher loading for Support and Emotional Connection in the Community (Factor 1) than the other factors. Item 17 had a cross-factor loading (.424 and .364) with slightly higher loading for Support and Emotional Connection with Peers (Factor 2) than Support and Emotional Connection in the Community (Factor 1).
Longitudinal Measurement Invariance of the SoC-EA
We now turn to tests of longitudinal invariance of the ESEM model (see Table 1). The model of configural invariance provides a good fit to the data (CFI = .960, TLI = .942, RMSEA = .028). Furthermore, we progressively added to this model invariance constraints to the factor loadings (weak invariance), items’ thresholds (strong invariance), and items’ uniqueness (strict invariance). Changes in fit indexes remained low and did not exceed the recommended cutoff scores for the fit indexes (ΔCFI < .01, ΔRMSEA < .015). Therefore, longitudinal strict invariance was supported.
Overall Longitudinal Measurement Equivalence/Invariance Model Fitting Indices and Comparison.

Note. df = Degrees of freedom; CFI = comparative fit index; TLI = Tucker-Lewis index; RMSEA = root mean square error of approximation.
p < .001.
We then tested a model restricting the factor means to be equal over time. This model had a significantly poorer fit than when the factor means were allowed to differ over time, Δχ2(5), = 16.795, p = .005. This indicates that there was a significant change in the factor means over the three time points. The exploration of latent means (expressed in SD units) allowed us to infer that, over time, latent means of Sense of Belonging decreased (
Internal Consistency, Test-Retest Reliability, and Test-Retest Correlation
Three-year test-retest reliability coefficients (ICC) for the five subscales and the total score of SoC-EA were as follows: (a) .62 (95% CI = [.67, .76]) for Support and Emotional Connection in the Community; (b) .75 (95% CI = [.71, .79]) for Support and Emotional Connection with Peers; (c) .68 (95% CI = [.62, .72]) for Satisfaction of Needs and Opportunities for Involvement; (d) .66 (95% CI = [.60, .71]) for Opportunity for Influence; (e) .75 (95% CI = [.70, .78]) Sense of Belonging; and (f) .77 (95% CI = [.73, .81]) for the total score. Test-retest correlations (in the supplementary file Online Appendix 2) ranged from .37 to .53 when comparing the T1 and T2 subscales and the total scores of SoC-EA, and from .42 to .58 when comparing these measures at T2 and T3. Intercorrelations among subscales and the total scores of SoC-EA (in the supplementary file Online Appendix 2) ranged from .47 to .88 at T1, from .78 to .93 at T2, and from .78 to .94 at T3. Cronbach’s alpha for the subscales and the total scores of SoC-EA ranged from .76 to .92 at T1, from .75 to .93 at T2, and from .78 to .94 at T3 (Table 2). We used the B-CFA model to calculate ω and ωH. We found high ω (.97) and ωH (.89) values, indicating that the general factor accounted for a large majority of the variance in item responding. Following the guidelines of Rodriguez et al. (2016), the amount of reliable variance of items attributable to the general SoC-EA factor (ωH divided by ω) was 92%, whereas 8% was that attributed to the multidimensionality determined by the group factors (ωH subtracted from ω).
Descriptive Statistics, Reliability, and Cross-Sectional Correlations with Well-Being, Class Satisfaction, Relationships with Teachers, Social Support, and Pubertal Development across the 3 Years.
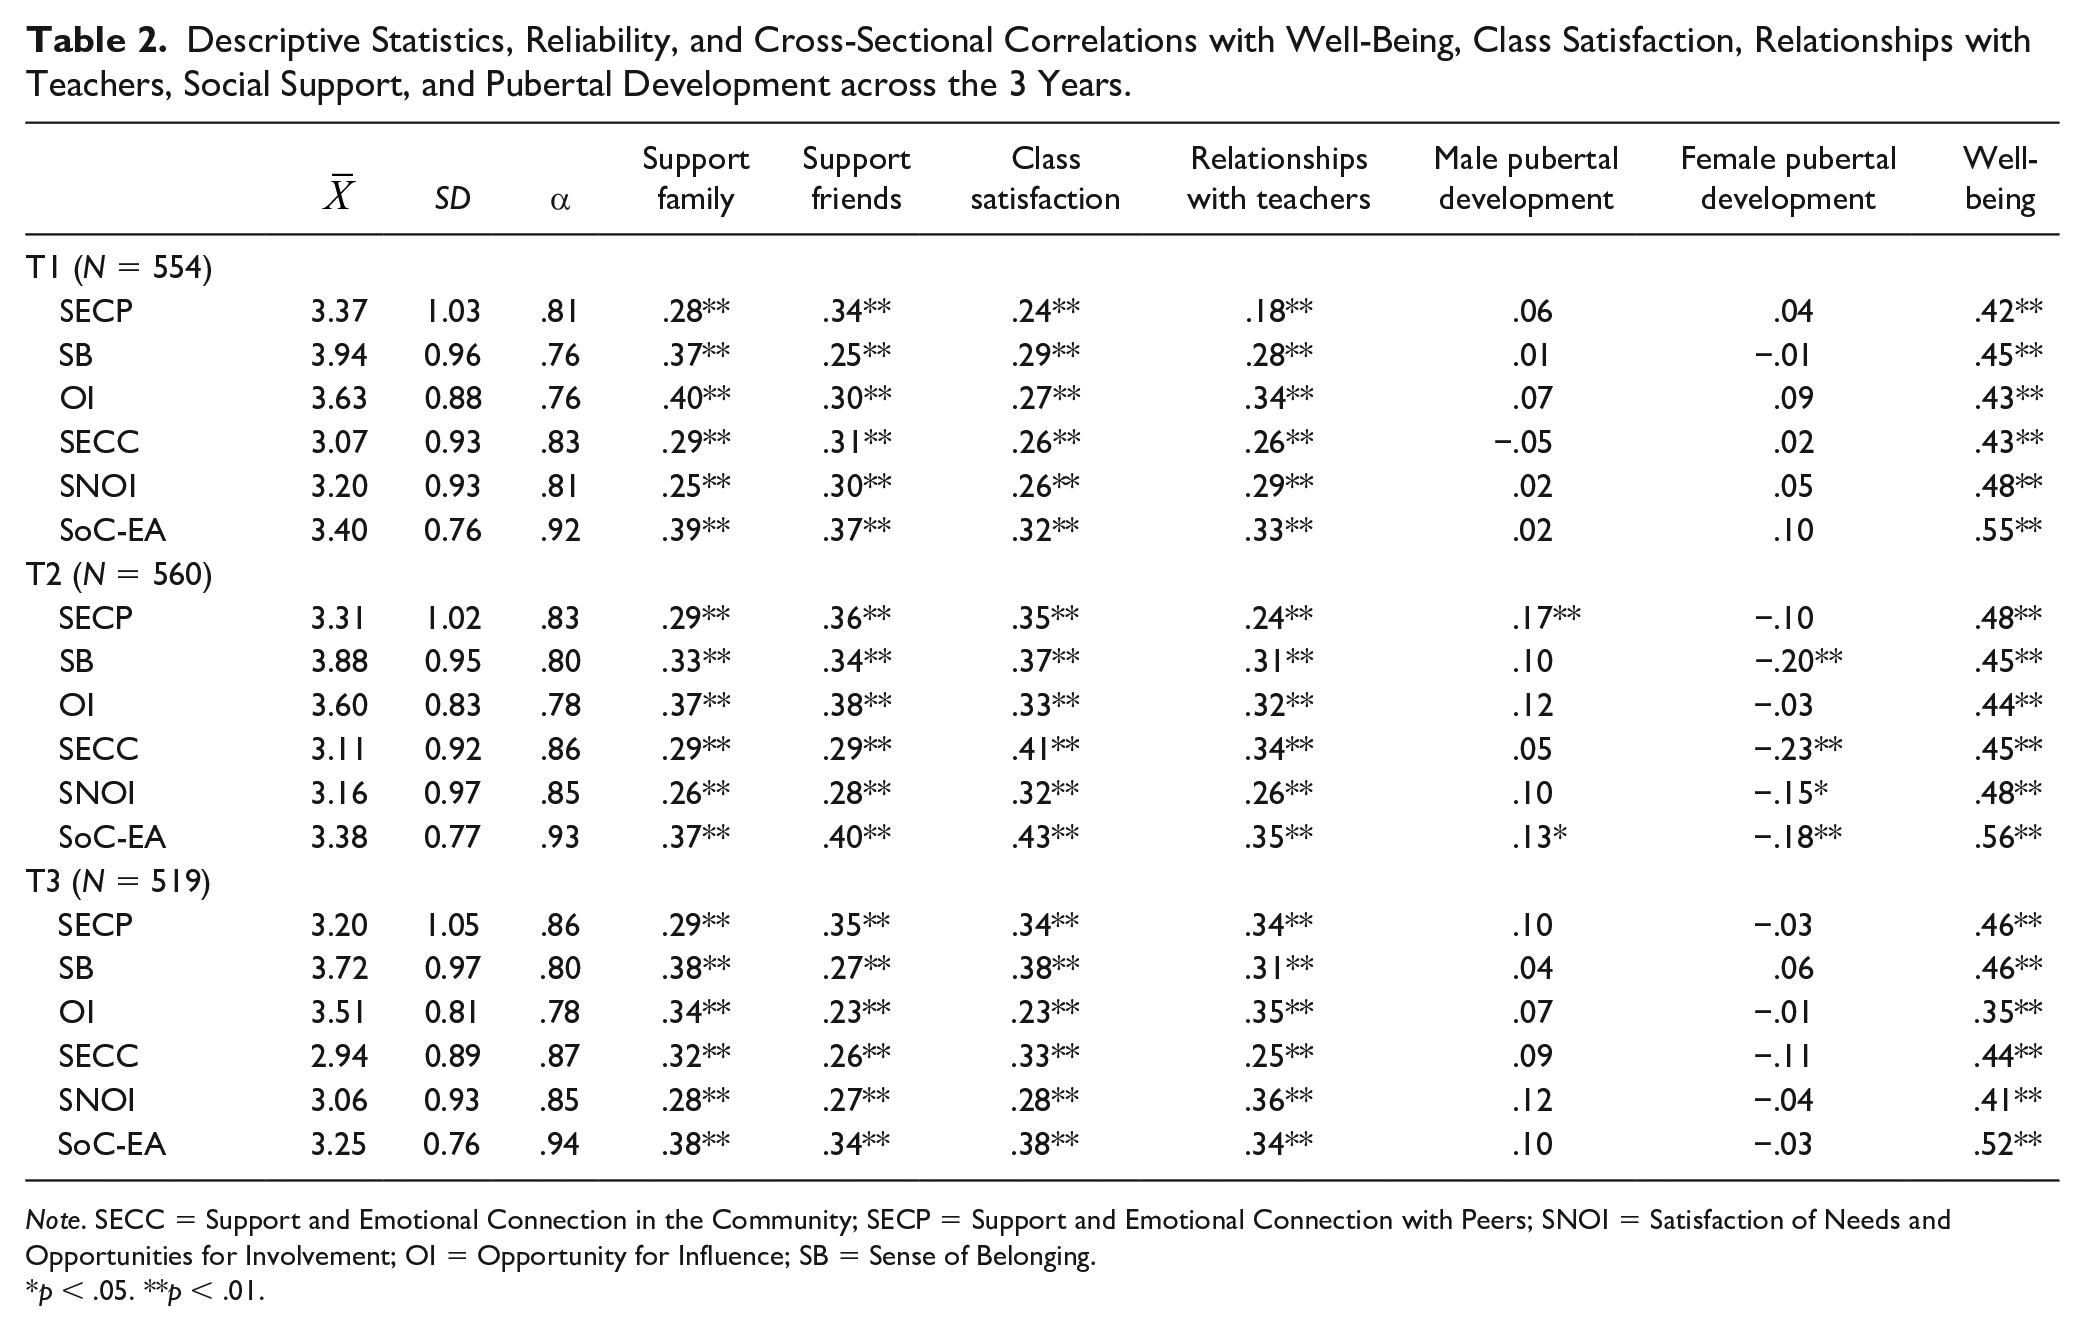
Note. SECC = Support and Emotional Connection in the Community; SECP = Support and Emotional Connection with Peers; SNOI = Satisfaction of Needs and Opportunities for Involvement; OI = Opportunity for Influence; SB = Sense of Belonging.
p < .05. **p < .01.
Construct Validity
Table 2 displays descriptive statistics and cross-sectional correlations with well-being, class satisfaction, relationships with teachers, social support, and pubertal development across the 3 years. The SoC-EA and its five subscales were significantly related to social support, class satisfaction, relationships with teachers, and well-being across the 3 years. The effect size of the correlation coefficients was generally medium for social support from family and friends, class satisfaction, and relationships with teachers, and large for well-being across the 3 years.
Discussion
The main aim of the present study was to contribute to a validation of a scale of SoC-EA. Specifically, we formulated five research objectives regarding the determination of the factorial structure of the SoC-EA; its measurement invariance across 3 years of early adolescence; its changes in factor means over time; its internal consistency, test-retest reliability, and test-retest correlations across the 3 years; and its construct validity.
Our analyses based on ESEM models revealed that a five-factor solution provided the best-fitting and more parsimonious representation of the data. This finding confirms the validity of the model proposed by Chiessi et al. (2010) among mid- and late adolescents. However, the factor loadings found in the present analysis did not completely match those obtained by Chiessi et al. (2010). Specifically, the item “As compared to others my town has many advantages” did load on the Satisfaction of Needs and Opportunities for Involvement dimension and not on the Sense of Belonging dimension. It seems plausible that early adolescents may have interpreted this item in terms of how much the community can satisfy their needs and stimulate involvement compared to others.
The good fit provided by the ESEM model suggests that items of the SOC-EA tended to exhibit at least some degree of association with nontarget dimensions. In the assessment of SOC among early adolescents, cross-loadings are expected since some perceptions of the community are inherently part of more than one dimension. Specifically, early adolescents may recognize that they belong to a community as long as they perceive support and emotional connection with peers from this community (cross-factor loading of Item 5). The view that one’s own community has advantages over others may be related to a sense of belonging as well as a perception of support and emotional connection, satisfaction of needs, and perceived opportunities for involvement (cross-factor loading of Item 10). Finally, when early adolescents feel that they can share experiences and interests with other young people in the community, this may be interpreted as a perception of support and emotional connection, satisfaction of needs, and perceived opportunities for involvement. The presence of relatively small cross-loadings is in line with the idea that items are fallible indicators of a single dimension and the strict requirement of zero cross-loadings in CFA (i.e., completely pure item) is an impossible ideal (Asparouhov & Muthén, 2009; Marsh, Morin, Parker, & Kaur, 2014; Morin, Marsh, & Nagengast, 2013). Indeed, the importance of ESEM lies in the fact that it can uncover such particular source of construct-relevant psychometric multidimensionality (i.e., cross-loadings).
In addition to the ESEM, the bifactor model provided an excellent degree of fit to the data too. This finding supports the hierarchical nature of the SOC construct among early adolescents. In other words, global and specific components within the same measurement model were found to coexist. The finding that a general factor accounted for 92% of the reliable variance in SoC-EA item responding suggests that SoC-EA was experienced holistically among early adolescents and could support the use of a total score (Reise et al., 2013). Since the five factors were also well-defined in the ESEM model, we interpret these findings as providing support for the use of both the five subscale scores and the global score. The zero-order correlations between SoC-EA subscale and total scores and well-being revealed that the total score tended to have a stronger association with well-being than the subscale scores. In terms of other study variables (e.g., social support from family, class satisfaction, relationships with teachers), both the SoC-EA subscales and the SoC-EA total score appeared to exhibit similar correlation coefficients. Future studies are needed to document when the use of a total score versus subscale scores is warranted. The strong correlation observed between SoC-EA and well-being provides evidence for the validity of this instrument. Indeed, the observed correlation between SoC-EA and well-being is in line with that obtained in previous research using different instruments (e.g., Prati et al., 2016; Prati et al., 2018; Prezza et al., 2001). In line with previous research using different instruments or involving different samples (e.g., Chiessi et al., 2010; Prati et al., 2017), we found that the magnitude of the correlation coefficients was higher between SoC-EA and well-being than between SoC-EA and other study variables. This pattern of findings further confirms the validity of the SoC-EA.
Support for the hypothesis that the SoC-EA holds equivalent measurement properties (i.e., item factor loading, item threshold, and items’ uniquenesses) across the three waves was also found. Our research represents the first effort to demonstrate the longitudinal invariance of a measure of SOC throughout the entire early adolescent period. The fact that the items of the SoC-EA measures the same underlying construct in a similar way across the entire early adolescent period allows us to draw valid conclusions concerning the correlates of and mean differences in SOC from the first year to the last year of middle school. Concerning mean differences, we found some evidence that Sense of Belonging tended to decrease across this period, whereas the means of the other subscales did not change significantly. We might hypothesize that increased autonomy and opportunities for exploration can result in disillusionment due to early negative experiences or to a progressively increasing desire to expand the horizon of one’s own community to a different environment (e.g., Evans, 2007; Pretty, Chipuer, & Bramston, 2003; Reich, 2010; Zani, Cicognani, & Albanesi, 2001). This may make it difficult to satisfy an early adolescent desire to belong and be an important part of the community. Another explanation for the observed decrease in Sense of Belonging may be related to changes in either social context or in cognitive development. In detail, the experience of multiple and diverse contexts may provide new and more complex information capable of influencing sense of belonging to the neighborhood. In parallel, cognitive development allows adolescents to simultaneously take into account more information while conducting evaluation processes. This may impact the cognitive representation of the community. However, these are just a speculation and need further investigation.
The construct validity of the SoC-EA was supported by the correlations with social support, class satisfaction, relationships with teachers, and well-being. As expected, SoC-EA showed higher correlations with well-being than with the other study variables. It is interesting to note that the size of the correlation coefficients was substantially similar across the 3 years. We have also demonstrated that SoC-EA subscale and total scores either were not associated or weakly associated with pubertal maturation. These findings rule out the hypothesis that physical maturation may have a strong influence on SOC among early adolescents. Therefore, the SoC-EA scale could be administered to all early adolescents irrespective of their pubertal maturation.
Limitations and Directions for Future Research
An important limitation of the present study is that students from only one country were taken into consideration. Therefore, the extent to which the findings from the study are applicable to students from other countries is unknown. In addition, there are issues about the generalizability of the findings to other age cohorts, given that the data are based on a single age cohort. Another limitation is the reliance on self-reported quantitative data. Recall bias as well as social desirability bias might have influenced the results. Ideally, construct validity could have been more stringently tested by a multitrait-multimethod approach. Finally, it would be useful in future research with early adolescents to assess other relevant correlates of SOC, such as civic engagement, empowerment, loneliness, identity, life satisfaction, and psychological symptoms (e.g., Chiessi et al., 2010; Cicognani et al., 2014; Cicognani, Mazzoni, Albanesi, & Zani, 2015; Pretty et al., 1994; Prezza et al., 2001; Prezza & Pacilli, 2007; Vieno et al., 2007). Another limitation is the low alpha coefficients for the satisfaction with the classroom environment measure and the PDS at T1. As for the satisfaction with the classroom environment measure, a possible reason is that at T1 students attended the first year of middle schools and their evaluations of the classroom environment were still being defined. As regards the PDS, the low reliability at T1 pubertal changes typically appears in sequence; it is plausible that boys at age 11 may experience some pubertal changes but not others which would reflect in low item-total correlation, as has been found in previous research (e.g., Dick, Rose, Pulkkinen, & Kaprio, 2001). Factor analyses (which are not reported here) revealed that the satisfaction with the classroom environment measure and the PDS at T1 were unidimensional. Finally, although our findings supported the use of bifactor and ESEM models, it remains unknown whether the same psychometric representation will necessarily generalize to other measures of SOC (e.g., for adolescents or adults). Future work is needed to explore these possibilities.
Conclusion
This investigation contributed to the validation of a scale assessing SOC among early adolescents. The analysis of the factorial structure of the SoC-EA revealed two sources of construct-relevant psychometric multidimensionality related to hierarchically superior constructs (i.e., the coexistence of a general and group factors) and the fallible nature of the imperfect indicators that report some association with nontarget constructs (i.e., relatively small cross-loadings). Due to these sources of construct-relevant psychometric multidimensionality, the SoC-EA can be represented by a five-factor model as well as a general construct. We provided evidence that the measurement properties of the SoC-EA remain stable throughout the early adolescence period and that this instrument has good reliability and construct validity. In summary, the results of the study demonstrated the good psychometric properties of the SoC-EA and that this instrument is effective for measuring SOC in early adolescence.
Supplemental Material
Appendix_1 – Supplemental material for Sense of Community in Early Adolescents: Validating the Scale of Sense of Community in Early Adolescents
Supplemental material, Appendix_1 for Sense of Community in Early Adolescents: Validating the Scale of Sense of Community in Early Adolescents by Gabriele Prati, Carlo Tomasetto and Elvira Cicognani in The Journal of Early Adolescence
Supplemental Material
Appendix_2 – Supplemental material for Sense of Community in Early Adolescents: Validating the Scale of Sense of Community in Early Adolescents
Supplemental material, Appendix_2 for Sense of Community in Early Adolescents: Validating the Scale of Sense of Community in Early Adolescents by Gabriele Prati, Carlo Tomasetto and Elvira Cicognani in The Journal of Early Adolescence
Footnotes
Declaration of Conflicting Interests
The author(s) declared no potential conflicts of interest with respect to the research, authorship, and/or publication of this article.
Funding
The author(s) disclosed receipt of the following financial support for the research, authorship and/or publication of this article: This study was supported by a financial contribution from the Municipality of Cesena and the ASP (Public Company for Services to the Population) of the Rubicone District, Italy (2016-2019).
Supplemental Material
Supplemental material for this article is available online.
Author Biographies
References
Supplementary Material
Please find the following supplemental material available below.
For Open Access articles published under a Creative Commons License, all supplemental material carries the same license as the article it is associated with.
For non-Open Access articles published, all supplemental material carries a non-exclusive license, and permission requests for re-use of supplemental material or any part of supplemental material shall be sent directly to the copyright owner as specified in the copyright notice associated with the article.