
Abstract
The Expectancy-Value model has been extensively used to understand students' achievement motivation. However, recent studies propose the inclusion of cost as a separate construct from values, leading to the development of the Expectancy-Value-Cost model. This study aimed to adapt Kosovich et al.’s (The Journal of Early Adolescence, 35, 5–6, 2015) instrument for assessing achievement motivation in science and math among Spanish-speaking students aged 9–12. The psychometric evaluation encompassed examining validity, reliability, and measurement invariance for gender. The findings support the applicability of the expectancy-value-cost model in elementary school students, providing a valid and reliable tool for assessing achievement motivation in the science and math domain. However, the findings for the measurement invariance for gender are less conclusive and warrant future psychometric evaluations. This study opens avenues for future research on achievement motivation in Spanish-speaking contexts and populations.
Introduction
For decades, the Expectancy-Value model has shown its usefulness in understanding students' academic motivation and in predicting individuals' career aspirations in STEM (Science, Technology, Engineering, and Mathematics) fields (Eccles & Wigfield, 2020; Wigfield & Eccles, 2020). However, one construct of this theory, cost –defined as “what is lost, given up, or suffered as a consequence of engaging in a particular activity” (Eccles & Wigfield, 1995, p. 216, p. 216)– was conceptualized as a negative dimension of task-values affecting attainment, intrinsic and utility beliefs. Despite its theoretical importance, cost was largely neglected in the literature. Yet, recent studies signals cost as an important aspect of individuals' achievement motivation (Jiang et al., 2018; Muenks et al., 2023; Toma, 2021a, 2022b). In addition, extant research with middle and high school students, as well as with undergraduates, found that cost is a first-order construct and not a dimension of task values (Beymer et al., 2021; Flake et al., 2015; Kosovich et al., 2017; Muenks et al., 2023). Such findings extended the scope of the Expectancy-Value theory and led to a refined model, the Expectancy-Value-Cost model (Barron & Hulleman, 2015; Kosovich et al., 2015).
Despite the widespread attention to the EVC model, the Spanish-speaking research agenda lacks a valid and reliable instrument rooted in such a model. Indeed, a series of systematic reviews of the literature and critical analyses of available instruments failed to find valid and reliable tools for the measurement of Spanish-speaking students' expectancies of success, task values, or costs in school science and math domains (Toma, 2020; Toma & Lederman, 2020). Further, to the best of the author’s knowledge, there is no evidence that the EVC model could be used in elementary school students, a much more crucial period in the promotion of STEM career aspirations than the secondary school years (Maltese & Tai, 2011; Tai et al., 2006).
Cultural adaptation of measurement instruments is the cornerstone of social science research and thus forms the basis for fairness in educational and psychological testing for individuals of different cultural backgrounds (AERA et al., 2014; Jonson & Geisinger, 2022). In their influential study on psychometric properties of measurement instruments, Blalock et al. (2008) advocated continuing to adapt and validate promising instruments, rather than designing new ones. Eventually, a cohesive set of measures will emerge, allowing international comparisons to be made. The present study, then, addresses such an endeavour. It identifies a promising instrument: the scale proposed by Kosovich et al. (2015) to measure Expectancy-Value-Cost in school math and science. Specifically, it presents a cross-cultural validation of this instrument for Spanish students in elementary education, spanning from fourth to sixth grades. The study’s theoretical significance lies in testing the EVC model’s potential to measure elementary school students' achievement motivation in both science and math domains. At the same time, its methodological contribution is threefold: firstly, it presents valid and reliable instruments for the math and science domain; secondly, it paves the way toward EVC-based research with the Spanish-speaking population; and thirdly, it complements Kosovich et al.’s (2015) study on middle school students in grades six to eight.
Theoretical Underpinnings
Why Achievement Motivation?
Students' interest in STEM-related careers has been steadily declining over the last decade (DeWitt & Archer, 2015; Gottlieb, 2018; Liou, 2021; Newell et al., 2015). Several countries, including but not limited to Spain (Ministerio de Universidades [Ministry of Universities], 2022), Australia (Kennedy et al., 2014), England (DeWitt & Archer, 2015), and the United States (National Science Foundation, NSF, 2017) are facing a shortage of graduates in STEM fields. This waning interest is highly concerning given the concomitant need for a specialized workforce (Bybee, 2010; Gago et al., 2004; Tanenbaum, 2016). As a result, there is a wealth of research addressing students' achievement motivation (for a review, see van den Hurk et al., 2019), which are defined as psychological traits influencing career choice and persistence (Wigfield & Cambria, 2014).
Importance of Elementary Grades
Students who express an early interest in science are more likely to pursue science-related studies (Maltese & Tai, 2011), with competence beliefs and valuing what they study being important factors in the development of their aspirations (Aschbacher et al., 2014). Likewise, motivation in math plays an important role in scientific vocations (Caspi et al., 2019; Guo et al., 2015). Despite this, the extant literature on achievement motivation focuses on secondary school students. Indeed, most expectancy-value theory (EVT) studies explored middle and high school students’ achievement motivation (Andersen & Ward, 2014; Caspi et al., 2019; for review, see Wigfield & Eccles, 2020). The decline in science aspirations, however, begins in elementary school. Ball et al. (2017a) concluded that motivational interventions should emphasize expectancy-value aspects from the fourth and fifth grades. Kang et al. (2019) found that 13-year-old secondary school students already exhibit an established pattern of interest towards or against different scientific disciplines. Wiebe et al. (2018) found gender variations in 4th to 12th graders' views of biology and physics. On the other hand, according to the literature, gender differences in academic motivation may start as early as elementary school. For example, Wiebe et al. (2018) discovered that boys tend to prefer physics while girls tend to favour biological and clinical sciences. Similar results were obtained in the Spanish context, where a study by Toma (2022a) found that third-grade students displayed gendered preferences for science disciplines, with girls gravitating toward biology-related content and boys showing a preference for physics-related content. Hence, elementary school students’ motivation must be studied to prevent the disinterest identified in secondary school, with special attention to gender differences (Miller, 2021).
The Expectancy-Value Model
The EVT is posited as one of the most influential theory for understanding students' motivation (Eccles & Wigfield, 2020). It advances two major constructs: expectancies of success and task values (Eccles et al., 1983; Wigfield, 1994; Wigfield & Eccles, 2020). The first construct refers to beliefs about one’s ability to be successful in a given task (Wigfield & Cambria, 2010). The second denotes the value individuals place on the given task and embodies four subdomains (Eccles & Wigfield, 2020): (a) attainment value (importance of doing well in the task), (b) intrinsic value (enjoyment gained from the task), (c) utility value (how the task fits into an individual’s plans), and (d) cost (aspects sacrificed and anticipated effort for task completion). Although cost was conceptualized as an important aspect of task values, its measurement was neglected in the STEM career aspiration literature (e.g. Abraham & Barker, 2014; Appianing & Van Eck, 2018; Fredricks et al., 2018; Lykkegaard & Ulriksen, 2016; for review, see Eccles & Wigfield, 2020). Moreover, when the cost construct was measured, it was included as a dimension of task values following its original conceptualization (e.g., Andersen & Ward, 2014; Andrews et al., 2017; Ball et al., 2017b; Caspi et al., 2019; Gaspard et al., 2017; Luttrell et al., 2010).
The Expectancy-Value-Cost Model
New research on the cost construct indicates that it is a multidimensional construct that includes several dimensions. For example, Perez et al. (2014) reported a three-factor model including task effort, loss of valued alternatives, and psychological cost. Flake et al. (2015) further extended the cost construct by reporting four dimensions: task effort, outside effort, loss of valued alternatives, and emotional cost (see also Beymer et al., 2021). The growing emphasis on the cost construct led to a refined conception of expectancy-value theory, which resulted in a model being renamed Expectancy-Value-Cost (EVC; Barron & Hulleman, 2015). In contrast to the Expectancy-Value model, it posits cost as a separate trait from task values (Kosovich et al., 2017; Toma, 2021b). Several studies advanced evidence in support of this reconceptualization for predicting students’ academic motivation and educational outcomes (Jiang et al., 2018; Kosovich et al., 2017). In this sense, Kosovich et al. (2015) proposed a 10-item Expectancy-Value-Cost (EVC) questionnaire that can be used to measure motivation across science and math domains in middle school students. The psychometric analysis supported the three-factor structure against the original expectancy-value model. As a result, the EVC model has gained support in educational psychology studies (Barron & Hulleman, 2015; Jiang et al., 2018; Jiang & Rosenzweig, 2021). There is an ongoing discussion on the need for clearer empirical conceptualization and differentiation of cost (Eccles & Wigfield, 2020, 2023). However, it is important to acknowledge that the EVC model has some limitations in its conceptualization of value and cost. Literature suggests that both value and cost are multidimensional (Beymer et al., 2021; Eccles & Wigfield, 2020; Wigfield & Eccles, 2020), but the EVC model measures both constructs as unidimensional, which may not fully capture their complexity. Moreover, a recent study provided empirical support for both perspectives of considering cost as a subdimension of the value construct, and cost as a distinct dimension (Muenks et al., 2023). Therefore, this issue remains a source of lively debate.
Method
Design and Validity Framework
Sources of Validity.

aThis aspect was already examined by Kosovich et al. (2015). A new theoretical analysis of the items is unnecessary because the Spanish version does not add or delete items from the original questionnaire.
Participants and Procedure
Participants’ Characteristics.

The Standards caution of testing effects that may affect the validity of results. As the results were obtained through a self-report instrument, the following measures were taken into account to enhance the validity and reliability of responses and reduce social desirability bias. The EVC instrument was designed to assess students' academic motivation in science and mathematics separately, and the scales were administered during corresponding classes to avoid identical responses. To prevent elementary school children thinking that providing a negative response to the questionnaire will have repercussions, students were informed that their participation was anonymous, voluntary, and confidential, and classroom teachers were not involved in questionnaire administration. The study was approved by the Vice-rectorate of Research of the University of Burgos and informed consent was obtained from the parents or legal tutors of the participants.
Instruments
Expectancy-Value-Cost Questionnaire
The EVC scale by Kosovich et al. (2015) stands as a promising measurement instrument. Reasons include a strong conceptual underpinning consistent with recent conceptualizations of the expectancy-value model of achievement motivation, robust psychometric properties, the inclusion of conceptually justified traits, low administration burden, and basic assessment procedures (American Educational Research Association [AERA], the National Council on Measurement in Education [NCME], and the American Psychological Association [APA], 2014). Also, the instrument was deemed valid and reliable in the two important academic domains to improve STEM career aspirations, namely science and math (Cannady et al., 2014; Caspi et al., 2019). The original Likert-type scale was used in this study (1 = strongly disagree, 2 = disagree, 3 = neither disagree nor agree, 4 = agree, and 5 = strongly agree).
Spanish School-Science Attitude Survey (S-SSAS)
Informed by the study of Toma and Meneses-Villagrá (2019), which validated the School-Science Attitude Survey (SSAS; Kennedy et al., 2016) for the Spanish context, students were requested to report their intentions to enrol in future school science (i.e., I am very likely to enrol on a science course in secondary school). Such measure was found to have strong evidence for validity, meeting four out of the five sources for validity established in the Standards. As for the reliability domain, the authors provided robust evidence for internal consistency using item-total correlation (r = .56) and for temporal stability (intraclass correlation of .868 within 10 days between the first and second administration). A five-point Likert scale was used in the present study (1 = strongly disagree, 2 = disagree, 3 = neither disagree nor agree, 4 = agree, and 5 = strongly agree).
Statistical Analysis Plan
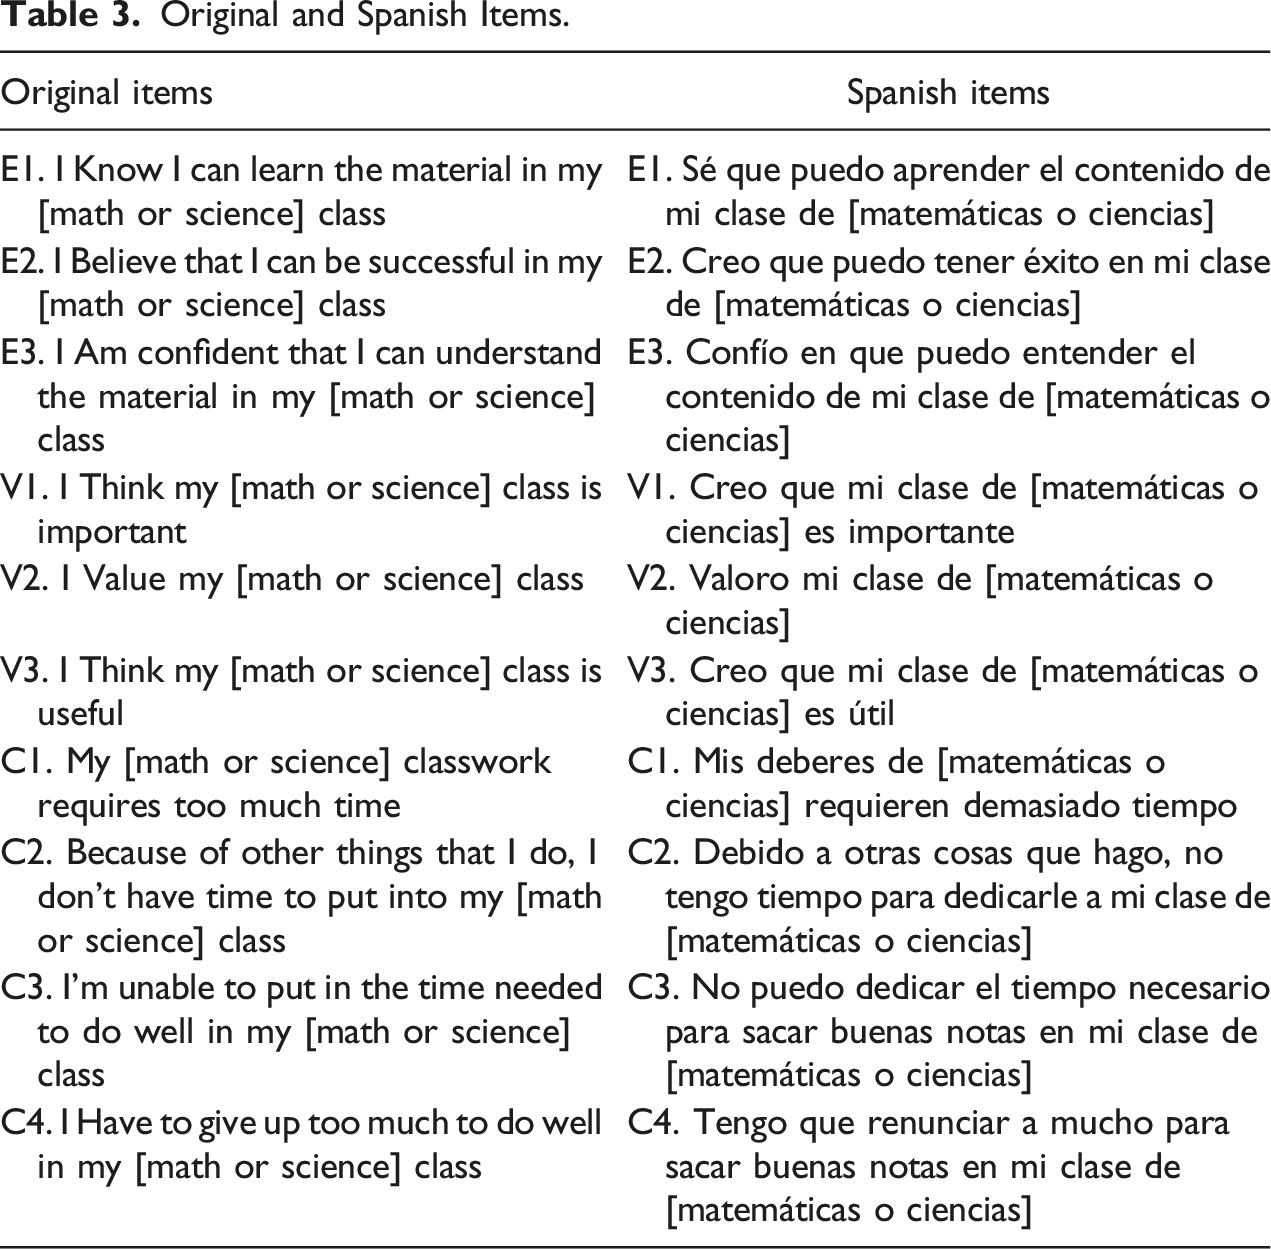
For the test content type of validity source, a cross-cultural translation procedure was used to ensure that the Spanish test content represents the original version (Beaton et al., 2000). First, two bilingual English teachers independently forward-translated the items. Next, translators and the author of this study reached a consensus on one common Spanish version. A third bilingual English teacher, blind to the original version of the questionnaire, back-translated the Spanish items into the source language. All translators and the author of this study jointly reviewed the equivalence between the original and back-translated versions.
Regarding response processes sources of validity, nineteen students aged 9–10, drawn from a single class, were think-aloud interviewed. In trios or quartets, students explained how they interpreted each item (Beatty & Willis, 2007).
Concerning the internal structure source of validity, confirmatory factor analysis using Maximum Likelihood estimation in Amos v.23 software was performed independently on items written for the math domain (i.e., I value my math class) and then on items referring to the science domain (i.e., I value my science class). Data met statistical assumptions (Harrington, 2009): (i) there were no missing data; (ii) 5 cases were deleted for multivariate outliers, as indicated by Mahalanobis distance; (iii) the assumption of singularity and multicollinearity was not violated (highest correlation between items was r = .46 and r = .53 for the math and science questionnaires); and (iv) inspection of skewness and kurtosis suggested normality distribution of data (within ±2).
We tested the four competing models representing different conceptualizations of the expectancy-value theory (see Figures 1 and 2 from results section), which were assessed by Kosovich et al. (2015). Models included: (a) achievement motivation as a single factor structure comprising all 10 items; (b) original two-factor model where expectancy and values are conceived as two distinct factors; (c) two separate factors of positive (expectancy and value) and negative traits (cost); and (d) expectancy, value, and cost as three distinct factors. Standardized factor loadings for the math questionnaire. Standardized factor loadings for the science questionnaire.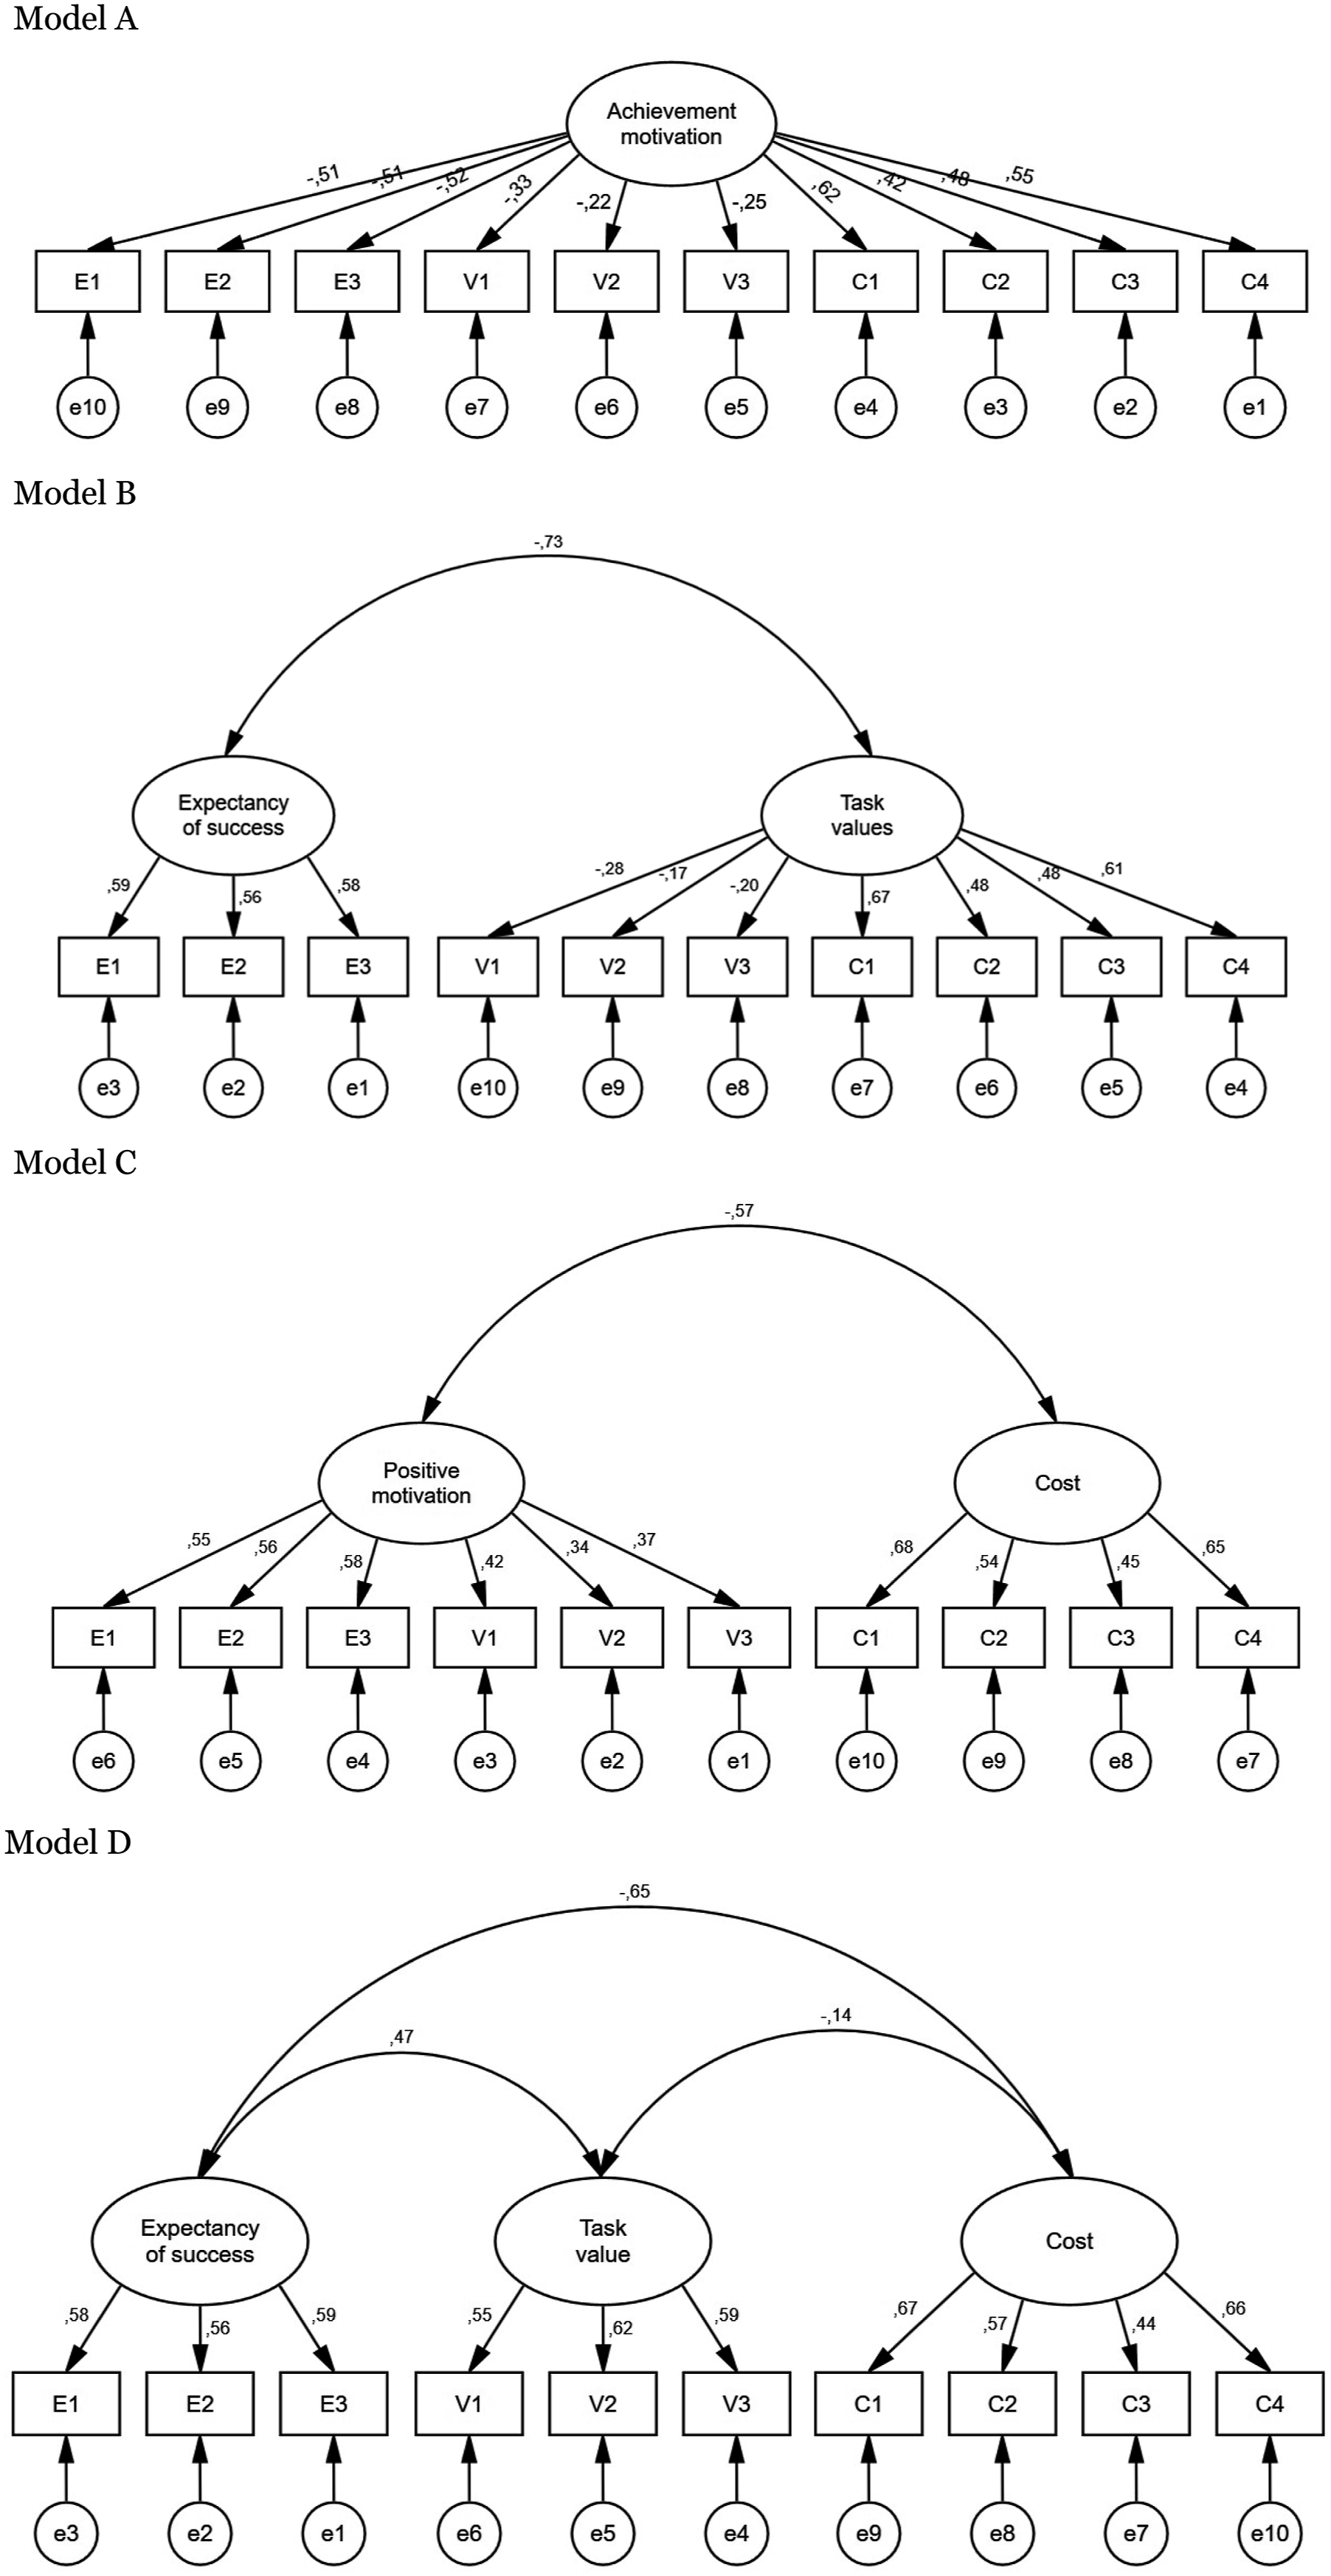

Model D is expected to be the best fit for several reasons. Firstly, Kosovich et al.'s (2015) findings support the distinct nature of expectancy-value-cost as first-order constructs. Secondly, the unidimensional conceptualization and measurement of the value construct in Kosovich et al.'s EVC instrument further supports this expectation. If the measure had been multidimensional, with specific items for measuring attainment, intrinsic, and utility value, a different factor structure could have been anticipated since previous studies suggest that some task value constructs may not be salient in young children (Ball et al., 2016; Eccles & Wigfield, 2020). However, since this is not the case, we anticipate replicating Kosovich et al.'s (2015) results with a Spanish-speaking sample of 9–12 year olds.
Multiple goodness-of-fit indicators were used to assess the adequacy of model fit (Hu & Bentler, 1999; Marsh et al., 2004). These included the comparative fit index (CFI) and the Tucker Lewis index (TLI) ≥.95 for excellent and ≥.90 for acceptable fit. Additionally, the root mean square error of approximation (RMSEA) ≤ .06 indicate excellent fit, and ≤.08 indicate acceptable fit. Finally, the standardized root mean square residual (SRMR) ≤ .08 for excellent and ≤.10 for acceptable fit. The Akaike information criterion (AIC) was also used; the model with the lowest AIC was deemed to have a superior fit (Kline, 2005).
We evaluated the measurement invariance of gender (boys vs. girls) for both math and science questionnaires separately, using the best fitting model. Sample size hampered the possibility of conducting measurement invariance testing for age or grade levels (Byrne, 2016; Putnick & Bornstein, 2016). To ensure configural, metric, and scalar invariance, we adhered to common recommendations (Byrne, 2016; Chen, 2007). Specifically, for configural invariance, we used the thresholds for model fit mentioned above (CFI, TLI, RMSEA, and SRMR). For assessing metric and scalar invariance, we employed ΔCFI ≤.01. CFI was selected as the primary criteria because RMSEA and SRMR can potentially result in falsely rejecting an invariant model in situations with small sample sizes (Chen, 2007).
In assessing the internal consistency reliability, we evaluated the best fitting model using two commonly used indicators in the literature: Cronbach’s alpha (α) and McDonald’s omega (ωt). While Cronbach’s alpha is widely used, McDonald’s omega is a more appropriate index for ordinal Likert-type items (Hayes & Coutts, 2020; Watkins, 2017). The following cut-off scores were used: <.60 unacceptably low reliability; .60 to .69 marginally reliable; .70 to .79 reliable; .80 to .90 highly reliable (Cohen et al., 2018).
As for the relations to other variables type of validity source, Pearson correlation was performed between EVC scales and future school science enrolment intentions as measured by the S-SSAS instrument (Toma & Meneses-Villagrá, 2019). Given that both motivation in math and science are related to intentions to enrol in further science studies, expectancy and value constructs should be positively correlated with intention; likewise, a negative correlation between cost and intentions is expected (Aeschlimann et al., 2016; Andersen & Ward, 2014; Eccles & Wang, 2016; Lykkegaard & Ulriksen, 2016).
Results
Test content and response processes
Original and Spanish Items.
Internal structure
Figures 1 and 2 present standardized factor loadings for the math and science questionnaires. The single-factor (model A) and the original Expectancy-Value structure (model B) revealed items with factor loadings below recommended standards of .32 (e.g., items V1, V2, and V3). The factor structure separating constructs with positive and negative valence (model C) and the three-factor Expectancy-Value-Cost structure (model D) yielded high factor loadings. This was especially the case for the EVC structure (model D), with loadings ranging from .44 to .66 for the math questionnaire, and .52 to .72 for the science measure.
Goodness of Fit Indices.

χ2, chi square; df, degree of freedom; CFI, Comparative Fit Index; TLI, Tucker Lewis Index; RMSEA, Root Mean Square Error of Approximation; SRMR, Standardized Root Mean Square Residual; AIC, Akaike Information Criterion.
Regarding measurement invariance of the math version of the questionnaire, configural invariance indicated equal factor structures across boys and girl (χ2 = 82.26, df = 64, CFI = .946, TLI = .925, RMSEA = .051, SRMR = .065). Findings of metric invariance indicated that factor loadings are equal across girls and boys (CFI = .938, ΔCFI = .008). Finally, scalar invariance was not achieved, with ΔCFI marginally above the cut-off scores (CFI = .921, ΔCFI = .017).
Regarding measurement invariance of the science version of the questionnaire, configural invariance indicated equal factor structures across boys and girl (χ2 = 108.703, df = 64, CFI = .916, TLI = .882, RMSEA = .080, SRMR = .063); although the TLI is marginally below the ≥.90 cutoff score for acceptable fit. Findings of metric invariance indicated that factor loadings are equal across girls and boys (CFI = .922, ΔCFI = −.006). Finally, scalar invariance indicated that the items have similar interpretations across girls and boys. (CFI = .926, ΔCFI = −.004).
Internal Consistency Reliability Indices.
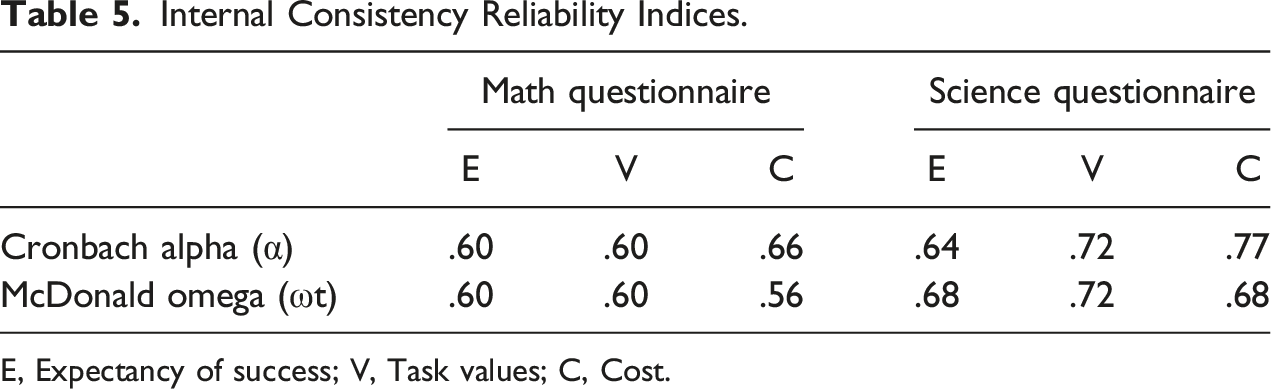
E, Expectancy of success; V, Task values; C, Cost.
Relation to other variables
Pearson Correlation Between EVC Questionnaire and Intentions.

* Correlation is significant at the .05 level.
** Correlation is significant at the .01 level.
Discussion
The cost construct has attracted attention in recent years, leading to refined conceptualizations of the expectancy-value theory. In this sense, the EVC model posits cost to be a first-order construct separated from task values. So far, instruments for the assessment of Spanish-speaking students’ expectancies of success, values, and cost have been lacking (Toma & Lederman, 2020). Hence, the purpose of this study was to adapt to Spanish the scale of Kosovich et al. (2015), which is rooted in the EVC model. In doing so, this study fills the gap in valid and reliable motivational instruments for the school math and science domains. The findings of this study show promising evidence of validity and reliability for the Spanish version of the instrument. It consists of 10 short items that are easy to administer and evaluate, show strong psychometric properties in terms of structural, convergent, discriminant, and concurrent validity, and demonstrate acceptable evidence of reliability. Its use in both math and science school subjects might assist researchers in disentangling the factors affecting Spanish-speaking students’ career enrolment plans. As such, the Spanish EVC represents one of the first efforts in such an endeavour.
Psychometric analysis suggests that the Spanish EVC is theoretically consistent with the original questionnaire (Kosovich et al., 2015). Specifically, confirmatory factor analysis revealed better fit indices for the three-factor model rather than for the unidimensional or the two-factor models for both the math and science questionnaire. The model fit indices for the science questionnaire were excellent and aligned with the findings of Kosovich et al. (2015). However, the math questionnaire’s indices were lower than Kosovich et al.'s (2015) results, with only the RMSEA and SRMR reaching excellent values and the CFI and TLI reaching adequate values according to Hu and Bentler’s (1999) strict criteria. Nonetheless, caution must be exercised to avoid overgeneralizing conservative values (Harrington, 2009; Marsh et al., 2004). As a result, the model fit of the math questionnaire can also be deemed good. Thus, the Expectancy-value-cost conceptualization can effectively assess the motivation in school math and science of Spanish-speaking students enrolled in fourth to sixth elementary grades. Therefore, the questionnaire should be used as three separate scales measuring the major domains of achievement motivation.
In addition, in line with Kosovich et al.'s (2015) findings, this study found evidence of measurement invariance across gender, albeit inconclusive for the math measure. The science questionnaire demonstrated configural, metric, and scalar invariance. This indicates consistent underlying structure, variable relationships, and their strengths and directions for girls and boys. Moreover, the measurement scales, factor loadings, and item intercepts were equivalent across groups. Therefore, achieving invariance for the science questionnaire ensures equal meaning and interpretation of the instrument for everyone, facilitating fair comparisons and accurate understanding of the measured construct (AERA et al., 2014; Byrne, 2016).
The math version of the questionnaire attained configural and metric invariance, suggesting equivalent factor structure and loadings for expectancy, value, and cost variables in girls and boys. However, scalar invariance showed marginally indices, implying potential differences in item meanings or interpretations between girls and boys. Further psychometric studies are warranted to explore this aspect.
On the other hand, this study also found evidence for the ‘relation to other variables’ source of validity suggested in the Standards for educational and psychological testing (AERA et al., 2014). Indeed expectancy, value, and cost of math and science were found to be correlated with students' intentions to enrol in future science studies, with exception of the science cost construct. These findings are promising, although it remains a subject worth investigating in future studies, especially of the cost of the science domain.
While validity evidence was overall satisfactory, the reliability of the math questionnaire was rather lower than expected. Cronbach’s alpha and McDonald’s omega indices were in the ’60-’70s range. These findings contrast with Kosovich et al. (2015) who found values above .80. Nevertheless, such lower values are also common in the expectancy-value literature. For example, Andersen and Ward’s (2014) scale measuring intrinsic value displayed an α = .68. Ball et al. (2016; 2017a) reported an alpha of .56 and .65 for their intrinsic value scale, respectively. Eccles and Wigfield’s (1995) utility value dimension reached an alpha value of .62. In the same way, Bøe’s (2012) expectancies of success and interest/enjoyment value scales had the reliability of α = .64 and .69, respectively. Moreover, the lower reliability of the math questionnaire in this study compared to Kosovich et al.'s (2015) study may be partly due to the younger age of the participants, as suggested by previous research on young students (Ball et al., 2017a). Consequently, the math and science EVC for Spanish students can be considered to possess adequate reliability for exploratory research, especially considering the low number of items per domain and the young age of the respondents. In this sense, the Standards (AERA et al., 2014) state that test developers should be aware of the limitations of tests with young children. This could also explain why some of the models may have had low model fit.
These findings make important theoretical and methodological contributions. On the one hand, it fills gaps in valid and reliable instruments for measuring the expectancies of success, values, and cost of math and science classes among Spanish-speaking students (Toma, 2020; Toma & Lederman, 2020). On the other hand, it provides evidence for the expectancy-value-cost model to be salient in fourth to sixth-grade elementary school students. To the best of the author’s knowledge, this is the first study of its kind at this educational level. This conceptualization was used with middle school students by Kosovich et al. (2015), and Jiang et al. (2018) confirmed its plausibility with middle and high school students. In the same vein, Muenks et al. (2023) provided evidence for the expectancy-value-cost perspective in undergraduate students. Given that the literature suggests elementary grades to be critical in the promotion of scientific vocations (Miller, 2021; Tai et al., 2006), these findings have implications for future research aimed at improving students' math and science expectancies and values, while lowering their perceived cost.
Implications, Limitations, and Avenues for Future Research
Given its psychometric properties, the Spanish EVC can be used to facilitate an understanding of how motivational variables could shape students’ intentions to pursue STEM-related studies or careers. Since career aspirations may be already established by the secondary education stage (Maltese & Tai, 2011), there is a need for investigations that examine motivational variables that may affect the career aspirations of late-elementary school students aged 9–12. Due to its brevity and simplicity, this instrument has the potential to achieve schools' and students’ compliance with participation in studies. Similarly, it can be used in research studies that require the examination of several variables. For example, previous studies addressing this aspect focused on either the science or the math domain (for a review, see Bøe et al., 2011). Little attention has been devoted to the incremental effect that achievement motivations in both disciplines could have on students' intentions to pursue optional science-related subjects. The Spanish EVC scale advanced in this study allows pursuing such an endeavour.
The present research does exhibit some limitations. First, the sample was drawn using convenience sampling techniques, which limits the generalization of the findings reported. It should also be mentioned that students participating in this study were from a city that surpasses national scores in international assessments in math and science. Specifically, Burgos is situated in the Spanish autonomous community called Castilla y León (Castile and Leon). This province had the best science results from Spain in international assessments such as TIMS-2015 (MECD, 2016), and second-best results in PISA-2018 (MECD, 2019). Therefore, future studies with a representative sample of the Spanish population are warranted. Second, while the sample size was sufficient for conducting a confirmatory factor analysis, it was not large enough to evaluate measurement invariance across different age or grade-level subgroups. The small number of participants in each subgroup limited the statistical power of the analysis, and thus further research with larger sample sizes is needed. Third, while the reliability indices for both questionnaires align with the expectancy-value literature, the lower reliability of the math questionnaire when compared to Kosovich et al. (2015) must be acknowledged, as it could impact the conclusions drawn. Lastly, even though this research successfully adapted Kosovich et al.'s (2015) EVC instrument by preserving its structure and dimensionality, it is worth noting that, as previously discussed, the original instrument fails to capture the multidimensionality of the value and cost constructs.
Hence, regarding avenues for future research, it should be noted that the EVC instrument does not allow for the specific measurement of different types of values or costs. The individual items do reflect the multidimensionality of these constructs. For example, “My math/science classwork requires too much time” measures task effort cost, and “Because of other things that I do, I don’t have time to put into my math/science class” measures loss of valued alternatives cost. However, both values and cost are treated as unidimensional to achieve a short, simple, and parsimonious instrument (Kosovich et al., 2015). This aspect may not be problematic for the ‘value’ construct when the instrument is used with elementary school students, as past research has shown that some of the value dimensions (e.g., attainment value) are not salient at such a young age (Ball et al., 2016; Eccles & Wigfield, 2020). Future research is necessary to establish whether the same is true for the cost construct, as cost-related factors appear to be influential in the development of STEM-related vocations (Ball et al., 2016; Toma, 2022b).
Footnotes
Declaration of Conflicting Interests
The author(s) declared no potential conflicts of interest with respect to the research, authorship, and/or publication of this article.
Funding
The author(s) disclosed receipt of the following financial support for the research, authorship, and/or publication of this article: This work was supported by the Agencia Estatal de Investigación (PID2020-117348RB-I00).