



Abstract
This research investigates the reliability and validity of three major publications’ rankings of MBA programs. Each set of rankings showed reasonable consistency over time, both at the level of the overall rankings and for most of the facets from which the rankings are derived. Each set of rankings also showed some levels of convergent and discriminant validity, but each has room for improvement, particularly Businessweek, which relies heavily on subjective surveys of students and recruiters, and Financial Times, whose methodology may be simplified and streamlined, ceasing to measure facets that are empirically superfluous. Together the three publications blanket the student process—U.S. News & World Report captures incoming student quality clearly with GMAT scores, Businessweek captures whether the students are happy while at their respective business schools, and U.S. News captures salaries and Financial Times captures return on investment, as short-term and longer term indicators of graduates’ early career successes.
Keywords
For the past 25 years, several popular business periodicals have published rankings that confer their views on the relative quality of business schools. That information is used by various constituencies: Student applicants consider the information as a factor in choosing among schools, companies use it to determine how to judiciously spend their campus visit and recruiting dollars, and universities use it to allocate funds.
Each of these decisions is important, so the fact that they rely on the rankings as an input begs the question as to whether the ranking information is of sound quality. If the evaluation systems may be discerned as meaningful, then the rankings would serve as a valuable input, and relying on that information along with other factors would be quite rational. Traditionally the quality of a measure—from survey instruments to ranking such as these—is determined via psychometric tests of reliability and validity. Thus, the basic research aims of this article are to examine the quality of the rankings vis-à-vis as assessment of their reliability and validity.
This research is not the first to evaluate various educational rankings. However, studies thus far have focused on a particular publication’s ranking (e.g., U.S. News & World Report), or a single year of data. The current research is intended to be the most comprehensive to date, in that it includes all data from three primary publications, for all years since their inceptions. The current research is also intended to be systematic in thoroughly testing psychometric properties, including the use of multiple means of assessing both reliability and validity.
In sum, the research objectives are to address the following questions. How reliable and valid are the sets of published rankings? How do they compare with each other and what are their relative strengths and weaknesses? Do they measure complementary domains of knowledge, or do they all measure essentially the same thing, and if the latter, do their assessments converge?
This article is organized as follows. First, background information is provided about each publication’s ranking methodology. Second, the literature is reviewed to illustrate the nature of the empirical relationships that have been demonstrated between rankings or similar kinds of evaluations and other constructs. Third, the methodology is described, and, fourth, results are presented, first for reliability, then for validity. Finally, the results are discussed, with implications for consumers and providers of the rankings, and suggestions for future research.
Background of MBA Rankings
To understand the measures analyzed in this research, we begin by describing the ranking systems provided by three major publications: Businessweek, U.S. News & World Report (U.S. News), and Financial Times (FT). These characteristics are summarized in Table 1.
Design Elements of Three Major MBA Rankings.

The Businessweek ranking is published bi-annually, beginning from 1988. The modal number of schools published in its ranking is 30, although its most recent listing contained 63. The Businessweek rankings weight their student graduate survey 45%, their corporate recruiter survey 45% and an element called “Intellectual Capital” 10% (captured by counts of faculty publications in select journals and the popular press). Current data are weighted 50%, and the two previous rankings’ data are weighted 25% each to provide a moving average kind of stability. (For more detail, see: www.businessweek.com/bschools/faq/mba.htm.)
The U.S. News & World Report rankings began in 1987, and they have appeared annually from 1990. Most of its results have featured 50 schools. The U.S. News rankings are a function of recruiter feedback (15%), peer evaluations (25%), students’ employment parameters, that is, salary and bonuses (14%), jobs in hand at graduation (7%), and employment 3 months postgraduation (14%), and quality indicators of the incoming students, namely GMAT scores (16.25%), GPAs (7.5%), and the school’s selectivity or acceptance rate (1.25%). (For more detail, see grad-schools.usnews.rankingsandreviews.com/best-graduate-schools/top-business-schools)
The FT rankings have been published annually since 1999, and they typically list 100 schools. The FT rankings are based on many criteria. Several components concern alumni employment: salary weighted for industry so that schools producing fewer finance or consulting graduates are not disadvantaged (20%; cf. Tracy & Waldfogel, 1997), percent earnings increase the students realize from their prebusiness school salaries to their salaries on graduation (20%), another return on investment (ROI)–like measure of the perceived resulting value obtained for the degree given the money paid in tuition and opportunity cost of unemployment while in school (3%), more subjective measures about the degree to which the graduates believe that their educational aims were achieved (3%), the extent to which their careers have progressed (3%), the three schools the alumni would recommend for hiring (2%), and more proximally to graduation, their success in placement (2%) and employment status 3 months hence (2%). FT also captures the percentage of international faculty (4%), students (4%), and board members (2%), the extent to which students worked in different countries prior to the MBA and whether it subsequently enhanced international mobility (6%), the proportion of multilingual students (2%), and the international experience and exposure while in the program (2%). In addition, FT represents the percentage of women on faculty (2%), in the student body (2%), and on advisory boards (1%). Finally, they measure an intellectual capital element represented by research publications in select journals (10%), the proportion of faculty with doctorates (5%), and the number of PhD graduates the school produces (5%). (For more detail, see rankings.ft.com/businessschoolrankings/)
Other publications such as The Economist, Forbes, or Wall Street Journal have issued occasional rankings. However, those rankings were not included in this research because of their shorter histories or intermittent appearances. Furthermore, this research focuses on the rankings of the full-time MBA programs. Although undergraduate, executive, and part-time programs are extremely important to business schools, not all schools offer all programs, so we focus on the rankings of the MBA as the prototypical business school degree.
Literature Review
Business school rankings appear to be important. Where a business school stands in various media rankings receives considerable attention across multiple consuming publics, such as student applicants and recruiting companies (cf. Klein & Hamilton, 1998). Rankings matter enough that most schools feature some information about their standings on their websites, often selectively presented so as to convey the school in the best light possible (Finney, 2011). Rankings also matter enough to drive turnover in deanships following declines in Businessweek rankings or in the U.S. News student placement scores (Fee, Hadlock, & Pierce, 2005).
In part because of this pervasive influence, rankings have always been controversial (Anninos, 2011; Schatz, 1993; Thompson, 2011; van der Veen, 2004). Rankings have impact across multiple domains, and yet have never been substantiated theoretically or defended empirically. As a result, it can appear that important decisions are being made as a function of data and models that are untested, a status summarily contrary to the scientific philosophy of the research faculty and faculty-administrators who construct, manage, and are held responsible for the educational experience at the institutions being evaluated. It is true, of course, that the rankings and data are imperfect, as it is true of any data or model. This research will show where there is room for improvement in these rankings methods, thereby indicating other elements that could potentially be used beneficially in decision making.
In the literature, there are two main themes of criticism of the rankings and methods. First, once the rankings data are collected, there are several qualities of the analyses that seem suboptimal. Second, the rankings data collection seems insufficient in sampling and in the omission of variables.
One example of the criticism regarding the analysis of the rankings data is in how the results are presented. Each of the media publishes a list of schools and most readers interpret the differences between ranked numbers as distinctive (Schatz, 1993). Most of these lists provide only ranks (e.g., Businessweek and FT), but U.S. News & World Report publishes ranks as well as the original scores before they are translated into ranks. If the publications would present the rankings along with confidence bands derived from their raw scores, then the additional information would modify the interpretation of what a top business school is, by making it clear whether or not a handful of schools at the very top are rated statistically higher than many schools further down the order.
A second concern regarding how the ultimate rankings are derived pertains to how the components of the rankings are combined to produce a single score for each school (Thompson, 2011; van der Veen, 2004). For example, we see in Table 1 that Businessweek weights the student experience at 45%, U.S. News at 0%, and FT at 0%. Postschool salary information is weighted by Businessweek at 0%, U.S. News at 14%, and FT at 40%. Incoming student quality is weighted by Businessweek at 0%, U.S. News at 25%, and FT at 0%. As these examples illustrate, different rankings use different approaches, thereby emphasizing different qualities in comparing business schools. It is certainly the right of each publisher to use whatever criteria they wish, however none of these media have provided any rationale for the variables they include or the weights they assign. In addition, students, faculty members, recruiters, or other parties would surely assign still different weighting schemes (cf. Klein & Hamilton, 1998).
The second class of criticism is leveled at the nature of the data that are collected (prior to concerns regarding how they are combined). These issues relate to sampling of both respondents and variables.
Respondent sampling concerns range from a churning dean sample (given the 10% annual turnover in that office, Schatz, 1993), to the question of how businesses are selected to participate. For example, in the Businessweek corporate recruiter survey, the question is whether the familiarity of the business executives polled is sufficiently broad, or in all likelihood, is each familiar with only a handful of business schools, thereby raising the question of whether their judgments are partly a function of prior rankings. Similarly, students and alumni can answer survey questions about their own experience at their given school, but even with communicating to peers at other schools via social media, they are not in the position to compare their program with others (van der Veen, 2004).
Regarding concerns over omitted variables, it is perhaps not surprising that academics writing about rankings desire to elevate the role of research and scientific productivity (Buela-Casal, Gutierrez-Martinez, Bermudez-Sanchez, & Vadillo-Munoz, 2007). Studies have shown correlations between publishing productivity and rankings in the short term (Green, Baskind, Fassler, & Jordan, 2006) and perceptions of schools by academics, recruiters, and student applicants in the longer term (Mitra & Golder, 2008). Although the rankings make some effort to reflect scholarship, these researchers argue that the measures could be purified and made more salient.
Concerns over omitted variables arise more often couched in debates about business schools in general—their worth, their responsiveness to business trends, and so on. For example, although there still appears to be strong demand, as attested to by continued growth in enrollments (Thomas & Cornuel, 2011), financial crises and periodic criticisms of business schools tend to spark discussions of changing business school models, for example, currently calling for more training for students in leadership (Thomas & Cornuel, 2011) and the ability to think creatively and critically (Datar, Garvin, & Cullen, 2010). The implication for the publications’ rankings is that they, like business schools themselves, might be revamped over time to capture these newly ascertained skills.
Globalization and Internet phenomena are also relevant. It is difficult to standardize the accountability of business schools and universities throughout different countries and regions of the world given their varying approaches to accreditation, auditing, or benchmarking (Anninos, 2011). Growing demand for management education in markets such as Mexico (Martinez, 2002) and India (Varman, Saha, & Skalen, 2011) has also produced numerous global joint program efforts on behalf of U.S. business schools, which fly under the radar, largely unranked. Online, distance learning is also booming, in part to meet the demand of management education and in part due to the convenience and cost-savings afforded by ever-expansive technology (Spais & Filis, 2006). Yet online programs are still in their infancy, and as they grow, it will be interesting to see how they might modify the current approaches to rankings (Rydzewski, Eastman, & Bocchi, 2010).
Where there seems to be agreement with respect to measured variables is that objective indicators (e.g., GMAT scores) are to be preferred to subjective opinions (e.g., student, recruiter, or peer polls). For example, in an analogous study, student evaluations of their teachers were compared in courses with relatively objective learning assessments (e.g., accounting) to courses with more subjectivity (e.g., marketing). For the more subjective courses, the teachers’ reputations mattered and were somewhat related to students’ performance on mastery and learning tests. For the relatively objective course material, student progress was tracked significantly better by the performance tests and students’ evaluations of their teachers were irrelevant (Clayson, 2009). In that same study, a meta-analysis of student evaluations of courses and professors, aggregating over many disciplines, showed significantly lower evaluations for courses that students perceived as more effortful (Clayson, 2009). Unfortunately, the implication is that professors create a friendly learning environment (Hinds, Falgoust, Thomas, & Budden, 2010), and then as Pfeffer and Fong (2002) point out, “when students are relieved of any sense of responsibility for their learning and much involvement in the learning process, the evidence is that they learn much less” (p. 85).
Many studies have undertaken endeavors to assess the effectiveness of various elements of higher education. The MBA degree has been shown to enable students to (a) obtain jobs, (b) earn higher salaries, and (c) succeed in subsequent job performance. Regarding the first, Pfeffer and Fong (2002) point out that although students’ standings in law schools have a pronounced effect on employment opportunities, the impact is lesser for graduates of business schools. Their comparison makes sense, considering that a young lawyer must know many facts, whereas a young businessperson must be relatively broader to be facile and adaptive, and interpersonally able to activate and grow his or her social network. If the incentives for grades are lesser in the business school environs, then the drive to succeed per that measure is dampened, as would be the strength of the relationship estimated between grades and subsequent achievement. Thus, it is all the more impressive that they found any association in the business school setting.
Regarding the advantage afforded by the MBA student salaries, Pfeffer and Fong (2002) argued that mastery over instructional material, as measured by grades in classes, should presumably also be related to career attainment as measured by salary. Even as problematic as those two measures may be—grades with their inflation and truncation and salaries with their industry differentials—Pfeffer and Fong cited several studies that found correlations between graduates’ compensation and grades earned in elective (but not core) courses. Similarly, in reporting on a survey of marketing practitioners, Hunt, Chonko, and Wood (1986) were generally rather critical of the MBA degree and business schools, yet ultimately they did find that people with MBA degrees earned significantly more than those without (r = .11 overall, and r = .15 for graduates with less than 10 years of experience).
Finally, on-the-job performance has been predicted using student grades (Roth, BeVier, & Schippmann, 1996). The relationship was strongest immediately on graduation (r = .23) and declined in strength with years (for 2-5 years out, r = .15, and for 6 years and more out, r = .05). The finding is sensible considering the myriad factors that affect employment choices and opportunities as careers develop. Indeed, performance and wages are associated not only with higher levels of education and more work experience but also with personality traits such as perseverance (Weiss, 1995).
We shall see these educational themes in the analyses of the rankings that follow. We first describe the psychometric approach and the data.
Psychometric Approach
Recall that this research aims to investigate the reliability and validity of the rankings, and in doing so, reveal the strengths and weaknesses of each. Psychometrically, reliability is considered to be a necessary but insufficient condition for validity; so we will begin by assessing the reliabilities of the three sets of rankings. We will examine the consistency of the rankings over time, both at the omnibus level and at the level of the components that enter into the computation of the overall ranking.
Next, we examine whether the empirical results of the rankings mirror the publications’ statements regarding their compositions. In assessing validity, we proceed by beginning with simple correlations between each of the three rankings and variables that should be related to quality business school educations, in an attempt to begin to establish convergent validity, and we examine variables that should not particularly be related to quality in business schools, to begin to establish discriminant validity. We then fit structural models to begin to tease out the directionality of inputs such as student quality and rankings as antecedent or consequential effects, doing so for all three sets of ranks.
Method and Sample
The intent of this research is to be thorough, and as such, the publications are not sampled; rather, the entire population of data published to date by Businessweek, U.S. News, and FT are included and analyzed. As such, this research covers the Businessweek, U.S. News, and FT rankings comprehensively across their publication durations and across their component data.
Descriptions of these population parameters are as follows: There are 13 years of data for Businessweek rankings, 24 years for U.S. News, and 15 years for FT. Across the years, Businessweek covers 68 unique schools, U.S. News, 78, and FT, 149. When combined across media and periods, 167 schools appear in at least one ranking. All 68 Businessweek schools, 77 of the 78 U.S. News schools, and 68 of 149 (45.6%) of the FT schools are in the United States. As the FT’s rankings criteria suggest, its focus is more international: 23 (15.4%) of FT schools are European, 22 (14.8%) are in the United Kingdom, 10 (6.7%) of the schools are Canadian, 6 schools (4%) are from Australia and New Zealand, 6 more (4%) from China, 5 (3.4%) from other Asian countries, 5 (3.4%) from Mexico, Central and South America, 3 (2%) from India, and 1 (0.7%) from Africa. Other data shall be described as they are introduced.
Results
We begin by evaluating the reliabilities of the overall standings for each of the three rankings. The simplest expression of reliability is that of consistency; that is, reliability is the extent to which data obtained from a measure at Time 1 resemble those obtained from the measure at Time 2. Whereas test–retest correlations are frequently used in educational psychology to compare children’s annual performance on standardized tests, they are rarely used in marketing because the data requirements are onerous, resulting in subject mortality and missing data. Yet in the business school rankings, multiple waves of data exist, so test–retest assessments of reliability are applicable and may be conducted. Note, of course, that much like longitudinal brand sentiment studies sample waves of consumers but not necessarily from a panel of the same consumers, here too, the students and recruiters and other parties polled vary over time. What allows further examination is that the unit of analysis is the school, so that standings may be compared from one set of rankings with the next. Although correlations between rankings at time t and t + 1 might not be therefore precisely test–retest instruments, they are certainly analogous and definitively capture the essence of consistency, which is ultimately in the abstract that which test–retest reliability represents.
Table 2 presents the correlations computed within each set of ranking, over adjacent periods. For example, the first value in the table is .927 and it represents the Spearman (rank) correlation between the 2012 and 2010 Businessweek results. Comparing across media, we see that Businessweek varied quite a bit over its first 15 years or so (e.g., the formulae may have been changing, school sampling may have undergone changes, etc.), and it has become stable since approximately 2004. On this criterion, we can laud the U.S. News as yielding the most stable results, year to year, even from its inception. The FT results are stable as well. Durbin–Watson tests were also computed for each series to ascertain whether the results were an artifact of autocorrelations, however, the Durbin–Watson tests approximated 2.0 for each publication (2.11 for Businessweek, 1.91 for U.S. News, and 1.80 for FT), suggesting no problems with autocorrelations (Durbin & Watson, 1951).
Correlations Between Rankings in Row Year and Previous Ranking.
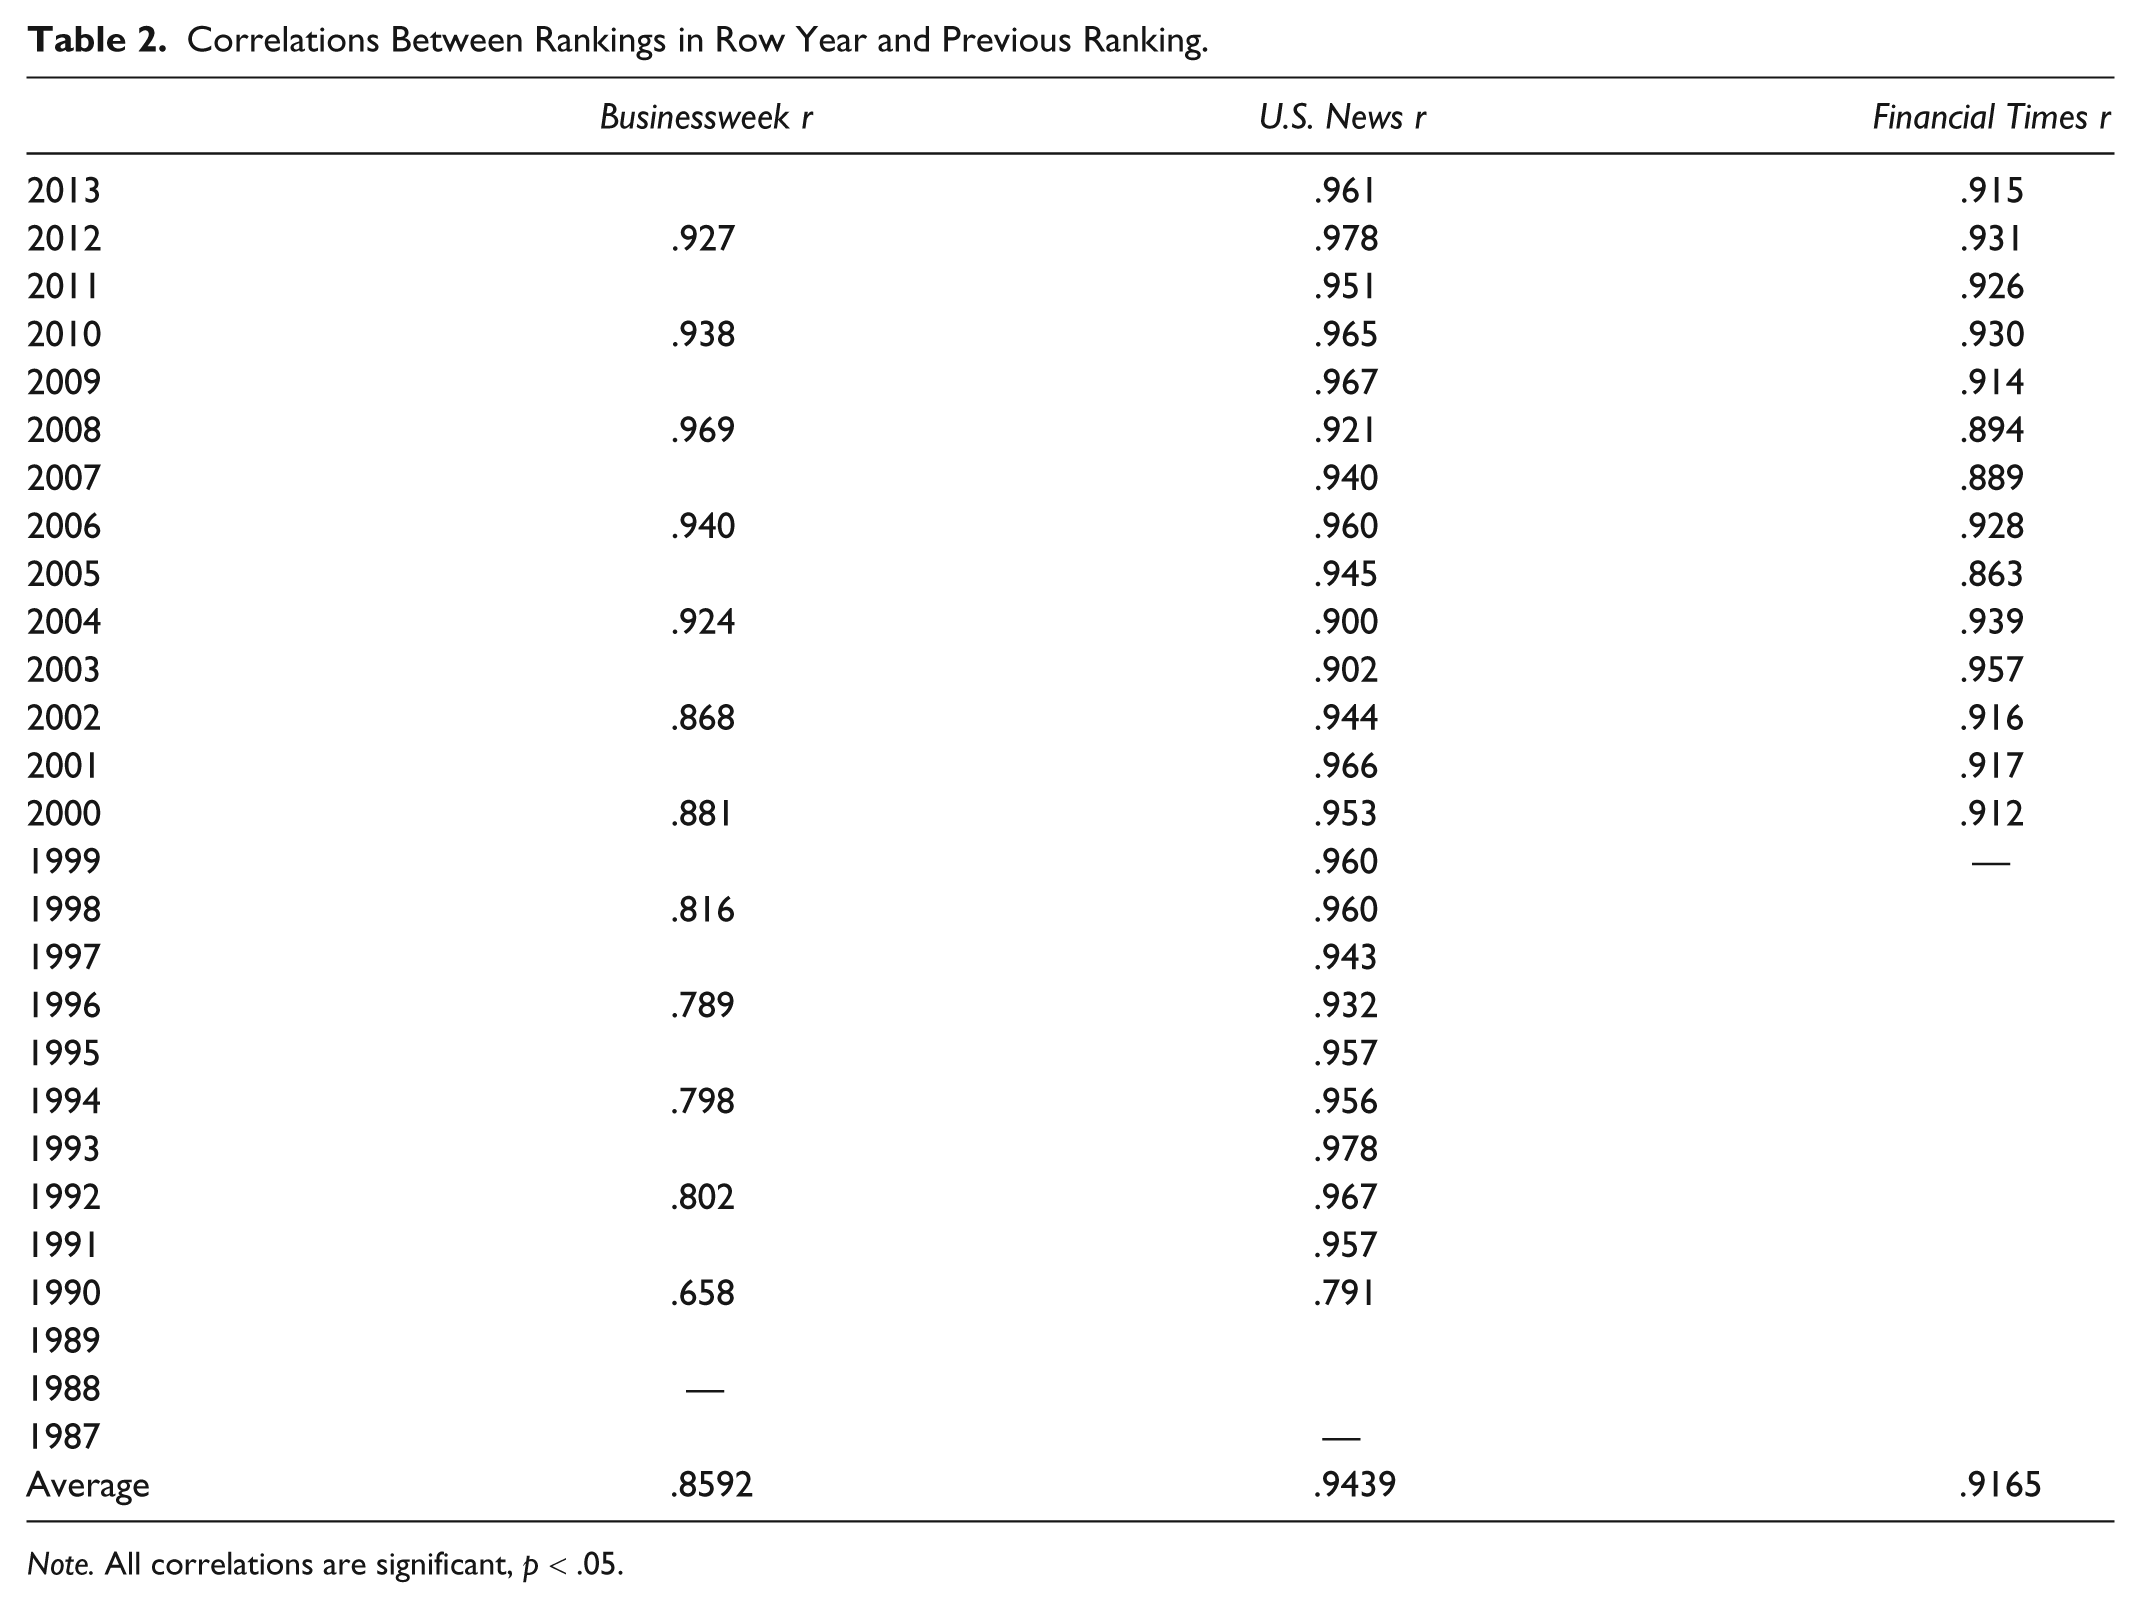
Note. All correlations are significant, p < .05.
In addition to studying the stability of their overall rankings, we next examine the consistencies of the components of the rankings. Table 3 displays the results on all the elements contributing to Businessweek and U.S. News, and the three FT criteria with the largest weights in the computation of its ranks. With few exceptions, these facets also show remarkable consistency. FT is uniformly strong. U.S. News is mostly stable, however, the status of whether a student has a job at graduation, or 3 months hence, fluctuate. Obviously jobs are an important outcome of higher education, but even the very best schools cannot control the macro-economic, global, or political factors that favor or diminish employment opportunities, or the vagaries of students accepting jobs or delaying their reentry to the work force. Similarly, whereas the corporate perceptions are fairly steady in Businessweek, the graduate opinions are more varied. Overall, particularly for U.S. News and FT, the majority of correlations seem impressively large, indicating typically strong consistency. Coefficient alphas concur in a picture of consistency, whether computed over time (Businessweek α = .94, FT α = .97, U.S. News α = .98) or over facets contributing to their respective rankings (Businessweek α = .89, FT α = .82, U.S. News α = .87). Any low correlation in Table 3 indicates poor reliability of that component. (A prescription to the publishers would be to weight such unreliable elements minimally, or extract them altogether.)
Stability of Components: Values Indicate Correlation Between Column Variable at Time Denoted in Row and Previous Ranking.
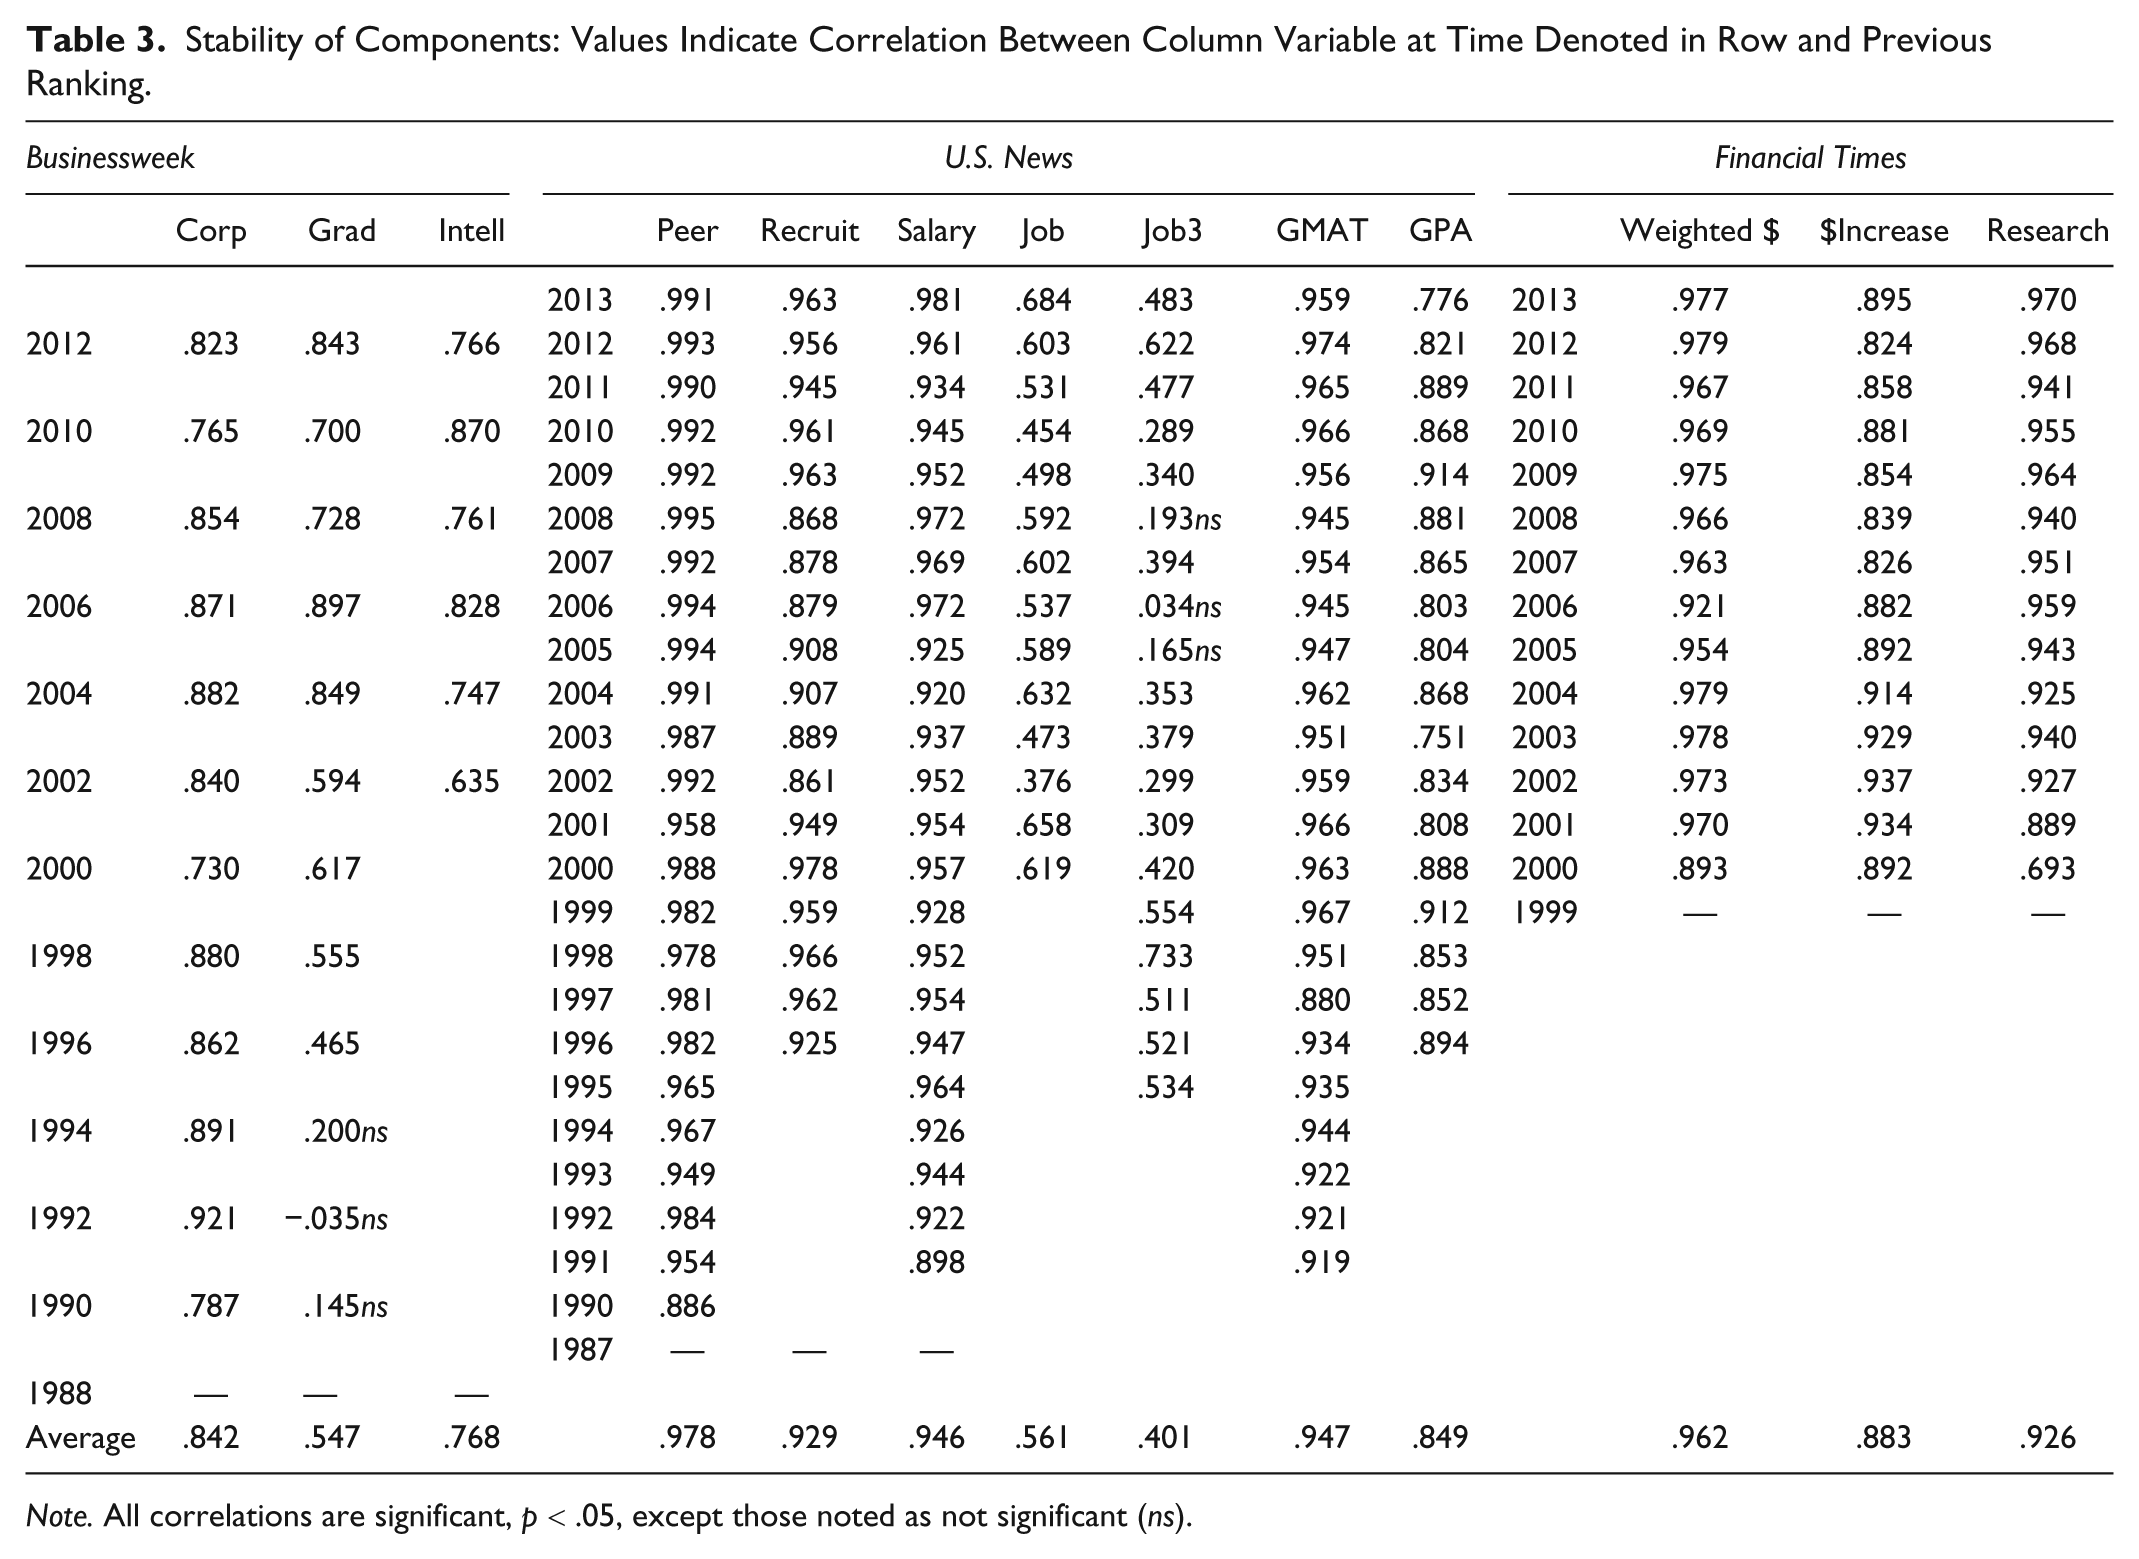
Note. All correlations are significant, p < .05, except those noted as not significant (ns).
The reliability results may be interpreted in a positive or negative manner. From a psychometric perspective, stronger consistency is better. Yet if a business school has been striving for improvement, reliability implies stickiness and difficulty in achieving enhanced placement in the rankings as a result of any efforts in program improvements.
The consistency might have several contributing factors. For example, the set of corporations sampled for recruiter polls is not transparent in Businessweek’s methodology, and obviously any bias in over- or underrepresentation of types of industries, types of companies, geographic locations, and so on, can affect the familiarity and favorability of a company with a set of business schools, much as when the first rankings came out, favoring schools in the Midwest, at least in part due to the recruiters’ database being developed from a Chicago-based headhunter. Furthermore, all schools undergo continuous improvement, rarely distinctively; indeed these large correlations suggest that the schools are in a proverbial horse race, changing together, nearly in lockstep. For example, over the years, similar advancements to curricula were likely made, for example, all schools bringing in international cases and e-commerce topics. Extracurricular efforts were also likely to be similar, incorporating more ancillary programs, for example, covering leadership and communications. Such an explanation would not be unusual, implying that business schools, like companies in many industries, pay attention to the changing needs in the environment as well as to competitors’ actions.
It is important to establish a base of reliability of these rankings because psychometrically, a measure must be demonstrated to be consistent before one may pose questions about what it purports to capture. Despite a few small correlations, and regardless of the source of the consistencies, the data in Tables 2 and 3 suggest that we might conclude that overall, all three sets of rankings are reliable, to varying degrees, from acceptable to impressive. Similarly, many of the facets are acceptably reliable, whereas others should either be measured more precisely or dropped from consideration. We may thus proceed to the question of validity to determine what the rankings measure.
Reconstructing the Rankings
Next, beyond their stability, we turn to examine the content of these rankings. We first test the empirical performance of the publications against their purported designs. Although none of the publications explicitly define business school quality (presumably the rankings were designed to sell media and not test theories), the definitions may be inferred by their inputs. Specifically, each publisher gathers data it deems relevant to deriving rankings, and we may test whether their implied definitions of a “good” business school are borne out empirically in terms of the actual elements that matter and contribute to the standings that are published.
We test these suppositions for each publication by using the facets in a regression to predict the overall standings. Recall from Table 1 that Businessweek relies on three inputs—surveys from recruiters and students, and a measure of intellectual capital. In Table 4, we see that these components predict the overall standings very well (R2 = .984). (Businessweek states that the data from the two previous rankings also factor into the current ranking, however, for all triads of ranking years, no previous ranks or input factor data were significant.) The overall standings for U.S. News are also captured well (R2 = .965), based primarily on incoming student quality (GMATs), outgoing student salaries, and recruiters’ subjective opinions. The FT standings are also predicted fairly accurately (R2 = .808). Recall from Table 1 that FT measures and publicly reports many facets of business school parameters, yet the results in Table 4 indicate that the significant predictors comprise a much smaller subset. Many of FT’s facets are granted small weights in its computation of overall ranks, but in these regressions, any predictor with sufficient (co)variability could yield a significant coefficient.
Reconstructing the Rankings.
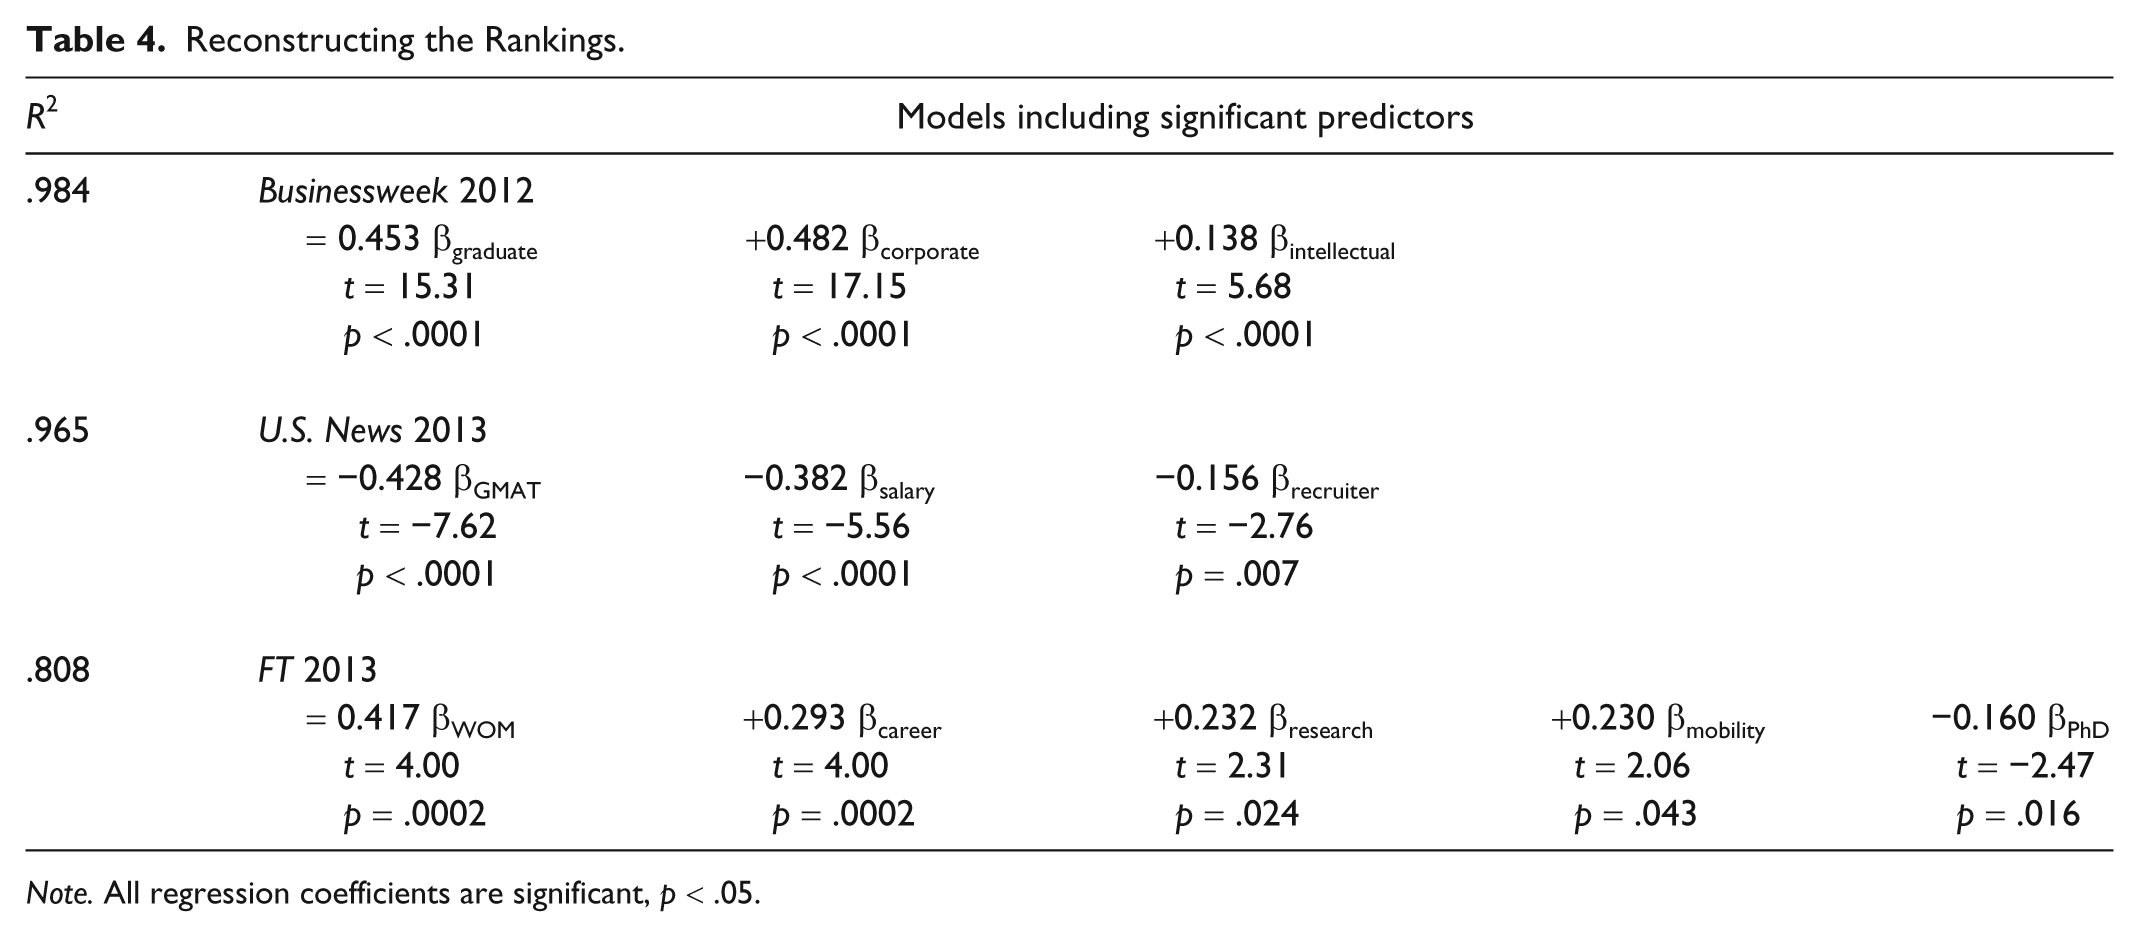
Note. All regression coefficients are significant, p < .05.
A point raised in the literature is that whatever the publications’ weights, other constituents such as students, faculty members, recruiters, alumni, or other parties would surely assign still different weighting schemes (cf. Klein & Hamilton, 1998). For example, in the most recent U.S. News standings, the top seven schools are Harvard, Stanford, Wharton, MIT, Kellogg, Chicago, and Berkeley. This order is almost unchanged if schools were ranked base only on acceptance rates (the correlation between the published standings and the acceptance rates’ is r = .95), or an average of the two subjective variables of schools’ reputations among peers and recruiters (r = .99). However, a student might wonder, “Just how much am I going to get out of this degree” (in terms of salary) compared with what they put in (in terms of tuition). Reordering the schools based on the ratio of salaries achieved to tuitions paid results in a completely different picture (r = −.50). The top seven schools on this criterion are Brigham Young University, the University of Wisconsin, University of Georgia, University of Texas at Dallas, Texas A&M, University of Connecticut, and the University of Massachusetts.
These reconstructive tests provide mostly positive support in discerning what facets actually define each standing empirically, compared with how the media purportedly define the concept of a good business school. The primary opportunity for modification is that the more complex rankings could drop several facets with no appreciable change in outcomes.
Finally, for each ranking, per standard analyses, variance inflation factors were estimated to flag potential multicollinearity problems. The average variance inflation factor was 2.79 for Businessweek, 5.48 for U.S. News, and 2.97 for FT, all passing the test of not exceeding 10.0 (Marquardt, 1970).
This investigation, and the fact that the R2s in Table 4 are large for each set of rankings, is important for another reason. None of the media publish all the data they collect, such as for those schools that do not make their top 30, 50, or 100 lists. This sampling issue could have been a problem—with 651 accredited business schools in the United States, and 1,182 worldwide (according to the Association to Advance Collegiate Schools of Business), using the truncated data sets as they are published could have resulted in a range restriction problem, distorting results and relationships. Other studies have also expressed a concern to first show an ability to reconstruct the basic rankings before testing their relationships to other constructs (cf. Proudlove, 2012a, 2012b). These high R2s indicate that such problems are minimal and that the analyses henceforth can be trusted as fairly representative of the fuller data sets that the three media sources compile.
Convergent Validity
In this section, we examine convergent validity, seeking evidence that a measure should be correlated with variables that are related theoretically (Bearden & Netemeyer, 2010). In the tables that follow, the data for the business schools’ standings in the U.S. News and FT rankings were averaged over the past 3 years (2012, 2011, 2010), to enhance the stability of the findings, so that any resultant correlations would less likely be attributable to a spurious, fluctuating ranking. For Businessweek, only the last two rankings (2012, 2010) were averaged because a third would draw from much older results. Using these recent numbers, Table 5 presents the correlations among the overall rankings. Given that each publication claims to be measuring the quality of business schools, it is encouraging that the correlations are significant and rather strong. That they are not unity is also not surprising nor particularly problematic, given that each publication derives its rankings from overlapping, but different subsets of input facets.
Correlations Between the Rankings.

Correlations are significant, p < .05.
Table 6 contains correlations examining relationships between the rankings and several classes of constructs that should be theoretically related to the quality of a business school. First, one might expect that top business schools attract top students. The first two rows of Table 6 convey correlations between the rankings and GMAT scores and students’ incoming grade point averages (as measures of potential and ability, respectively; cf. Clayson, 2009). These significant correlations indicate that higher GMAT scores and grades are correlated with lower (nearer the top) school rankings. The highest correlation is that between U.S. News rankings and GMAT scores (−.910). This association may be inflated somewhat because of the fact that it reflects a part–whole relationship (the GMAT is a facet for the U.S. News ranking), yet note the high correlation between GMAT scores and FT as well.
Variables of Related Concepts That Should Be Correlated With the Rankings.
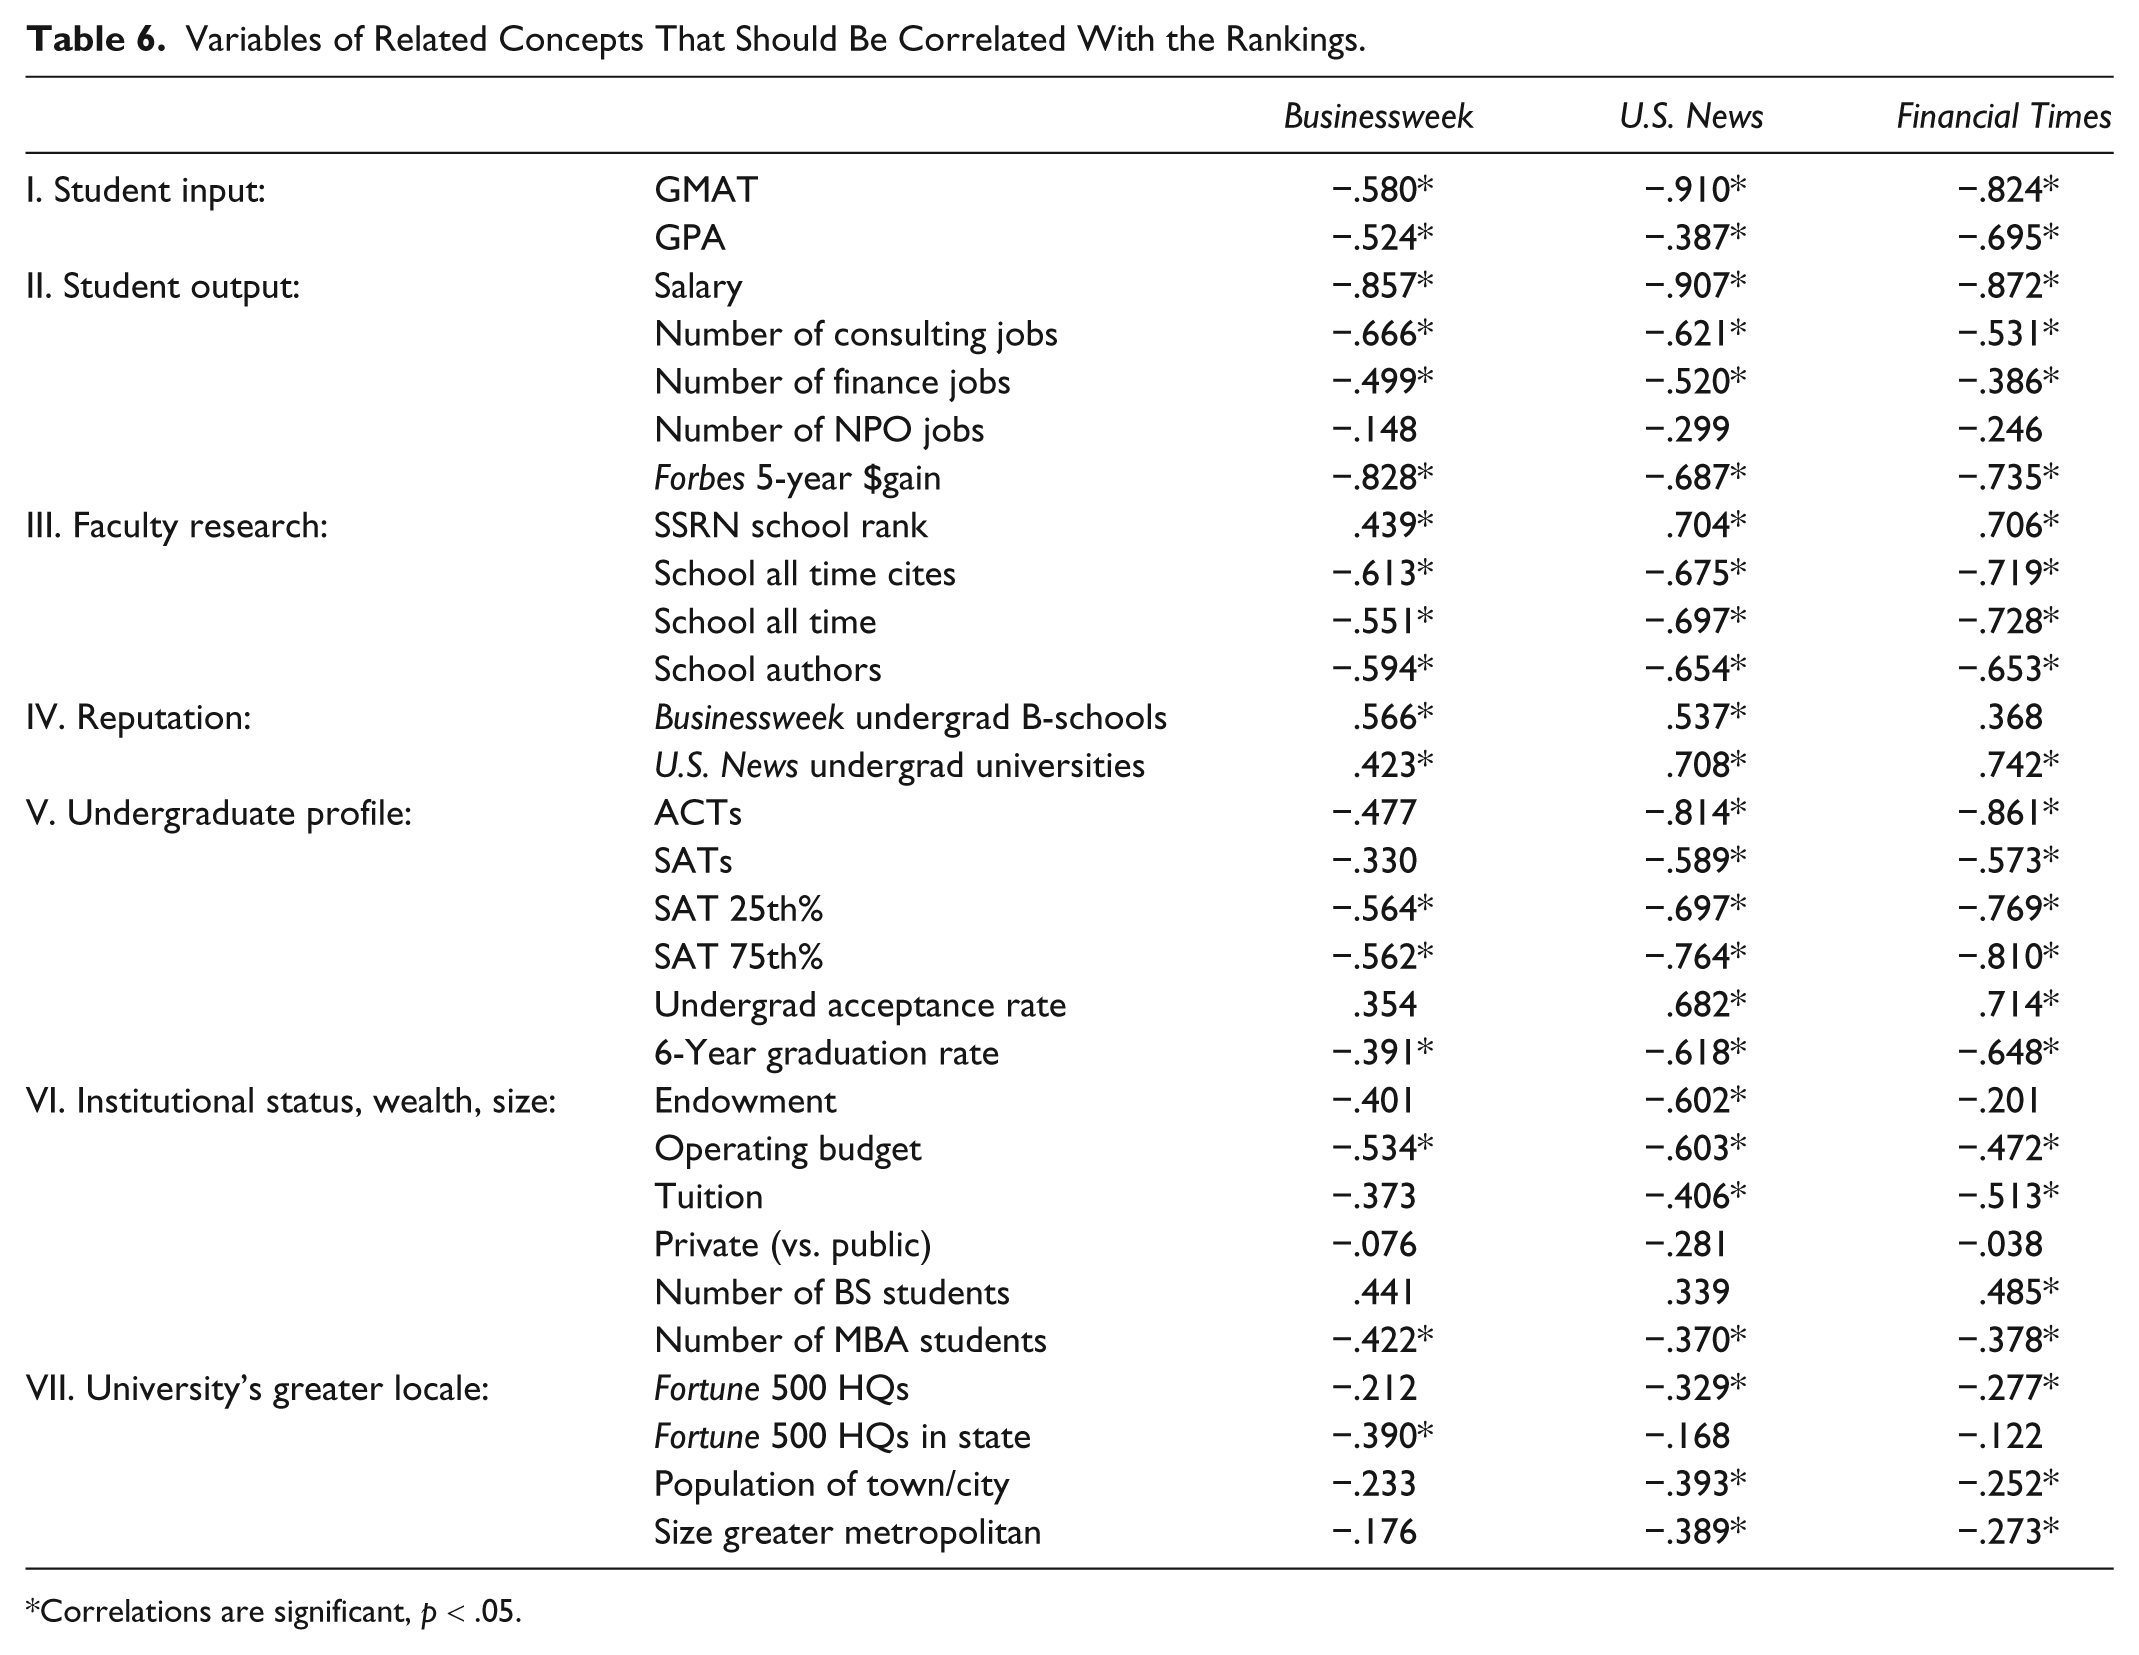
Correlations are significant, p < .05.
Second, one might expect that top business schools produce successful graduates. Although there are many ways to define success, commercial success would seem to be a goal consistent with the typical capitalistic MBA program. Salaries are a direct and immediate economic measure of a graduate’s success and payoff (cf. Hunt et al., 1986), and they are significantly higher for students graduating from the top schools. The relationships with salary are very high and nearly uniform across the media. (For the investigations that follow, we complement the rankings data with additional, independent data sources. For these variables, a research assistant and a librarian assistant culled websites for the relevant information. Their disagreements in data sourcing were few (<2%), and were reconciled between them.) The numbers of graduates taking consulting, finance, or nonprofit job were derived from the business schools’ websites. Careers in consulting or finance usually begin with the highest salaries, which is a factor feeding directly into the U.S. News and FT calculations, and probably at least indirectly into Businessweek through student satisfaction. The numbers of graduates taking nonprofit jobs were not significantly related to the rankings. The ROI indicator from Forbes reflects salary gains attributable to the MBA degree, and it is significantly related to the rankings.
Third, one might expect that top business schools feature top faculty (Buela-Casal et al., 2007). Several research-related indices were downloaded from the Social Science Research Network (SSRN; hq.ssrn.com). SSRN is a host service for faculty to post manuscripts and articles, and it tabulates and allows access to statistics about the frequency with which each article is downloaded, the number of cites of an article by others in the SSRN library, and so on. For the business school rankings analysis, all the SSRN indicators tell a similar story (so one index would have sufficed)—more research-related electronic activities derive from favorably ranked schools. Every measure, if pursued, bears the risk of maladaptive behavior in the extreme, and we would not wish to advise that faculty post everything and hire computer programmers to actively download articles. Yet although SSRN measures may not perfectly reflect a business school’s intellectual environment, the SSRN measures are at least of an academic’s making, compared with the magazine publishers’ choices of particular journals (U.S. News or FT) or book reviews (Businessweek).
Fourth, MBA rankings may be related to undergraduate rankings. Business schools largely draw from the same resources (faculty, career contacts, facilities) to provide management education at the MBA and undergraduate level, thus a school that provided a good (or bad) MBA program would likely provide a comparably good (or bad) undergraduate program. In addition, multiple programs may be perceived similarly due to some halo judgment about the reputation of the institution or perceptions of brand equity of the schools. The two rows in Table 6 show that the correlations with the undergraduate rankings are all significant and positive. Although several are large, it is interesting that the correlations are not unitary—there are good universities with less than stellar business schools, and good business schools at so-so universities.
Fifth, Table 6 continues in this consideration of the undergraduate population vis-à-vis more objective criteria. These correlations paint a picture that says: Good MBA schools are associated with universities that attract good undergraduates, as measured by ACT scores, SAT scores, or the 25th or 75th percentiles of SATs. The table also tells us that the schools are selective, and the students are dedicated in that once matriculated, they tend to graduate.
Sixth, one might expect that larger or wealthier universities tended to be favored in the rankings. We obtained through the Association to Advance Collegiate Schools of Business (the accreditation organization), audited general descriptors of the business schools’ host universities such as endowments, operating budgets, and tuition to capture the general financial health of the university, the size of the university as measured by both its undergraduate and MBA populations, and we created a dummy variable to characterize schools as private or public. Several of the financial indicators indicate that schools that charge more, spend more, and sit on larger nest eggs, are those that are better ranked. Perhaps such findings may have been anticipated, but what should give encouragement to deans, university boards and overseers, and other interested constituents including students, is that the correlations are not so high as to suggest that one’s standing is forever determined or that change is too daunting to undertake if one does not have access to the bounty of resources of another school. That is, the correlations do not altogether indicate that “to the rich, go the spoils.”
The variable noting private versus public is also interesting in this manner—public universities should not assume or use as an excuse their nonprivate standings, and analogously, private universities should not rest on their laurels, because there is variance within each group—there are both good (and less good) public MBA programs as well as good (and less good) private MBA programs. (Nor is the private vs. public distinction as highly correlated with tuition as one might assume, r = .53. MBA programs are fairly competitive in the tuitions they charge regardless of their private or public status—a likely factor contributing to the difficulty in establishing strong ROI indicators. Again, there is variance within each group—there are some expensive public schools, and some relatively inexpensive privates.)
School size is indexed in Table 6 by the number of undergraduate students and the number of MBA students. The correlations with university size (viz., undergraduates) are significant for FT, and borderline for U.S. News (p = .07) and Businessweek (p = .09). If all were significant, we might conclude that larger (often public) universities are those lower down in the standings. The size of the MBA programs, on the other hand, are all significant, and negative, indicating that the larger MBA-producing machines tend to be those ranked at the top of the rankings (e.g., Number 1). Thus, schools hoping to achieve certain benefits by maintaining boutique MBA programs might be ill-directed. Perhaps, like the lessons we teach, there are size advantages and scales of economies, for example, recruiting companies desirous of efficient yields, coming only to campuses large enough to warrant their attention.
Seventh, in the last rows of Table 6, we broaden the scope still further. We queried whether schools situated in or near cities with more Fortune 500 headquarters would be at an advantage (www.fortune.com). It does appear that schools with proximal access to more Fortune 500 companies enjoy some benefits—perhaps real jobs, perhaps simply salient perceptions of neighbors. For FT and U.S. News, rankings are better for business schools in the same city as many headquarters; for Businessweek, the companies can be further outlying, in the same state.
Whether a business school is in or near a city that hosts corporate headquarters, it may be argued that proximity to a larger city facilitates job opportunities for students, or other auxiliary benefits, for example, access to more guest speakers and greater networking potential. From The World Factbook at www.cia.gov, we extracted population sizes of the towns or cities in which each business school is located, as well as the greater metropolitan area beyond the city proper. Echoing the results on headquarters, for U.S. News and FT, the better business schools tended to be in or near a larger city and metropolis. (Naturally, the size indicators are somewhat related, e.g., the correlation between the population of the university’s city and its greater surrounding metropolis is r = .813, and the correlation between the size of the metropolis and the number of corporate headquarters it hosts is r = .509.) Yet once again, although the correlations are significant, these are also significantly less than 1.00; thus schools that do not enjoy the benefits of being situated near larger cities can still provide excellence for their business students.
Having examined a broad array of constructs that should provide evidence of convergent validity, we turn next to examine the discriminant validity of these rankings. In this analysis, we shall expect zero or low correlations between the rankings and variables of unrelated concepts. Note that for the correlations in Table 6 or those discussed next in Table 7, many of the correlates are measured at interval or ratio levels, but the ranks themselves of course are ordinal. In comparative testing, few differences existed between Spearman and Pearson correlations, so the latter are those listed in the table. However, maintaining the concern of the more approximate measurement of ranks, in this regard at least these results can be taken to be conservative.
Variables of Unrelated Concepts That Should Not Be Correlated With the Rankings.

Correlations are significant, p < .05.
Discriminant Validity
In this section, we examine discriminant validity, looking for patterns of data that demonstrate that a measure such as the rankings should not be correlated with variables that are not theoretically related (Nunnally & Bernstein, 1994). Thus, in contrast to Table 6 where we expected correlations with related concepts, Table 7 presents tests of discriminant validity—these variables should have no apparent relationship with the rankings, hence correlations should be negligible.
For example, the quality of the education an MBA student achieves at a business school should have little in common with the athletics at that university. The MBA education presumably has more to do with the quality of the incoming students, the quality of the faculty and curriculum, and so forth. Similarly, politics and local prices should not have any bearing on quality rankings. Perhaps most abstractly, there should be no discernible reason a priori for a relationship between the ranked quality of business schools and the local temperature or the geographic location of the school on the globe. At face value, if any of these seemingly extraneous variables are correlated with the rankings, the validity of the rankings might be suspect. Nevertheless, some empirical relationships resulted, and some plausible logical explanations arose, as shall become clear.
For example, let us begin with the sports standings. The first three rows in Table 7 reflect correlations between the MBA standings and the schools’ rankings in their men’s basketball, football, and soccer teams (from www.collegefootballrankings.net, www.ncaa.com, espn.go.com, www.ncsasports.org). The correlations with basketball are significant, and the football correlations are negligible. Perhaps the basketball standings are correlated with the business school rankings much as the reputation of an undergraduate institution may serve as a general halo or brand equity, that is, general perceptions of universities are also certainly formed by the renown of its sporting teams. Where the basketball standings were significant and the football standings were not, one might rationalize that it presumably requires fewer resources of a university (such as scholarship money) to build the smaller teams required of basketball, and easier to find sufficient numbers of athletes who meet admissions criteria. Soccer teams are not only large like football but may also show insignificant associations for different reasons, for example, primarily because of the still relative newness of the sport to the U.S. schools that dominate at least the Businessweek and U.S. News lists. Thus, although on the face of it, the sports standings should not be related to the business school rankings, they may be correlated because of a third factor, such as university revenue. Given that sports are such a popular means by which various universities are known, they may well be contributing a halo effect, or effect of brand equity, as attitudes about an undergraduate institution become transferred to its business school and back.
The next two rows in Table 7 are additional descriptors of a university’s setting. In what may appear to be a stretch in the investigation, each state was characterized as primarily Democratic or Republican (obviously applicable only to the U.S. schools; www.census.gov). For FT and U.S. News, business schools in red (Republican) states indeed fare better. There is no relationship with Businessweek. Here too, in retrospect, the correlations between rankings and the flagging of a state as red or blue may be somewhat sensible, in that some cities or states are known to be more probusiness.
Table 7 next considers rent, with the possible supposition that students would be happier at schools where cost of living is more reasonable, and this positive affect would assist perceptions of experiences and eventual rankings. Average rental prices for each town were downloaded (www.ibge.gove), and note that it is significant for U.S. News. Rent is of course correlated with the previously tested population size variables, as a result of competition for housing.
The last rows in Table 7 capture temperature and location. Each city’s average weather markers were downloaded (www.worldweather.org), and although the range in extremities is not significantly related to any of the rankings, the high temperatures in July are correlated with less favorable ranks in U.S. News; probably a proxy for a distinction between Northern and Southern states (which extends somewhat internationally). Akin to the argument regarding rent, one might have hypothesized that students would have happier experiences in towns with moderate weather. Overall, the weak results are gratifying—that students attending classes in sunny Los Angeles are no happier with their business schools than those who experience larger weather fluctuations in Minneapolis or Boston.
Similarly, latitude is not related to any of the rankings. This finding might be a result of a restriction of range in that most business schools are in the Northern hemisphere: for example, NYU and Stanford are ~40°N, Minneapolis is ~47°N, Miami is ~25°N, São Paulo is ~24°S. For longitude, the better ranked (lower numbered) schools for FT are those East of the Greenwich meridian (e.g., NYU is ~75°W, London is 0°5′W, whereas Paris is ~2°E, Frankfurt is ~9°E, Singapore is ~~104°E), presumably reflecting FT’s typically pro-U.K. and EU results. This correlation should probably not be overinterpreted given that 92% of business schools have Western longitude coordinates (in FT, 20% of these are ranked 51-100, and of the mere 8% of business schools with Eastern longitudinal coordinates, 90% are ranked in the top 50).
For all the data in Table 7, we had begun with variables that seemed to have had potential to offer clear tests of discriminant validity. That is, these variables delineate aspects of business school settings that should have been orthogonal to the MBA rankings. Yet in several cases, the relationship required an adjustment toward the view that perhaps there were modest rationales. Still, only 8 of the 27 correlations in the table were significant, so perhaps the rankings demonstrate a modicum of discriminability.
Having addressed these basic psychometric properties, there are additional questions to raise and modeling directions to study. For example, Figure 1 contains three structural models, one for each publication. In each model, there exist (vertical) links to reflect logical facet contributions, namely GMATs as a measure of student quality into the overall ranking. There also exist (horizontal) links to represent possible autocorrelative effects for both the GMAT scores and the schools’ overall rankings. In addition, there exists a pair of diagonal links for each ranking in an attempt to begin to tease out causality. These links proceed from the GMAT scores at time t to the rankings at time t + 1, and from the rankings at time t to the GMATs at time t + 1. The first of these would suggest that business schools with smart students will enjoy better subsequent rankings, and the second would suggest that better rankings attract smart students. The parameter estimates on the first are significant for U.S. News and Businessweek, and the second hypothesis is supported for Businessweek (and only directionally for U.S. News and FT). In all likelihood, both notions make sense—that good incoming classes will benefit schools in subsequent rankings, and schools ranked well will enjoy selecting from a more competitive pool of applicants the following year. Clearly the model could be extended to see how long rankings effects last, and whether the effects are stronger or weaker in the presence of other factors in the model.
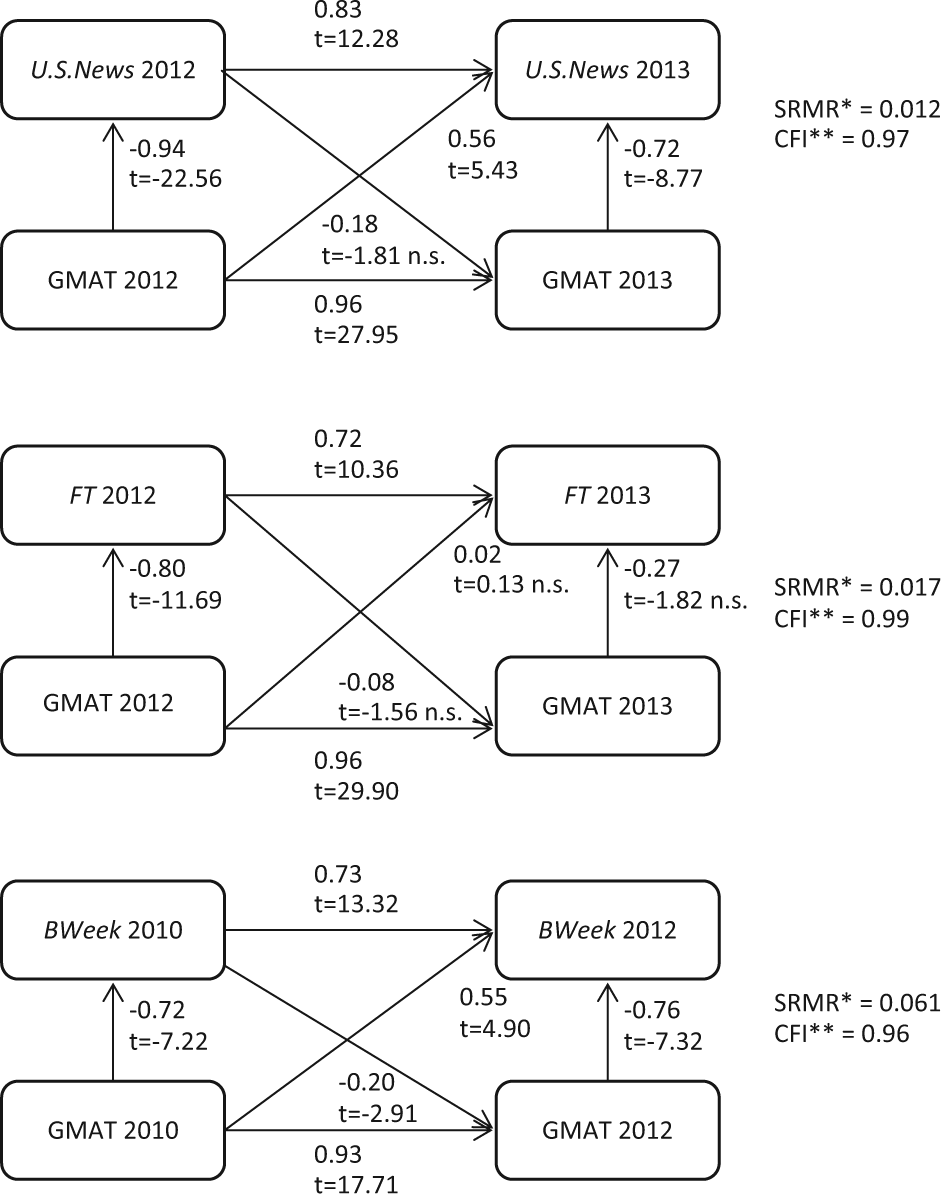
Lagged analyses of rankings and student quality.
Similarly, with greater confidence in these measures, human capital questions might be examined. For example, how much more value do business schools offer beyond identifying students with the greatest potential and commitment to business? Such value might be assessed as the extent that MBA programs enhance student salaries beyond what would be expected based on entering characteristics. In the first step in this analysis, the model controlled for incoming student quality and other business school signals (i.e., GMAT scores, grades, acceptance rates, and tuition). For the U.S. News data, this preliminary model explained 78.2% of the variance in salaries and was statistically significant (F4, 67 = 60.10, p < .0001). The residuals were then regressed on the U.S. News business school rankings. The results indicated that students who attended business schools that ranked better on U.S. News earned higher salaries (remaining R2 = 5.5%, β = −0.23), and this effect was also significant (F1, 70 = 4.07, p = .0476).
Analogously for the FT data, the quality cues explained 79.0% of the variance in salaries (it was also significant, F4, 43 = 40.36, p < .0001). The residuals were then regressed on the FT rankings. Here too, the results indicated that students who attended business schools that ranked better on FT earned higher salaries (remaining R2 = 11.8%, β = −0.34), a significant effect (F1, 46 = 6.13, p = .017).
The most recent Businessweek data did not include salary information, so comparable analyses were run using both the U.S. News and FT salary information. The Businessweek ranks predicted the U.S. News salary residuals significantly (remaining R2 = 14.2%, β = −0.38, F1, 53 = 8.76, p = .0046) and the FT salary residuals significantly (remaining R2 = 10.3%, β = −0.32, F1, 43 = 4.93, p = .0317). In both cases, the results were in the expected directions that students graduating from the better ranked schools earned significantly more.
These results must be interpreted conservatively, however, because some rankings contain employment data (e.g., U.S. News contains starting salary), and thus the ability of the ranking to predict employment success is somewhat circular. Also, the data were not available to enter all entering student characteristics that likely influence admissions decisions and starting salary, particularly including prior work experience, or even the average student age as a proxy.
The results are also complex because so many of the measures are somewhat correlated, as indeed their theoretical constructs would suggest. The results from the two-wave analyses just described seem to imply that once the quality signals for student (GMAT and grades) and school (selectivity and tuition) are statistically controlled for, the incremental effects of the school rankings, although significant, seem to be modest in size. One interpretation of such a pattern of results might be that the rankings are not reflecting any new information. Accordingly, students at schools that are not ranked highly favorably can take solace in the knowledge that the rankings do not seem to matter in a substantial way, at least vis-à-vis their resulting starting salaries.
At the same time, the results do not allow for drawing a conclusion that the business schools themselves add little value. When the measures described above are modeled simultaneously, to partial out and statistically control for the effects of each predictor from the effects of the others, the results look somewhat different. In these simultaneous models, when predicting U.S. News salaries, the U.S. News ranking has the strongest parameter (β = −1.081, t = 3.40, p = .0012) compared with the other predictors: GMAT (β = −0.085, t = −0.67, p = .502), selectivity (β = 0.082, t = 1.45, p = .151), grades (β = −0.070, t = −1.50, p = .138), and tuition (β = 0.065, t = 1.44, p = .155). Similarly, when predicting the FT salaries, the FT ranking itself has the strongest parameter (β = −0.564, t = −5.53, p < .0001) compared with the other predictors: grades (β = 0.271, t = 2.99, p = .0047), tuition (β = 0.163, t = 2.39, p = .0215), GMAT (β = 0.046, t = 0.38, p = .7039), and selectivity (β = −0.036, t = −0.40, p = .6918).
Regarding the Businessweek rankings, when predicting U.S. News salary information, the Businessweek ranking has the strongest parameter (β = −0.607, t = −6.59, p < .0001) compared with the other predictors: GMAT (β = 0.359, t = 3.00, p = .0043), tuition (β = 0.116, t = 1.71, p = .0938), selectivity (β = 0.053, t = 0.59, p = .5598), and grades (β = −0.023, t = −0.30, p = .7676). When predicting the FT salaries, the Businessweek ranking continues as the strongest parameter (β = −0.309, t = −2.84, p = .0071) albeit with less dominance over the other predictors: grades (β = 0.285, t = 2.57, p = .0142), tuition (β = 0.228, t = 2.62, p = .0126), selectivity (β = −0.165, t = −1.39, p = .1738), and GMAT (β = 0.137, t = 0.94, p = .3534).
Yet another way to interpret the impact of rankings on salaries is to translate the regression coefficients into actualized monetary differences. Specifically, for the most recent year of data, every rank improvement toward the top on U.S. News yielded graduates $908.03 more on average for the schools’ graduates in their first post–business school position. Every rank improvement on FT translated to $377.58 more, and every rank improvement on Businessweek yielded $605.27 more.
Discussion
This research aimed to evaluate three primary rankings in terms of their reliability and validity. In assessing reliability, there was relatively strong evidence of consistency over time of each ranking and of most of the facets that contribute to form each ranking. Granted, the stickiness from year to year may be attributable to pervasive and ongoing biases, for example, while schools that are perennially at the top of the rankings no doubt earned those reputations, they would probably also continue to dominate other schools even if the others were implementing important innovations, for example. Correlations among rankings over the years may also certainly be at least in part a function of the three publications using the same samples of companies, or contact personnel at companies and schools who complete the surveys. Presumably for all these reasons, the rankings data show consistency over time.
Next, each publication’s implied definition of a good business school was compared against the empirical relationships showing which facets actually predicted each ranking. In this inquiry, we saw that each of Businessweek’s facets were useful in predicting its overall ranking, but U.S. News and particularly FT could obtain their same results even by streamlining their data collection efforts, specifically by dropping all facets except the significant ones in Table 4.
In terms of validity, the data showed reasonable levels of evidence for convergent and discriminant validity for each ranking. Most of the correlations in Table 6 of concepts that should be related to rankings were significant, and most of the correlations in Table 7 of concepts that should not be related were not. Even so, the rankings showed somewhat distinctive patterns and personalities, which render them complementary and not redundant (a characterization supported by their high but not perfect intercorrelations in Table 5). Between the three, the rankings seem to cover the entirety of a throughput model of students in business school—for example, the incoming student quality is captured by U.S. News via GMAT scores, students’ satisfaction with their school experience is captured by Businessweek, and students’ resulting jobs and salaries are captured by U.S. News and FT. As depicted in Figure 2, the heterogeneity across the three rankings covers the full model—the answer to the age-old question as to whether students are raw material inputs, or students are customers, or students are products seems to be: Students are all three.

Throughput model of business school rankings.
Practical Implications
There are several manners in which the rankings might be improved. For example, in general, as with any survey, low response rates are problematic, and there may be design flaws whereby smaller schools (with fewer alumni) and smaller companies are less likely to be well represented (and the rankings could give schools feedback as to which companies were surveyed).
Businessweek and FT could also follow U.S. News’s lead and publish scores in addition to ranks. The publications could remind readers that their ranking results are best interpreted with a confidence interval around each school, and they could easily introduce a footnote saying that a school’s score is unique to within some number of points, much as how political polls render accuracy “within ±3 percentage points.” Thus, the pride of the students at top schools could be echoed at many other schools whose rankings are not significantly different from the coveted top spots.
In addition, each publication has unique weaknesses. The Businessweek rankings are determined by fully 90% subjective polls (students and recruiters). It is in the best interest of any student to graduate from a highly ranked business school, so setting aside any ephemeral complaints about one’s school, all students should be motivated to rank their schools as highly as possible. Due to such vulnerability of subjective polls, Businessweek may be well advised to incorporate a few indicators that are more objective. U.S. News is the strongest ranking in terms of objectivity, but going forward, they might insist that all students’ incoming test scores be represented; that is, if GRE scores are accepted in place of GMAT scores, the percentiles of both should be reported so that low GMAT scores would not go unreported as missing (though note that the two standardized tests attract samples of test takers from different populations of students, aspiring to different professional degrees, thus the percentiles may need calibration before they may be compared), or students with low GMAT scores funneled to non-MBA degrees so as not to bring down the average scores of the full-time program. (These actions are not the fault of U.S. News, but as business school students quickly learn, people respond to incentives.) FT shows high consciousness in gathering indices representing various forms of diversity and geographic inclusivity, but the industry has yet to have the conversation that impels these as requisites of strong capitalism—empirically these elements did not influence rankings.
The authors have never seen a single business school or faculty that is not continually striving for improvement in the business of delivering management education. Thus, if publishers truly sought to assist MBA students and recruiters, they could serve in a number of ways; for example, they could post interactive spreadsheets in which users could attach weights of their own choosing to the various facets to derive a ranking personalized to suit their particular needs. In addition, these media could produce special issues that featured profiles of selections of schools, or summaries of best practices to be shared with newer schools, for example, those arising rapidly in China, greater Asia, South America, and so forth, the journalists at these media could assist in collaborating on writing cases for MBA audiences, and so forth.
Alternatively, perhaps these well-resourced publications creating the rankings could collaborate in periodic surveys that query the careers of graduates over longer durations. In the current research, a salient criterion was salaries achieved on graduation. Higher salaries at the beginnings of a business person’s career probably bode well for higher salaries later as well, but surely the relationship is not perfect. Furthermore, surely there are other factors by which to evaluate business school training—is the graduate generally happy, finding job satisfaction and fulfillment (Hunt et al., 1986), has the graduate gone on to be an ethical decision maker, a good mentor, highly skilled at finance or marketing or more successful as a generalist, and so on. Such long-spanning research studies would be highly beneficial—whereas businesses may have moved to shorter cycles and shorter term thinking, business schools and universities are dedicated to education for the long haul.
Conclusion
This research examined the MBA rankings provided by Businessweek, U.S. News & World Report, and the FT. Reliability and validity were tested, and apart from the noted exceptions, the rankings showed good consistency over time, and reasonable patterns of convergent and discriminant validity. This research is the most comprehensive to date, including all three major surveys and data from their initial publications, and it is hoped that this research is seen to provide a substantial original contribution to the literature and a large-scale basis from which to discuss henceforth theoretical and practical issues regarding rankings.
Finally, let us close with a very suiting observation. Since 2005, Princeton Review has published lists of the top 10 business schools in several categories, for example, “Best professors,” “Most family friendly,” and so on, based on their web surveys of students’ opinions. They offer the following wise counsel to potential students considering attending a business school, every year unfailingly remarking, “It’s worth repeating: There is no one best business school in America [or in the world]. There is a best business school for you” (phrase in braces added).
Footnotes
Declaration of Conflicting Interests
The authors declared no potential conflicts of interest with respect to the research, authorship, and/or publication of this article.
Funding
The authors received no financial support for the research, authorship, and/or publication of this article.