
Abstract
Observations from faculty who teach marketing indicate that a relatively small percentage of students have strong interest in quantitative analysis and many come into the marketing major out of the misperception that it is light on math. In reality, over 98% of marketing professionals use data during their decision-making processes, while 80% of marketing-related problems use data at least in part to be solved. This article outlines a teaching model for analytical decision-making that links marketing problems with marketing research. It is stressed that while only a small percentage of marketing students become marketing researchers all will become consumers of information that is generated by research. Outlined herein is a dual-stage curriculum approach focused on preparing students to be knowledgeable consumers of research by incorporating a problem and metric-based pedagogy. This design is supported by data from 185 marketing professionals who contribute commonly asked “on the job” problems along with frequently used metrics that marketing students should learn as they train to be future marketing professionals.
The field of marketing captures the imagination and spirit of many talented students who possess strong interpersonal skills and ample ability to succeed. At the same time, skills in analytical processing and thinking appear to be less appreciated yet they are equally necessary for success. This, apperception is derived from an oversimplified or misunderstood knowledge of the field and impairs our ability to fully communicate the seminal role marketing plays in the firm and society. First, when asked on the first day of class “What is marketing?” students routinely jump to answer “advertising” and “sales.” Naturally, their response is a product of cultural misunderstanding, miseducation, and oversimplification. Marketers do, as part of their function, “advertising” and “sales” along with a plethora of other activities to “ …create, communicate, deliver, and exchange offerings that have value for customer, clients, partners, and society at large” (American Marketing Association; https://www.ama.org/the-definition-of-marketing-what-is-marketing/). Second, almost every aspect of marketing has a metric associated with it: “At its core marketing is a discipline involving a network of numbers-metrics-all tying to the bottom line” (Pilling et al., 2012, p. 181). Thus, a math light perception of being a marketer falsely portrays the field as math weak. Finally, the rigor of decision making (how to make sound decisions) and how those decisions influence both the performance of the marketing function and the performance of the firm is underappreciated.
Taken together students come into the field with many talents as it accommodates a very broad spectrum of skills ranging from interpersonal communication, creative design, and innovation. Yet supporting each of these wildly disparate skills is an underlying requirement that marketers must manage performance through a plethora of data while managing the marketing function within the context of the organization through reliable decision-making processes.
This article offers a brief perspective on the vital role of marketing research to all marketing professionals and a call to refocus the pedagogy of teaching marketing research in the context of marketing decision making. The leading premise is that as marketing students learn to make functional-related decisions they should use metrics generated by researchers. In sum, they should learn that research is an activity that aids (a) every marketer regardless of the diverse nature of skill-sets, (b) the decision-making processes associated with external positioning and functional planning, and (c) the internal coordination of firm resources and marketing activities to effect firm performance.
Bringing into focus the holistic importance of marketing research is no small challenge. Historically, curriculum planning has treated research as an activity that is detached from other marketing areas. Taught in a project-based course relegates most student’s exposure to the field with a rigid process that attempts to solve a single problem in a relatively linear fashion. Challenging this tradition, the practice of research (verb) and the use of research (noun) is pervasive to all marketing activities. The reality is that very few marketers will ever perform a 12-step marketing research project yet all will need to make decisions based on data that researchers produce.
The call to better incorporate research principles across the curriculum is mirrored by the growth of data-driven decision sciences. Today more than ever data are used in decision making to reveal new connections that yield innovative ways of thinking, perceiving or rationalizing, thus, producing an insight. Specifically, an insight is “ …an interpretation, a ‘reading’ of a given situation/behavior/belief state that explains the dynamics of that situation in a different way, that allows marketing and business to approach and influence the end-state differently” (Appleton, 2019). Placed in context, the relative importance of identifying business and consumer insights is enormous and reflected by significant investments to its practice over the past 20 years (Stone et al., 2004). Yet the model used to teach marketing research has largely remained unchanged and illustrates an antiquated boundary-bound presentation of the field. Traditionally marketing research is presented as a task-focused study of how to “do” research in a singular class. Using this context, perhaps it is not better to learn about the field in terms of what researchers do but rather why researchers do it.
This article presents an applied approach to the presentation of marketing research within our curriculum design focusing on how to use research findings in decision making. The proposed approach involves dual stages that link curriculum to (a) instruct students in research processes, data sources, data validity, and presentation; (b) expose students to realistic dilemmas that marketing professionals encounter which researchers help identify and solve; and (c) pair both marketing professionals and marketing researchers with appropriate metrics that they use to make decisions and assess performance.
In the following sections, this article offers background theory that defines the role of the researcher as an information bridge and the ensuing challenge of identifying research questions followed by a dual-stage solution that survey data from current marketing professionals supports. In essence, we form a blueprint that redirects the current approach of teaching “how to do” research from a stand-alone function to an integrated decision-making tool that better reflects the current needs of marketing professionals.
Background
Role of the Researcher
Marketing is organized by several subdisciplines performed under the broad umbrella of marketing. As a unique field of study “marketing research” serves to support all marketing activities by contributing information so that problems can be solved and decisions made. Yet the exposure students have to marketing research is often a “how-to” process for conducting research without a strong emphasis on its role in marketing decision-making. Ironically, in near universal agreement research educators instruct students that the most important step, stage, or activity in research is to identify the manager’s research question. In asking this question, researchers are essentially linking their research process with a managerial problem that serves as the hinge pin setting into motion our multistage research process. Paradoxically, problem identification rarely receives more than a single class or assignment for students to learn its nuance.
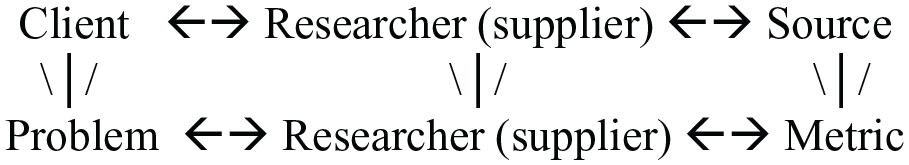
Referring to the American Marketing Association, marketing research “ …links the consumer, customer, and public to the marketer through information …” (American Marketing Association; https://www.ama.org/the-definition-of-marketing-what-is-marketing/). Viewing the researcher as a link between market knowledge and managerial decision-makers has merit. First, as an external partner the researcher provides the client a degree of objectivity given they are one step removed from the decision center. Second, they form a protective physical and psychological buffer between the sponsoring client and the data source. By doing so they disguise the client from the source to protect the integrity of the sources identity, ensuring ESOMAR and General Data Protection Regulation (GDPR) standards may be kept (ESOMAR, 2020; GDPR: https://gdpr-info.eu/). Third, researchers help encourage best practices through continuous improvement, reeducation and professional development. Consider Figure 1, which centralizes the role of the researcher within a research acquisition process and reflects a supplier mentality of forward (downstream) flow of work. In our current approach to marketing research education significant emphasis is placed on teaching methods to gather, organize, analyze, and report findings (Hair et al., 2010). By doing so we almost exclusively focus on the researcher-source linkage. This connection prompts the researcher to focus toward the sample and subsequent data analysis while all but ignoring the client–researcher link.

Client–research–source model.
Figuratively, the marketing researcher behaves as a conduit or bridge between the sponsoring client, or agent, and the source of the phenomenon in question. In doing so they have an obligation to the client whom they are working for while managing data sources appropriately. To be clear, the client is defined as the one who will use (consume) market research to evaluate and manage performance-related aspects of their sphere of responsibility and while in some contexts the researcher is an external supplier, we would be remiss not to include internal researchers that serve internal clients within the client–researcher dyad.
This component of the model must be understood since the client provides background and context to the research question. They enlist the researcher to provide a measure of objectivity and technical skill that they lack. Meanwhile, the researcher can lean on their experience to anticipate the client’s needs and offer a perspective that the client lacks. A critical, added value component the researcher provides is the ability to draw from experience as they interpret results and form otherwise missed connections that we now call insights.
Client–Researcher Gaps
As Figure 1 suggests, the relationship between researcher and client is as valuable as the researcher is to the source. Yet the client–researcher link is often poorly understood by faculty. In early work relating to the efficacy of marketing research education Parasuraman (1981) calls marketing faculty to action in an effort to improve what is defined as a communication gap (Greyser, 1978; Holbert, 1974, 1976; Kover, 1976) between marketing faculty and business practitioners. Over a decade later Giacobbe and Segal (1994) suggest that what students learn and what practitioners do is further misaligned and illustrates inconsistent expectations between students and practitioners (in Gap1a, p. 46). They note the obligation educators have in bridging the practitioner–student gap to deliver an effective preparatory experience for students (Honea et al., 2017). Restated, marketing curricula should expose students to content in line with current in-field practice, thus, reducing the knowledge gap between students and practicing marketers.
Such a model as described in Figure 1 illustrates the need for researchers to be able to base research activities around the decision-making needs of the client. At the same time, students not destined to become researchers need to clearly understand the role research plays in their ability to make decisions. Doing so is no small task given that many students fear data, analysis, and the research methods course required by many college curricula (Bridges, 1999). This underscores the challenge to effectively satisfy the dual problem of training students to perform research activities while also training them to use information effectively to form and execute marketing strategy. In effect, we need to create a formal and uncompromising connection between the information derived from research and its ability to provide a manager (client) with what he or she needs to know to perform his or her job.
Marketing Research Curriculum
The challenge ahead is to develop a teaching perspective whereby students see themselves as a client and learn to use data (and research) to answer appropriate managerial problems. By doing so they will become both better consumers of data and decision makers. Meanwhile, those who end up as researchers will be better able to understand and anticipate the needs of their clients. Such a curriculum approach is directed toward all marketing students with the aim of helping them discover the value marketing research brings to managing performance and brings them into marketing research with an understanding of its ubiquitous role it has across all of marketing.
Building on the Client–Researcher–Source model (Figure 1), a dual-stage solution is proposed toward a better understanding of marketing research. Stage 1 provides the foundation for data-centered decision making by introducing students to the role of research within the marketing function, marketing information systems, marketing research industry, and data source evaluation concepts. In Stage 2, students discover questions and problems marketing professionals face in the conduct of their work. These problems form the impetus for research objectives, that is, problem identification. Simultaneously in Stage 2, students learn the appropriate metrics professionals use as they solve those vexing problems, make strategic decisions, and evaluate performance. Marketing is home to hundreds of metrics that marketing professionals use and marketing researchers should measure. Student–researchers should be versed in producing them while student–managers should be versed in their application.
Dual-Stage Curriculum Model
Stage 1: Introduction to Marketing Research
Stage 1 introduces marketing students to the research profession. It provides a base of knowledge by describing different types of data, data sources, and finally elements of data quality and validity. This foundation offers a backdrop of understanding in entry-level marketing courses; then, it is reinforced at other points within the curriculum. To reiterate, most students will not become active in the research profession but all will eventually come to use information it generates. Thus, each student must have the ability to critically evaluate information quality.
Today, most generalized marketing courses (e.g., Introduction to Marketing, Marketing Management, and Marketing Strategy) offer a single module (or book chapter) focused on marketing research. Generally, the content is a generic overview of ongoing research (accessing and organizing internal data) and project-based research (multistep research process). Students learn the components of marketing information systems often in the form of an information systems model with key source inputs, and a set of managerial cautions used to develop one. Then, they learn the steps to perform project-based research in an abridged manner. While this approach introduces students to research processes, it falls short of illustrating its usefulness for functional activities, planning, and developing strategy. Given the broad nature of these courses a point of emphasis may better be focused on showing how research is used as a support mechanism of decision making. A sample outline of material for students in such classes is provided in Table 1.
Objectives and Content for Marketing Research Introduction.
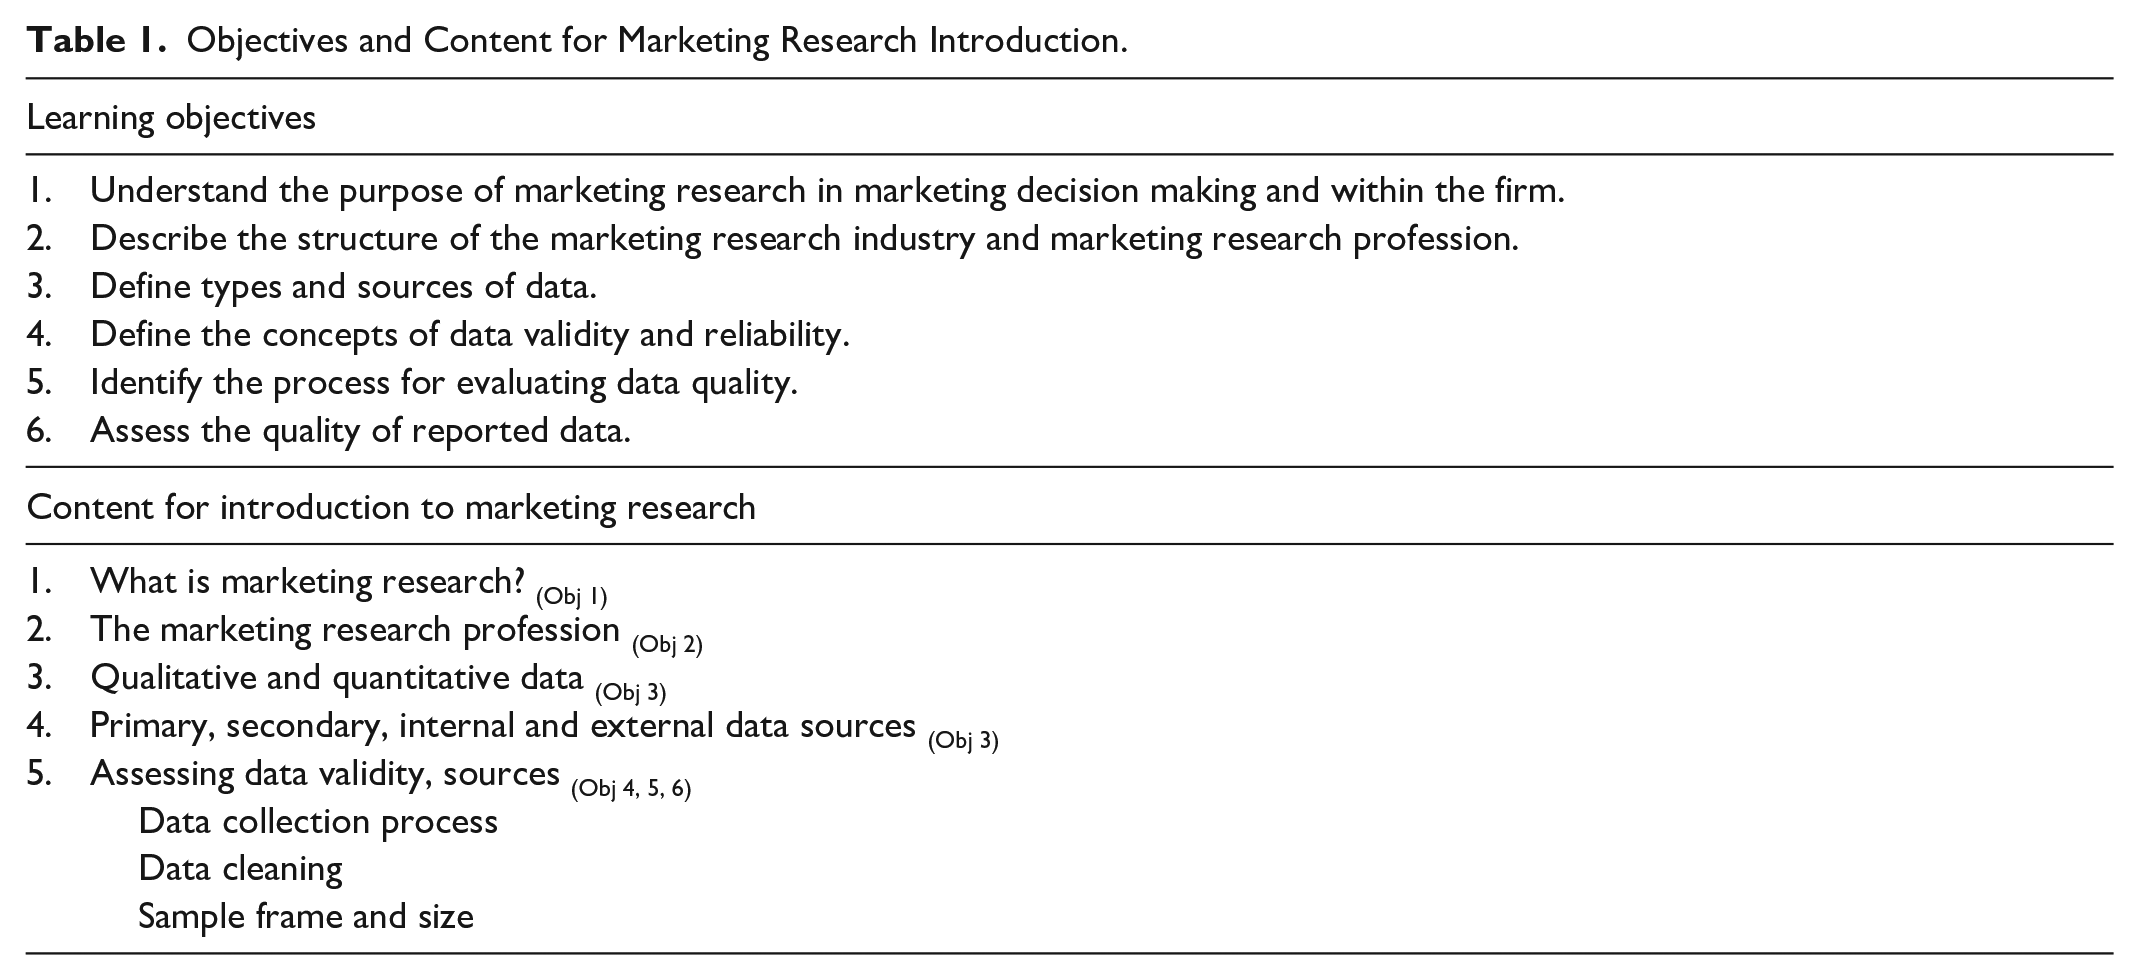
The foundation formed by Stage 1 (illustrated by Table 1) focuses on six points of emphasis, which serve as module objectives. First, students should understand the role marketing research plays as a decision-support function to managers across the firm. Second, given that marketing research represents a defined profession and industry they should know who performs research and the roles of both internal and external suppliers. Managers need to know where to go for research and the relative pros and cons of internal versus external suppliers. Third, students should distinguish between the benefits that both qualitative and quantitative data provide. Moreover, they should be able to critically assess location of data, sources of data, and sample frames for their appropriateness. Fourth, they should understand the theoretical concept of validity insomuch as the data sufficiently represent reality in the context of their sample frame. They should be able to determine if measures consistently capture their intended construct, and that bias during the data collection processes was limited. Fifth, they need to be able to evaluate the processes used in both marketing information systems and project-based research. Process evaluation provides opportunities for evaluation which reduces time and costs as improvements are implemented. Finally, students should be able to assess the quality of reported data particularly in its ability to inform decisions.
The central purpose of this stage is to compel students to critically evaluate information used to form strategy and make decisions. Moreover, it presents the benefits of research by reinforcing its use in every area within the marketing function. Introduced first in principles of marketing, these concepts continue to be relevant in other courses such as consumer behavior, promotions and advertising, services, and sales management. Finally, this foundation should be reinforced during their capstone course in the context of experiential learning where higher level learning objectives are sought.
Stage 2
The challenge identified by Giacobbe and Segal (1994) is illustrated in Figure 2 where three distinct observations can be made. First, (see “a”) starting with the Client it shows that he or she generate problems as a result of performing his or her job. Problems can be identified as singular (Why did dales drop last quarter?) or ongoing (Let’s track customer satisfaction.). Meanwhile, researchers produce data as part of their job from revealed as measures and metrics (e.g., Unit Sales, Customer Satisfaction . . . ). Second, (see “b”) the decisions made in reference to client problems require information that is provided through measures and metrics. Simultaneously, appropriate measures and metrics are dictated by the nature of the problems to be solved. Finally, (see “c”) it is imperative that the client learn the most appropriate measures and metrics needed to help solve his or her problem, while the researcher learn the problem needed to be solved (i.e., Gap1a; Giacobbe & Segal, 1994).

Client–research activity map.
Applying this model, Stage 2 builds from the foundation Stage 1 establishes in two ways. First, students are taught to identify problems that they, as future clients, will ask. Second, they learn the appropriate metrics needed to answer those problems.
Stage 2a: Problems to Solve
A dilemma for many research students is the identification of the research question. They must think as if they were managing a brand, product, advertising campaign, promotion, sales staff, retail store, or some other business operation. Problematically, as the student considers a problem they naturally begin to ponder about what type of research they will be performed …will it be exploratory, descriptive, causal? Where will data come from …internal, external, secondary, primary? Will I use a combination of approaches …qualitative, quantitative? …and so on. All of these must be answered which is the primary thrust of most marketing research courses. Unfortunately, with so much focus placed on how to do research they have little time to be client-focused and rarely examine the nuances of how their results will be applied. As a student learns about marketing research a stressor should be placed on the marketing portion of the subject. The Problems to Solve portion of Stage 2 provides such emphasis by incorporating common problems (research questions) faced in practice. Thus, a student trained in common marketing dilemmas will be better familiar with such problems in practice while researchers will better understand how clients will use the results they provided.
In application, this stage exposes students progressively to managerial problems through their marketing curriculum by course. Common problems encountered by Retail Managers should be brought to students in a Retail class, likewise a Sales class should cover problems from Sales Managers. Each course, in the curriculum should have its own set of problems most commonly faced by working professionals. Pilling et al. (2012) discuss teaching marketing concepts along with new metrics to help form linkages between the two. In this manner, practitioner-based problems are naturally linked with an appropriate metric as it fits into marketing’s broader framework (see again, Figure 2, b). By having students study and respond to these problems by course, they are exposed to practitioner-based content, which is more relevant to them as they eventually enter job environments while developing higher order cognitive skill development (Bloom, 1956).
While each course in the marketing curriculum offers specific dilemmas germane to the course, overview classes such as principles of marketing, marketing management, and marketing strategy provide a different challenge. Outlined by the design flow of a marketing plan such courses generally follow a planning model similar to Figure 3. They typically begin with an enterprise-level perspective of both internal and external evaluations including SWOT (strengths, weaknesses, opportunities, and threats), resources, external environment, competitors, and so forth. Next, students learn the intricacies of segment-target-positioning, branding and other strategic marketing elements. Finally, they focus on functional-level strategies within value creating activities. Notably, each stage (enterprise, strategic, and functional) provides problems faced by practitioners that can be addressed through research.
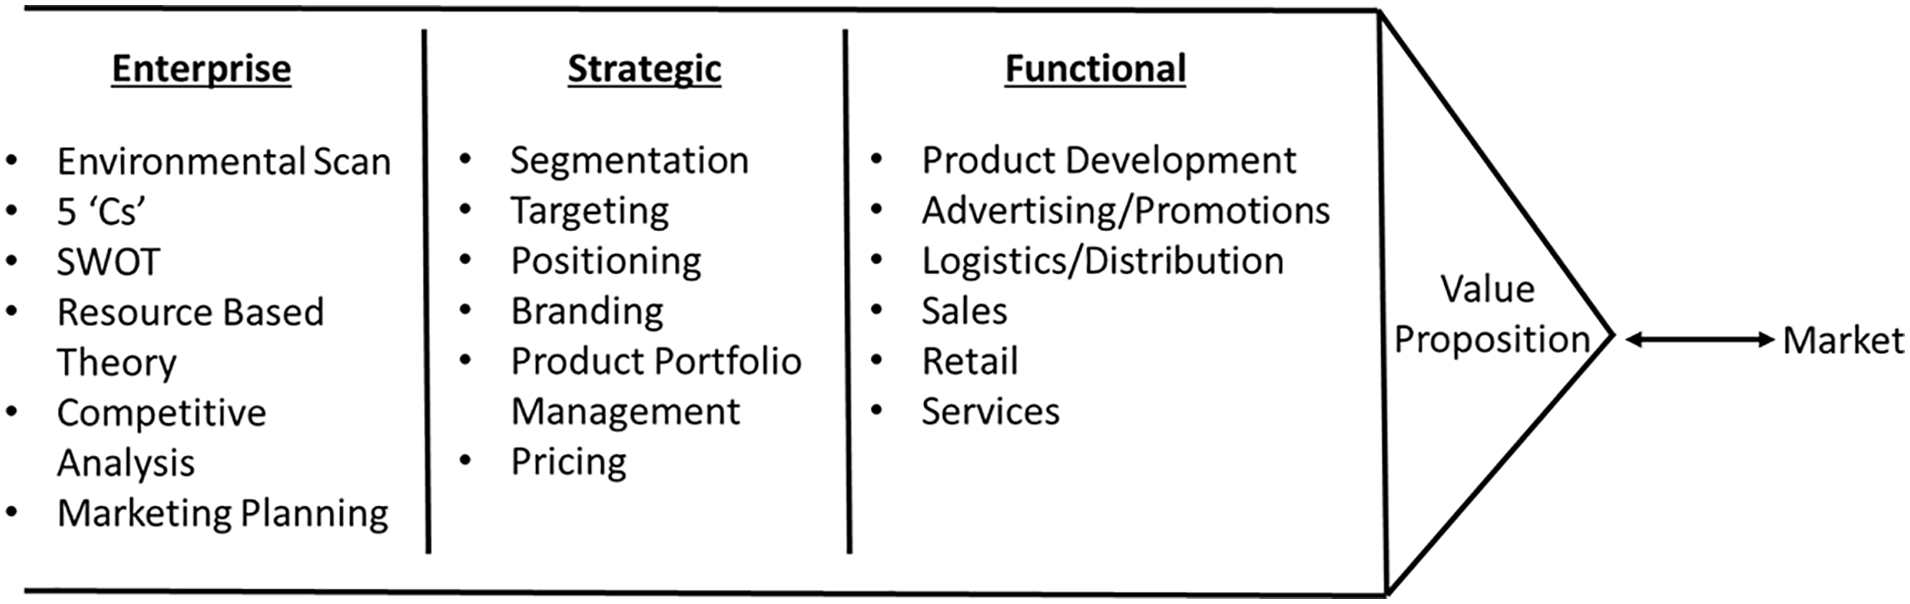
Marketing curriculum map.
Introducing students to course-specific Problems to Solve creates significant benefit within the curriculum flow as students enter their marketing research course. While students engage in their marketing curriculum they are progressively, being exposed to the research questions client–managers typically ask. Such preparation allows students to operationalize project-level assignments by identifying a client problem, which traditionally is difficult to do. Yet by design Stage 1 and now Problems to Solve of Stage 2 better prepares students as they enter a Marketing Research class by arming them with a decision-making research perspective. To this end, students first learn to recognize how their research will be applied before they learn how to perform the research itself (Pilling et al., 2012).
Stage 2b: Metric and Measures
The second component of Stage 2 provides direction for the problems posed in Problems to Solve by outlining commonly used metrics and models in practice. Thus, a metric-centric pedagogy is used to equip students with practical tools to solve commonly asked problems. Importantly, students are more likely to embrace the quantitative nature of the marketing once they understand the relevance of each metric in its relationship to forming decisions (Pilling et al., 2012; Tobias, 1987). Identified here is the Problem–Researcher–Metric linkage, which in practice connects a managerial problem and the appropriate metrics via the researcher (see Figure 4). Moreover, the Problem–Metric link is operationalized through the relationship between the Client and Researcher and curriculum that reinforces the relationship between the researcher and client fosters employment-relevant skill development (Bove & Davies, 2009). By operationalizing the managerial problem into a research question it becomes linked to the data accumulated and presented by the researcher. Thus, the learning design prescribed here calls on the student to learn how both client and researcher work together to produce information that can solve problems.
Extended client–research–source model.
In 2012, Pilling et al. asked how well prepared new marketing students were to conduct quantitative analysis to support decision making noting that they consistently scored lowest on standardized tests among all business students (Aggarwal et al., 2007). Extending Posner and Rudnitsky (1997) they go on to outline a curriculum design concept that is rooted in educational goals that include identifying key metrics used in decision making, applying those metrics appropriately, weighing alternative solutions, and making final recommendations. Their outline approaches learning from a case-oriented manner leading students to a higher degree of critical thinking (Bloom, 1956) similar to that of case analyses. To this extent, students are introduced to a scenario on which they assume the role of a manager and work through decisions the manager would make given key metric data. Thus, Pilling et al. (2012) operationalizes a metrics-focused curriculum by linking marketing concepts together with key marketing metrics in such a way that illustrates their relevance to the broader framework of marketing and subsequent decisions that marketers need to make. Spiller and Tutan (2015) extend Pilling et al. (2012) into social media illustrating the many metrics used in practice, while Brennan and Vos (2013) do so focusing on financial analysis in decision making. In even earlier work, Giacobbe and Segal (1994) use a gap analysis drawn from expectation–performance service quality models and literature (Parasuraman et al., 1985). They uniquely bring marketing research practitioners into curriculum design by illustrating the expectations–performance gap between themselves and students. By design, a clear line is drawn showcasing the role practitioners can play in forming curriculum calling out educators to teach students about what practitioners do.
Note that the inclusion of a metric-based component to the proposed learning model has two desirous effects. First, it provides students with actionable tools to manage and form strategy. Students who are provided with metrics used by practitioners are not only better equipped to enter the job market but also more reasoned in problem-solving situations. Second, students who are exposed to a direct link between “problems asked” and “metrics used” (Figure 4) become more adept researchers. Not only, does the student understand what needs to be measured sooner when asked to resolve a specific problem but also they are more likely to make connections among metrics and form insights the manager originally does not recognize.
Curriculum Summary
Both Stages 1 and 2 may be presented in parallel form throughout the marketing curriculum. Keeping with the foundational nature of Stage 1, students benefit from a well-grounded knowledge of how marketing research provides decision-making resources while Stage 2 provides both realistic managerial problems they will face as practitioners and the appropriate metrics they will use to solve those problems. Similar to Pilling et al. (2012) a module (or unit) approach is plausible as managerial problems and the metrics used to solve them naturally fit existing marketing courses. Understanding that it may not be feasible to add courses given student credit hour limits and faculty coverage constraints the incorporation of each stage is possible when integrated along with the course-appropriate content. By doing so, instructors can flexibly add Stages 1 and 2 course-relevant content that they want students to learn. Importantly, students should be drawn to the problem–metric link within existing courses especially when used during topic summaries and case analyses. In sum, multiple benefits can be cited for such a problem and metric-based focus:
Students are exposed to metric-focused content from the introductory course to their capstone in marketing. Consistent exposure to metrics reinforces their use and importance to marketing managers in practice.
Students learn to be curious investigators and are trained to be critical and analytical thinking marketers.
The slow, steady exposure of metrics and analytics does not overwhelm the student.
Students are better prepared to manage in the real world, because their class experience more closely resembles actual practice.
Students do not silo data analysis to marketing research, they are conditioned to think of data as an underlying component of decision making, planning, and strategy development.
Greater time and energy can be placed on teaching how to “do” marketing research in the research course since students already come prepared with Stage 1 knowledge about the field of research.
Identifying the research question becomes easier for students since they have been trained to think and ask questions like a manager.
Students are more likely to form insights since they are primed to see relationships (links) between well-known metrics and a problem to solve.
Described next is an application and implementation of Stage 2 using data from an exploratory study. The application first illustrates commonly faced practitioner dilemmas followed by the most common metrics used in practice by marketing and business professionals. Finally, an in-class example is provided to illustrate the metrics-based decision-making teaching model suggested in this article.
Application and Implementation
To support a refocus toward client-based problems and metrics a study was conducted of business professionals who graduated with degrees in business. The purpose of the study is to elicit problems faced by marketing practitioners as well as key performance indicators (metrics) they use in their job. These data are then used to demonstrate an in-class application. Insights garnered from this exploratory research are focused around two specific areas. First, we want to better understand the most common managerial problems that our students-turned-practitioners will face (supporting Stage 2a). Second, we want to learn the most common key performance indicators (metrics) used in practice (supporting Stage 2b). Similar to Smith (2012) these include metrics that current students will eventually encounter and should be incorporated into their curriculum. In sum, the study’s objective is to identify curriculum content that realistically describes what practitioners face in today’s data-rich environment.
The data source for this study is an online survey that was designed and distributed to a panel of former business students who took marketing courses including a marketing research course as part of their undergraduate curriculum. Participants were notified by alumni contact emails using an internal alumni database. The survey was available for 4 days with a follow-up reminder after 48 hours. No incentive was offered. The quantitative data were analyzed in SPSS v.25, while open-ended responses were evaluated using a basic coding process (QDA Miner software) relying on reoccurring key words. Article authors and research graduate students performed the quantitative coding.
Sample
The sample frame included 864 college graduates from two AACSB-accredited universities located in the Midwestern United States with enrollments ranging over time from 7,200 to 12,500 students. The sample was chosen based on access to alumni contact information from 2007 to 2019. All respondents were either business majors or minors. 94% of the sample earned a business degree while 70.5% of all respondents specifically earned a marketing degree further suggesting the appropriate nature of the sample to inform marketing curriculum content. Students majoring in business who took marketing courses are identified as appropriate for analysis given their likelihood to hold marketing-related jobs and their prior experience with marketing curriculum including a course in marketing research. Nine contact emails were returned as undeliverable, 185 respondents completed the survey. The final sample size resulted in a 21.6% response rate. The occupational fields and job functions represented in the sample demonstrate a broad representation from the marketing function. Many of the respondents are in sales, in addition to 18 other distinct fields. Moreover, level of position represented in the sample varies from entry level to executive (see, Tables 2 and 3 for demographics). Note also that over 90% of the sample took a marketing research course of whom 49.8% were within the last 5 years and the remaining (50.2%) took it more than 5 years ago.
Sample Occupations and Level of Position.

Sample Demographics and Educational Preparation.

Including areas such as finance, accounting, management of information systems, and entrepreneurship. bIncluding areas such as corporate communication and sports administration.
As part of the data collection, respondents were asked about their use of data, reports, and external information in the context of decision making for their job. The sample’s response indicates that they frequently review metrics relating to key performance indicators (KPIs). 65.2% of the respondents review KPIs at least weekly while 33.7% review them daily. As they review metrics, 83.2% of respondents indicate that they routinely use KPIs to make key decisions (using the top two box score on a 5-point scale). Most decision makers use a blend of internal (gut instinct) and external information (reports, dashboards, data) and is confirmed by 98.9% of the sample who use at least some external information as they make decisions while 78.2% affirm that it is incorporated into their decision-making processes 50% of the time or more. 88.0% of respondents indicate that KPIs are used to assess past performance which supports the importance of metrics in assessing performance. Interestingly, 65.1% of respondents feel that they have a great deal of influence on the KPIs they monitor. In sum, these individuals likely find motivation in that they can influence key evaluative criteria affecting their performance.
Results: Questions and Problems Managers Ask
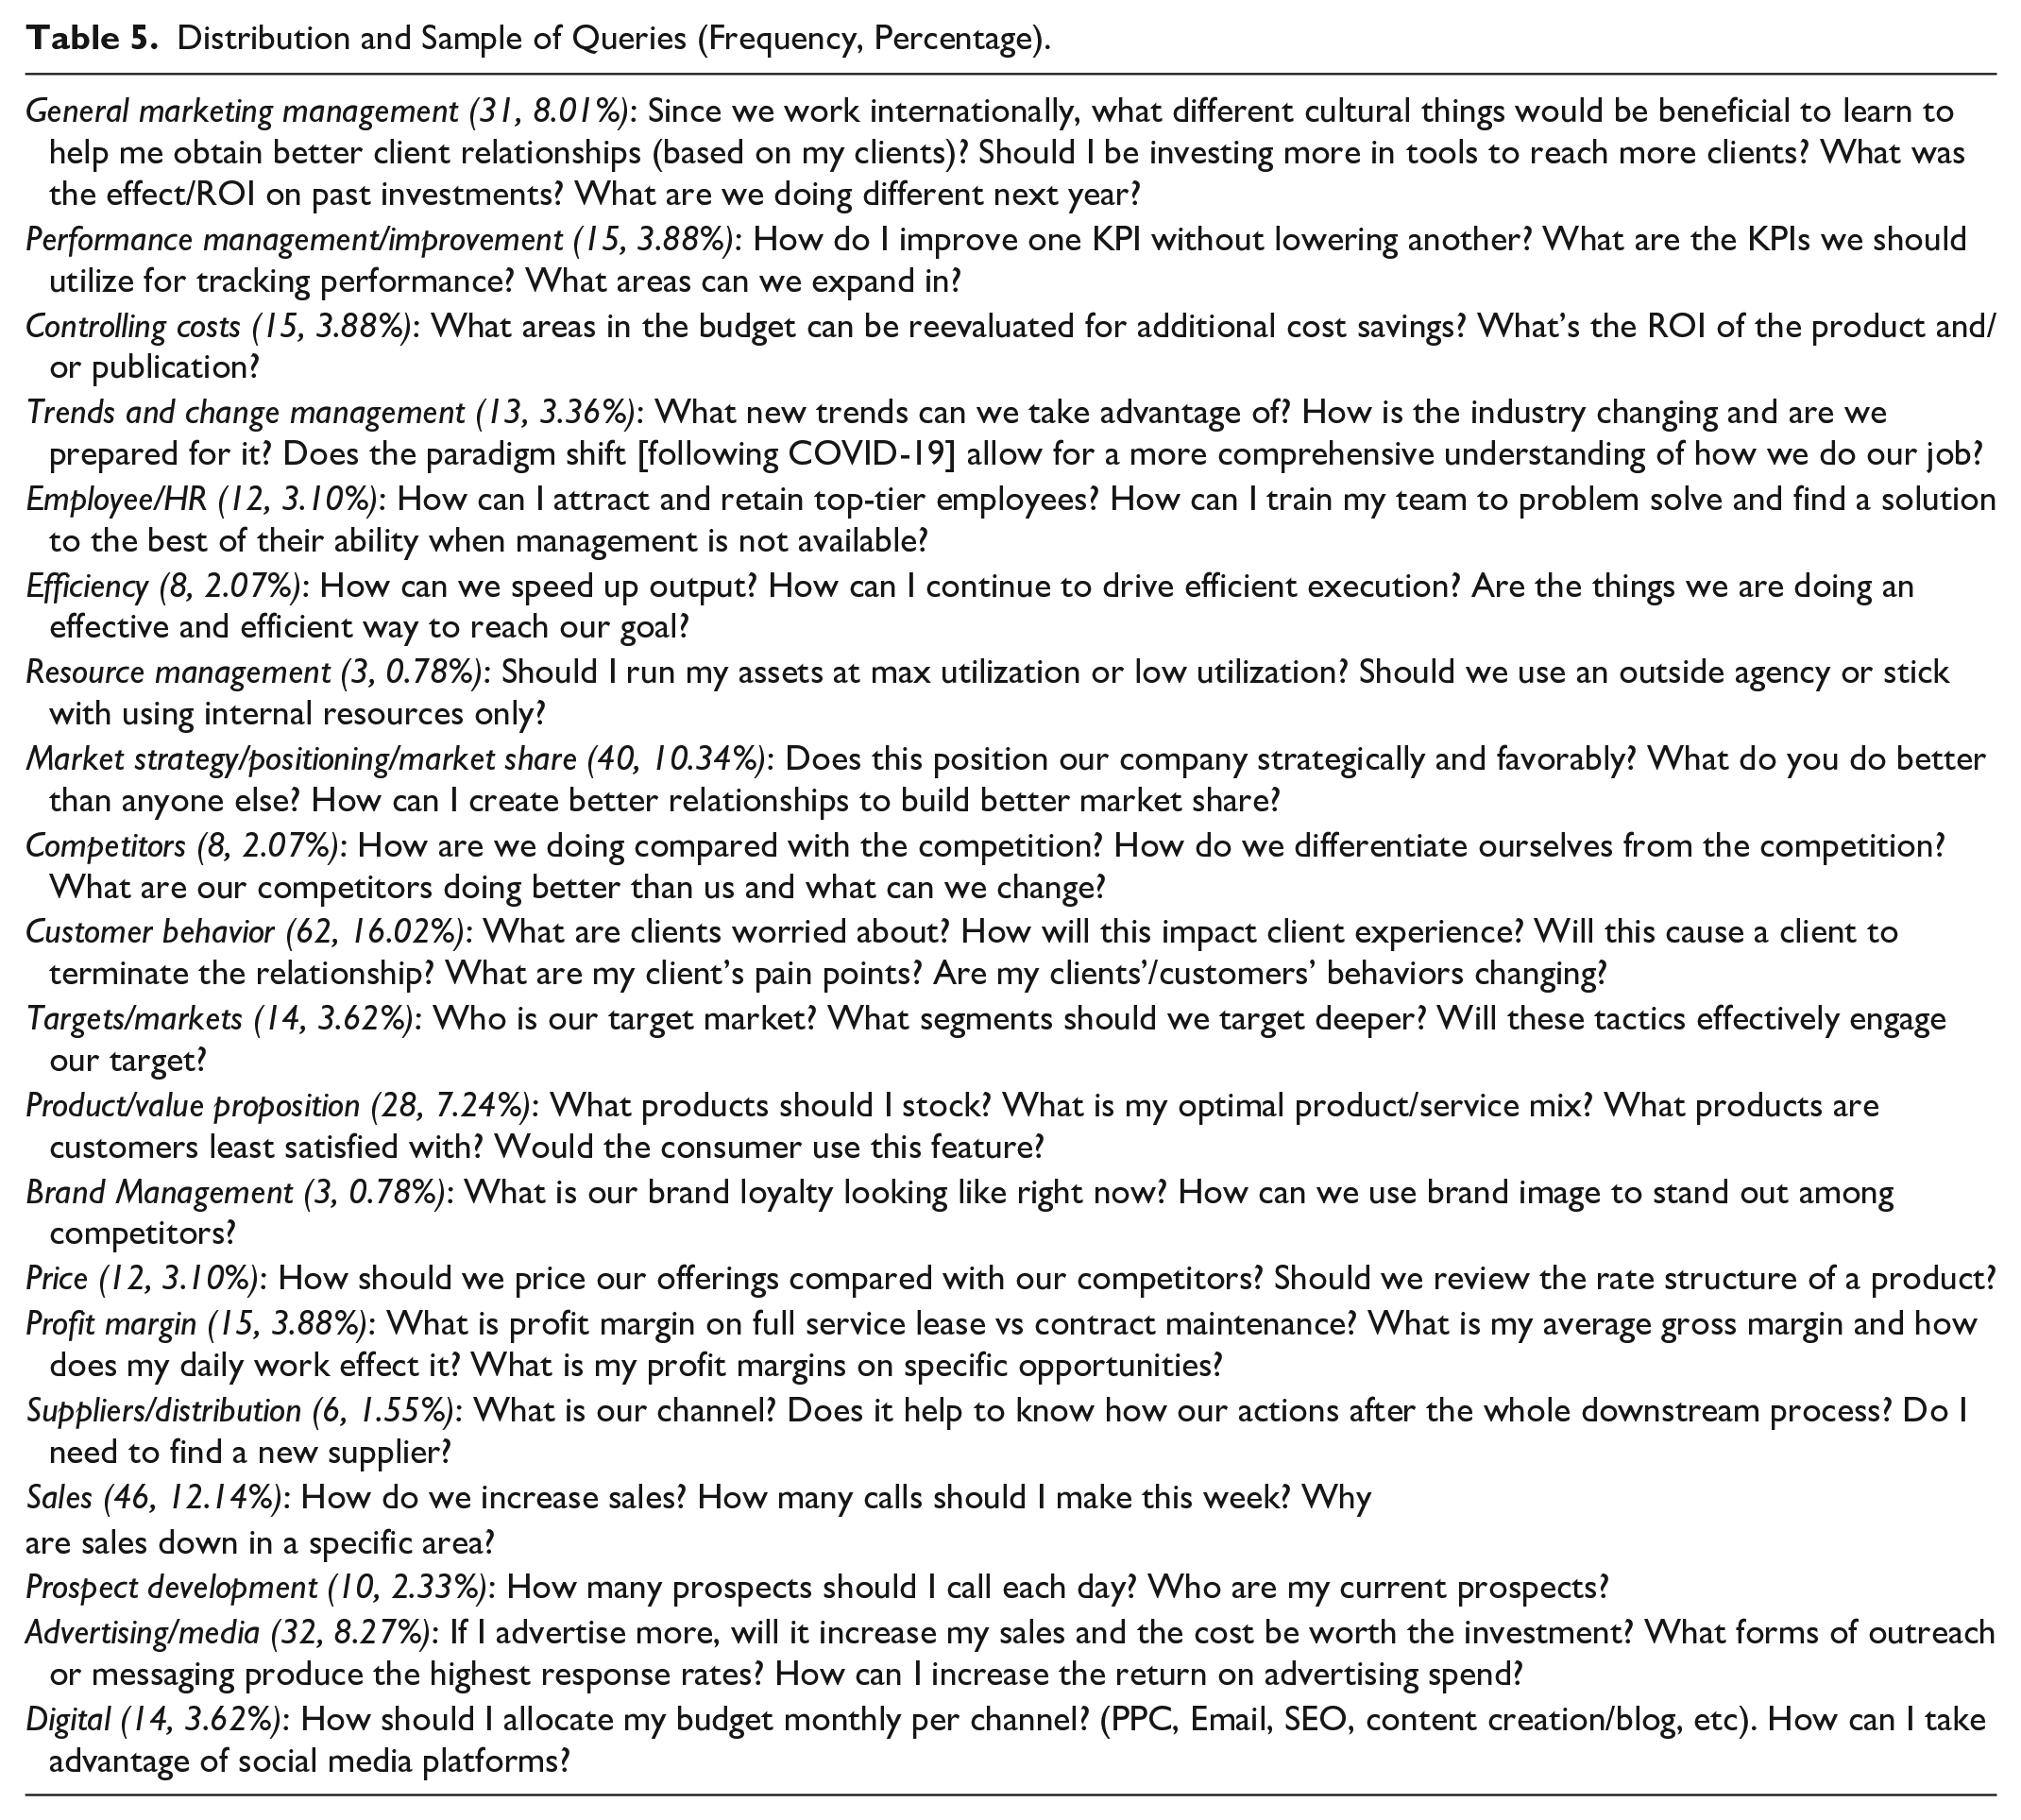
The first objective of this study is to ascertain the types of problems encountered by business marketing professionals who have experienced a marketing curriculum including marketing research. Respondents were asked: “What are managerial questions you most frequently ask or ponder?” Averaging two questions per respondent the sample gave 387 distinct responses. The data were initially read and coded using an unstructured approach in an effort to coalesce common traits. This coding procedure is an analytic process through which “data are fractured, conceptualized, and integrated to form theory” (Strauss & Corbin, 1998, p. 3). During the initial analysis the authors identified four generic elements (themes) that were refined by repeated coding with the assistance of graduate students. Each response from the sample was coded accordingly onto each element. The elements appear distinct and on repeated coding they were refined into subdimensions to provide greater richness. The four elements (themes) are Query Type, Object of Query, Action, and Function.
Query Type
Query refers to the nature of dilemma being posed. Three subdimensions emerged the first of which is Knowledge Inquiry. Knowledge Inquiry (53.1%) is a question that asks how or why knowledge is learned. Examples include How can I continue to drive efficient execution? How should we price our offerings compared with our competitors? Should we use an outside agency or stick with using internal resources only? Note that these questions generally focus on a process that can inform the respondent as they make decisions.
The second subdimension of query is Descriptive-Reflective. Descriptive-Reflective queries (45.7%) ask for the current measure of a key metric or function. What is my profit margin? What percentage of my signups turn into sales? Is this feature worth the investment?
The final subdimension of query is Cause and Effect. Cause and Effect questions (1.2%) are complex insomuch as they infer relationships among metrics. Consider the following: How do we engage more customers, and create more consistent buying habits? In this question the respondent implies that customer engagement is related to consistent buying habits. That is they presuppose a cause-and-effect relationship. In another example, the respondent relates relationship quality to market share: How can I create better relationships to build better Market share? While these questions are knowledge building, they also illustrate complex insights that managers perceive to exist.
Object of Query
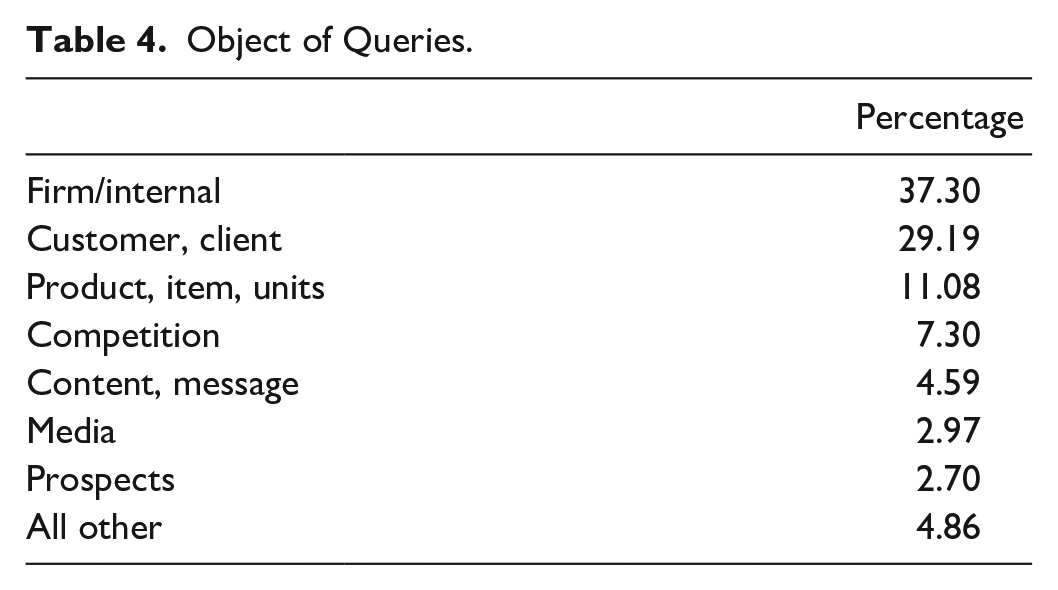
Object of Query refers to the point of focus on which the question lies. Over seven objects of query are identified as subdimensions. In many cases, the object of the query is on the firm (37.3%, see, Table 4) or the customer (29.19%). “What are my profit margins?” Note that the metric “profit margin” reflects the firm, thus it is the object of the query. Similarly, clients are the focus in this example: “What are clients worried about?” In another example, “How can we stock more items?” The focus is on items to stock, or most likely products. The answer to this query will likely yield a process or strategy that will allow them to keep in inventory more SKUs. Finally, one asks, “What are my competitors doing?” where the object in question is competition.
Object of Queries.
Action
The Action is reflected by what change or act is proposed. Over 25 actions (subdimensions) are referenced to in the data; however, over 83% of the actions are captured by Grow/Increase/Improve, Use, Advertise, Create/Develop/Make, Spend/Purchase/Buy, Advocate/Support, Carry/Stock/Inventory, Control, Engage, and Test/Evaluate. Examples include the following: “How can we get more product in the clients hands?” “How can we speed up output?” “What is the best way to reach our customers?” “Are my customers changing?”
Function
In addition to analyzing how dilemmas were posed the responses were also categorized by marketing function. Actual questions gathered in this study reveal that a wide range of marketing functions are represented (see, Table 5). Customer Behavior was the focus most often followed by sales, marketing strategy, advertising, general marketing management, product and value propositions. Together these six categories represent over 62% of the questions the panel asks. While heavily fragmented this data code provides guidance for marketing educators as they teach students by functional area.
Distribution and Sample of Queries (Frequency, Percentage).
Results: Metrics Managers Use
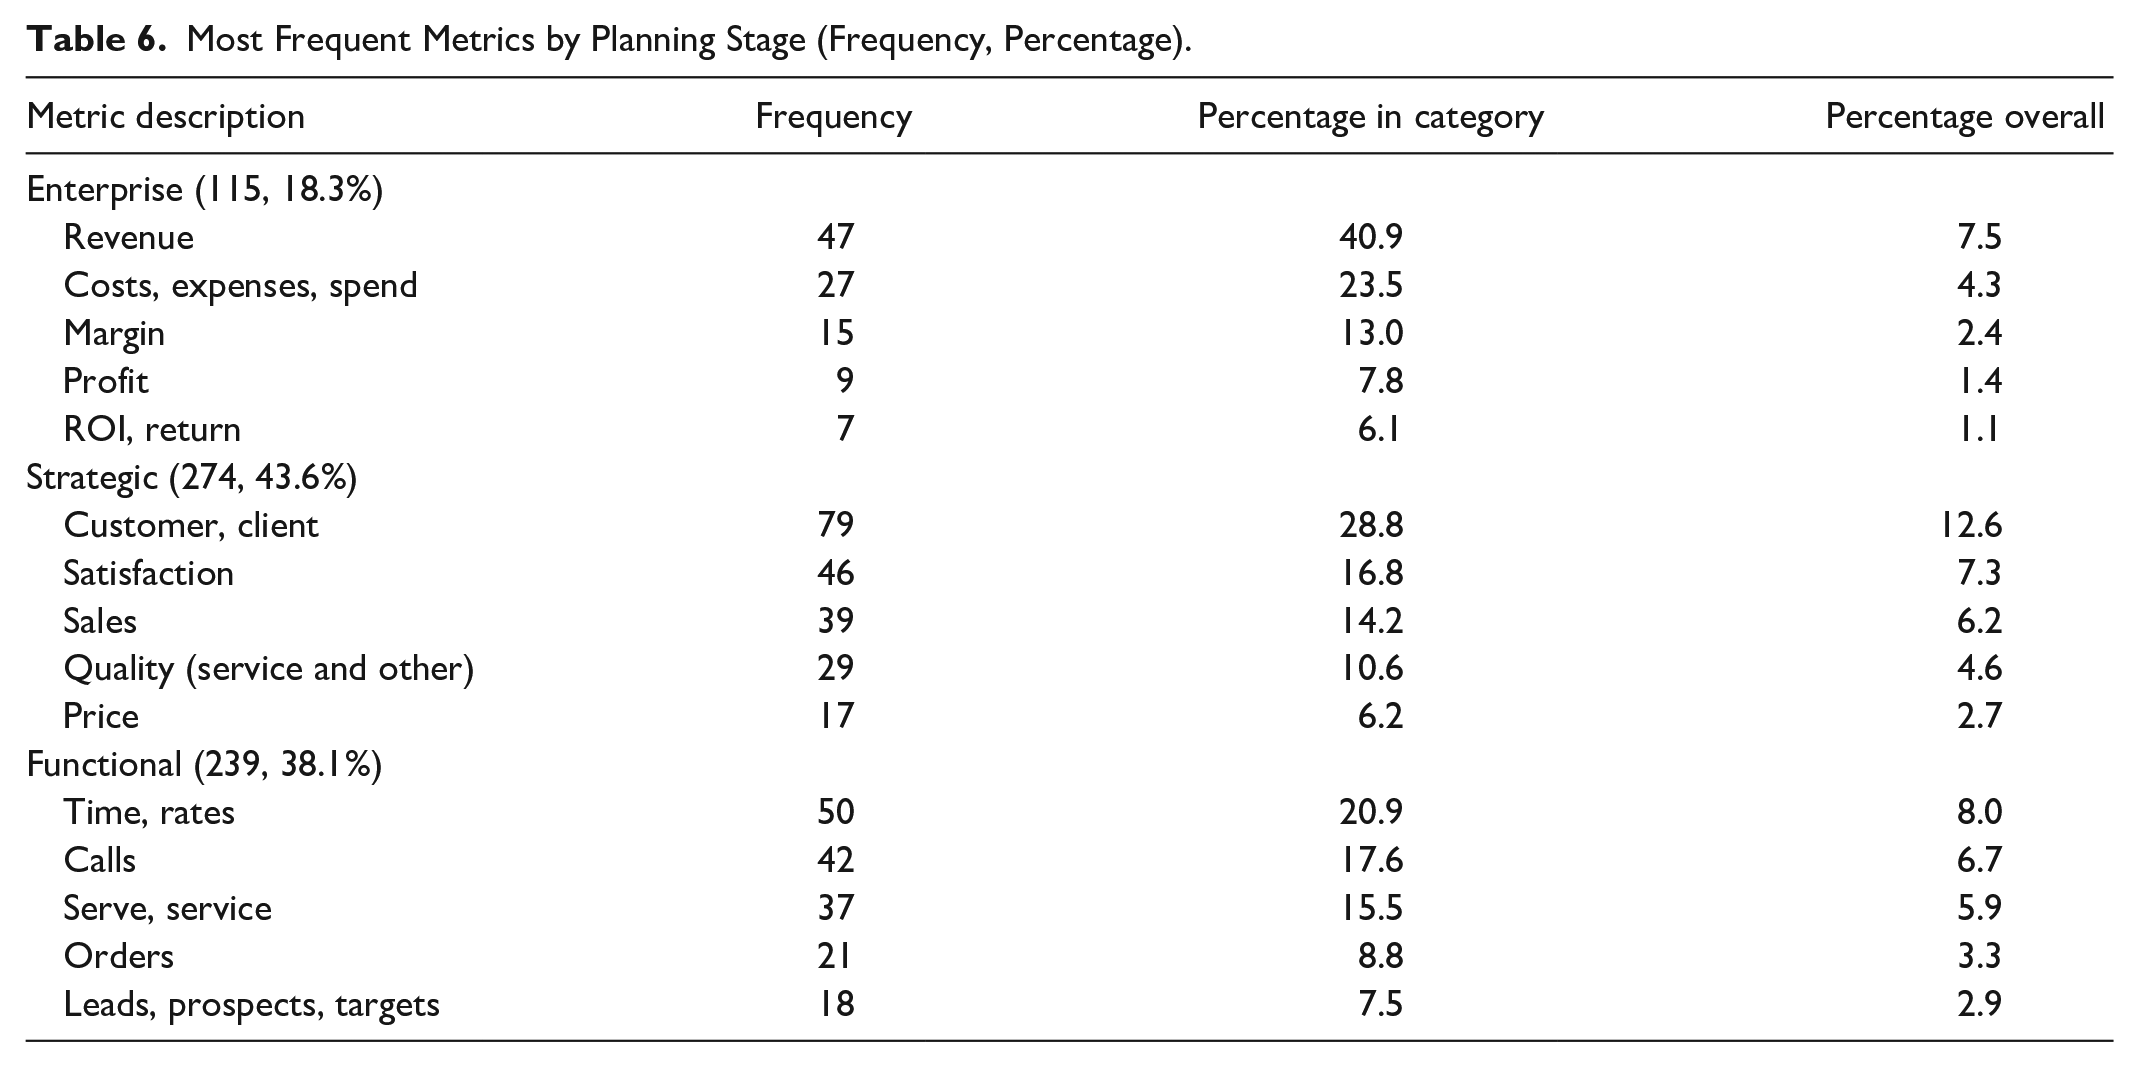
The second objective of this study is to record the most common metrics (key performance indicators) used in practice. To do so respondents were asked: List the key performance indicators that are linked to your area’s performance. In all, the sample provided 628 metrics. On average, each respondent provided over three metrics each. Again, the data were coded and arranged using a scheme previously identified except with a priori guidance from Figure 3 (marketing curriculum map). The marketing curriculum map was followed initially to categorize metrics into three stages within the marketing planning process, Enterprise, Strategic, and Functional. Following this scheme, subdimensions were identified and each metric was coded then ordered by frequency (see, Table 6). Most metrics referred to activities that may be found during the Strategic planning stage (43.6%) while metrics during Function stage activities appeared 38.1% of the time. Overall, customer-related metrics appear most often at 12.6% followed by time-related metrics such as turnaround time, response time, and delivery time (8%). Third is revenue (7.5%), followed by satisfaction (7.3%).
Most Frequent Metrics by Planning Stage (Frequency, Percentage).
In-Class Application
To implement a portion of the curriculum advocated in this article data from the exploratory study were used as part of a senior capstone marketing strategy course. This course was chosen because it focuses on decision making where metrics are used to plan and form strategy. New course material was developed to implement the Stage 2b—Metrics portion of the model. Course material included a written instruction guide, metrics-based homework assignments, and imbedded exam questions. The material was deployed to a single course section of 35 students. The 38-page instruction guide developed for the pilot includes 81 different metrics taught in the course. For each metric, students were given a formal definition, calculation, illustration of its use, and example problems. Three homework assignments were deployed during the course that included calculation and interpretation of 53 different metrics (see Appendices A and B for example metric descriptions and problems). Finally, 18 exam questions were embedded into regular course exams to test students’ ability to calculate and apply the metrics used in the course (Table 7).
Student Exam Averages for In-Class Metrics Questions.

This application is a useful demonstration of practitioner-based data toward curriculum development and better prepares students for employment by narrowing the knowledge gap between faculty and marketing professionals. The limitations of the illustration are that it only incorporates one third of the model, it was not introduced and continued from introductory-level courses, and it has no control or temporal basis to compare its effects on performance in marketing research–related courses.
Generally, students encounter marketing education in three stages: Introduction to marketing, focused-area marketing, and finally marketing management or strategy. This article proposes that students be exposed to stage-appropriate metrics that managers use as they perform their job. In this manner, introduction to marketing students should be exposed to common, descriptive metrics appropriate for its content. On progressing to their focused-area marketing courses such as retailing, services, advertising, sales, and product design (to name a few) they should see metrics that support these subdiscipline careers and which refer back to those learned in their introduction courses. Finally, as they progress into a capstone course such as marketing management or strategy, firm-level metrics and the interrelated nature of their effects on performance should be the focus.
The example application provided in this article offers three steps that can be used and repeated across the three stages of learning outlined here. A standardized metrics instructional guide may be adopted by marketing faculty at the department level and used at each stage. The guide developed in this research includes 81 metrics which may not all be used in every course, however, as students progress through their curriculum the consistency of terms and availability of the guide will reinforce the proper use of important metrics. Moreover, if faculty agree to embed consistent question types within their respective courses, then multilevel student assessment becomes feasible.
Discussion
This research confirms that managers incorporate data into routine decisions at a very high rate providing support for a data (metrics)-heavy approach to marketing education beyond that found in marketing research courses. Incorporating practitioners’ experience into curriculum development serves as the impetus for curriculum review and redesign. Similar to client and case-based course elements, this approach adds elements of realism to the learning experience and helps expose students to the realistic challenges that practitioners face. While exploratory in nature, this article provides a realistic snapshot from a practitioner’s point of view that faculty can use to define current student learning experiences.
Questions and Problems Marketing Professionals Face
Data surrounding the questions that managers ask are closely divided between knowledge inquiry and descriptive-reflective characteristics. While descriptive-reflective questions focus more on the status of specific metrics, knowledge inquiry questions probe much deeper into how marketers perform their function inside the firms to effect consumers and competitors. To this point, such questions closely resemble an insight as they look for “ …the discovery of a relevant, actionable and previously unrealized reality …” (UMI; https://www.umi.us/blog/market-insight-definition/). Given the depth of these questions, further stress is placed on the relationship between the researcher and client as they identify the correct research question.
The following question illustrates the complexity of knowledge inquiry questions: How can I improve client retention? In application, using our current market research curriculum the researcher would be able to execute a project to measure client retention. Ideally, they would also identify probable influencers of client retention, incorporating those in such a way so that their association with retention can be estimated. Such an extension brings added value to the manager but only to the extent that the researcher understands the nuances of client retention. Making this distinction forcefully puts the “marketing” into “marketing research” and is generally a missing connection in the current marketing curriculum. As illustrated in the extended client–research–source model (Figure 4) the researcher forms a key linkage between the manager client and metrics used in decision making. Problems provided by managers reinforce the need for researchers to know and understand marketing and for managers to know and understand how metrics and key performance indicators integrate marketing activities toward the rest of the firm.
Metrics to Learn and Use
As business students, marketing majors understand that businesses are heavily managed from a numerical perspective. Though marketing is viewed as “math light” other business disciplines are perceived as “math heavy” given their use and reliance on their own metrics (e.g., accounts receivable, current ratio, quick ratio, debt-to-equity ratio, return on investments, cash flow, return on assets, return on equity, earnings …). Ironically, marketers manage a vast array of metrics in every capacity of the function. Marketing professionals identify in excess of 100 distinct metrics yet little consistency exists across marketing programs failing to establish a “universal” body of marketing metric knowledge.
Building on the results of the study, metrics most commonly monitored include those used in strategic decision making (43.6%) followed by function activities (38.1%). While marketing as a profession does not have a heavily structured bank of metrics that are taught and assessed across all marketing curriculum the call has been made (Pilling et al., 2012; Spiller & Tuten, 2015). Data suggest (Table 6) that the most common metrics mangers use (and researchers should be able to measure) include those for customer experience and markets, product and service satisfaction, revenue and profit margin, sales and sales-related efforts, advertising and digital marketing. Arguably, all marketing students could benefit from a standard set of metrics that is defined by the practitioners much like other business fields have adopted. Doing so would provide greater consistency across the marketing field. In a step toward this direction, the Marketing Accounting Standards Board (www.themasb.org) joins practitioner and academic communities. Their work has produced a Common Language Marketing Dictionary and Finance in Marketing video library. As a compilation of vetted terms and concepts, these resources provide the marketing education community with a reasonably independent source to set the standard practice of defining metrics the collective profession can identify.
Linking Metrics With Performance
An ongoing request by Marketing Science Institute (2018) and other academic outlets has been to better understand the role marketing has on firm performance metrics. Specifically, they call us to better understand key performance indicators and metrics (Marketing Science Institute, 2018). This call helps both form marketing strategy and justify its resource deployment decisions. Increasingly firms are modeling growth using marketing function initiatives and brand development tactics, thus, the relative importance of the marketing function has come to permeate the C-suite.
As an extension to this reality, students have to learn the broader impact of marketing on the firm. This impact may include firm valuation, growth, and strategic perspectives. By evidence from this study, 37% of questions the sample asks are related to firm-level issues. For example, respondents ask: What are we doing different next year? What areas can we expand in? What areas in the budget can be reevaluated for additional cost savings? Does the paradigm shift [following COVID-19] allow for a more comprehensive understanding of how we do our job? What new trends can we take advantage of? And, What can we change to do better? Meanwhile, over 18% of key metrics used in practice are enterprise related. Among those, revenue, costs, expenses, spending and profit margin are most frequent.
Finally, the type of questions asked suggest that marketing professionals seek better solutions as they explore how their role affects the firm overall. Over 50% of the questions the sample ask are rooted in knowledge inquiry, including How can I continue to drive efficient execution? How should we price our offerings compared with our competitors? Should we use an outside agency or stick with using internal resources only? These examples highlight the dynamic impact researchers can play to inform managers as they go well beyond descriptive analysis to the internal cause-and-effect relationship that marketing decisions have on the firm.
Implementing a shift that brings research into the broader curriculum that addresses these concerns is no small task. Stage 1 described earlier compels students to evaluate information critically so they can form strategy and make decisions. Its purpose is to illustrate the role research plays as a decision-making tool. Highlighted in Table 1, we propose objectives that all marketing students should work toward mastering. In particular, their understanding of how research helps decision making and their ability to evaluating and assessing data quality.
This may be done in nonresearch courses by having students role-play a manager’s dilemma to practice decision making, through simulations, and by emphasizing the effect of decisions on performance-based data such as ROI, sales, market share, or profit margin. Such activities help demonstrate the link between good information (data) provided by researchers and the quality of decision they are able to make.
Simultaneously, students learn through practice that marketing problem solutions are the result of valid and reliable research. Here they employ Stage 2 concepts as they apply the problems to solve and the metrics that help managers resolve them. An appropriate method to introduce these may be simply through passive introduction. Referenced in Table 5 three example problems include: What areas can we expand in? What products should I stock? and How do we increase sales?
What areas can we expand in? may emerge from a lecture regarding, the Asoff growth strategy matrix (Ansoff, 1957) and could involve market growth rate or product sales forecast metrics. What products should I stock? could naturally extend a product mix discussion and include cannibalization rates or the effects of a complimentary product multiplier. Finally, How do we increase sales? has common application to sales management (sales effectiveness, sales funnel, and conversion rates), advertising (reach, frequency, media coverage), and pricing (sensitivity, reference points, perceived value).
Conclusions
The purpose of this article is to expose a lapse in focus that traditional marketing curriculum has had as the field continues toward a data-driven and insight observing reality. Growth in over the counter “DIY” research tools along with automated data-capturing technologies have created volumes of data that now require enhanced internal data management and AI-like marketing information systems. Such data have created a need for much more attention toward data science and the appropriate uses of data in decision making in marketing. Problematically, many marketing student’s only exposure to data-related issues is located in a single research class which does not integrate marketing research processes with the application of research results.
Often we view marketing research from a singular perspective focused on the execution of research that includes gathering, analyzing, interpreting, reporting results. In truth the role of the researcher is much broader and the impact far reaching within every aspect of the marketing function. Marketing education is cumulative in nature as students bring a foundation of knowledge into marketing research that is then built on (Pilling et al., 2012). The paradigm shift being described here should steer the delivery of a marketing research curriculum holistically, broadening its application to a wider array of courses. In reality a small portion of students have the desire to pursue a rigorous research profession yet each will use data to help make decisions. To this point, research projects are useless until a client incorporates it into their managerial and decision-making processes. In this light, marketing educators have the dual role of teaching students how to do research while simultaneously teaching them of its uses as they plan and execute marketing activities.
Over the past decade, a number of trends have created a dramatic shift placing greater focus on research-related concepts in both business curricula and practice. Big data, data storage and warehousing innovation, digital commerce, and the internet of things have now led to artificial intelligence and machine learning applications. This in turn has generated new generations of data scientists, engineers, and analysts. Today, coding skills and knowledge of SAS, R, and Python have grown in practice whereas in the not-to-distant past, Microsoft Access and Excel were the extant software taught for data management and analysis. Yet where do marketers fit if they lack focus in a specific subfield, abhor math, and do not fully realize the key role they play in creating value for the firm?
While the call here is not to add or delete courses from established curriculum, it is imperative that research principles become imbedded into courses where marketing decisions are made. Pilling et al. (2012) call for marketing research curriculum objectives to fulfill four outcomes. Students should be able to (a) identify key metrics, (b) apply marketing theory that explains behavior with metrics, (c) consider and evaluate alternatives, and (d) form recommendations. Meanwhile, Stern and Tseng (2002) discuss the need for balance in our curriculum between theory and application, which is needed since employers observe a skill gap from what our curriculum teaches to what they do in practice (Giacobbe & Segal, 1994). As noted by this research, faculty who are not engaged with industry retreat to standard teaching models neglecting the bridge between the information marketing researchers produce and how marketing managers use it. To adjust our current curriculum structure the call is made that students . . .
…better understand how to use information produced from research
…be exposed to questions practitioners ask along with strategies to solve those problems
…understand key marketing metrics and their role throughout marketing along with their purpose (definition), calculation, and gathering methods
…be challenged to develop relational insights between tying research results with specific managerial questions so that a dynamic and persuasive strategy is identified
While, the proposed shift in research education calls for a stronger data and analytic approach be brought to the marketing curriculum, there are notable limitations. First, its unrealistic to add courses that focus on marketing research. Already stretched faculty and student course loads prohibit the greater expansion of such classes. While this model does not call for additional courses it does call for greater time on research, measures, and problem solving in every other nonresearch marketing course. Second, all marketing students must come to an appreciation for data-focused decision making as a result of this curriculum. Students that loathe or otherwise reject the math reality of marketing will need to be reached and encouraged with care. The slow and deliberate dosing of research concepts throughout a curriculum is a benefit promoted. Third, routine feedback from practicing marketers is needed to maintain current and relevant content. This article assembles key practitioner questions and KPIs that practicing marketers use at entry and midlevel positions. More data are needed (a) over time so that new trends and updates can be made and (b) across a more diverse sample of marketing professionals. Finally, this research presents a partial implementation of the curriculum in only one section of a course. The proposed curriculum should be implemented program-wide with clear pre/post testing performed to gauge its effectiveness.
In conclusion, this research presents a two-stage approach toward improving how research concepts become better integrated into the marketing curriculum. First, students should understand the role of marketing research as an information providing function. By doing so students can practice evaluating information quality, validity, reliability, and sources in order to incorporate research into their decision-making processes. As they plan and form strategy students should be equipped to know how marketing research can supply appropriate data so they make informed decisions.
Second, students should to be exposed to common problems faced by marketing managers and the key metrics used to solve them. In this sense, it provides opportunities for experiential-based learning through cases, role-playing, simulations, and client-based projects. While, no substitute replaces job or internship experience, having marketing professionals provide direction contributes realistic teachable moments. Client-based projects in particular provide students with realistic experiences that frame their expectations as they enter postacademic life (Rohm et al., 2019).
Footnotes
Appendix A
Appendix B
Declaration of Conflicting Interests
The author(s) declared no potential conflicts of interest with respect to the research, authorship, and/or publication of this article.
Funding
The author(s) received no financial support for the research, authorship, and/or publication of this article.