
Abstract
Much research has focused on characterizing network management in recent years, yet very few studies have addressed how changes in the organization’s demographic composition might influence public managers’ networking activities. This study uses data from over 500 school districts in Texas to explore the effects of student body diversity on the time superintendents spend networking outside of the organization and the joint effect of diversity and networking on aggregate student performance. Using a series of regression models, the authors find that organizational (district) diversity has a positive influence on the amount of time a public manager (superintendent) spends on networking. They also find that organizational diversity has a negative effect on the performance outcome for Latino/a and Low Income students, but this influence can be mitigated by increased networking activities.
Public programs rarely operate in isolation. More often, they interact and cooperate across multiple agencies, sectors, and countries (Agranoff & McGuire, 2001; Kickert, Klijn, & Koppenjan, 1997). In fact, federal legislation increasingly requires multiple-actor collaborations for new program implementation (Hall & O’Toole, 2000, 2004) suggesting that this trend is unlikely to decline or change in the near future. Evidence of this interdependence of actors has lead to numerous scholars attempting to characterize the role of public managers in networks (Agranoff & McGuire, 1999, 2003; Meier & O’Toole, 2001, 2003; O’Toole, 1997; O’Toole & Meier, 1999; Milward and Provan, 2003; Provan & Milward, 1995). 1
Managerial arrangements, including collaborations and networks, are important to public agency performance. Research links these to positive public agency outputs, such as increased client satisfaction (Provan & Milward, 1995), improved municipal economic activity (Agranoff & McGuire, 2003), reduced state welfare caseloads (Jennings & Ewalt, 2000; Mead, 1997), individual earnings for JTPA participants (Heinrich & Lynn, 2000; Jennings & Ewalt, 1998), and individual earnings for welfare-to-work participants (Ewalt, 2004). Although research continues to more accurately characterize the general link between collaboration and agency performance, much less is understood about the role of the public manager within these networks and their effects on the networks’ performance (Berry et al., 2004).
Scholars have studied public managers’ influence on network performance in a variety of settings, including city management (Agranoff & McGuire, 2003), health and human services (Provan & Milward, 1995), public education (Meier & O’Toole, 2001), and human resources management and debt administration in state governments (Donahue, Jacobson, Robbins, Rubin, & Selden, 2004). All of these studies point to the positive effects of public managers’ on network performance. Yet several scholars identify numerous factors that moderate this relationship, including the level of network centralization (Milward & Provan, 2003; Provan & Milward, 1995), gender (Meier, O’Toole, & Goerdel, 2006), and goal alignment (Goldsmith & Eggers, 2004). No doubt there are myriad other factors that also influence observed outcomes. By recognizing and testing these factors, we can come to a better understanding of the role of the public manager in a networked environment of increasingly complex social problems and policy prescriptions.
One area that has received little attention in the network management literature is the influence of racial diversity. The Unites States has seen a major shift in the racial and ethnic composition of public workforce and public program target populations in the past 30 years. The Bureau of Labor Statistics estimates that nonwhites’ percentage growth in the labor force will be 2 to 5 times that of whites percentage growth in the labor force between 2006 and 2016 (Labor Force, 2007). Globalization is also contributing to an upswing in linguistic diversity, with nearly 20% of U.S. households using a primary language other than English (Rubaii-Barrett & Wise, 2007). In response to these trends, public management research needs to address how managers’ demographic characteristics, as well as the demographic composition of the network environment, affect public agency performance. Although the public management literature considers the effect of diversity on agency performance, it is generally framed in terms of representative bureaucracy (Andrews, Boyne, Meier, O’Toole, & Walker, 2005; Pitts, 2005, 2007). In other words, it considers how the presence or absence of manager–target population diversity affects public agency performance. The current study builds on these ideas and assesses whether public managers operate differently in networked settings on the basis of their race. It also considers whether the racial diversity of the target population is associated with public managers devoting a higher proportion of their time to networking activities.
School districts provide an excellent context in which to study public management within a networked environment. Although public education technically occurs within the walls of a school building, there are numerous external influences that contribute to students’ learning. Decades of research suggests that approximately 85% of the variation in student learning is affected by factors such as the home environment, parental influence, peer relationships, and neighborhood conditions (Goldhaber, Brewer, & Anderson, 1999; Madaus, Kellaghan, Rakow, & King, 1979; Marzano, 2000). Correspondingly, superintendents need to maintain open communications with internal and external groups connected to the school system in order to be truly effective (Friedkin & Slater, 1994; Morgan & Petersen, 2002; Petersen & Short, 2002).
Considering the public context of our school systems and the communication requirements for it to run well, the superintendents are in essence public managers and student learning can be considered the “output.” To maximize this output, the public manager must understand the emerging needs of the community. At a minimum, this entails meeting with a variety of individuals to give and receive information regarding the educational process in the district. Superintendents may need to meet with other superintendents to understand how they may have dealt with similar problems in other districts. Parent group meetings allow parents to express concern with aspects of district operation or encourage expansion of existing practices. These also afford superintendents the opportunity to communicate pressures facing the district and provide a platform for superintendents to ask for financial and social support for school programs.
Community business leaders are a less obvious, but a critical group that holds a stake in the community’s educational process. Business leaders have a vested concern in a strong educational system for a number of reasons. They may directly benefit because they have school-aged children, or they may be interested in the indirect benefits of an educated citizenry, such as increased safety and security in the community leading to higher property values. For the superintendents’ part, business leaders provide an important source of financial support to the school districts, though it may be limited to certain programs that they deem important.
State and federal education agencies also require communication with superintendents. These types of meetings are increasingly common as state and federal testing requirements become more time consuming, such as those imposed by No Child Left Behind. These multiple interactions indicate that superintendents are public managers who operate within a complex collaborative environment. There is an interdependence among government agencies, private companies, and other groups of informal stakeholders who have an interest in producing the highest level of a public good as possible.
As mentioned earlier, school districts, like all organizations feel the effects of globalization. As the demographics of their districts change so do the needs of their clientele. The changes create specialized challenges, both at the community and school district level. For example, in recent decades, the Latino/a population has been affected by extremely high secondary school drop-out rates (Fry, 2003). Scholarship links this high drop-out rate to cultural factors, such as the need to get a job and support the family financially (Perreira, Harris, & Lee, 2006), struggling to complete assignments because of language challenges (Glennie & Stearns, 2002), and social problems, such as depression, risky sexual behaviors, and teen pregnancy (Hamilton, Martin, & Ventura, 2007).
Dropouts not only affect the individual in terms of future earnings and quality of life but also affect the community in terms of having an educated, productive citizenry that contributes monetarily and socially to the community. The superintendent, as a public manager, has to decide to what extent she or he will collaborate with external groups to address this challenge that manifests within the school district. She or he will examine the environment and decide whether collaboration is a useful tool in understanding and addressing the nuances of the situation.
Literature Review
Network Management and Performance
Performance-related questions are common in the field of public administration, though the effect of networks on public management performance only began receiving significant attention by scholars in the 1990s. Provan and Milward’s (1995) investigation of four community mental health programs provides some of the salient early work relating public management networks and client outcomes. Using a measure of client satisfaction as the outcome of interest, the authors find a positive association between the level of centralization around a coordinating agency and client outcomes. Other structural network components are shown to affect performance, as well. The extent of collaboration, sometimes conceptualized as the number of interactions between intergovernmental and intersectoral actors, positively affects local economic development policy making (Agranoff & McGuire, 1999, 2003). Network stability itself, in terms of personnel turnover, also appears to have a positive association with performance (O’Toole & Meier, 2004b), whereas intergovernmental resource dependence moderates the relationship between network management and performance. The more concentrated districts’ funds in one source, the more important managerial networking and quality become (O’Toole & Meier, 2004b).
O’Toole and Meier contribute to the conversation linking networks to organizational performance by creating a more nuanced measure of network management that balances the public manager’s efforts to capitalize on the environment with his or her tendency to protect the organization from environmental shocks (O’Toole & Meier, 1999). Using unique data from 500+ school districts in Texas, the authors find that network management has a positive association with performance even when incorporating an autoregressive component that accounts for much of the variance in student performance.
However, this result is not uniformly positive; one of the strengths of the model is its adaptability to a nonlinear framework. Network management interacts with teacher salaries, class size, and certification, suggesting the importance of managers’ decisions about time allocations to constraints and resources (Meier & O’Toole, 2001). The relationship between network management and educational performance is especially strong at the highest and lowest quintiles of academic performance (Meier & O’Toole, 2003) and has differential effects on goals for marginalized students versus those for advantaged students (O’Toole & Meier, 2004a). Finally, Meier et al. (2006) show that differences in networking activities vary according to a managers’ gender, though these behavioral and quality indications do not follow clear, consistent trends.
Representation and Agency Performance
Globalization and the changing demographic composition of the workforce provide motivation for public administration scholars to understand the link between diversity and organizational performance. One line of research explores racial representation and organizational performance and stems from the theory of representative bureaucracy. The logic of the theory is intuitive—individuals with shared demographic characteristics (racial, gender, or otherwise) undergo similar social experiences that shape their values and beliefs systems (Krislov, 1974).
According to this theory, public administrators understand and relate to client groups that share their own characteristics and will act in ways that are beneficial to the group. Therefore, a bureaucracy that reflects a cross-section of the community will provide positive client outcomes for all subgroups in that community, not just the majority. Research generally supports the theory, and studies indicate that racial client–bureaucrat matches lead to positive outcomes directed toward minority racial groups in U.S. federal agencies (Hindera, 1993; Pitts, 2009; Selden, 1997) and U.S. public schools (Meier & Stewart, 1992; Pitts, 2005, 2007). However, representation does not automatically lead to uniformly positive outcomes for all groups; Andrews et al. (2005) indicate that representative bureaucracy negatively affects consumers’ perceptions of local government performance in the United Kingdom.
The research on representative bureaucracy assumes that nonwhite public administrators will use their position to advocate for minority client groups, and survey results tend to support this assumption. Black public administrators feel a responsibility to be strong advocates of community interests and encourage minority group participation in policy choices (Henderson, 1978; Murray et al., 1994). This is consistent with Herbert’s (1974) hypothesis that minority public administrators would become advocates for all minority groups, not only the group to which he or she belongs. Black public administrators are also more likely to be active in community organizations than are their white counterparts (Henderson, 1978). Bradbury and Kellough (2008) provided an important contribution to this discussion by explicitly testing whether minority public administrators (at the local level) hold views that are consistent with the minority community. Their survey and regression results confirm this previously untested assumption and provide further support that African American administrators support governmental programs and policies that target African American community.
Recently, scholars have expressed some hesitancy in ascribing all of the effects of representative bureaucracy to the public administrators’ own racial group. Sowa and Selden (2003) expanded on this work and indicate that racial representation in public agencies is not the most important predictor of minority client outcomes. Rather, the extent that public administrators view themselves as advocating for minority interests and the amount of discretion they perceive in their jobs have a stronger impact on policy outcomes representing minority interests. Other characteristics, such as education, gender, and political ideology, have also been shown to be positively correlated with policies affecting minority groups at both the federal (Selden, Brudney, & Kellough, 1998) and local levels (Bradbury & Kellough, 2008).
To date, the literature suggests that public administrators with certain demographic characteristics, and especially those who are racial minorities, try to meet the client needs of all underrepresented groups. Scholars have observed that public managers are also likely to accommodate minority client outcomes in a public networked setting where a single manager coordinates collaboration among multiple groups to achieve a common goal. The racial makeup of the client group, to a certain extent, will determine how much time the public manager will need to dedicate to networking activities.
A racially diverse clientele contains multiple subgroups, each with unique needs to be addressed. The public manager who is interested in promoting positive minority group outcomes will need to dedicate a certain portion of his or her time to understanding each group’s needs as they relate to the organization. Therefore, with a diverse clientele, a public manager will need to dedicate more time to understanding and collaborating with organizational and community groups (networking activities) to address these problems than when working with a less diverse clientele. In addition, if the public manager exhibits the same tendency as the general public administrator to advocate for minority client outcomes, then it should also hold that public managers from racial minority backgrounds will exhibit the strongest tendency to do so. Therefore, we posit the following two hypotheses:
Hypothesis 1: Public managers in network settings that serve a racially diverse clientele spend more time networking than those in network settings that serve a racially homogeneous client group.
Hypothesis 2: Minority public managers spend more time engaging in network activities when serving a diverse clientele than their white counterparts.
Diversity and Agency Performance
Another line of research links whether the presence of diversity within an organization contributes to organizational performance. The diversity research differs from the representation research because it considers how the presence of diversity affects an organization, rather than a demographic match between administrator and clientele. As noted in Wise and Tschirhart (2000) and Pitts and Jarry (2007) there is limited evidence on the effects of diversity on organizations, and the evidence is particularly sparse as it relates to public organizations.
Older, private sector literature indicates that increased diversity can augment the number of potential solutions to problems faced by the organization or institution (Watson, Kumar, & Michaelsen, 1993), as well as facilitate high-quality, collaborative decision-making processes. Racially diverse groups are also more productive while performing brainstorming tasks. Although homogeneous and diverse groups produce the same quantity of ideas, diverse groups produce higher-quality ideas (Cox, Lobel, & McLeod, 1991). These findings indicate that diversity encourages better decision making because employees are able to draw upon their diverse life experiences, education, and tenure to consider multiple approaches to problems.
Other studies have found that diversity can have a negative influence on organizations. When improperly managed, increased diversity within the workforce correlates with greater employee dissatisfaction and turnover (Jackson et al., 1991; Tsui, Egan, & O’Reilly, 1992) and lower levels of cohesiveness (O’Reilly, Caldwell, & Barnett, 1989; Pelled, Eisenhart, & Xin, 1999). Pitts and Jarry (2007) provided a more recent example of this negative association between workforce diversity and organizational performance from the public sector. The authors find that increases in the racial diversity of teaching staff correlates to lower student outcomes, such as standardized test performance and student drop-out rates.
Pitts and Jarry (2007) attributed their finding to a self-segregation effect that limits the amount of collaboration teachers engage in within the school walls; namely, teachers primarily consult with other teachers in their racial in-group for advice on curriculum, classroom management, and other challenges. This would suggest that minority teachers in a homogeneous school are limited in their ability to collaborate with their colleges, to the detriment of their students.
Research findings are somewhat inconclusive regarding diversity effects on organizational performance, but there are clear indications that managers and administrators alter their behaviors and manage minority employees differently than their white counterparts. An absence of effective diversity management can lead to unfavorable agency outputs. Managers, regardless of racial status, tend to give less favorable performance appraisals to nonwhite employees. This practice is documented in federal agencies (Lewis, 1997), the private sector (Greenhaus, Parasuraman, & Wormley, 1990; Lefkowitz, 1994), and among military and civilian groups (Sackett & DuBois, 1991; Stauffer & Buckley, 2005), even after controlling for differences in productivity.
Given the performance appraisal findings, it is not surprising that nonwhite racial status is also correlated with fewer promotional opportunities in both the public (Baldwin, 1996; Powell & Butterfield, 1997) and private sectors (Greenhaus et al., 1990). The disparate treatment may not occur directly at the highest levels of government promotion. Powell and Butterfield indicate that prior discriminatory treatment in professional development affects promotion to senior executive service positions within the federal government. Lefkowitz (1994) highlighted another example of mismanagement within diverse organizations, a term he coined, “ethnic drift.” As he explains, ethnic drift occurs when minority employees enter an organization and managers assign these employees to work under minority supervisors. Regardless of the managers’ intent, such practices result in a segregated working environment.
The preceding studies all evaluate diversity and management effects on the performance of a single agency. Although there is some evidence to the contrary, in the absence of effective diversity management research generally shows that diversity has a negative effect on a single agency’s performance. This effect is likely to hold true in a networked setting as well. Members within a network may have lower levels of trust because of limited contact or because they tend to test the responsiveness or commitment of other members to the network (Provan & Milward, 2001). A network setting provides many opportunities for misunderstanding and distrust based on racial differences that will lead to unfavorable network performance. This leads to the following hypothesis:
Hypothesis 3: Racially diverse networks have lower performance measures than more homogeneous networks.
Diversity and Management Strategy
The presence or absence of network diversity does not directly imply a management function. Public managers are important influences on network success (Agranoff & McGuire, 2003; Donahue et al., 2004; Meier & O’Toole, 2001), and one of the reasons they are so important is their role in selecting and/or maintaining the strategic stance of a network (Boyne, 2003). Organizations and networks differ in how aggressively they pursue innovations in processes, procedures, and collaborative activity to make improvements in their service delivery (Boyne & Walker, 2004; Miles & Snow, 1978).
Opportunistic public organizations and networks perform better than those that take fewer risks collaboratively and adopt innovations at a later date. Andrews et al. (2005) evaluated the performance of local English governments. They find that prospector governments, those that take a more aggressive strategic stance, perform better on measures of objective performance than governments that are more reactive to environmental forces or that maintain the status quo. Furthermore, they provide some evidence that the prospector stance may mitigate some of the negative client perceptions of representative government. A similar pattern exists in highly networked contexts, such as U.S. city management.
Agranoff and McGuire (2003) found that cities that utilize jurisdiction-based management (those that are opportunistic and have high levels of collaborative activity) are more successful on indicators of economic development. Furthermore, they report that poorer cities tend to pursue economic development collaboration more than wealthier cities do in their efforts to improve network performance. The importance of high levels of collaborative activity in achieving positive network performance, or allaying negative influences on performance, leads to the following hypothesis:
Hypothesis 4: Racially diverse networks have lower performance measures (Hypothesis 3), but these can be improved by an aggressive strategic stance.
Method
Using surveys given to superintendents from approximately 500 school districts in the state of Texas, we develop 2 models to answer the 3 previous questions posed about networking in diverse environments. The results of this research suggest that the racial diversity of a network influences the amount of time a public manager spends performing network activities. It suggests that the race of the public manger has no impact on the likelihood of networking in diverse environments. The results also indicate that network management, as defined by Meier and O’Toole (2001, 2003), can reduce the negative influences on outputs associated with management in racially diverse environments.
Sample
To carry out the empirical tests estimating the effect of network diversity on management behavior and organizational performance, the study uses unique data collected from superintendents in the state of Texas. Initially, all 1,039 superintendents in the state received a questionnaire designed to collect information on their management decision making and style. A 55% return rate over 5 years (1995-1999) produced a data set of 2,535 complete cases for study. The data used in this article also include information on district characteristics, including student pass rates on the Texas Assessment of Academic Skills (TAAS).
Models
Two models are used to test the four hypotheses. Model 1 is designed to inform Hypotheses 1 and 2, which look at the effects of diversity on the amount of time a public manager spends on his or her networking activities. The superintendent survey asks the respondents to think about how he or she allocates their time during a typical academic week between internal management of the district and external relations pertinent to the district. The dependent variable for Model 1 is the proportion of normal work hours he or she spends interacting with nondistrict employees, such as school board members, community leaders, state employees, and policy makers.

N is the proportion of time the superintendent spends networking outside of the organization; M is a measure of management networking developed by Meier and O’Toole; R is the race of the public manager; D is a measure of district diversity; O is a measure of program output or performance; X is a vector of forces in the district environment; ϵ is the error term; the subscripts for O, X, and ϵ denote time periods. 2
The dependent variable in this model measures the percentage of time a superintendent spends with people outside the school system. The networking management measure is a factor score developed from survey items measuring five contact points outside the school system (see Meier & O’Toole, 2003). This score measures the manager’s ability to take advantage of positive opportunities presented within the broader network, while protecting the school system from negative or disruptive influences.
The variables of interest in this model include measures of district diversity, the race of the superintendent, and an interaction between the two. Two different diversity variables are included in the models to look at different conceptualizations of diversity. The models measure heterogeneous diversity using Blau’s Index of variability 3 that ranges from 0 to 1. A score of 0 indicates that a school district is perfectly homogeneous, with all students from a single racial group. Values that are closer to 1 on this scale indicate a heterogeneous population in the district. 4
In this sample, a school district that had perfectly balanced numbers of students in six racial categories (white, African American, Latino/a, American Indian, Asian American, or another race not defined) would have a Blau Index score approaching 0.76, which is the highest possible index score for the six-category data. In this sample, the average Blau Index score for a school district is 0.35, with a minimum score of 0.02 (indicating a very homogeneous school district) and a maximum score of 0.75 (indicating a very heterogeneous school district). Separate models use a dichotomous variable that measures homogeneous diversity.
The second and third diversity variables are equal to 1 if the student population in the school district is more than 50% African American or more than 50% Latino/a. In all of the three different specifications, diversity is expected to have a positive influence in the amount of time spent networking, in general. Along this same line, it is expected that district diversity will influence minority superintendents in more diverse districts to spend a larger percentage of their time networking.
Several controls are added in the model to measure forces in the district environment expected to influence networking. One such force is school district performance. If a school district is performing well, superintendents may have less incentive to cultivate external networks. The opposite may also be true. If a school district is performing well, superintendents may need to spend less time managing the district and have more free time to develop networks. To measure performance, we include the percentage of students in the district that passed the state-required TAAS test during the previous school year. It is expected that this measure will have a positive relationship with the dependent variable. To further characterize the district environment, the model also contains a measure of school enrollment, two measures that capture the superintendent’s perception of community district support, the percentage of school funds coming from local and state sources, and a measure of district affluence. Because the data are pooled, all models include a set of indicator variables to control for unobserved trends over the 5-year period.
To test Hypothesis 3 and Hypothesis 4, we construct a model that is similar to the one employed by Meier and O’Toole (2003) that looks at the effects of networking activity on school district performance. The model to be tested is:

where O, D, M, and ϵ are defined as in Equation 1.
The dependent variable in the model is the percentage of students who pass the state-required TAAS exam. 5 The independent variables of interest are the three measures of district diversity (both heterogeneous and homogeneous) and the interaction between network management and district diversity. Hypotheses 3 and 4 are based on the research findings indicating that racial heterogeneity can create more stressful work environments. Therefore, it is expected that heterogeneous district diversity (measured by Blau’s Index) will have a direct negative influence on student pass rates, but the joint effect of district diversity and network management will alleviate this effect. Models that include homogeneous diversity measures (majority African American district and majority Latino/a district) are included to provide a counterfactual argument. The hypotheses are built on the assumption that majority–minority districts do not experience the same workplace stressors as more heterogeneous districts, so it is expected that the homogeneous diversity measures will not be statistically related to the district performance variable.
The environmental factors included in Equation 2 differ from those in Equation 1. The latter model contains a standard set of controls found in education production research. This research typically uses a measure of student academic achievement as the dependent variable (Greenwald, Hedges, & Laine, 1996). The vector of environmental variables to control for resources are average teacher salary (in thousands), average class size, teacher experience (in years), the number of noncertified teachers in the district, and the percentage of school funds acquired from the state. To account for diversity in the student body, the models include the percentage of black, Latino/a, and low-income students in the district. Like the previous model, dummy variables were included for individual years to deal with the time-series aspect of the data set.
Results
Table 1 shows the results for the models that test how district diversity affects the amount of time superintendents spend networking. The Model 1 in Table 1 indicates that heterogeneous district diversity (Blau’s Index) has a positive and statistically significant influence on the amount of time spent networking. The magnitude of the coefficient is also quite large. One standard deviation increase in heterogeneous school district diversity results in more than a 10% increase in time spent with individuals outside the school system. Such findings would suggest that, as Hypothesis 1 predicted, higher levels of heterogeneous school district diversity results in more time spent with nonschool personnel by superintendents.
Estimated Effects of District Diversity on the Amount of Time Spent Networking by a Public Manager (Superintendent)

Note: TAAS = Texas Assessment of Academic Skills. Standard errors in parenthesis.
p < .10. **p < .05. ***p < .01.
Models 2 and 3 test whether this result holds in districts with more homogeneous diversity, in other words, in districts where individuals from a single racial minority background account for the largest group of students. Model 2 tests for the effects of diversity in school districts where student population includes more than 50% African American (majority African American district) students, and Model 3 tests for the effects of diversity on time spent networking in school districts where the student population includes more than 50% Latino/a (majority Latino/a district). The models present mixed results for homogeneous diversity.
As expected, Model 2 indicates that large African American student populations are not associated with superintendents spending more time networking. This provides partial support for the hypothesis that only heterogeneous diversity is associated with the need to network in order to address diverse needs within the community. This support is qualified however, because Model 3 shows that superintendents in majority Latino/a school districts do spend more time on networking with individuals outside of the district itself. However, the magnitude of Blau’s Index (5.311) is nearly twice that of majority Latino/a district (2.769), indicating a larger effect size of heterogeneous diversity compared to homogeneous Latino/a diversity.
Though the results in Table 1 support Hypothesis 1 in two out of three diversity models, they do not generally support the relationship suggested by Hypothesis 2. To provide evidence for the hypothesis that minority public managers spend more time networking than white managers when serving a diverse clientele, the coefficient on the interaction term (Minority Superintendent × Diversity) should be positive and statistically significant at conventional levels in all three diversity models. The theory is that public managers who are racial minorities try to meet the client needs of all underrepresented groups and all three specifications of diversity correspond to underrepresented groups. In both the heterogeneous diversity model and in the majority Latino/a model, the interaction coefficient fails to reach statistical significance, and the sign is different, depending on the model. In the majority African American model however, the coefficient is positive, statistically significant, and large in magnitude.
To generalize, results in Table 1 suggest that heterogeneous district diversity affects the amount of time public managers spend on networking activities with individuals who are external to the organization. A similar relationship is suggested in organizations serving majority Latino/a school clients, but not in organizations serving majority African American clients. Only one out of the three models suggests a joint relationship between the superintendent’s racial background and organizational diversity. The Model 2 results indicate that minority managers devote more time to networking than white public managers do when the client group in question is majority African American.
The findings for Model 2 can be found in Table 2. Each column in the table represents a regression model with the district’s average TASS pass rate as the dependent variable. Column 1 presents the results for the entire sample. Although the coefficient on the heterogeneous diversity variable is negative, as predicted, it is statistically insignificant. The model does not provide evidence to conclude that school district performance suffers overall as a result of increased heterogeneous student diversity.
Estimated Effects of Heterogeneous District Diversity on Student Pass Rates, by Student Subgroup
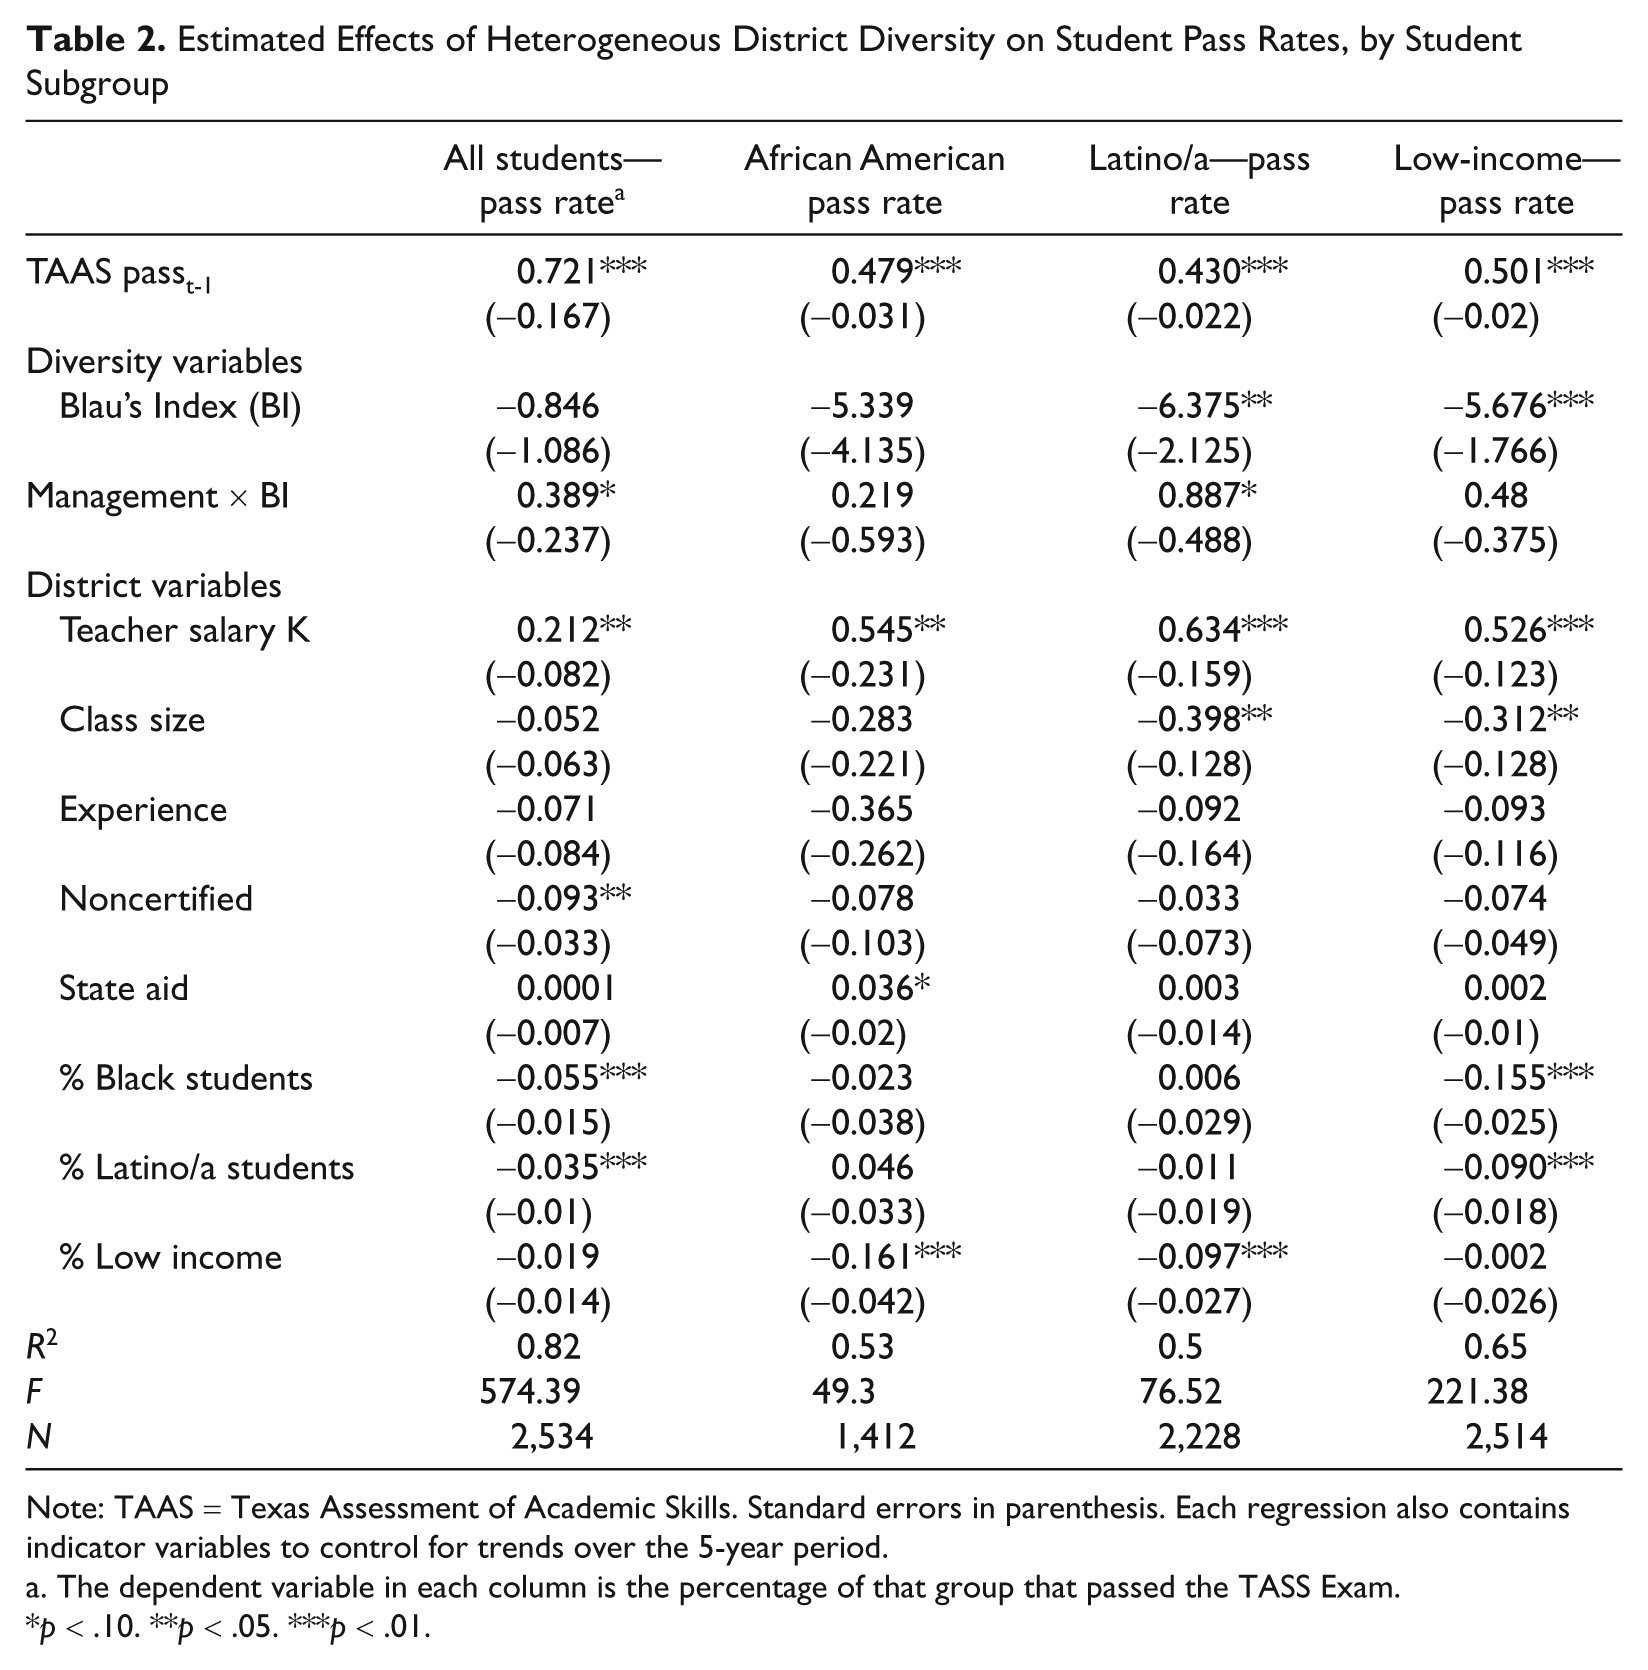
Note: TAAS = Texas Assessment of Academic Skills. Standard errors in parenthesis. Each regression also contains indicator variables to control for trends over the 5-year period.
The dependent variable in each column is the percentage of that group that passed the TASS Exam.
p < .10. **p < .05. ***p < .01.
However, it is plausible that there are heterogeneous treatment effects of network management on different student groups. Table 2 indicates that the district’s TAAS pass rate decreases as a school district’s percentage of Latino/a, black, and low-income students increases. Since the diversity coefficient in the full sample is not statistically significant, this suggests that there may be opposing effects for different types of students. The sample is split into three subgroups to determine whether network management influences outputs within subgroups of students differently—black, Latino/a, and low income. These additional results are listed in Columns 2 to 4 in Table 2.
Columns 3 and 4 suggest that heterogeneous district diversity has a negative and statistically significant influence on the TAAS pass rates for Latino/a and low-income students but does not statistically affect African American student pass rates. Though the Blau’s Index coefficient in the African American test scores sample is in the predicted direction, it is not statistically significant. One explanation for the lack of findings among this group is the smaller number of observations used for this model. As indicated in the summary statistics in Appendix 2, only 1,568 of the 2,535 districts reported having African American students attending their districts.
However, Hypothesis 3 predicts that racially heterogeneous districts will have lower performance measures than racially homogeneous districts. Table 2 does not fully address the hypothesis because it does not provide a complete set of results concerning other forms of racial homogeneity, such as majority African American and majority Latino/a districts. Table 3 presents an abbreviated set of results for all three models that measure the effects of diversity (heterogeneous and homogeneous) on student pass rates.
Estimated Effects of Homogeneous Diversity on the Student Pass Rates, by Student Subgroup

Note: TAAS = Texas Assessment of Academic Skills.
p < .10. **p < .05.
Row 1 in Table 3 reproduces the heterogeneous diversity results from Table 2, whereas Rows 2 and 3 present the homogeneous diversity specifications. As in the previous table, the columns represent the TASS pass rates for all students, African American students, and Latino/a students. The results of Table 3 neither refute nor confirm the predictions made in Hypothesis 3.
In Column 1 where the dependent variable is all students—pass rate, the hypothesis that heterogeneous organizations have lower performance output than homogeneous organizations is refuted. The only statistically significant relationship between diversity and overall student pass rates occurs in the majority African American district specification. Since Blau’s Index and majority Latino/a district fail to reach statistical significance, there is not strong support for the claim that homogeneous districts perform better or worse than heterogeneous districts, when looking at all students’ pass rates.
Column 2 presents results for African American pass rates. As explained earlier, there is no relationship between heterogeneous district diversity and African American pass rates. However, there are statistically significant results for the measures of homogeneous district diversity. Majority African American districts have a positive influence on African American pass rates, whereas majority Latino/a districts have a negative influence on African American pass rates. It is possible that stakeholders (parents, teachers, community groups) in schools that have a majority of racial minority students guide financial resources in ways that positively affect students’ needs in the dominant racial group and neglect students’ needs in the minority racial group. However, this explanation does not hold in Column 3, which uses Latino/a student pass rates as the dependent variable. There is no statistical evidence that homogeneous district diversity has any effect on Latino/a pass rates.
Finally, Hypothesis 4 predicts that the negative effects of heterogeneous district diversity can be alleviated by an aggressive strategic management stance. To test Hypothesis 4, the models include an interaction term between the network management variable and the relevant district diversity variables. The positive, statistically significant coefficient on the Management × Diversity variable provides strong support for this hypothesis.
Despite interesting results of homogeneous district diversity on student performance, none of the interaction terms is significant in these models. We only see evidence of a joint relationship between network management and diversity in the heterogeneous specification, with full results listed in Table 2. Since the Latino/a and low-income student subgroups are the only two groups to indicate a negative influence of student body diversity, the results discussion focuses on these students. Columns 3 and 4 indicate that the joint relationship between district diversity and network management does in fact have a positive and statistically significant influence on the TAAS pass rate for Latino/a and low-income students.
Though the coefficients are not large enough to overcome all of the negative effects of increased diversity on Latino/a and low-income test scores, network management does reduce its magnitude. Figures 1 and 2 present a visual representation of this trend.
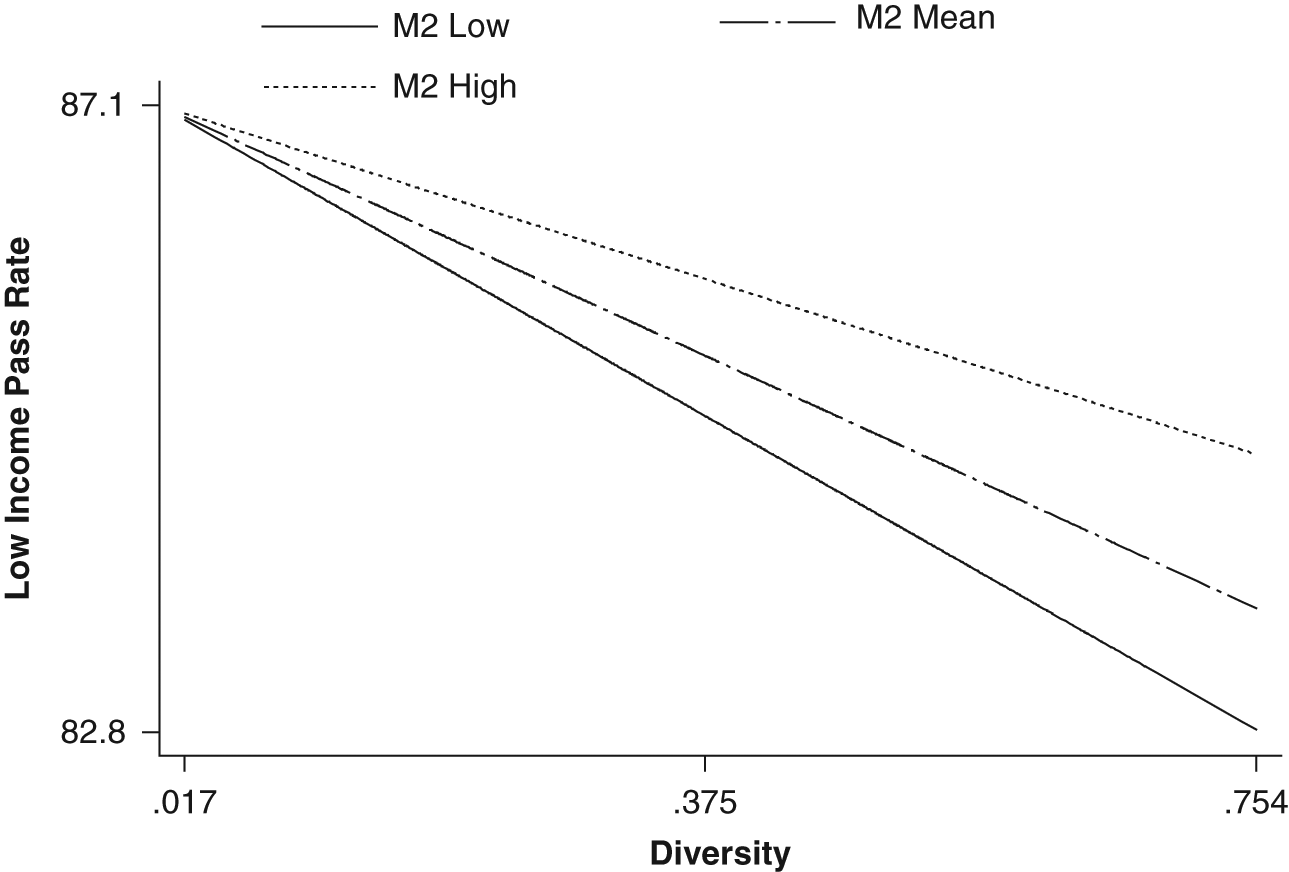
Low-income pass rate and diversity by level of networking (time spent networking with external stakeholders)

Latino/a Pass Rate and Diversity by Level of Networking Activity (Time Spent Networking with External Stakeholders)
In Figure 1, the Y axis represents the pass rate of low-income students and the X axis represents district diversity. The three lines represent the influence of time spent per week networking with external stakeholders (M) on the negative slope at its lowest (0.006), its mean (2.3), and its highest (5.2) levels. As M moves from low to high the slope representing diversity’s negative influence on pass rates become flatter, resulting in higher pass rates. Figure 2 shows M has an even greater effect on Latino/a test scores. When network management is at its highest level the negative slope almost flattens entirely.
Conclusion
Collaborative managerial arrangements are common in public sector organizations and their positive effects on agency outputs are becoming increasingly apparent. However, much less is understood about the importance of public managers in these collaborative settings, though a few noteworthy studies note their importance in city management (Agranoff & McGuire, 2003), health and human services (Provan & Milward, 1995), public education (Meier & O’Toole, 2001), and human resources management and debt administration in state governments (Donahue et al., 2004).
This article contributes to the growing literature that seeks to determine the conditions under which public managers’ collaborative behaviors matter for organizational and network performance. In this article we focus on the impact of a specific client characteristic, racial diversity, to understand whether this has an impact on both the amount of networking a public manager completes and whether this activity can improve network performance. We also explore the possibility that the racial background of the public manger influences how much networking he or she engages in and whether this interacts with the diversity of the client group.
We estimate a series of regression models using the time a superintendent dedicates to external networking activities per week and district pass rates as dependent variables. We find that heterogeneous district diversity is associated with superintendents dedicating a higher proportion of their time each week to networking with external contacts, such as school board members, community leaders, state employees, and policy makers.
We find a similar result, albeit with a smaller effect size, in majority-Latino/a districts. An explanation for this finding may concern the characteristics of the Latino/a students. If first generation Latino/a students are driving the result in both the homogeneous and heterogeneous diversity specifications, then English-language acquisition needs (or a similar need that is equally costly and controversial to address) may force superintendents to go outside of the district to try and garner additional resources to address this need. This would be in line with Agranoff and McGuire’s (2003) finding that city managers in poorer cities tend to collaborate more often than city managers do in more affluent cities. Conversely, this finding may be an artifact of a more established Latino population. There is a strong Latino/a middle class in Texas (Clark, 2001), and it is likely that Latino/a institutions and businesses are more dominant and influential than those of African Americans. However, the nature of these data does not allow us to explore this question in such detail. Therefore, an important area of future study could be dedicated to understanding why Latino/a populations drive superintendents to network more outside of the school district.
An additional key finding from the study indicates that superintendents, as public managers, play an important role in mitigating the negative effects of heterogeneous diversity on Latino/a and low-income student outcomes. The findings imply that one action superintendents in diverse districts can take to improve pass rates for these two groups of students is to increase the amount of time spent interacting with external stakeholders. This result is consistent with Miles and Snow (1978) and Boyne and Walker (2004) who find that networks that more aggressively pursue collaborative activity see improvements in their service delivery. However, it is unclear why this trend is evident only when considering Latino/a and low-income pass rates. As mentioned earlier, future studies should incorporate more nuanced measures of client characteristics to determine whether there is something specific about each group’s needs that drives the relationship between diversity and management.
Though the results in this article provide important information about the role of two different specifications of diversity on public networking activity, our results are not without their limitations. Although our network results are consistent with some of those found in other public contexts, including city management, human resources management, and debt administration in state governments, it is possible that the educational context is distinct from other public venues. This implies some caution when generalizing from our networking results.
In addition, as discussed in Note 4, we make the assumption that the racial makeup of the district reflects that of the superintendent’s network. The findings in Table 1 appear to support this assumption; however, demographic information on the external network contacts will allow scholars to arrive at a more thorough understanding of how this process works. Are public managers collaborating with a group of external contacts (community members, parent groups, business leaders) who are similar in racial composition, as the theory suggests? If this is the case, then they are likely articulating a set of concerns and solutions intended to support and advocate for their own in-group. If this is not the case, and the external network does not reflect the demographic composition of the districts’ students, then it is possible that the network contacts could result in a series of concerns and solutions that may not be in the best interest of the students and could in fact be counterproductive to network output measures. In other words, a non-Latino/a external network may have ideas about how the superintendent could improve Latino/a student test scores. But without direct knowledge of Latino/a student needs, their suggestions could potentially hurt these students’ educational outcomes.
A second question remaining to be answered is the content discussed during the external networking meetings. As district diversity increases, are superintendents meeting with external stakeholders to discuss specific concerns and action plans, or are these meetings unrelated to client group concerns? We do find some evidence that high proportions of time devoted to external networking positively affect student pass rates, so this suggests that at least some of the content of these meetings is devoted to addressing diverse groups’ concerns. However, without more information about the type of contacts made in diverse environments our understanding of superintendent behavior is limited. In the future, research could benefit greatly from surveying both public managers and the contacts that make up their networks.
Footnotes
The author(s) declared no potential conflicts of interests with respect to the authorship and/or publication of this article.
The author(s) received no financial support for the research and/or authorship of this article.