
Abstract
For passive representation to translate into active representation, bureaucrats must have discretion. Despite its importance to representative bureaucracy theory, though, discretion has received little empirical attention in public administration. We seek to address this shortcoming by examining the determinants of bureaucratic discretion, paying particular attention to how the demographic characteristics of clients and bureaucrats interact to influence the amount of discretion that individual bureaucrats possess. Specifically, we examine whether the amount of discretion that minority bureaucrats have is positively related to the percentage of an organization’s clients who are from the same minority group. We argue that there are three reasons to expect a positive relationship: client demand, managerial deference to bureaucratic expertise, and bureaucratic appropriation. Our findings suggest that a positive relationship exists for African American bureaucrats, but not for Hispanic bureaucrats.
According to the theory of representative bureaucracy, a public workforce that is demographically representative of the clients it serves will produce policy outputs that are beneficial to those clients (Dolan & Rosenbloom, 2003). More specifically, the theory suggests that “passive representation” will lead to “active representation” given the satisfaction of certain enabling conditions (Keiser, 2010; Keiser et al., 2002). Principal among these conditions is that bureaucrats have sufficient discretion to act on behalf of clients with whom they share salient demographic characteristics. Despite its importance to the theory of representative bureaucracy, though, bureaucratic discretion has received little empirical attention from public administration scholars. We seek to address this shortcoming by examining the determinants of bureaucratic discretion, paying particular attention to how the demographic characteristics of clients and bureaucrats interact to influence the amount of discretion that individual bureaucrats possess.
This study is interested in two hallmark components of representative bureaucracy theory—race and discretion. It is not a study of representative bureaucracy theory in the typical mold, though. Many representative bureaucracy studies test for a race-based relationship between passive representation and active representation, treating discretion as a given. We do not treat discretion as a given; instead, we examine whether it is related to the race of individual bureaucrats and to the race of the clients who those bureaucrats serve. Though ours is not a typical representative bureaucracy study, we are interested in whether discretion varies with the race of bureaucrats and clients precisely because discretion is such an important element of representative bureaucracy theory. It not only makes active representation possible in the first place but also makes the link between passive representation and active representation more robust (Meier & Bohte, 2001; Riccucci & Meyers, 2004; Sowa & Selden, 2003).
The empirical question we are interested in is the following: Is the amount of discretion held by minority bureaucrats positively related to the percentage of a public organization’s service recipients who are also minorities? There are three reasons to expect this will be the case: (a) client demand, (b) managerial deference to bureaucratic expertise, and (c) bureaucratic appropriation. Each of these can be thought of as a distinct theoretical mechanism that links client demographics to discretion for minority bureaucrats. Client demand refers to the idea that a bureaucracy’s minority service recipients will lobby for minority bureaucrats to have more discretion since this discretion will allow minority bureaucrats to better serve minority clients. Managerial deference to bureaucratic expertise refers to the idea that public managers recognize minority bureaucrats’ unique capacities for relating to minority clients and, recognizing these capacities, grant minority bureaucrats the latitude to act on them. Finally, bureaucratic appropriation refers to the idea that minority bureaucrats will feel empowered to claim more discretion for themselves when they serve client populations that are heavily minority.
Below, we begin with a summary of representative bureaucracy theory and a discussion of how our study aims to advance the theory. We then explicate the three theoretical mechanisms mentioned above. Next, we describe our data, model, and method. We note here that our study is set in the public education context, and so our specific empirical question is whether the amount of discretion held by minority public school teachers is positively related to the percentage of a school’s students who are minorities. For a few reasons—the open and democratic nature of public schools chief among them—public education is a useful setting for our study. After describing our data, model, and method, we present our results. We close the article with a discussion of how our results advance representative bureaucracy theory and of what they might tell us about the management of public organizations.
The Theory of Representative Bureaucracy
Public administration scholars have long recognized that the existence of bureaucratic discretion poses a problem for democratic governance (Finer, 1941; Friedrich, 1940). Because bureaucrats are unelected, citizens cannot, via elections, hold them directly accountable for the decisions they make. Given that these decisions affect the distribution of public policy outputs to citizens, this is a problem with potentially serious consequences. The theory of representative bureaucracy “solves” this normative problem by treating discretion as a positive rather than a negative. In short, the theory suggests that a bureaucracy employing a cross-section of individuals who “look like” the population as a whole will make decisions that represent the will of the people. Underlying this logic is the assumption that individuals from similar demographic backgrounds will tend to share the same values and attitudes and will, consequently, tend to make similar decisions (Meier, 1975).
In addition to being an important normative component of representative bureaucracy theory, discretion is also a crucial instrumental component of the theory. For passive representation to translate into active representation, minority bureaucrats must have sufficient discretion to act on behalf of minority clients. Moreover, as noted in our introduction, studies suggest that the link between active and passive representation becomes stronger as discretion increases (Meier & Bohte, 2001; Riccucci & Meyers, 2004; Sowa & Selden, 2003). But as we have already pointed out, bureaucratic discretion and its determinants have received little empirical attention within the representative bureaucracy literature. The figure that appears below illustrates the usual focus of empirical representative bureaucracy studies while also illustrating the novel focus of our study.
The bottommost arrow in the figure—the right-facing arrow pointing from the passive representation box to the active representation box—has been the focal point of many representative bureaucracy studies. Usually, these studies regress an outcome measure (e.g., % of a school’s female students who perform satisfactorily on a standardized math test) on a measure of passive representation (e.g., % of a school’s teachers who are female; see, for example, Keiser et al., 2002; Pitts, 2007; Smith & Fernandez, 2010; Wilkins & Keiser, 2006). A significant positive coefficient for the passive representation variable is usually taken as evidence for the operation of active representation. 1 Studies of this type have done much to advance our knowledge concerning where, when, and for whom passive representation is likely to translate into active representation.
In contrast to studies of this type, our study focuses on the arrows contained in the top half of Figure 1. The key object in this portion of the figure is the downward-facing arrow that points from the bureaucrat’s race box to the right-facing arrow that represents the relationship between client demographics and discretion. This downward-facing arrow indicates that the relationship between client demographics and an individual bureaucrat’s discretion depends on the race of the bureaucrat. It is useful to think about the top portion of the figure as portraying an interaction between a bureaucrat’s race and client demographics; indeed, the focus of our empirical analysis will be on a group of Bureaucrat Race × Client Demographics interaction terms.

The Relationship between client demographics and bureaucratic discretion.
Ultimately, we are interested in the top portion of this figure because of its connection to the bottom portion of the figure. The downward-facing arrow pointing from the top portion’s discretion box to the bottom portion’s right-facing arrow illustrates that discretion enables the relationship between passive representation and active representation. Despite this connection, representative bureaucracy studies have tended to treat discretion as a given—or, in methodological terms, as exogenous. But discretion is not a given; it is manipulable. It varies across organizations and across individual bureaucrats, and this variation has important implications for representative bureaucracy, both in theory and in practice. One of these implications, as we will discuss below, is that a bureaucracy’s clients and personnel might consciously do things to make the link between passive representation and active representation stronger.
Bureaucratic Discretion and Minority Bureaucrats in the Context of Public Schools
Inevitably, public sector employees will have at least some discretion. Laws, statutes, and organizational rules cannot anticipate every decision situation that bureaucrats will encounter in the course of doing their work, and so bureaucrats will retain some measure of individual control over workplace decision making. Public school teachers in particular will retain a great deal of discretion since their jobs are fraught with novelty, ambiguity, and unpredictability (Lipsky, 1980; Maynard-Moody & Musheno, 2003; Prottas 1978). This—teachers’ possession of considerable discretion—in combination with the democratically and organizationally open nature of schools, makes public education a good setting for research on whether client demographics are associated with bureaucratic discretion.
A good deal of recent representative bureaucracy research is set in public schools (e.g., Grissom et al., 2009; Grissom & Keiser, 2011; Nicholson-Crotty et al., 2011; Pitts 2005, 2007). One advantage of using schools as a setting for representative bureaucracy research—or any public administration research, for that matter—is that schools are the most common type of public organization in the United States (Meier & Bohte, 2001). Consequently, when we learn something about public schools, we learn something that generalizes to an extremely large class of public organizations. Another advantage (one that is specific to our study) is that we are seeking to extend the theory of representative bureaucracy in a new way. Since the theory already has a firm foundation in the education setting, it seems reasonable to us to first explore whether the theory might be extended in this same setting rather than to venture into a less established domain. Finally, and perhaps most importantly, the public education setting is appropriate because schools are “open systems” organizations that are subject to the democratically legitimate demands of internal and external actors, such as parents, teachers, citizens, and politicians (Chubb & Moe, 1990; Meier et al., 2000; Weick, 1976). Put differently, they are open systems whose internal and external environments are highly politicized. The open, political nature of schools is important to our study because the theoretical mechanisms we describe below assume that internal and external actors can and do make demands about what schools do and how they do it.
Below, we describe the three theoretical mechanisms that link client demographics to minority bureaucrats’ discretion: client demand, managerial deference to bureaucratic expertise, and bureaucratic appropriation. Each of these three mechanisms should be thought of as a potential linking process. An observed relationship between client demographics and minority bureaucrats’ discretion might operate through any or all of these mechanisms; in the present study, we cannot identify their individual contributions to any observed relationship. Before we proceed, it is important to note that the focus of our analysis will be on African American and Hispanic teachers. When we use the word minority below, we are referring to these two minority groups unless otherwise indicated.
Client Demand
In the public education context, client demand refers to the idea that a bureaucracy’s minority students and their parents will lobby for minority teachers to have more discretion since this discretion will allow minority teachers to better serve minority students. Our expectation is that as the percentage of a school’s students who are minorities increases, lobbying for minority teacher discretion will increase. In other words, minority parent demand will be directly proportional to minority students’ (or parents’) prevalence in the school’s client population. There are a couple of assumptions built into this causal mechanism, each of which requires justification. The first is that a channel for minority parent demands exists. The justification for this assumption is mainly theoretical, and was noted above: Public schools are typically classified as open systems by organization theorists and education sociologists (Ballantine & Hammack, 2012; Hanson, 1996). The primary implication of public schools’ status as open systems organizations is that they are subject to forces in their external environments. Public schools are political institutions, and so these forces include the demands pressed on them by interested political actors, including parents (Chubb & Moe, 1988; Cutler, 2000; Meier et al., 2000). Since public schools are democratic political institutions, they are expected to attend to these demands, which are normatively legitimate.
While the preceding justification is theoretical, Chubb and Moe (1990) have shown empirically that public schools are subject to external demands from parents and other interested groups to a much greater degree than are private schools. Moreover, a great deal of research in the education literature indicates that parents are intensely involved in the governance of their children’s schools (e.g., Booth & Dunn, 1996; Cutler, 2000; Epstein & Salinas, 2004), sometimes to such a degree that teachers and principals perceive their involvement to be intrusive (Addi-Raccah & Arviv-Elyashiv, 2008). And so, it seems reasonable to conclude that parents are able to, and in fact do, press demands on their children’s schools. The key question is whether these include demands made by minority parents that minority teachers be given more discretion. 2 Our assumption is that they do.
We are not aware of any research that would allow us to directly substantiate this assumption; that is, research showing that minority parents actually do make demands for more minority teacher discretion. Nevertheless, research does suggest that minority parents are actively engaged in their children’s schooling. More basically, this research indicates that minority parents are keenly concerned about what goes on at their children’s schools. Chavkin and Williams (1993) surveyed 1,188 African American and Hispanic parents about their level of interest in 14 areas of school decision making. At least 75% of surveyed parents were highly interested in the following areas: amount of homework assigned, classroom discipline, student evaluation, setting school behavior rules, and setting school rules for grading and passing children. (We note these specific decision-making areas because they are captured in our measure of teacher discretion). Moreover, 70% of surveyed parents were highly interested in textbook selection. Similarly, Ritter et al. (1993) showed that African American and Hispanic parents are highly involved in the areas of course selection and scheduling, and are well-attuned to the amount of homework assigned to their children. More recently, a number of studies have indicated that Hispanic parents are deeply concerned with the academic progress of their children, though it is important to note that their involvement with their children’s’ schools tends to be informal (e.g., helping with homework and talking about the school day’s events vs. attending PTA meetings; Behnke et al., 2004; De Gaetano, 2007; LeFevre & Shaw, 2012). While findings like these do not directly substantiate the assumption that minority parents use open channels to make demands about minority teacher discretion, they do suggest that minority parents are actively engaged in their children’s educations and are well-attuned to the happenings at their schools. It is plausible to think that engaged, attentive parents would be inclined to intervene on their children’s behalf by making demands about teacher discretion if they believed that doing so would benefit their children.
Studies in the representative bureaucracy literature lend some additional indirect support to our assumption that minority parents will make demands for more minority teacher discretion. These studies all suggest that a bureaucracy’s minority clients value minority bureaucratic representation. Thielemann and Stewart (1996), for instance, show that large majorities of Black and Hispanic persons living with AIDS (PLWAs) care whether the staffs of HIV service delivery agencies include members of their ethnic group. Moreover, they show that significantly larger percentages of Black and Hispanic PLWAs (relative to White PLWAs) are concerned about whether an agency’s director is from their ethnic group. Recent qualitative research by Watkins-Hayes (2011) provides additional support for the proposition that minority clients value minority bureaucratic representation. Watkins-Hayes (2011), who conducted interviews with 20 minority (Black and Latino) welfare clients in Massachusetts to explore the role of race in the client–caseworker relationship, notes that a
small but important group of clients hoped that a connection with caseworkers from their racial groups would translate into a sympathetic ear (and hand) when it came to service delivery and, in an often-used phrase, “an understanding of where I’m coming from.” (p. i242)
Bradbury and Kellough (2008) surveyed African American and White citizens in the city of Athens, GA, about the importance of African American representation in local administrative organizations. African American citizens, to a much greater degree than White citizens, believed that African Americans should be given access to positions in local administration and be encouraged to use those positions to advocate for African American citizens. While these findings do not directly show that a bureaucracy’s minority clients will make demands about minority bureaucrats’ discretion, they do indicate that minority clients place a premium on minority representation. That minority clients value minority bureaucratic representation suggests that it would be plausible for them to want minority bureaucrats to have the discretion necessary to better serve their interests.
Related to the studies described above, a small but growing body of representative bureaucracy research is concerned explicitly with symbolic representation, or the idea that minority bureaucratic representation legitimizes a bureaucracy’s actions in the eyes of minority clients. In other words,
members of different groups may feel better about public agencies simply because they believe that people who share their demographic characteristics will share their policy views, will be responsive to them, will not discriminate against them, and/or will act in their interest. (Keiser, 2010, p. 1206)
Research shows, for instance, that minority citizens perceive traffic stops to be more legitimate when the police officer making the stop is also a minority (Theobald & Haider-Markel, 2006). Similarly, female victims of sexual assault are more likely to file a formal report when their local police station has a high proportion of female officers on staff (Meier & Nicholson-Crotty, 2006). Again, these findings are not direct evidence that a bureaucracy’s minority (or female) clients explicitly demand that minority bureaucrats be given more discretion, but they do help build the case that minority clients want to be represented within the bureaucracy by individuals who share their race. As Theobald and Haider-Markel (2009) sum up in their own study of symbolic representation, “for population sub-groups, such as racial and ethnic minorities, real value is placed on having members of the group in elected or nonelected [emphasis added] positions in government” (p. 411).
Before moving to the second of our three causal mechanisms, we want to make two important points, both of which have implications for our empirical analysis. As noted at the outset of this section, our expectation is that minority parent demand for minority teacher discretion will be directly proportional to the prevalence of minority students in a school’s total student population. By extension, we expect to observe a linear relationship between our client demographic variables (e.g., % African American students) and minority teacher discretion. Our first point is that the expectation of a linear relationship should be considered a baseline, against which other expectations can be compared. A plausible alternative expectation is that the relationship between client demographics and minority teacher discretion hinges on the presence of a critical mass of minority students. In this view, client demographics have no effect on minority teacher discretion up to a certain point, but once that point is reached, an effect manifests.
The theoretical notion of a critical mass is a familiar one in the representative bureaucracy literature, where the expectation is that passive representation translates into active representation only when minority bureaucrats constitute a nontrivial percentage of a bureaucracy’s total workforce (see, for example, Keiser, 2010). Traditional representative bureaucracy studies have not yet identified the causal mechanisms that underpin this process, but a plausible argument is simply that minorities (whether they are elected or nonelected officials) become more assured of their actions and more likely to win over others once their numbers reach some threshold. Mansbridge (1999) makes this argument thus:
representatives of minority groups may need a critical mass for their own members to become willing to enunciate minority positions. They may also need a critical mass to convince others—particularly members of dominant groups—that the perspectives or insights they are advancing are widely shared, genuinely felt, and deeply held within their own group. (p. 636)
We believe that this reasoning applies in the context of our study. Once minority parents constitute a significant share of a school’s total parent population, it is reasonable to expect that they will be more likely to air demands—including demands about minority teacher discretion. Moreover, once these demands accumulate to a considerable threshold, it becomes much more likely that they will be heard.
Evidence suggests that the application of this reasoning in our study is warranted. Kerbow and Bernhardt (1993) find, for instance, that African American and Hispanic parent involvement in Parent–Teacher Organizations (PTOs) is greater in schools with high concentrations of African American and Hispanic students. Once members of these parent subgroups constitute a considerable share of a school’s total parent population, it appears that they become more comfortable formally participating in school governance. Weiher (2000) also offers evidence that speaks to our argument. Specifically, he shows that growth in the proportion of a school district’s total students who are Hispanic begins to have a positive impact on Hispanic student performance once Hispanic students reach critical mass. Conversely, decline in the proportion of a district’s total students who are African American has a negative impact on African American student performance only when African American students lose critical mass. These findings are relevant to our argument about parent demand for the underlying political dynamics they hint at. As Weiher (2000) notes,
Districts adjust their focus to address the needs of Hispanic students when Hispanics become a politically potent constituency. Furthermore, the fact that decreases in proportions of Black students in districts that are not heavily Black depress the performance of these students suggests that Blacks may be passing the same political threshold in the opposite direction. As proportions of African-American students in school districts decline, the districts become less attentive to them. (p. 894)
In the same way, it could be the case that minority parent demands for minority teacher discretion become politically efficacious once minority parents attain critical mass and cease to be efficacious once critical mass is lost.
The second point we want to make concerns how parents’ involvement in their children’s schools tends to change as their children get older. A good deal of evidence indicates that parent involvement is considerably higher at lower grade levels and that it is particularly high at the elementary school level (e.g., Greenwood & Hickman, 1991; Herrold & O’Donnell, 2008; Izzo et al. 1999). We call attention to this evidence because our client demand mechanism rests on the assumption that minority parents make demands about minority teacher discretion. While we cannot directly test this assumption in the current study, the relationship between parent involvement and school level noted above suggests that the parent demand causal mechanism is more likely to operate at lower grade levels than higher grade levels. If parents are more involved in their children’s schools at lower grade levels, it is reasonable to think that they will have a greater number of formal and informal interactions with school officials at these lower grade levels and that they will be more inclined—and have more opportunities—to make demands that are relevant to their children’s schooling. Consequently, we expect to observe a stronger relationship between client demographics and minority teacher discretion at lower grade levels than at higher grade levels. If such a relationship does exist in our data, it would make the client demand mechanism more plausible.
Managerial Deference to Expertise
In the context of our study, managerial deference to bureaucratic expertise refers to the idea that public school principals recognize minority teachers’ unique capacities for relating to and instructing minority students and, recognizing these capacities, grant minority teachers the latitude to act on them. For our purposes, then, “expertise” includes the special relational abilities that minority teachers possess vis-à-vis minority students, in addition to any unique technical skills they enjoy. 3 As with our client demand mechanism, a few key assumptions are built into the managerial deference mechanism. One assumption is that minority teachers actually do possess expertise vis-à-vis minority students. A second assumption is that principals will permit minority teachers the discretion to deploy that expertise.
The assumption that minority teachers are uniquely capable in the instruction of minority students is common in the representative bureaucracy literature (e.g., Meier et al., 1991, 1999; Meier & Bohte, 2001). Meier and Bohte (2001) note, for instance, that “minority teachers might well have additional insight into how to motivate and teach minority students” (p. 459). Similarly, Meier et al. (1999) point out that “minority teachers are more effective at teaching minority students” (p. 1030). Research bearing on this claim suggests that minority teachers are indeed specially equipped to instruct minority students. Much of this research, which focuses on the relational component of expertise, shows that minority teachers’ interactions with and perceptions of minority students are more positive than those of their White colleagues (Aaron & Powell, 1982; Cole, 1986; Dee, 2005; Irvine, 1990; Ladson-Billings, 1994; Lipman, 1995; Moore & Johnson, 1983). Recently, Dee (2004) has shown that Black elementary school students 4 who are randomly assigned to Black teachers tend to perform better on standardized math and reading tests than Black students who are randomly assigned to non-Black teachers. While the causal mechanisms underlying this finding are not clear—whether relational or technical expertise (or some other factor) is at work is not demonstrated—the key takeaway is that Black students do in fact do better under Black teachers than White teachers.
The justification for our second assumption—namely, that principals will grant minority teachers the leeway to capitalize on their expertise—is primarily theoretical. Public managers are held accountable for the performance of their organizations (Lipsky, 1980). Like any manager in any industry, public managers must rely on their employees to work diligently in pursuit of organizational goals (Brehm & Gates, 1997; Riccucci & Meyers, 2004). Oftentimes, a public manager’s employees may possess expertise that the manager lacks. When this is the case, it is in the manager’s interest to defer to the employees’ expertise (Lipsky, 1980, pp. 24-25). Consider, for instance, a manager at NASA, a federal agency whose work is of a highly technical nature. If this manager presides over a group of employees who have expertise in different areas of rocket design, it is unlikely that she—even if an expert herself—will be knowledgeable in all of these areas. Consequently, the manager will have to cede decision-making authority to her employees if she wants a well-designed rocket. As Romzek and Dubnick (1987) emphasize in their landmark case study of accountability at NASA, deference characterizes the relationship between managers and employees in highly technical agencies like NASA (p. 229).
Schools are not as highly technical as NASA, but their employees often do possess expertise that managers (principals, vice-principals, school district officials) lack. This is especially true at higher grade levels, where subject matter can be quite specialized (e.g., physics, calculus, chemistry; Busher & Harris, 1999). When a public school teacher has subject matter expertise that his principal does not, it is reasonable to expect that the principal will defer to the teacher’s judgment regarding matters like textbook selection, instructional pacing, and course content. At the same time, it is also reasonable to expect that teachers will use their expertise to resist top-down attempts at limiting their discretion. As Little (1995) notes in her case study of public school restructuring, “teachers routinely employ claims to subject expertise and department affiliation in shaping their response to new formal structures . . . and to shifts in the balance between individual and collective autonomy” (p. 50). More generally, studies in the public management literature suggest that frontline employees will resist managers’ efforts to control their actions when employees feel they have firsthand experiential knowledge that managers lack (Sandfort, 1999, 2000).
At this point, it is important to reemphasize that expertise in the context of our study has a relational component. As noted above, evidence suggests that minority teachers are better than their White counterparts at connecting with minority students. Consequently, we expect that public school principals (or vice-principals, etc.) will more readily defer to minority teachers than White teachers as the percentage of a school’s total students who are minorities increases. This is not to say that principals will rigidly oversee White teachers while employing a laissez-faire managerial style with minority teachers. Rather, it is to say that on the decision-making margins, minority teachers’ decisions are less likely to be contested than White teachers’ decisions.
Bureaucratic Appropriation
Our final causal mechanism—bureaucratic appropriation—refers to the idea that minority bureaucrats will feel empowered to claim more discretion for themselves when they serve client populations that are heavily minority. Street-level bureaucracy theory suggests that bureaucrats value discretion because it allows them to cope with the difficulties, ambiguities, and conflicting obligations of their jobs (Lipsky, 1980; Maynard-Moody & Musheno, 2003; Watkins-Hayes, 2011). Consequently, it is reasonable to expect that they will, in general, make claims for more of it. But we are interested in a more specific explanation for why minority bureaucrats will appropriate more discretion when the client population they serve is composed of a large percentage of minorities.
A simple explanation is that they will feel justified in appropriating it, and therefore will be more likely to do so. According to Saward’s (2010) theoretical notion of a “representative claim,” minority bureaucrats have special standing to demand more discretion when the bureaucracies in which they work have large minority client populations. Saward (2010) defines a representative claim as “a claim to represent or know what represents the interests of someone or something” (p. 38) and argues that these claims are legitimated by various kinds of “resources,” including descriptive similarity between the representer and the representee. In the context of the current analysis, Saward’s (2010) argument implies that minority bureaucrats will be able to legitimately claim more discretion when the client population they serve comprises a large percentage of minorities.
Research on minority teachers’ attitudes about teaching minority students suggests that they would indeed feel justified in claiming more discretion. In interviews with 22 minority public school teachers, Carr and Klassen (1997) found that nearly all believe that minority teachers “play a crucial role in connecting to racial minority students” (p. 75). Interviewees tended to emphasize their relational expertise vis-à-vis minority students. One interviewee noted, for instance, “The racial minority kids are more comfortable with me. They’re polite to me, let’s put it that way. They cooperate more” (p. 75). Another pointed out, “As a minority teacher I feel I have more patience and understanding of new students lacking some of the social aspects of schooling” (p. 75). Similar to Carr and Klassen (1997), Foster (1998) interviewed 20 Black public school teachers and found that many saw themselves as being uniquely able to connect with and instruct Black students. While these findings do not demonstrate that minority teachers actually appropriate discretion in heavily minority schools, they do imply that minority teachers would view doing so as legitimate.
Research in the representative bureaucracy literature provides additional support for the argument that minority bureaucrats will feel warranted in appropriating discretion to act on behalf of minority clients. Specifically, this research suggests that minority bureaucrats acknowledge, and often even embrace, a special responsibility to act as representatives for minority clients. Selden at al. (1998), for instance, use data on 184 bureaucrats working in the Department of Agriculture’s Farmers Home Administration (FmHA) to show that minority bureaucrats more readily adopt a “minority representative role”—an orientation toward acting on behalf of minority clients—than do nonminority bureaucrats. Similarly, Martinez (1991) and Murray et al. (1994) adduce evidence in support of the proposition that minority bureaucrats view advocating for minority clients as a duty. Martinez (1991), for instance, uses data on 93 public administrators from California to show that Hispanic administrators are significantly more likely than White administrators to view administrative representation on behalf of the Hispanic community as a valid role obligation. Likewise, Murray et al. (1994) produce survey evidence suggesting that many Black administrators view advocacy on behalf of Black clients to be a legitimate undertaking. More recently, Bradbury and Kellough (2008) demonstrate, via a survey of local government administrators in Georgia, that Black administrators believe much more so than White administrators that local government officials should make efforts to promote policies that benefit Black citizens. For instance, they show that 86% of surveyed Black administrators (as opposed to just 17.4% of surveyed White administrators) agree with the statement that government employees “should actively advocate in favor of policies that specifically address the interests of African American citizens” (p. 707) Moreover, 96% of surveyed Black administrators (as opposed to 28.9% of surveyed White administrators) agree that government employees “should actively advocate for organizational change to ensure responsiveness to African-American interests” (p. 707). These findings do not demonstrate the actual appropriation of discretion by minority bureaucrats; nevertheless, they constitute convincing evidence that minority bureaucrats are inclined to act on behalf of minority clients. In our view, this acting on behalf of minority clients would imply the claiming of discretion.
Importantly, the operation of our first causal mechanism (client demand) may reinforce the operation of our bureaucratic appropriation mechanism. The idea here is that minority clients’ demands induce minority bureaucrats to claim discretion to act on their behalf. Scott (1990), for one, finds that Black school district superintendents feel that Black citizens “impose greater demands on black superintendents” than on White superintendents (p. 167). Scott (1990) further shows that Black school district superintendents assimilate these demands by making the advancement of Black interests a priority: 56 out of 62 agree that “black superintendents should identify with black-directed endeavors to resolve the problems and needs of black Americans in a racist society” (p. 168). In a pair of earlier studies, Mann (1974, 1975) elucidates a similar dynamic, showing that minority superintendents are subject to increased demands by minority clients and therefore feel compelled to advance a minority-oriented agenda. In short, minority client demand spurs minority bureaucrats to appropriate discretion and become active representatives of minority clients’ interests.
Empirical Implications
The above reasoning has two primary empirical implications, which we call Hypotheses 1 and 1a. First, and as already emphasized, minority teachers’ discretion will increase as minority students constitute a larger and larger share of a school’s total student population. Second, this relationship will not hold for nonminority (White) teachers. White teachers’ discretion will either remain the same or decrease as minority students constitute larger and larger shares of a school’s total student population. The relationship between minority student share and White teachers’ discretion is expected to be zero or negative because the three potential causal mechanisms linking minority client share to minority bureaucrats’ discretion do not apply to White teachers. Minority students (or their parents) will not demand that White teachers be given more discretion; managers will not defer to White teachers when it comes to relating to minority students; and White teachers working in heavily minority schools will not make claims for more discretion. 5 Accordingly, our hypotheses are as follows:
Hypothesis 1 (H1): The effect of minority student share on a teacher’s discretion will depend on the race of the teacher. For minority teachers, the effect will be positive;
Hypothesis 1a (H1a): for White teachers, the effect will be null or negative.
We will test H1 for two minority groups: African Americans and Hispanics. Figure 2 helps to clarify our expectations.

The relationship between minority student share and teacher discretion, by teacher race.
We also test two additional hypotheses, both of which were alluded to in our discussion of the client demand causal mechanism. The first of these hypotheses concerns the relationship between a minority student critical mass and minority teacher discretion. Our expectation is that the existence of a minority student critical mass will be positively related to discretion for minority teachers but not for White teachers. There is no consensus in the representative bureaucracy literature on what, precisely, constitutes a critical mass (Keiser, 2010). Nevertheless, as Hindera and Young (1998) point out, “two a priori points are suggested from normative theories of democracy” (p. 663). These, they note, are the point at which a minority group constitutes a plurality and the point at which a minority group constitutes a simple majority. Consequently, we will test our third hypothesis using both points.
Hypothesis 2 (H2): Minority student critical mass (plurality/majority) will be positively related to discretion for minority teachers;
Hypothesis 2a (H2a): for White teachers, the effect will be null or negative.
As Figure 3 shows, we expect a threshold effect: Minority teachers in critical mass schools will have more discretion than minority teachers in noncritical mass schools. 6

Minority student critical mass and teacher discretion, by teacher race.
The second of our two additional hypotheses (and the third overall) is that the relationship between minority student share and minority teachers’ discretion will be more pronounced at lower grade levels than higher grade levels. Recall the reasoning that underlies this hypothesis: Parents are more involved with their children’s schools when their children are young, and so the parent demand mechanism will be more operative at lower grade levels than higher grade levels. Consequently, we should observe a stronger relationship between the percentage of minority students and minority teachers’ discretion at lower grade levels. Again, we expect no relationship (or a negative relationship) for White teachers. Figure 4 illustrates these expectations.
Hypothesis 3 (H3): At lower grade levels, the relationship between minority student share and minority teachers’ discretion is stronger (i.e., more positive).
Hypothesis 3a (H3a): At lower grade levels, there is no relationship between minority student share and White teachers’ discretion.

Minority student share and minority teacher discretion, by grade level.
Data, Model, and Method
Data
The analysis sample for this study comprises 31,640 public school teachers from 6,400 public schools. 7 Data for these units are drawn from the 2007-2008 wave of the Department of Education’s Schools and Staffing Survey (SASS). The SASS is a quadrennial survey that collects nationally representative data from public school teachers in all 50 states as well as data about these teachers’ schools, principals, and school districts. Thus, for any given teacher, the researcher can link to data about the teacher’s principal, school, and school district.
In brief, the SASS’s sample selection procedure is as follows. It first draws a nationally representative sample of public schools (schools are the SASS’s primary sampling units), 8 each of which receives the SASS “school questionnaire.” Once a school is selected for inclusion in the sample, that school’s district and principal are automatically sent a “district questionnaire” and “principal questionnaire,” respectively. Finally, from within each of the sampled schools, a sample of teachers is drawn, and each of these teachers receives the SASS “teacher questionnaire.” The separate questionnaires elicit a wealth of information from each set of respondents (teachers, principals, schools, and districts). Below, we present our model of bureaucratic discretion and describe the variables that go into it.
Model
Though we are chiefly interested in the interaction between teacher race and student demographics (recall Figure 1), we begin by estimating a simple model of teacher discretion, one that does not include any interaction terms:

We then estimate a model that does include interaction terms:

We begin with the simple model because doing so helps to clarify the theoretical importance and substantive interpretation of the interaction terms.
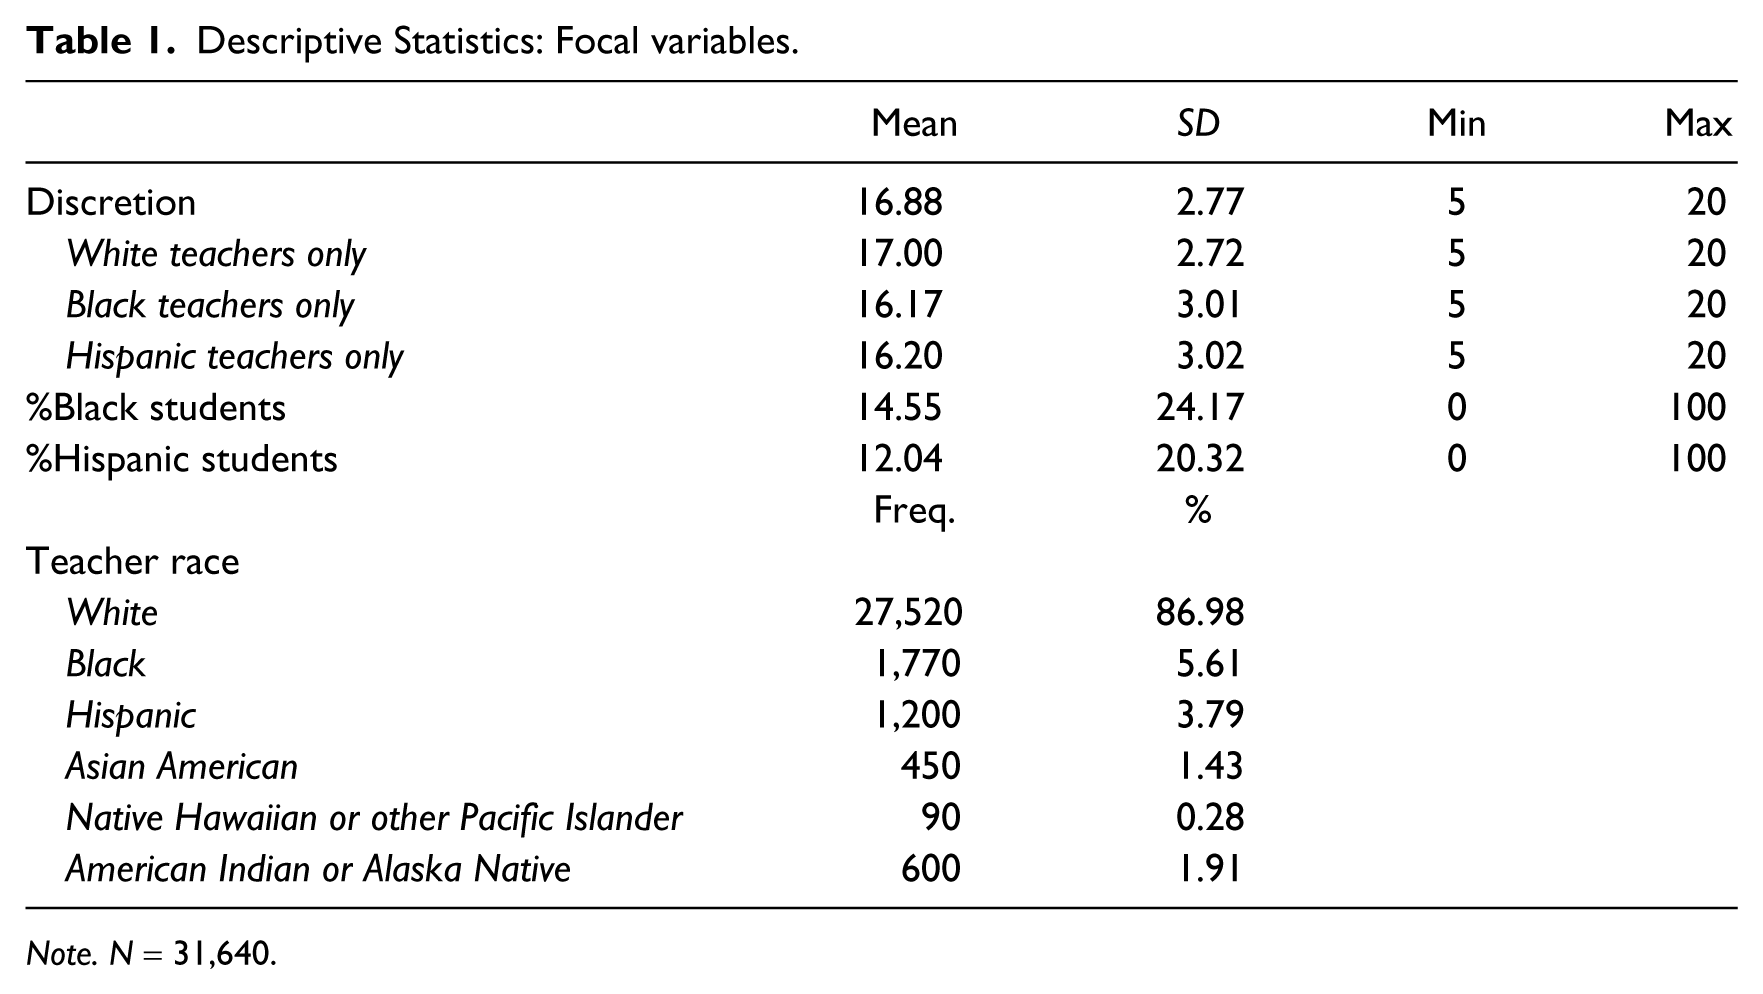
Above, discretiont,s is the discretion of teacher t in school s; blacktcht,s is a dummy variable that equals one if teacher t (in school s) is African American and zero otherwise; Hisptcht,s is a dummy variable that equals one if teacher t is Hispanic and zero otherwise; pctblackstus is the percentage of school s’s students who are African American; pctHispstus is the percentage of school s’s students who are Hispanic; blacktcht,s⋅pctblackstus and Hisptcht,s⋅pctHispstus are interaction terms; controls is a collection of control variables; µ s is a random school-level error term; and ε t,s is a random teacher-level error term. It is important to note that teacher race is a six-category variable whose categories are the following: White, Black, Hispanic, Asian American, Native Hawaiian or other Pacific Islander, and American Indian or Alaska Native. We “dummy out” this six-category race variable, creating a set of five indicator variables—one for each race category except White. Consequently, White teachers constitute our reference group throughout the analysis. 9 Table 1, which contains descriptive statistics, shows that there are 1,770 Black teachers and 1,200 Hispanic teachers in our sample. As the table further shows, the student bodies of the 6,400 schools in our sample are about 14.6% Black and 12.0% Hispanic, with a good deal of variation around these means.
Descriptive Statistics: Focal variables.
Note. N = 31,640.
The above model’s two focal interaction terms serve to test the hypothesis that minority teachers’ discretion will increase with the percentage of a school’s total students who are minorities. Positive signs on these interaction terms’ coefficients would support this hypothesis. 10 The pctblackstus and pctHispstus variables test H1a, which states that White teachers’ discretion will either remain the same or decrease as the percentage of a school’s total students who are minorities increases. Since White teachers constitute our omitted race category, these variables’ coefficients represent, respectively, the effects that increases in the percentage of a school’s students who are Black and Hispanic have on White teachers’ discretion.
To test our second hypothesis, we estimate the following model:

Above, blackstuPluralitys is a dummy variable that equals one if school s’s Black students constitute a plurality and zero if they do not; HispstuPluralitys is a dummy variable that equals one if school s’s Hispanic students constitute a plurality and zero if they do not; and blacktcht,sblackstuPluralitys and Hisptcht,sHispstuPluralitys are interaction terms. A significant positive coefficient for the blacktcht,sblackstuPluralitys interactions term would indicate that the existence of a Black student critical mass is positively related to discretion for Black teachers. A null coefficient for the blackstuPluralitys variable would indicate that a Black student critical mass has no effect on White teachers’ discretion. Similar logic would apply to the coefficients of the Hisptcht,sHispstuPluralitys and HispstuPluralitys variables. Note that we estimate the same model as above with variables measuring minority student majorities.
To test our third hypothesis, we estimate the above two models while restricting the estimation sample to include only elementary schools. We then estimate the above two models for all other schools. Comparing our results across the different estimation samples allows us to informally assess our third hypothesis.
Method
As indicated above, we begin with a simple model and add in complexity. The simple model contains a group of control variables that we call exogenous. We use the term exogenous somewhat informally, applying it to any variable for which reverse causality can reasonably be assumed to be a nonissue. These are mostly demographic or structural variables like school size, the percentage of a school’s students who are eligible for free lunch, and organizational span of control (the ratio of vice-principals to teachers). Our more complex models include these exogenous controls as well as additional controls that we call endogenous, given that they do raise the issue of reverse causality. One such variable, for instance, is a measure of red tape: It is plausible to think that red tape affects teachers’ discretion, but it is also plausible to think that teachers with lots of discretion can choose to ignore red tape. Ultimately, whether the endogenous variables are included in our models does not impact our results in a substantively meaningful way. Nevertheless, we do want to acknowledge this potential problem. Our models include a long list of controls, measured at both the teacher level and the school level. To preserve space, and to keep the focus of our article on our variables of theoretical interest, we do not catalogue our control variables here. Instead, we list them in our control variables appendix (Table A1) along with the details of their measurement and brief comments regarding their purpose.
We estimate each of the models shown above with school district fixed effects, which control for any district to district differences that could be correlated with our independent variables of interest as well as our dependent variable, teacher discretion. The district fixed effects are particularly important because different school districts may have different formal policies in place that affect how much discretion teachers have. These policies might also limit or enable the operation of our three causal mechanisms. For instance, district policies could restrict formal parent involvement in school governance (stifling our parent demand mechanism). The inclusion of school district fixed effects in our models accounts for this kind of possibility. 11 More generally, the district fixed effects give us more confidence in the validity of our results.
Measuring Discretion
Scott (1997) has defined discretion as “a range of choice within a set of parameters that circumscribes the behavior of the individual service provider” (p. 37). Formal policies will likely set the boundaries of teacher discretion; within these boundaries, different teachers will have more or less room to exercise their own judgment. As we noted above, since our models include school district fixed effects, any impact that formal, district-level policies have on teacher discretion is accounted for in our analysis.
We measure discretion using the sum of a teacher’s answers to five survey items. Teachers are asked to rate the amount of control they have over various areas of teaching and planning. These areas are as follows: (a) selecting textbooks and other instructional materials; (b) selecting content, topics, and skills to be taught; (c) selecting teaching techniques; (d) evaluating and grading students; and (e) determining the amount of homework to be assigned. Response options include (1) no control, (2) minor control, (3) moderate control, and (4) major control. Thus, if a teacher were to report major control for all five items, his score on our multi-item index of discretion would be 20. By contrast, if a teacher were to report no control for all five items, his score would be five. On average, teachers have a good deal of discretion—the mean value of the discretion index for our sample of 31,640 teachers is 16.88. The minimum sample value for the index is five and the maximum is 20; the standard deviation is 2.77. Black and Hispanic teachers tend to have less discretion than White teachers. For Black teachers, mean discretion is 16.17; for Hispanic teachers, mean discretion is 16.20; for White teachers, mean discretion is 17.00. These figures are shown in Table 1.12.13
Results
Table 2 shows our results. The first two rows of the table show our Black Tch and Hispanic Tch coefficients, which speak to the question of whether Black teachers and Hispanic teachers have different amounts of discretion than White teachers. As we will emphasize throughout our discussion of the results, these coefficients—as well as our %Black students and %Hispanic students coefficients—must be interpreted carefully since they appear in interaction terms. In general, our results suggest that Black teachers tend to have less discretion than White teachers, while Hispanic teachers tend to have the same amount of discretion as White teachers.
Results: Teacher Discretion.

Note. All models include school district fixed effects. Standard errors (not shown) are clustered by district. Control variable results are not shown, but the models include the control variables listed in Table A1. As indicated, two models include exogenous control variables only, while the remaining models include both exogenous and endogenous control variables.
p < .05. **p < .01.
We begin with a simple model that does not include interaction terms (Model 1). The Black teacher variable’s (Black Tch) coefficient indicates that Black teachers have, on average, about 0.20 more units of discretion than White teachers (the omitted teacher race category). As the table further shows, this is with our exogenous control variables included in the model and our endogenous variables excluded. All models include school district fixed effects. Given the inclusion of the district fixed effects, the Black teacher variable’s coefficient can be interpreted as a within-district comparison of Black and White teachers: Black teachers have about 0.20 more units of discretion than White teachers working in the same district, holding constant all exogenous control variables. While the Black teacher variable’s coefficient is statistically significant, it is not substantively meaningful. Recall that our discretion variable ranges from 5 to 20, with a mean of 16.88. Since 0.20 units of discretion would constitute a mean-anchored increase of only 1.2% (0.20/16.88), we consider 0.20 units small.
Model 1’s %Black students coefficient indicates that increases in the percentage a school’s students who are Black are associated with decreases in teacher discretion. Importantly, since Model 1 does not include any teacher raceXstudent demographic interaction terms, this coefficient applies to all teachers. However, like the Black teacher variable’s coefficient, the %Black students coefficient, though statistically significant, is quite small: A one percentage point increase in Black students is associated with a decrease in teacher discretion of 0.005 units. The %Hispanic Students variable is also negative, statistically significant, and substantively small. The Model 1 results, then, suggest that student demographics have no appreciable impact on teacher discretion.
Our argument is that Model 1 is overly simple and theoretically incorrect since it does not recognize that minority student demographics might impact teacher discretion differently for minority teachers than for White teachers. To account for this possibility, Model 2 includes two key interaction terms: Black Tch X %Black Students and Hispanic Tch X %Hispanic Students. The coefficient of the first of these interaction terms represents by how much the relationship between Black student share and teacher discretion differs for Black teachers and White teachers. In other words, this coefficient represents the difference between the slopes of the two lines shown above, in Figure 2. Similarly, the coefficient of the Hispanic Tch X %Hispanic Students interaction term represents by how much the relationship between Hispanic student share and teacher discretion differs for Hispanic teachers and White teachers. Our three theoretical mechanisms suggest that these coefficients should be positive.
Since White teachers constitute our reference racial category, the presence of the interaction terms in Model 2 means that the %Black Students and %Hispanic Students coefficients represent the impact of Black student share and Hispanic student share on discretion for White teachers. These coefficients correspond to the horizontal line for White teachers that appears in Figure 2. Recall that our expectation is that minority student share will either have no impact or a negative impact on discretion for White teachers.
The presence of the interaction terms, both here and in our remaining models, has two more implications for the interpretation of our results. First, the Black Tch and Hispanic Tch coefficients represent the difference between Black teachers’ (Hispanic teachers’) 14 discretion and White teachers’ discretion when the %Black Students [%Hispanic Students] variable equals zero. For instance, Model 2’s Black Tch coefficient indicates that Black teachers have, on average, 0.221 fewer units of discretion than White teachers when a school has no Black students. Second, the impact of Black [Hispanic] student share on discretion for Black [Hispanic] teachers is equal to the coefficient of the %Black Students [%Hispanic Students] variable plus the coefficient of the Black Tch X %Black Students [Hispanic Tch X %Hispanic Students] interaction term. Our expectation is that this will be positive. For instance, the Model 2 impact of Black student share on Black teachers’ discretion is equal to −0.007 + 0.009, or 0.002. To assess whether this impact is statistically significant, a joint F test can be performed on the %Black Students and Black Tch X %Black Students coefficients. The results of this test (F = 6.88, p = .001) indicate that it is, though we note that it is quite small. To sum up, our theoretical expectations are that the %Black Students [%Hispanic Students] coefficient will be null or negative, that the coefficients of our interaction terms will be positive, and that the sum of the two will also be positive. Statistically, our Model 2 results confirm these expectations for Black teachers but not Hispanic teachers. However, as already noted, these results are substantively trivial.
Except for the addition of our endogenous control variables, Model 3 is the same as Model 2. Its results are similar to Model 2’s results in that the Black Tch X %Black Students coefficient is positive and statistically significant and the total impact of Black student share on Black teachers’ discretion is statistically significant (–0.004 + 0.008 = 0.004, F = 4.67, p = .009), though substantively insignificant. Additionally, Model 3 does not produce any statistically significant results for Hispanic teachers.
Our results are substantively more meaningful in Model 4, which is the same as Model 3, but is estimated for elementary schools only. Note first the Black Tch coefficient, which indicates that Black teachers have, on average, about 1.04 fewer units of discretion than White teachers in elementary schools with zero Black students. To get a sense for what 1.04 units mean, recall that the mean of discretion for our sample is 16.88. These 1.04 units represent about 6.2% of that mean. While not overly large, this does strike us as substantively meaningful. The null %Black Students coefficient indicates that Black student share is, as expected, not related to White teachers’ discretion, while the positive and statistically significant Black Tch X %Black Students coefficient means that the relationship between Black student share and discretion is 0.016 units larger for Black teachers than White teachers. 15 An F test (F = 4.11, p = .017) suggests that the impact of Black student share on Black teachers’ discretion (0.001 + 0.016 = 0.0161) is statistically significant. For an idea of the size of this impact, consider a one standard deviation increase in Black student share (i.e., an increase of 24.2 percentage points). Such an increase would be associated with an increase in Black teachers’ discretion of about 0.39 (24.2 × 0.0161) units. By extrapolation, a two standard deviation increase in Black student share would be associated with an increase in Black teachers’ discretion of 0.78 units. Taken together, the Model 4 results suggest that Black teachers in elementary schools “start off” with less discretion than White teachers, but then close this initial discretion gap as Black student share increases. It is important to note that this scenario, which Figure 5 depicts, is stylized for illustrative purposes. It should not be taken as a causal claim, given that our analyses rely on nonexperimental cross-sectional data.

Results: The relationship between Black student share and teacher discretion, by teacher race (elementary schools only).
Model 5 tests our critical mass hypotheses, which stated that the presence of a minority student plurality will be positively associated with discretion for minority teachers, but not for White teachers. Model 5’s estimated coefficients conform to our expectations for White teachers: The Black Student Plurality coefficient indicates that White teachers have 0.133 fewer units of discretion than Black teachers in the presence of a Black student plurality. This result is not statistically significant, but our hypothesis was that the relationship between a minority student plurality and White teachers’ discretion would be null or negative, so a statistically insignificant result is consistent with that hypothesis. The impact of a Black student plurality on Black teachers’ discretion (–0.133 + 0.473 = 0.340) is positive, but it is not statistically significant. The same pattern of results obtains for our Hispanic variables.
Model 6 tests our critical mass hypotheses using a simple majority as the critical mass point. Here, the model’s results conform to expectations for White teachers and for Black teachers in terms of sign. Additionally, F test results indicate that Black teachers have (–0.211 + 0.36) 0.15 more units of discretion than White teachers in schools with Black student majorities (F = 2.79, p = .06). Note, though, that these F test results are significant only at the 0.10 level. Model 6’s Hispanic results, like Model 5’s, are statistically insignificant.
Model 7 is the same as Model 6, except that it is restricted to elementary schools only. The results of this model indicate that in elementary schools without a Black student majority, Black teachers have, on average, about 0.7 fewer units of discretion than White teachers. The Black Student Majority coefficient’s sign is in accord with expectations—the presence of a Black student majority has no impact on White teachers’ discretion. Also in accord with expectations, the Black Tch X Black Student Majority coefficient (1.112) indicates that the presence of a Black student majority has a larger impact on black teachers’ discretion than on White teachers’ discretion. According to the Model 6 results, Black student majorities are associated with Black teachers’ having about 0.97 (–0.145 + 1.112) more units of discretion than White teachers. A joint F test (F = 4.43, p = .0121) suggests that this result is statistically significant. 16 To get a sense for the magnitude of this finding, consider again how it compares to average teacher discretion (16.88 for the entire sample, 16.2 for Black teachers, 17.0 for White teachers). It is about 6% of our sample mean for the discretion variable. Consider also that our discretion variable ranges from a minimum of 5 to a maximum of 20. As a percentage of this response range (15 units), 0.97 units is not trivial: 0.97/15 = 6.5%. Once again, our results for Hispanic teachers are statistically insignificant. Figure 6, shown below, depicts these results: Black teachers “start off” with less discretion than White teachers, but once a critical mass is achieved, their discretion jumps up. Again, our analyses rely on nonexperimental cross-sectional data, and so the figure should not be taken as a causal illustration.

Results: Black student critical mass and teacher discretion, by teacher race (elementary schools only).
Before turning to a deeper discussion of our results, we want to comment on Table 2’s R-squared rows. Because our models include school district fixed effects, Table 2 displays an “overall” R-squared, a “within” R-squared, and a “between” R-squared. In our modeling set-up, discretion varies within school districts: Different teachers within the same district have different amounts of discretion. Discretion also varies between school districts: Average teacher discretion is different in different school districts. R-squared (within) represents the percentage of within-district variation in discretion that our independent variables explain, while R-squared (between) represents the percentage of between-district variation in discretion that our independent variables explain. R-squared (overall) is a weighted average of the two.
A few patterns are apparent in the R-squared results. First, the models tend to explain more between-district variation than within-district variation. This is probably because of the school district fixed effects, which account for critical factors like district policies, district quality, district resources, and so forth. District policies are especially likely to account for district to district differences in teacher discretion. The comparatively low within-district R-squared results could suggest one of two things. It could be the case that our models leave out important teacher-level and school-level variables that would account for more within-district variation if included in our models. Or, it could be the case that within-district variation in teacher discretion is largely random; that is, it varies from teacher to teacher for reasons that we cannot systematically explain. Since our models include an extensive list of teacher-level and school-level control variables, including measures of teacher quality, teacher experience, teacher tenure, teaching field, teacher education level, perceptions of administrative support, school quality, school resources, and so forth, we are inclined to think that the issue is more one of random variation in teacher discretion than one of omitted variables. Still, it is useful to consider what factors our analysis might be leaving out. Prime suspects include school-level variables like organizational culture and managerial dispositions toward teacher discretion. In some schools, for instance, teachers might be encouraged by their principals to exercise discretion; in others, they may not. Our models control for school-level administrative support, but this is an imperfect proxy for managerial dispositions. Ideally, we would like to use a school fixed effects approach to control for these types of school-level variables, but our student demographic variables are measured at the school level, and so would be excluded from our analysis if we used school-level fixed effects.
Discussion and Conclusion
Is the discretion of minority bureaucrats positively related to the percentage of an organization’s total clientele who are from the same minority group? Our results suggest that this is the case for Black teachers but not for Hispanic teachers, particularly at lower grade levels. We have argued that there are three reasons to expect to observe such a relationship: client demand, managerial deference to expertise, and bureaucratic appropriation. First, minority clients will want minority bureaucrats to have the discretion that is necessary to act on their behalf. Prior empirical research suggests minority clients value bureaucratic representation, presumably because minority clients believe that minority bureaucrats are more likely to share their values and will be better able to empathize with them than nonminority bureaucrats (Thielemann & Stewart, 1996; Watkins-Hayes, 2011).
Second, public managers will defer to minority bureaucrats working with heavily minority client populations since minority bureaucrats possess a unique capacity to serve those clients. For instance, research in the education literature indicates that Black students do better under Black teachers than White teachers (Dee, 2004; Ladson-Billings, 1995; Lipman, 1994). As we note above, minority bureaucrats’ unique capacity to serve minority clients need not entail technical expertise; instead, it can be based on a unique ability to empathize with, or relate to, minority clients. Indeed, one of the premises of representative bureaucracy theory is that minority bureaucrats tend to share the same values, attitudes, and worldviews of minority clients (Dolan & Rosenbloom, 2003).
Finally, in organizations serving heavily minority client populations, minority bureaucrats will make claims for discretion on the basis of race. Research indicates that minority bureaucrats are more likely to adopt a minority representative role than nonminority bureaucrats and that minority bureaucrats view advocating on behalf of minority clients as a valid role obligation (Martinez, 1991; Murray et al., 1994; Selden et al., 1998). More specifically, research in the education literature indicates that minority teachers consciously view themselves as possessing special capacities to connect with minority students (e.g., Carr & Klassen, 1997). Taken together, these streams of research suggest that minority bureaucrats view acting for minority clients as legitimate, and so would be inclined to claim discretion to do so.
It is important to note that the relationship between minority client share and minority bureaucrats’ discretion that we propose is not contingent on the operation of any one of the above mechanisms we have discussed. We might observe a positive relationship between the discretion of minority bureaucrats and the percentage of an organization’s clients who are from the same minority group because client demand, managerial deference, and bureaucratic appropriation are all in play, or simply because of bureaucratic appropriation alone. Much as the empirical representative bureaucracy literature has been unable to pinpoint why, exactly, passive representation translates into active representation, we cannot pinpoint which of the three mechanisms proposed here is responsible for the positive relationships we observe. Nevertheless, we expected the client demand mechanism to be stronger at lower grade levels and our results confirmed this expectation.
Our findings have some interesting implications for representative bureaucracy theory and, more generally, for the management of public organizations. First, they suggest that a bureaucracy’s minority clients can and do take concerted action to strengthen the link between passive and active representation. Standard statements of representative bureaucracy theory typically posit that passive representation will lead to active representation when certain enabling conditions are satisfied—including, prominently, the condition that bureaucrats have nontrivial amounts of discretion. In this view, minority bureaucrats who have sufficient discretion advocate for minority clients’ interests. This view says nothing about a bureaucracy’s minority clients; it is merely implicit that they will be the passive recipients of active representation. Our results indicate that minority clients take steps to make active representation more likely; put differently, they act as their own advocates. These results are consistent with previous research showing that minority clients value bureaucratic representation (e.g., Bradbury & Kellough, 2008; Thielemann & Stewart, 1996). Our own research builds on these findings by providing evidence that minority clients act on their valuation of bureaucratic representation by demanding that minority bureaucrats be given more discretion. 17
Second, our results have some normative, managerial, and policy implications. We emphasize again that it is not clear which of our proposed theoretical mechanisms is at work, but in so far as our lack of significant findings for Hispanic teachers reflects Hispanic parents’ inability to make demands about teacher discretion—whether because their involvement in their children’s schooling is mostly informal or because they often are not proficient in English 18 —managerial efforts and policies to facilitate the airing of these demands may be warranted. Whether such efforts and policies are warranted is ultimately a normative question. As we have already emphasized, public schools are democratic institutions, and so demands made by interested actors (e.g., parents) are typically viewed as legitimate. This line of thought would support the notion that managers and policies should facilitate client demand. Additionally, distributional equity in terms of client outcomes is a central concern of representative bureaucracy scholars (e.g., Nicholson-Crotty et al., 2011). Potential inequities in client outcomes resulting from active representation are usually viewed unfavorably. Consequently, promoting equity in the airing of demands by different minority subgroups (via managerial and policy efforts) would seem to be a reasonable managerial objective.
Finally, and most basically, our results suggest that future work on representative bureaucracy should attend to client demographics as well as to internal organizational demographics (i.e., measures of passive representation). Though discretion and race are central components of representative bureaucracy theory, no large-N studies have examined whether the demographic makeup of a bureaucracy’s client population is related to the discretion held by individual bureaucrats. More fundamentally, though representative bureaucracy theory posits that the exercising of discretion by minority bureaucrats is intimately tied up with their race and the race of the clients they serve, there has been little theoretical discussion of how or why race might affect discretion.
A potentially useful line of inquiry for future research would be to examine whether the race of higher level administrators influences the amount of discretion held by frontline workers. 19 Minority administrators may be inclined to more readily defer to their coethnic subordinates because they share the interests of minority clients and are more likely to acknowledge their unique ability to connect with minority students. It is also possible that the presence of minority administrators might not affect (or might even lessen) minority teacher discretion since minority administrators can serve as a more “powerful” avenue of representation for minority clients. For instance, parents may seek less teacher discretion if they have administrative representation addressing their demands and interests.
Another potentially useful line of inquiry for future research would be to investigate whether the empirical relationships we observe in the context of public education hold in other bureaucratic milieus. We have proposed three mechanisms linking client demographics to bureaucratic discretion that generalize across contexts. Much as representative bureaucracy theory evolved as the link between passive and active representation was tested in new contexts, our knowledge of how race affects discretion is likely to advance as researchers direct their attention to new settings.
Footnotes
Appendix
Control Variables.
| Variable | Measurement | Comments |
|---|---|---|
| Teacher-level exogenous | ||
| Teacher gender | Male/female | |
| BA or lower | ||
| MA | ||
| Teacher education | Education specialist | Proxy for teacher expertise |
| Doctorate | ||
| Teaching field | Math/science: Yes/No |
Proxy for teacher specialization/expertise |
| Union member | Yes/no | |
| Teacher salary | US$1,000s | Proxy for teacher quality |
| Age | 1. < 30 | |
| 2. 30-50 | No change in main results if treated as continuous | |
| 3. > 50 | ||
| Classroom type | 1. Several classes of different students | |
| 2. Elementary school teacher who teaches only one subject to different classes of students | ||
| 3. Same group of students all or most of the day in multiple subjects | ||
| 4. One of two or more teachers, in the same class, at the same time; jointly responsible for teaching the same group of students all or most of the day) | Proxy for teacher-level task type | |
| 5. Instruct a small number of selected students released from their regular classes in specific skills or to address specific needs | ||
| Teacher-level endogenous | ||
| Years at current school | 1. < 3 years | |
| 2. 3-20 years | No change in main results if treated as continuous | |
| 3. > 20 years | ||
| Total teaching experience | 1. < 3 years | |
| 2. 3-20 years | No change in main results if treated as continuous | |
| 3. > 20 years | ||
| Highly qualified teacher | Yes/No | Proxy for teacher quality |
| School-level exogenous | ||
| School location | 1. Urban | Proxy for task type (e.g., teachers in urban schools confront different issues than teachers in rural schools) |
| 2. Suburban | ||
| 3. Rural | ||
| School level | 1. Elementary | |
| 2. Middle | Proxy for task type (e.g., teachers at different levels structure instruction differently) | |
| 3. High School | ||
| 4. Combined (High and Middle) | ||
| Principal race | 1. White | |
| 2. Black | ||
| 3. Hispanic | ||
| 4. Asian American | ||
| 5. Native Hawaiian or other Pacific Islander | ||
| 6. American Indian or Alaska Native | ||
| %Black teachers | %Total teachers who are Black | |
| %Hispanic teachers | %Total teachers who are Hispanic | |
| %Low income students | %Students who qualify for free or reduced-price lunch | Proxy for task difficulty/school quality |
| Total enrollment | Number of students | |
| Average daily attendance | %Students present | Proxy for school quality/school-level task complexity |
| %Students suspended | %Student receiving suspensions during previous academic year | Proxy for school quality/school-level task complexity |
| Administrative span of control | Ratio of vice-principals to teachers | Proxy for managerial oversight: when there are many employees and few supervisors, employees tend to have more discretion because oversight is more difficult. |
| Support staff per student | Ratio of support staff to students. Support staff includes nurses, social workers, psychologists, speech therapists, and other professional nonteaching staff | Proxy for school resources |
| Aides per student | Ratio of aides to students. Aides include classroom teacher aides as well as noninstructional aides | Proxy for school resources |
| School-level endogenous | ||
| Administrative support | Teachers indicate their degree of agreement with the following statements: | Response options: 1 = strongly disagree, 2 = somewhat disagree, 3 = somewhat agree, 4 = strongly agree; |
| 1. The school administration’s behavior toward the staff is supportive and encouraging | For each individual teacher, we sum over the six items to the left. We then take the school average of teacher sums and use this school average as our measure of administrative support. We use the school-level average to address potential endogeneity. | |
| 2. My principal enforces school rules for student conduct and backs me up when I need it | The basic reasoning is that supportive administrators communicate clear goals and trust their teachers. In general, in any principal–agent relationship, goal clarity and trust are expected to be positively related to the agent’s discretion. | |
| 3. The principal knows what kind of school he or she wants and has communicated it to the staff | ||
| 4. In this school, staff members are recognized for a job well done | ||
| 5. I am given the support I need to teach students with special needs | ||
| 6. I like the way things are run at this school | ||
| Parental support | I receive a great deal of support from parents for the work I do | Response options are the same as above; |
| School-level mean is used to address potential endogeneity. Teachers who have parental support might use it as a resource to resist top-down attempts by managers to limit their discretion. | ||
| Red tape | Routine duties and paperwork interfere with my job of teaching | Response options are the same as above; School-level mean is used. |
| External actors’ influence in school policy | School principals indicate the degree of influence that select actors have in various areas of school policy. | For each of the external actors (in each of the policy areas), principals respond on the following 4-point scale: 1 = no influence, 2 = minor influence, 3 = moderate influence, 4 = a great deal of influence. For each external actor, we use the sum of the principal’s responses across the seven policy areas to measure influence. |
| Actors: State Department of Education, local school board, school district staff, curriculum specialists, and parents. | External actors’ influence can impinge on teachers’ autonomy. | |
| Policy area: Setting performance standards for students, establishing curriculum, determining the content of in-service professional development programs, evaluating teachers, hiring new full-time teachers, setting discipline policy, and deciding how the school budget will be spent. | ||

Declaration of Conflicting Interests
The author(s) declared no potential conflicts of interest with respect to the research, authorship, and/or publication of this article.
Funding
The author(s) received no financial support for the research, authorship, and/or publication of this article.