
Abstract
The study of managerial networking has been growing in the field of public administration; a field that analyzes how managers in open system organizations interact with different external actors and organizations. Coincident with this interest in managerial networking is the use of self-reported survey data to measure managerial behavior in building and maintaining networks. One predominant approach is to generate factor indices of networking activity from ordinal scales. However, when public managers answer survey questions with ordinal scales to describe their networking activities, the answers may be subject to various response biases. Consequently, the use of factor indices may lead to biased measurements that misrepresent managerial networking. As an alternative, we build on studies that apply the item response theory (IRT) as a measurement strategy and propose a Bayesian alternative. To tap managers’ latent effort put in networking activity, the Bayesian Generalized Partial Credit Model allows us to select a one-dimensional networking scale from multiple ordinal survey items. Using 12 such items in a mail survey of nearly 1,000 American hospital managers, we demonstrate the advantage of using the Bayesian IRT model over factor-analytic models in a substantive test of how managerial networking affects organizational performance.
Introduction
The field of public management is flourishing, with theoretical-empirical research contributing to diverse areas of study, such as public sector motivation, red tape, collaborative management, performance management, or networking. Empirical evidence in the field is rapidly accumulating, relying on equally diverse methods, such as (field) experiments, content analysis, comparative case studies, or survey research. In surveys, we aim to measure traits of our respondents, tapping important information about the public management phenomena under study or about factors that partially explain these phenomena. Measures for public sector motivation, for example, combine information from different items that are constructed as ordinal (Likert-type) scales. These scales measure the level of agreement of respondents with a number of statements about various aspects of their motivation, varying from 1 = strongly disagree to 5 = strongly agree (Kim, 2011; Perry, 1996). Another example, elaborated in the present article, is the measurement of the intensity of managerial networking. Managerial networking is the extent to which managers maintain relations with various types of external organizations and actors, for example, suppliers, stakeholders, clients, alliance partners, regulatory agencies, or political actors and institutions. Networking activity is conceptualized as the contact frequency of relations that (high ranking) managers maintain with external actors and organizations. Each item is a type of external actor or organization, while the scale taps the contact frequency with these organizations in ordinal categories (varying from 1 = never to 6 = daily). 1
The dominant approach to measurement in public management research is to apply factor analysis techniques to self-reported ordinal survey data. Such an approach implicitly assumes that different survey items share the same underlying distribution. For studies of managerial networking, the theoretical literature does not offer much guidance on the dimensionality of networking activities, with Thomson, Perry, and Miller (2009) as a notable exception. Studies on the Texas school district data repeatedly report the existence of a single, continuous factor underlying these contact frequencies, which is positively associated with various measures of school district performance (Meier & O’Toole, 2001). Yet, although the results of empirical studies into managerial networking seem promising, some cautionary remarks must be made when it comes to measurement theory. Too hastily the field of public administration has rushed into performance appraisal and performance management without paying proper attention to measurement theory and methodology (Meier & O’Toole, 2013; Torenvlied & Akkerman, 2012). The quality of our measurement critically affects our ability to test causal relationships, make proper statistical inferences, and, more generally, our understanding of administrative behavior. Improving the measurement procedures that map administrative and managerial behaviors is critical to the building of knowledge in our field.
A common problem with the dominant approach to measurement is that the latent traits, derived from factor analysis, which scholars intend to measure, do not have well-established units of measurement. More specifically, the application of factor-analytic methods to ordinal data poses two major challenges to measurement validity. The first challenge is the compatibility issue, meaning that respondents may understand the same question in different ways (Brady, 1985; King, Murry, Salomon, & Tandon, 2004; King & Wand, 2007). The potential heterogeneity across respondents is, “a typical source of variation in response data that needs to be accounted for in a statistical response model” (Fox, 2010, p. 3). Survey items on managerial networking are extremely vulnerable to this validity threat in that both managers’ personal traits and their organizational contexts might induce a specific networking activity and affect its frequency. A simple index without accounting for the cross respondent heterogeneity will be a biased measure, which is not compatible across all respondents.
The second challenge is that perceptual survey items may induce a social desirability bias, meaning that respondents have a tendency to answer questions in a socially desirable way, thus producing a “common source bias” (Donaldson & Grant-Vallone, 2002; Doty & Glick, 1998; Graham & Collins, 1991; Podsakoff & Organ, 1986; Schwarz, 1999). Both the factor-analytic technique and the non-parametric cumulative scaling technique assume that each behavior item is correctly measured. In other words, measurement scales are produced with the assumption that managers truthfully report their activities of managerial networking. Recent studies show, however, that self-reported survey items are vulnerable to various reporting bias. Meier and O’Toole (2013) demonstrate that managers might over- or underreport particular networking activities due to the social desirability of the survey item. Henry, Lubell, and McCoy (2012) find that self-reported survey items are likely to have recall bias, namely, respondents are unlikely to remember their entire list of network nodes and report accurately how much they networked with each node. These most recent studies, nevertheless, are long on description and short on prescription of how to quantify managerial networking, accounting for measurement bias embedded in the survey data.
Two recent contributions in the subfield of managerial networking, indeed, show how sensitive our analyses can be to the measurement model applied. Robinson and Gaddis (2012) compare different measurements of collaboration. They analyze a survey of school district superintendents following Hurricane Katrina to assess postdisaster collaborative activity. They compare various approaches to measuring collaborative activity and report that varying questions unsurprisingly led to varying distributions of collaborative activity, even though these varying distributions were captured by a single underlying factor. In a recent study, Torenvlied, Akkerman, Meier, and O’Toole (2013) introduce “item response theory” (IRT) as an alternative to factor analysis to arrive at networking activity scales, mapping different ordinal contact frequency items to cumulative scales. The IRT approach reveals that the contact frequencies of Texas school district superintendents cannot be mapped on a single networking activity dimension, but on several dimensions, each related to a specific source of support from the environment of their school districts.
The present article offers two main contributions to the existing literature on measurement in public management, more in particular on managerial networking. The first main contribution is to introduce an approach which addresses the important, yet overlooked, problem of measurement bias in the study of networking activities. Drawing from the IRT literature (Embretson & Reise, 2000; van der Linden & Hambelton, 1996), including non-parametric Mokken Scale analysis (Mokken, 1971; van Schuur, 2003, 2011), we propose a Bayesian variant of the IRT approach to infer the latent dimension(s) of managerial networking. Bayesian IRT models have been introduced in other fields such as education (e.g., Lord, 1986; Patz & Junker, 1999) and psychology (Fox & Glas, 2003). The Bayesian approach to measurement conceptualizes the effort level of managerial networking as a latent variable, which is not directly observable. Theoretically, managerial networking activities are, in the first place, driven by time-budget constraints which translate into the difficulty managers have to concentrate their time-allocation into one networking node. Managerial networking activities are, in the second place, driven by time-allocation decisions based on returns to investment in different networking dimensions; that is, the discrimination of one networking node from all the other nodes (Akkerman & Torenvlied, 2011; Torenvlied et al., 2013).
A Bayesian model, furthermore, deals with uncertainty in parameters caused by response bias. We argue that the Bayesian approach of measurement is more attractive than the factor-analytic methods because it relaxes the assumption that responses to each networking item are treated with equal weights. The Bayesian approach also accounts for differential response difficulties for different respondents by explicitly modeling differential item functioning (DIF; Embretson & Reise, 2000). Finally, the Bayesian IRT approach extends the non-Bayesian IRT models in that it is exible to handle cross-item heterogeneity and uncertainty in parameters. Thus, the approach in the present article improves measurement reliability (Fox, 2005, 2010; Jackman, 2009).
The second main contribution of the present article is that we apply our analyses in the field of professional health care organizations (American hospitals), using 12 items on networking activities from a large survey. We illustrate the statistical procedure of computing the Bayesian IRT measure. We demonstrate that the Bayesian approach to measurement helps to reduce measurement bias associated with the classic factor-analytic methods and is particularly useful when the number of observations is relatively small.
Networking as a Latent Variable
We propose a Bayesian Item Response approach to model ordinal survey items of managerial networking. Our approach builds on the IRT and the cumulative scaling technique, but explicitly accounts for uncertainty in parameters. Bayesian inference is then used to improve measurement reliability.
Ordinal Response Data and the IRT Approach
The IRT was initially developed in psychological measurement and educational testing (Lord & Novick, 1968). Despite their different mathematical forms, IRT models conceptualizes that the probability of a particular response to a survey item is a function of the respondents’ and the survey items’ characteristics (Hemker, Sijtsma, & Molenaar, 1995). The IRT scaling approach differs from the classic reliability (factor) analysis. Factor (reliability) analysis assumes that all items have the same underlying frequency distributions, whereas IRT models explicitly account for heterogeneous item distributions (van Schuur, 2003).
In the context of analyzing dichotomous item responses,
the answer a person gives to a question is interpreted as a dominance relationship between the person and the question (the item). The person dominates the item if she gives the positive response, and the item dominates the person if she gives the negative response. (van Schuur, 2011, p. 16)
With a large number of survey items and respondents, one can analyze four types of dyadic dominance relationships: item-to-subject, subject-to-item, item-to-item, and subject-to-subject. Without measurement errors, this scaling approach can produce a transitive rank-order among all items based on the “difficulty” parameter and a transitive rank-order among all items based on the “discrimination” parameter. The latent dimension of ability (or other latent traits, such as effort, ideology, attitude, etc.), therefore, is inferred and scaled based on the cumulative probability of giving a positive response identified by the difficulty and discrimination parameter.
Both Rasch (1960) models and the Mokken (1971) scale, for example, define the probability of observing a positive response to a survey (or test) item based on the respondents’ latent traits and one or more item parameters. Rasch models, known as one-parameter logistic IRT models, only include item difficulty as a determinant of observed responses. Mokken scaling adds a specific discrimination parameter for each item and make IRT models more flexible for fitting different empirical datasets. Hence, Rasch models can be viewed as a unique case of the Mokken scale, where the item discrimination parameter is restricted to be a constant.
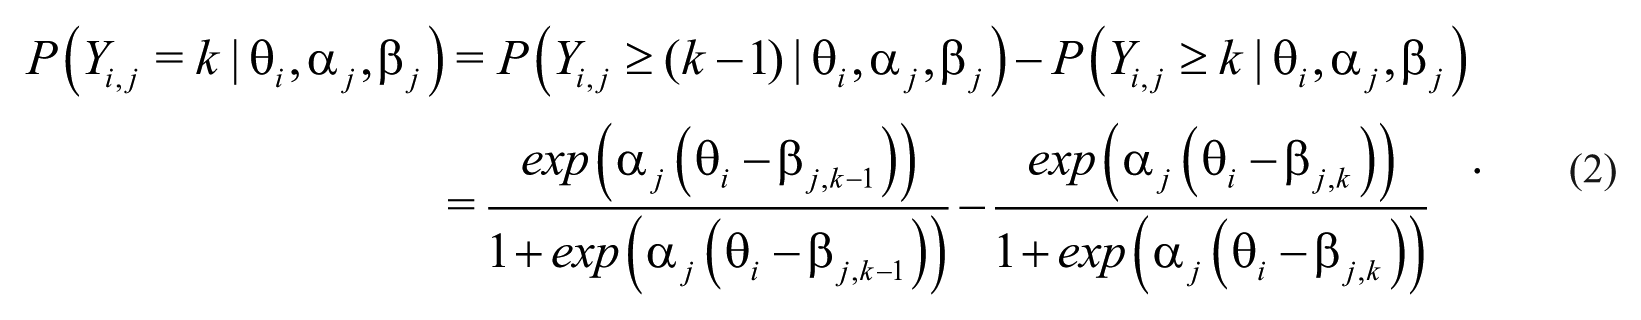
When applying the IRT (Mokken) approach to ordinal responses, the model essentially becomes a cumulative rating scale model or a partial credit model (Anderson, 1997; Masters, 1988; Samijima, 1969). Ordinal response items in networking studies often generate a scale based on ordered categories. The survey question may ask a respondent using letter grades, A, B, C, and D (ordered from low to high), to indicate the effort of his networking activities. A survey item may also ask a respondent the frequency of her networking activities, rendering a scale, ordered as never, yearly, monthly, weekly, daily, and more than once per day. Attitude items, in addition, normally produce an ordered scale ranked by strongly disagree, disagree, agree, and strongly agree. Compared with the dichotomous survey items, ordinal items, or more generally, polytomous items increase the statistical information (Ostini & Nering, 2006) that researchers can use to infer managerial ability or effort of networking.
Let the latent dimension of networking effort for

The cumulative probability of choosing the lowest category and above is assumed to be 1 and the probability of choosing above the highest category is 0. As for a
Considering Uncertainty in Parameters: A Bayesian Approach
The Bayesian IRT approach we propose shares the same theoretical foundation with non-Bayesian IRT models, but explicitly acknowledge uncertainty in parameters. Reporting bias and the issue of cross-item compatibility can both change the perfect rank-order estimated based on the difficulty and discrimination parameter. The IRT conceptualizes measurement bias as the violation of a transitive relationship between items and subjects. Bias, counted as “reporting errors” (or “wrong answers”), thus, can be estimated through evaluating the homogeneity of individual items based on pairwise information extracted from each item pairs (van Schuur, 2011). Figure 1 illustrates how the pairwise association may look like between two ordinal survey items. In Figure 1, both items are coded based on a 1-to-6 ordinal scale, and each circle indicates the frequency of all possible dyadic values, whereby a large circle refers to high frequency and small circle refers to low frequency. Ideally, if Items 1 and 2 are created to measure the same latent construct, the association between the two items should only be caused by their common associations with the latent factor. Local independence is a key underlying assumption of latent variable models, which requires that the observed items are independent from each other given an individuals’ score on the latent variable. When this assumption holds, the tabulation of the two items would be a more cumulative pattern, such as a lower or upper triangle (Torenvlied et al., 2013). The pattern in Figure 1 demonstrates the violation of this local independence assumption. From the tabulation of all 36 possible pairwise values between the two items, three pairs (25, 26, and 62) are not observed. Most observed information concentrates on the dyadic combinations, when both Items 1 and 2 take values greater than 2. When the local independence assumption is violated, the estimated latent variable does not fully account for the associations between the observed items. Moreover, Figure 1 shows that individual respondents are more likely to check high values for Item 1 than for Item 2, indicating different item difficulty levels of the two items. Classic factor-analytic models do not fully account for heterogeneity in item difficulty.
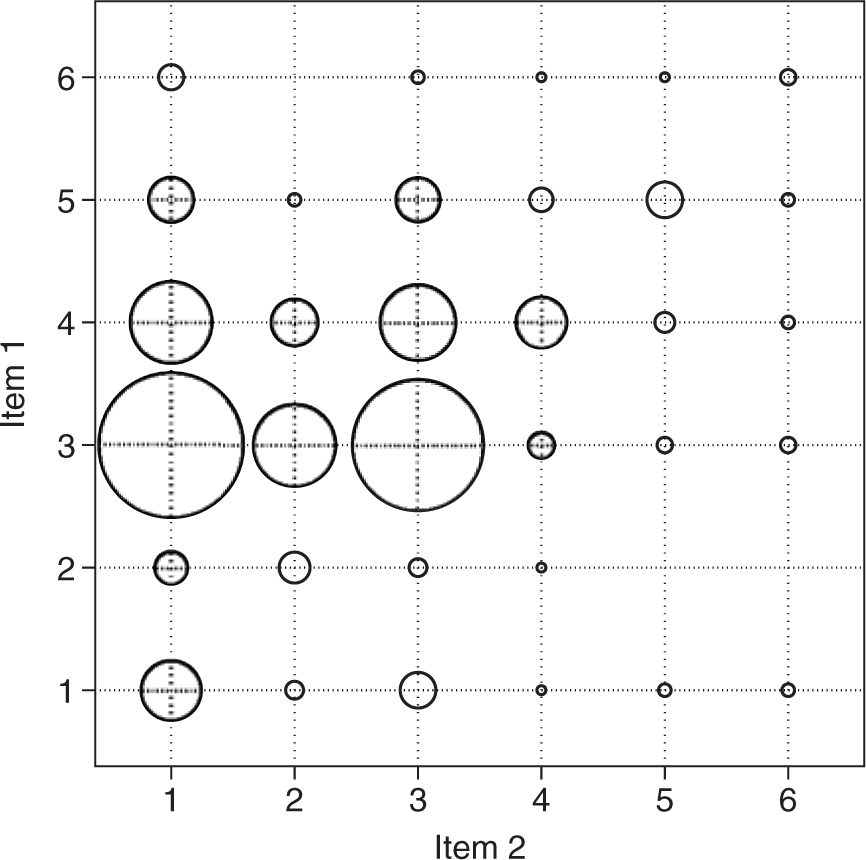
An illustration of the association between an item pair.
The key challenge to measure a latent trait based on observed survey items is that we do not know the true measurement score of the latent construct. We empirically estimate the latent traits and measurement errors simultaneously. In standard non-parametric IRT, this procedure results in point-estimates for the discrimination and difficulty parameter Thus, when observing data as shown in Figure 1, it is difficult to model the uncertainty in parameters. The Bayesian IRT approach becomes particularly appealing to handle such measurement issue, because neither the latent traits, nor the item parameters need to be treated as deterministic.
Re-arranging the likelihood function expressed by Equation 2, we define the probability of manager

To simplify the mathematic notation, in Equation 3, we use Z(
In the context of estimating a full Bayesian model, all the parameters in

Using the Bayesian approach, one not only can obtain the point estimation (e.g., posterior means) of managerial networking (
Comparison of the Assumptions of Three Implicit Measurement Strategies.
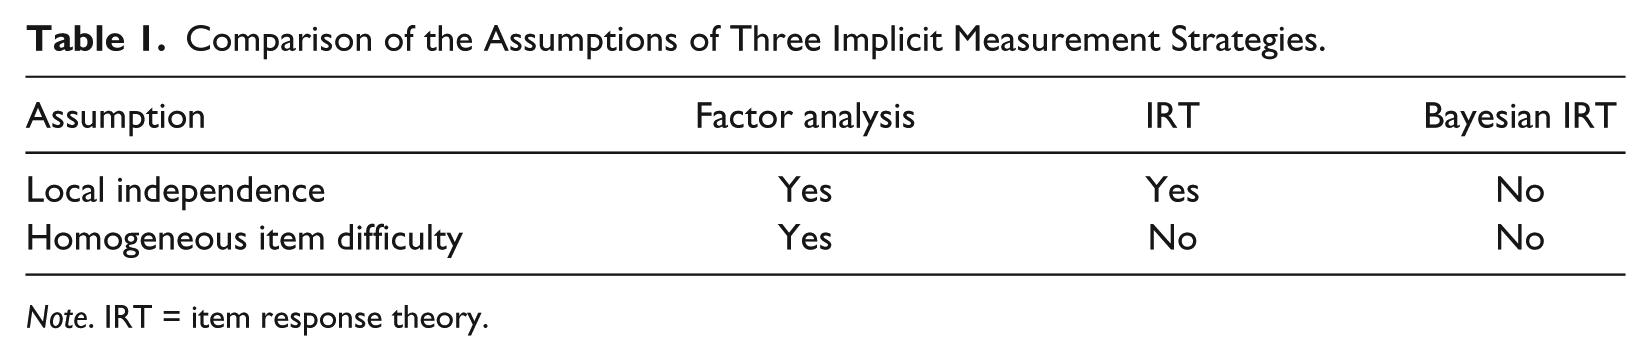
Note. IRT = item response theory.
An Empirical Application: Comparing Three Measures of Managerial Networking in American Hospitals
Data
The empirical data, which we use to illustrate the Bayesian IRT approach to measurement, are drawn from a mail survey of 6,000+ professional health care organizations, including general hospitals, specialized hospitals, mental health clinics, children’s hospitals, university-owned medical centers, rehabilitation centers, and acute long-term care organizations (Johansen & Zhu, 2014). The survey was administrated from December 2010 to March 2011 and generated 1,004 responses, rendering an overall response rate of 15.85%. Although the overall response rate is not high, it is quite comparable with other large-scale surveys on American hospitals. 3 We perform a logistic regression analysis to check if response rates vary substantially by organizational type, region, state, service type, and organizational size. Our sample does not vary substantially along all these indicators excepting organizational type.
The survey uses a name-roster method, providing top-level hospital administrators an elaborate list of networking nodes. To measure managerial networking, we use 12 nodes from the list that capture different types of external partners (see Figure 2). 4 Each survey item is measured by a 1-to-6 ordered scale ranking the frequency of interactions between a manager and her networking partners. The order scale is defined as 1 = never, 2 = yearly, 3 = monthly, 4 = weekly, 5 = more than once a week, and 6 = daily. This approach is analogous to that used by Agranoff and McGuire (1999), Meier and O’Toole (2001), and others in defining managerial networking as an activity that crosses organizational boundaries. In other words, this survey design focuses on measuring the behavioral traits of managerial networking, not the structural characteristics of networks.
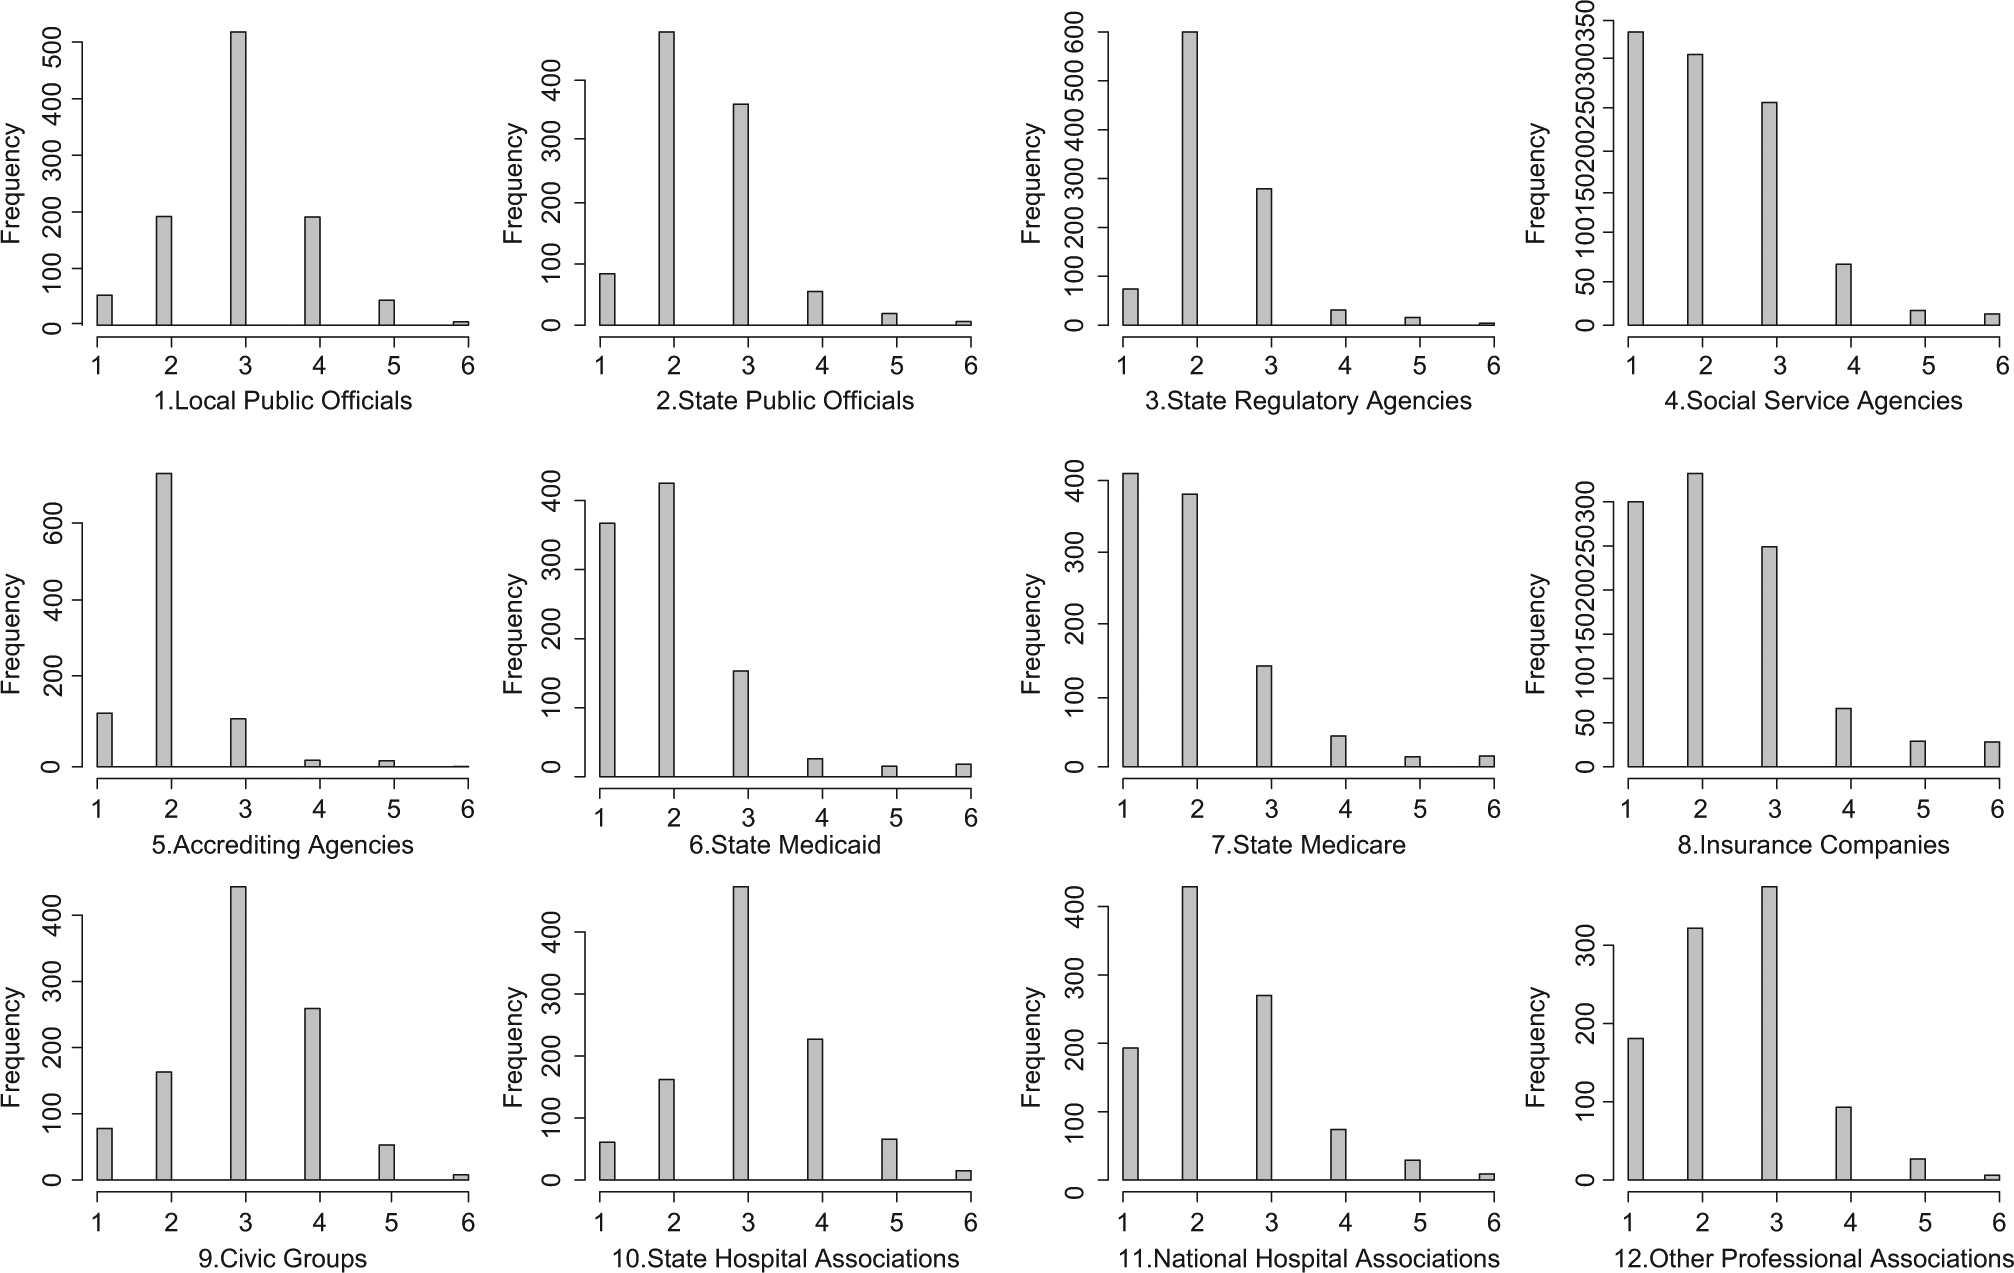
Frequencies of managerial networking with 20 external partners (1 = never and 6 = daily).
In our sample, there are 338 government-owned (primarily non-federal hospitals), 480 non-profits, and 195 for-profits hospitals. Given that survey response rates vary across organizational ownership (see Table 2), we estimate a logistic regression model predicting survey response rate. We include hospital service type, geographic location (state and American Hospital Association [AHA] service area), ownership, and hospital size as predictors in the logistic regression model. As such, we examine whether these factors affect survey response rate, if so, whether the size of non-response bias is troublesome. Table 3 reports detailed information about response rates by hospital ownership and the logistic regression model. Although survey response rates vary across hospital ownership types, the non-response bias introduced by ownership is not very large, with a negative coefficient of −0.038. Geographic location and hospital size both significantly predict survey response rates, but their substantive impacts are also minimal. In this section, in which we analyze the relationship between managerial networking and hospital performance, we control for different organizational types.
Survey Response Rates by Organizational Type.
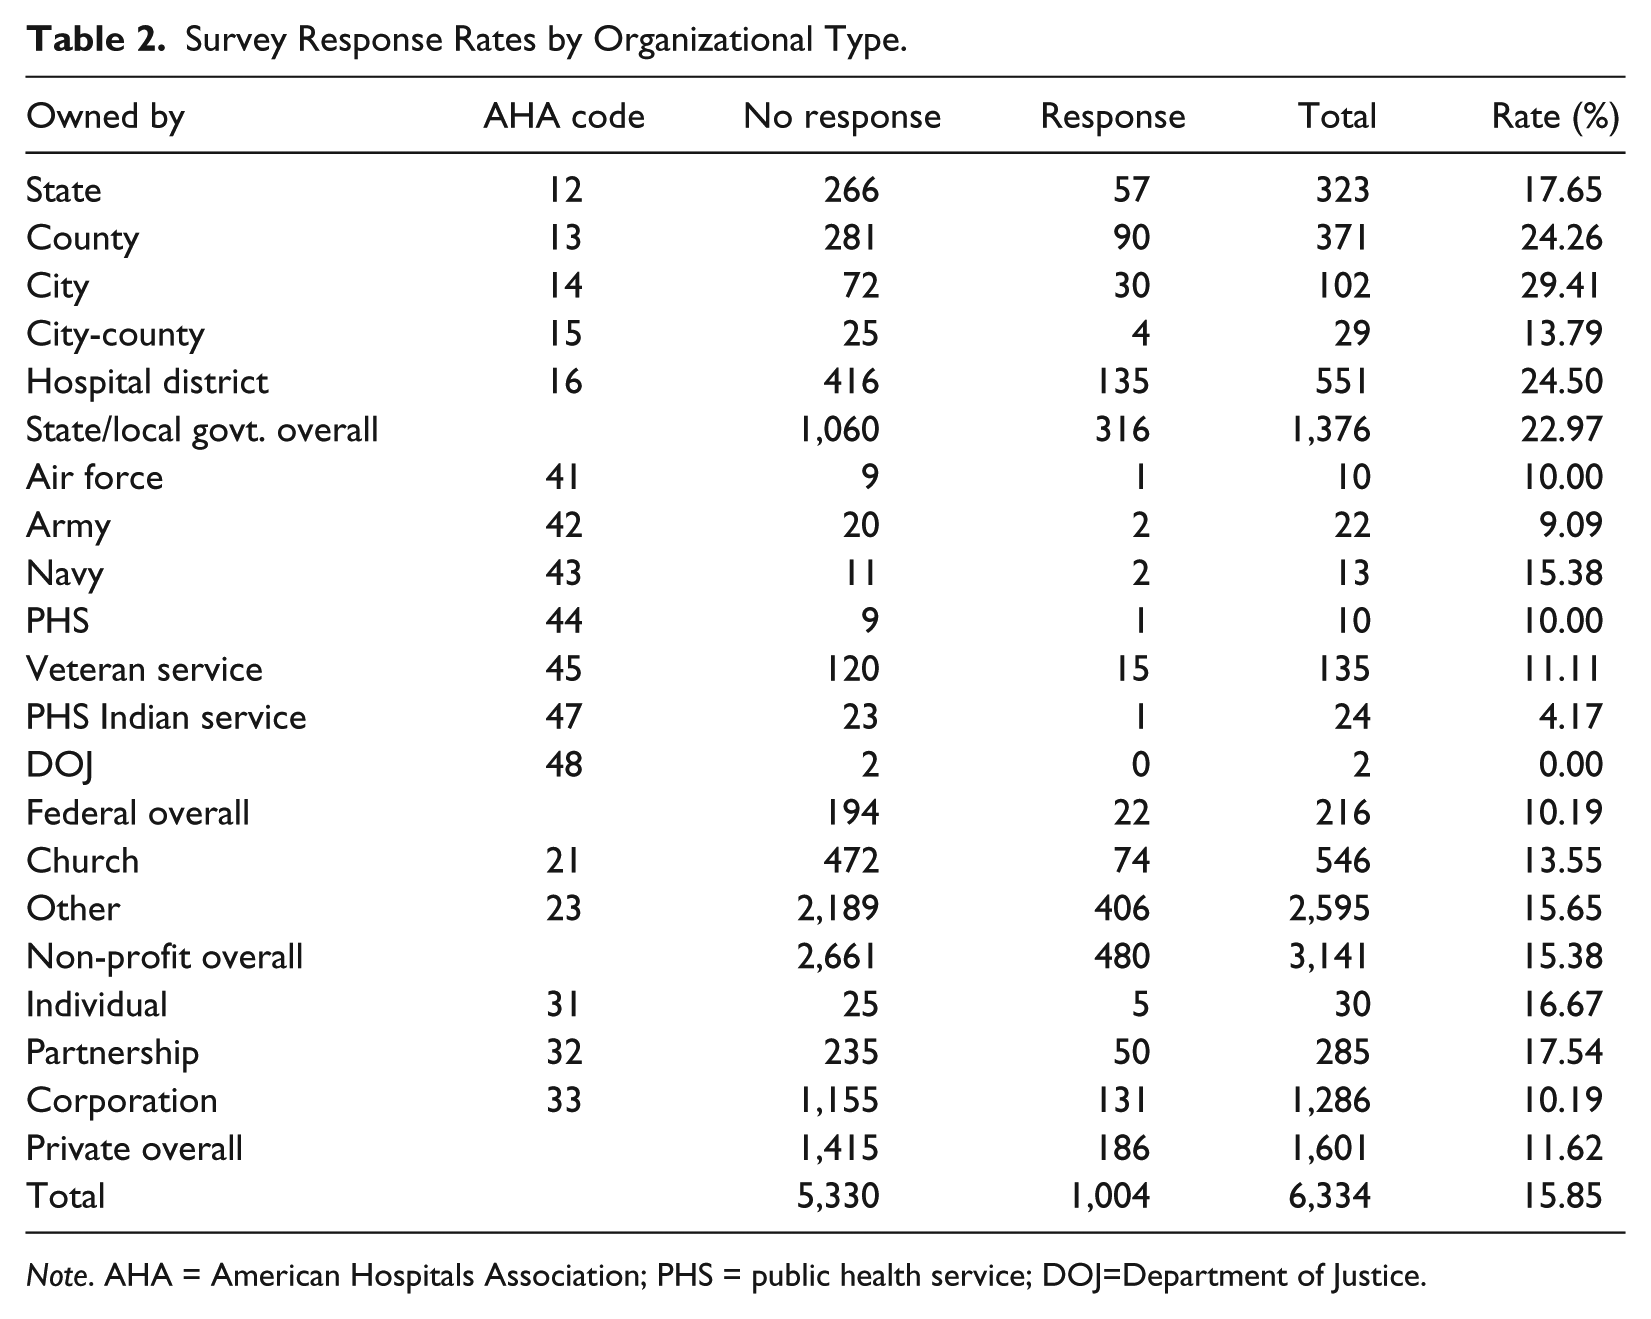
Note. AHA = American Hospitals Association; PHS = public health service; DOJ=Department of Justice.
Logistic Regression Predicting Survey Responses (1 = Response, 0 = Non-response).
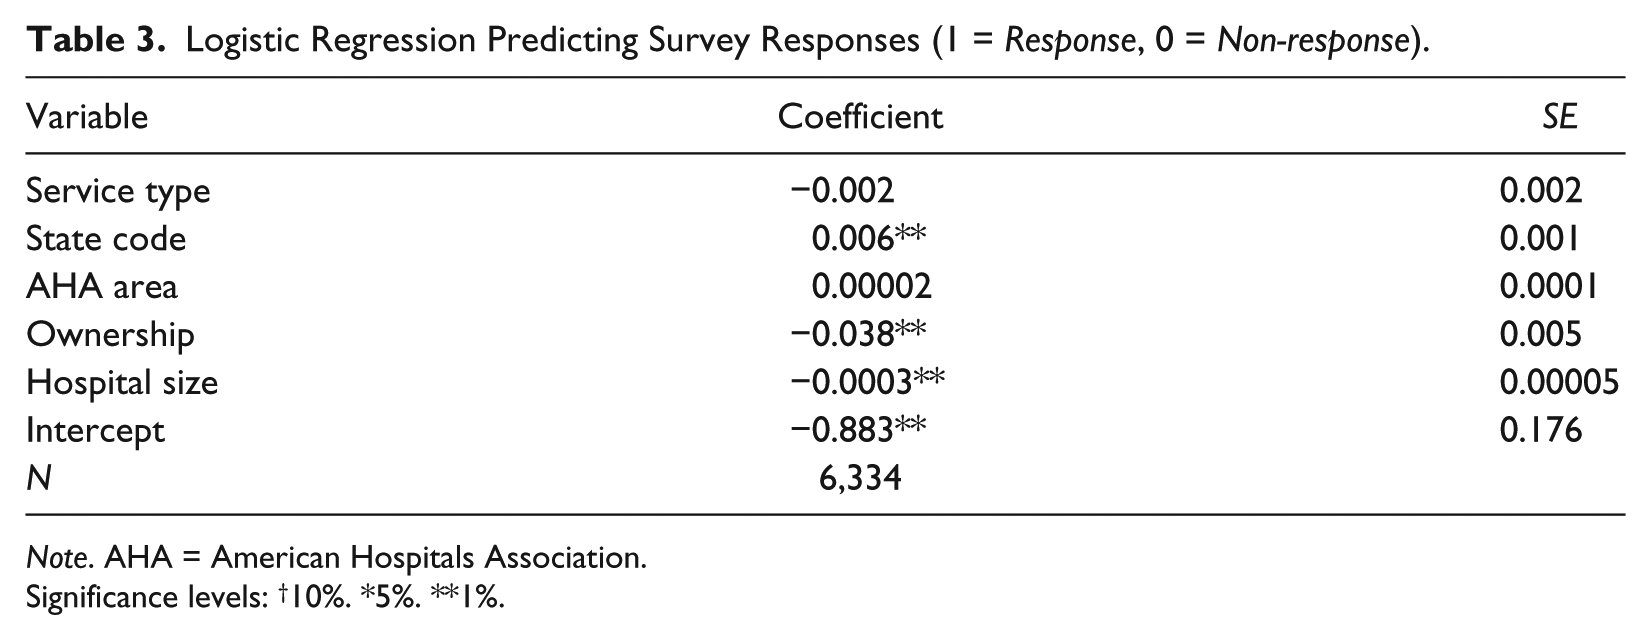
Note. AHA = American Hospitals Association.
Significance levels: †10%. *5%. **1%.
Three Measures of Managerial Networking
We use three different measurement approaches to estimate the latent dimension of managerial networking: (a) factor analysis, (b) a Generalized Partial Credit Model (GPCM) in an empirical Bayes context, which essentially applies the Mokken scale analysis to polytomous survey responses, and (c) a full Bayesian GPCM. Using the stats package in R, we estimate a factor index using the principal factor analysis and recover managerial networking by predicting the first factor score. The empirical Bayes IRT scale is estimated by fitting a GPCM using the ltm package in R in a non-Bayesian setup. The latent scale of managerial networking is predicted using the empirical Bayes method after fitting the IRT model using the gpcm( ) function (Rizopoulos, 2006).
5
As for estimating the full Bayesian IRT scale, we use R and JAGS to implement the Bayesian GPCM. The Bayesian GPCM returns a full set of discrimination parameters (
Because prior specification can affect the results of Bayesian inferences (Gelman, Carlin, Stern, & Rubin, 2003; Gill, 2008), we follow Gelman (2006), Li and Baser (2012), and Treier and Jackman (2008) and specify diffuse priors with zero-mean and large-size variance to all parameters.

We specify
After estimating the three managerial networking indices, we compare them by evaluating measurement reliability and predictive validity. We then use Monte Carlo experiments to assess bias-reduction moving from the factor index to the full Bayesian IRT index.
Measurement reliability
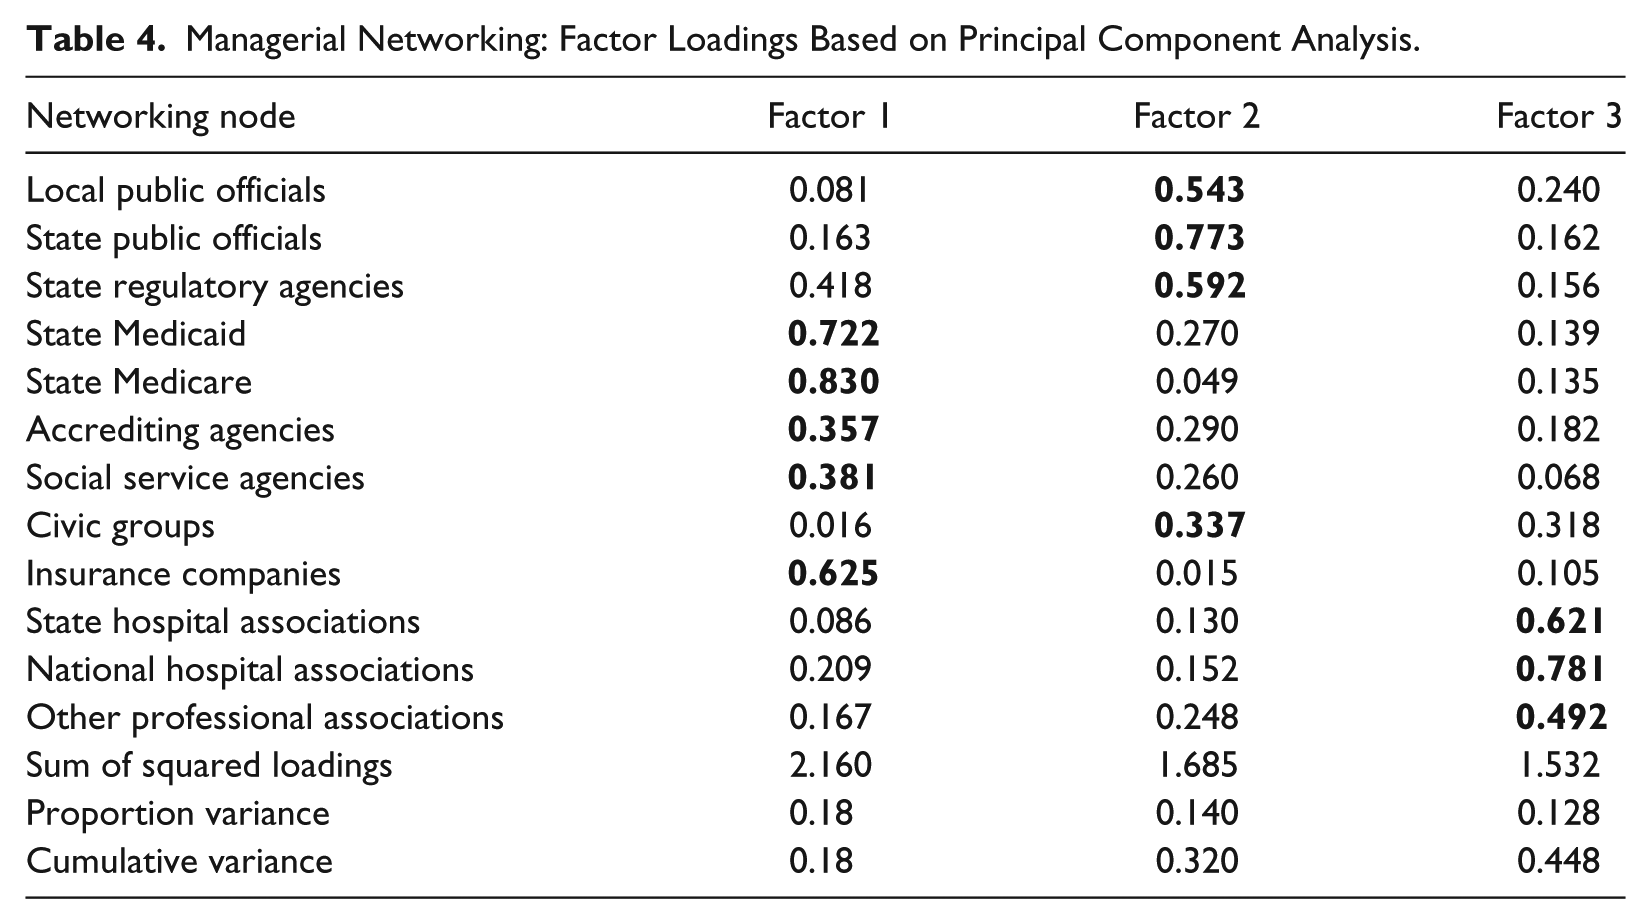
Table 4 reports results from the principal factor analysis, which shows that the 12 managerial networking items do not load on one single factor but on three factors. The first factor is driven by contact with financial stakeholders, such as state Medicaid, Medicare, and insurance complains. The second factor is driven by contact with political officials, and the third factor reflects contact with peer organizations. The factor index of managerial networking is predicted based on the first dimension. As a result, the index performs poorly in recovering data information efficiently. Figure 3 plots factor loadings along the first two dimensions. It shows that only about 34% information is retained in the networking index based on the first dimension.
Managerial Networking: Factor Loadings Based on Principal Component Analysis.
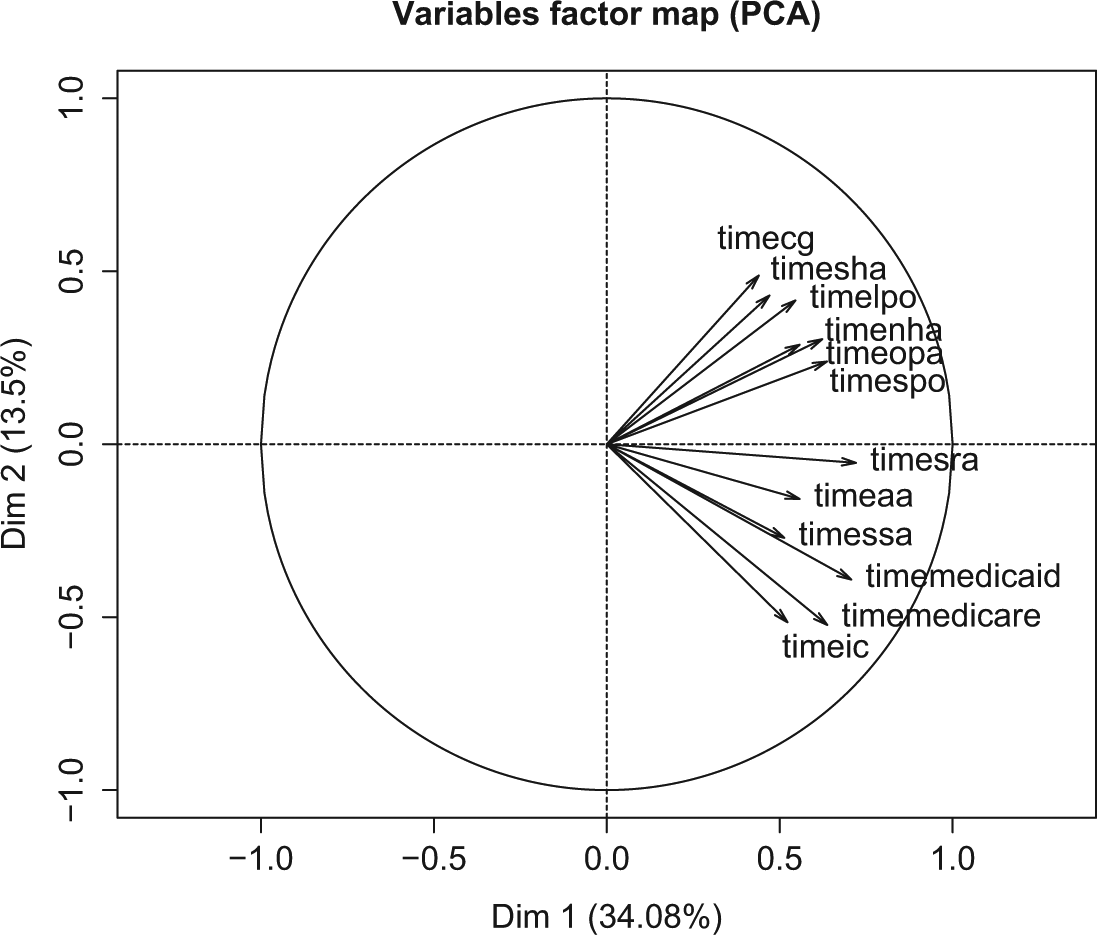
Plot factor loadings along the first two dimensions (based on principal component analysis).
Ignoring cross-item and cross-choice heterogeneity, the networking measure produced by factor analysis is influenced by survey items that have distributions strongly skewed toward the low-frequency end. The non-Bayesian IRT model improves the factor index by making explicit assumptions about how each networking item and networking choices within each networking item contributes to the latent networking index. The issue of intra-item and intra-choice heterogeneity, however, still leads to some issues in parameter estimation when fitting a non-Bayesian GPCM. Figures 4 and 5 illustrate item information curve (IIC) and item characteristic curve (ICC) by each choice category. IIC indicates how an item is located on the latent networking scale,
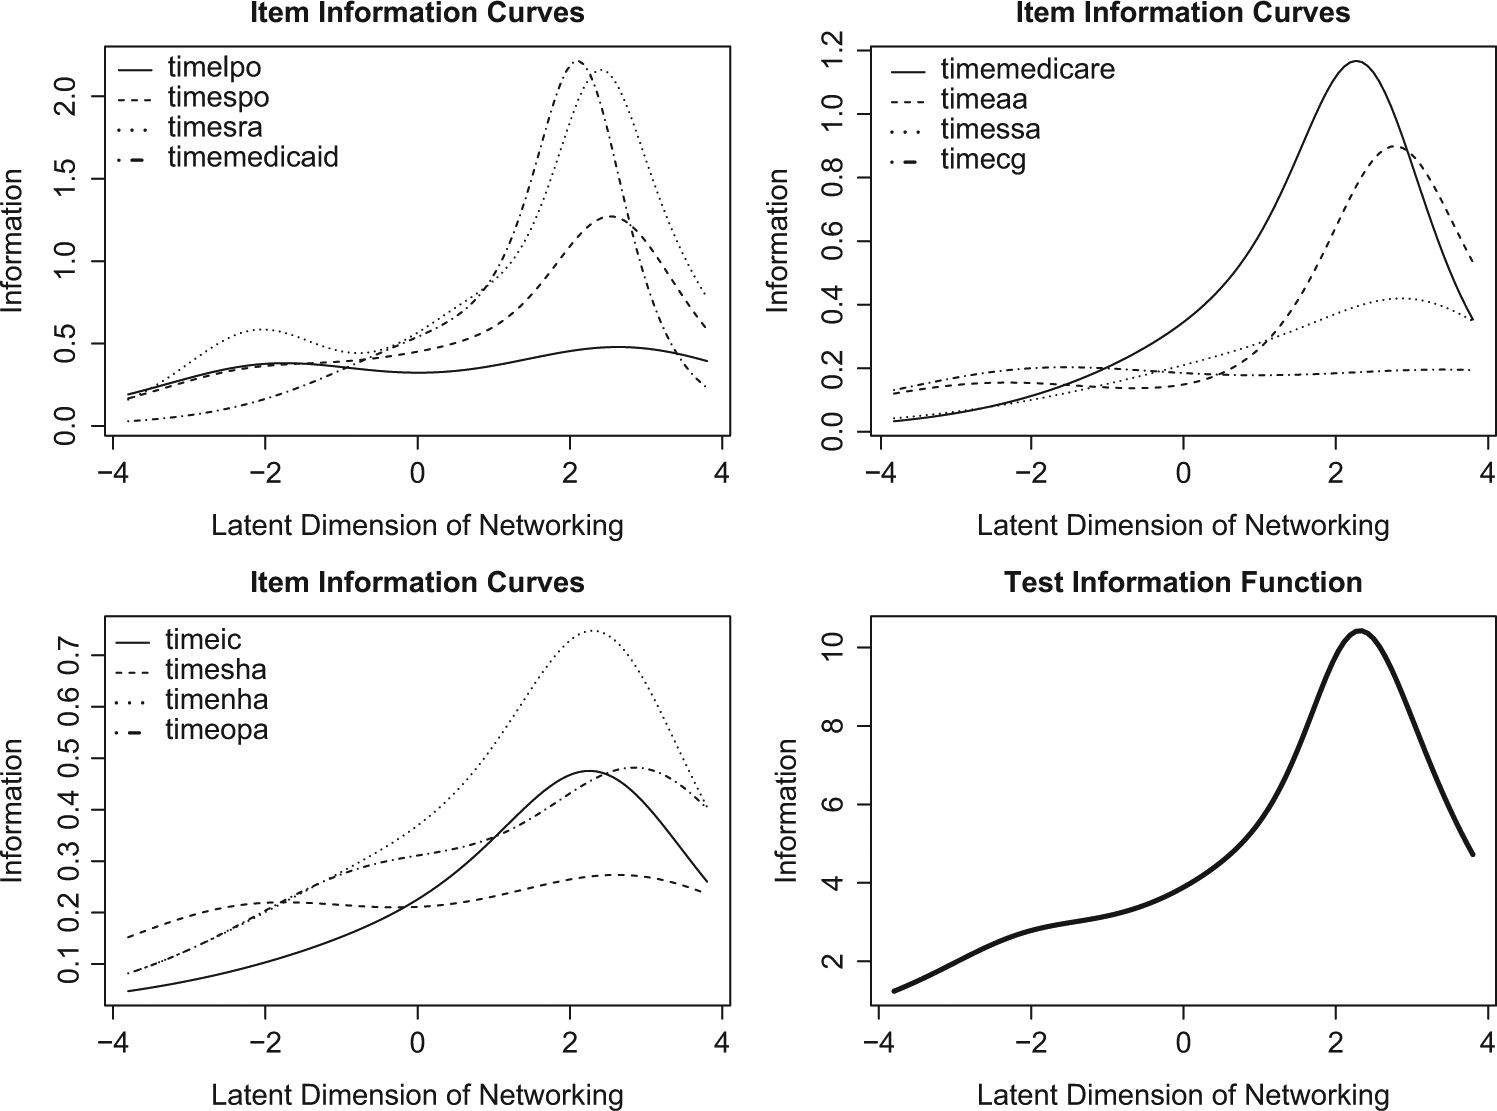
Item information characteristic curves based on the non-Bayesian Generalized Partial Credit Model.
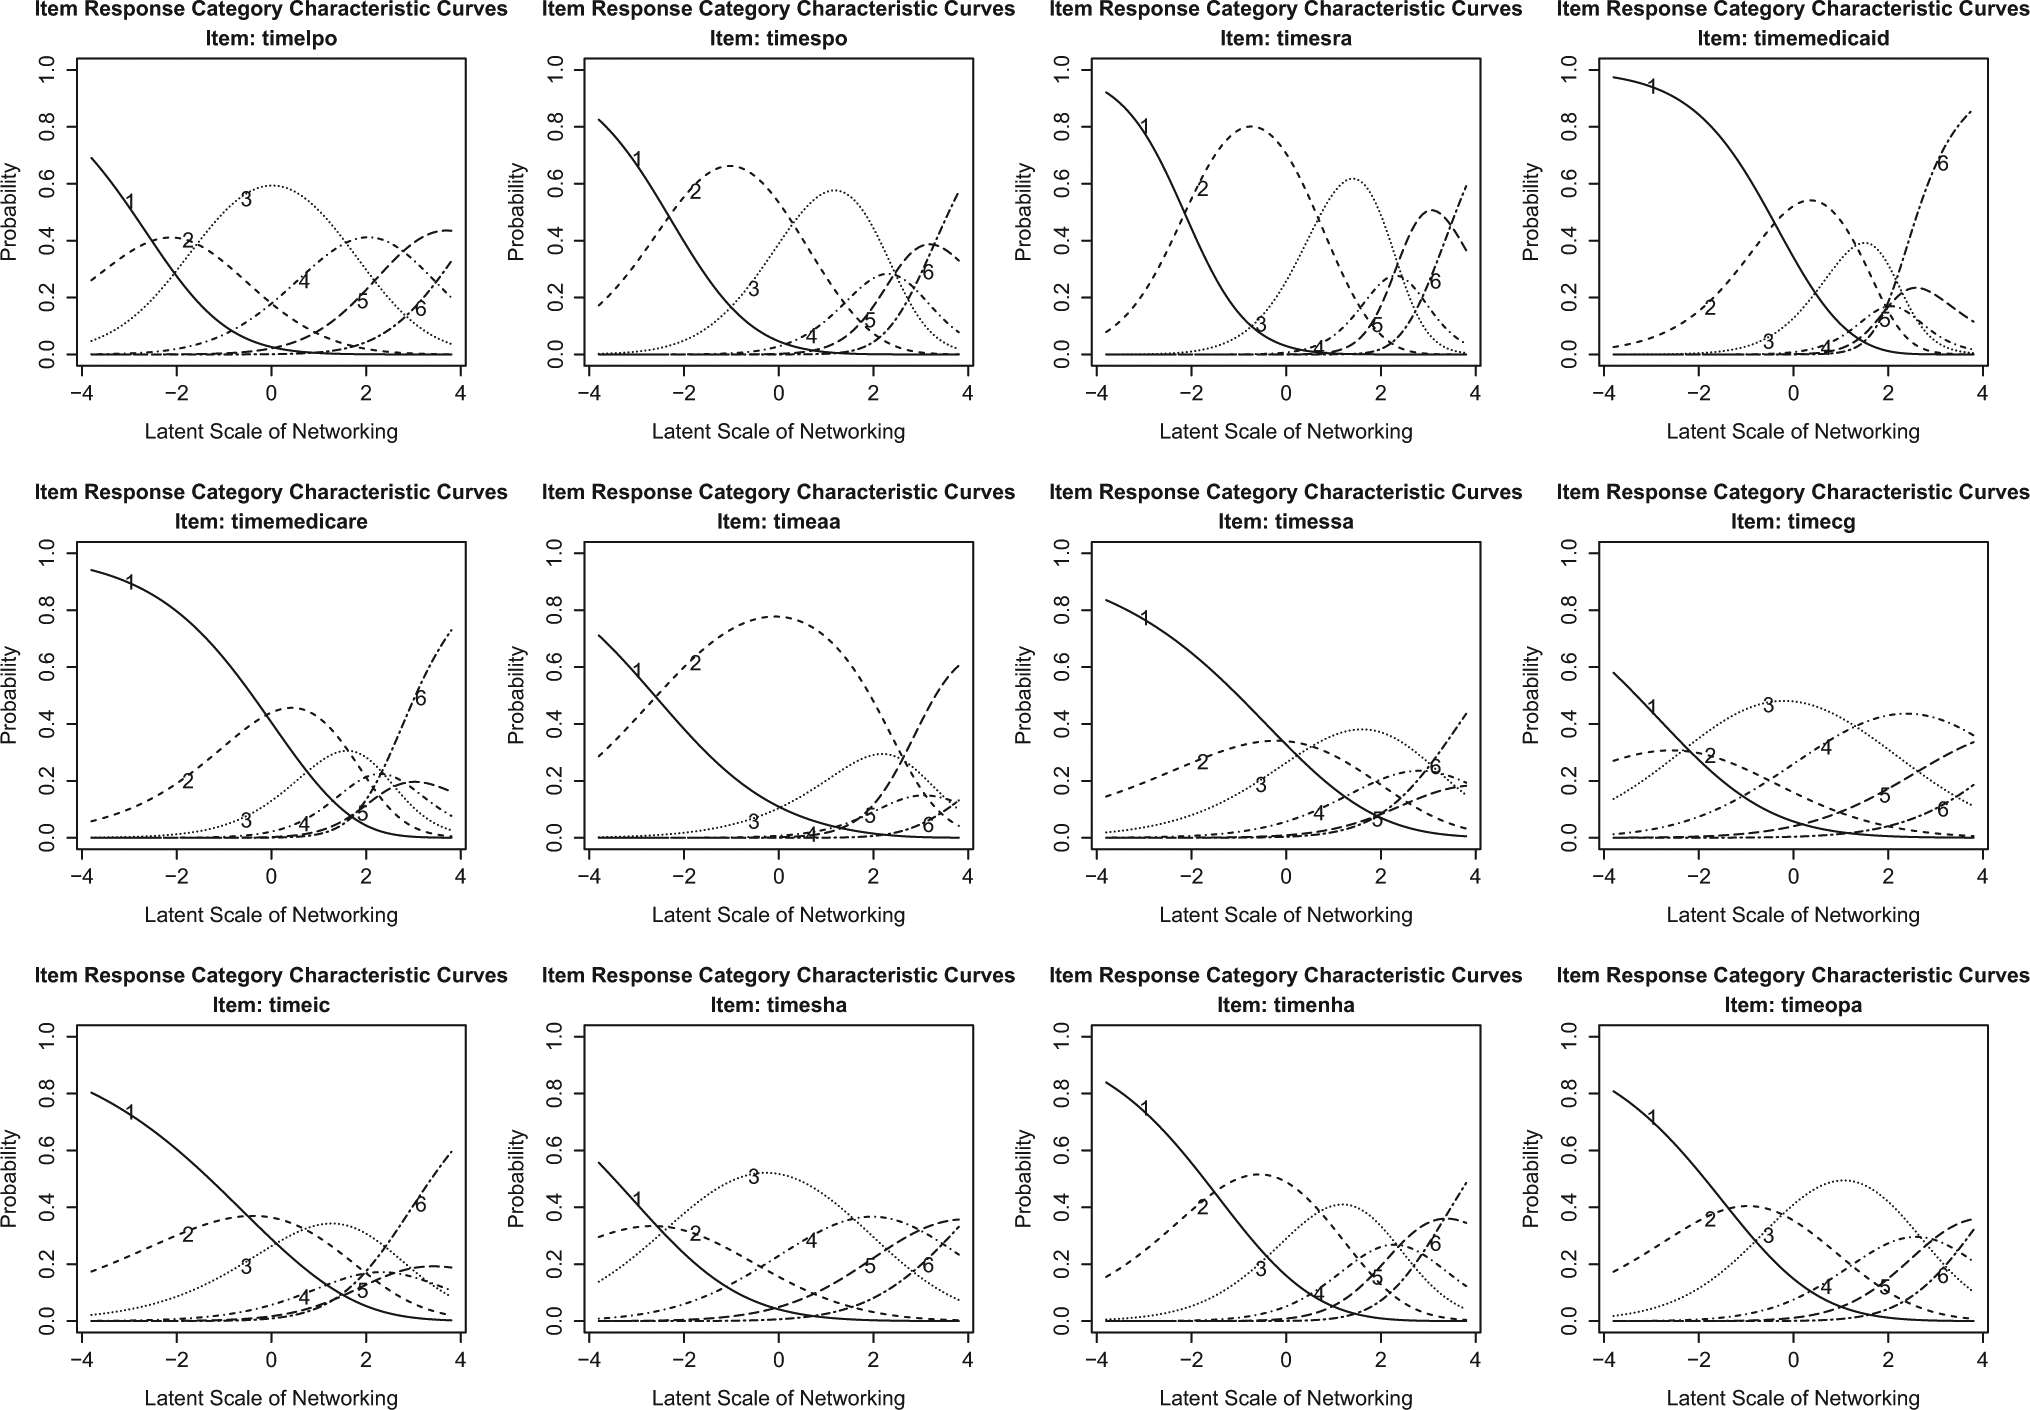
Item category characteristic curves based on the non-Bayesian Generalized Partial Credit Model (Category 1 = never, Category 2 = yearly, Category 3 = monthly, Category 4 = weekly, Category 5 = more than weekly, Category 6 = daily).
It is evident that the issues of inter-item and inter-choice heterogeneity still lead to problems in parameter estimation when fitting a non-Bayesian IRT GPCM. Comparing the by-item and overall IIC with the posterior mean distribution inferred from the Bayesian IRT model, the measurement scale returned by the Bayesian analysis converges to a normal distribution, whereby comparable information is measured for values below and above. Overall, the two IRT indices (empirical Bayes GPCM and full Bayesian GPCM) produce comparable estimation of item discrimination parameters and item difficulty parameters (see Statistical Appendix, Tables 1 and 3).
Figure 6 further compares the two IRT indices with the factor index. Figure 6 shows that the overall measurement agreement among the three networking indices is high, with pairwise correlations all being greater than 0.9. The two IRT indices, however, perform better than the factor index to score extremely low and high networking activities. Specifically, the factor index overestimates the networking scores in both the low- and high-end. In other words, compared with the two IRT indices, the factor index is more likely to assign relatively high networking scores to respondents (i.e., managers). The two IRT indices, in addition, produce comparable results (near 1 Pearson correlation), but the Bayesian IRT approach is superior with respect to estimating the networking scores for cases with extreme values. It is important to recall that many of the individual node frequencies were strongly skewed, making sensitivity to extreme cases an important characteristic of any relevant technique.
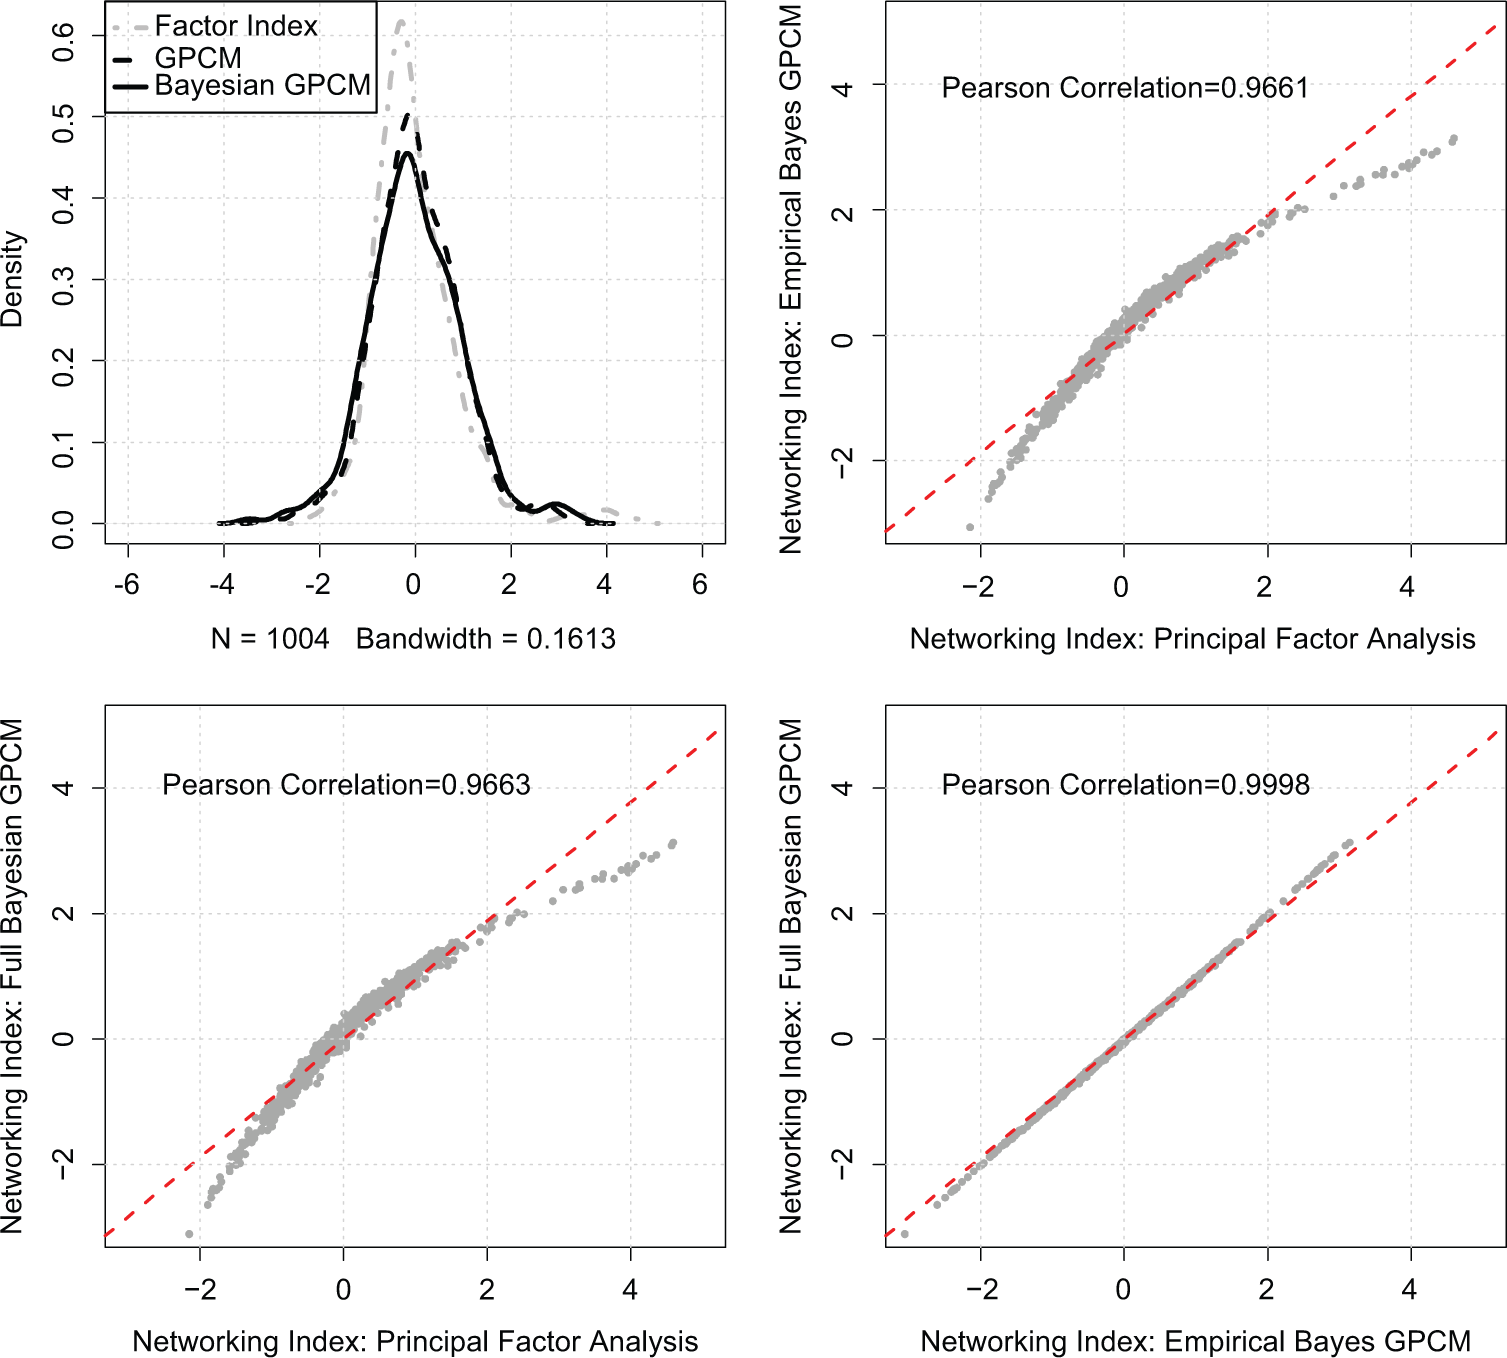
Measurement agreement among the three measures of managerial networking: Factor index, empirical Bayes GPCM index, and full Bayesian GPCM index.
Comparing predictive validity
To evaluate the predictive validity of the three networking measures, we estimate linear models for two hospital performance measures: total emergency room (ER) visits and total outpatient visits.
9
Following O’Toole and Meier (1999), we specify hospital performance
The two performance measures (ER and outpatient visits) are drawn from the AHA FY 2010 Annual Hospital Survey Database. They are both scaled based on a log-transformation of the total counts, with greater measurement values representing more organizational outputs. Data on past performance are drawn from the AHA FY 2009 survey database. Also drawn from the AHA 2010 database are a battery of organizational resource variables, which are critical to service production. Total Employee is a 1-to-20 ordinal scale that measures the level of total full-time and part-time hospital employees. Total Facility Expenditure measures the level hospital facility expenses (including bad debt) for service production. It is also measured based on a 1-to-20 ordinal scale, with greater measurement scores reflecting more expenses. Hospital Size measures the facility capacity of hospitals, which is a 1-to-8 ordinal scale, whereby “1” means 6 to 24 beds, and “8” means 500 or more beds in a hospital. Managerial Tenure is drawn from our hospital management survey and measures the total number of years a respondent has been a hospital manager. Because managers in different sectors place different priorities on the efficiency of service production, we also include two dummy variables for public and non-profit hospitals (Johansen & Zhu, 2014). Private hospitals are omitted as the baseline category. Because American hospitals are mostly connected within local providers’ networks and rely on these formal networks to reach out to clients, we include two additional dummy variables to measure if a hospital is in a Health Maintenance Organization (HMO) network or in a Preferred Provider Organization (PPO) network.
For each performance measure, we estimate three models, using the same model specification, but alternating managerial networking variables. As such, the only difference across the three models is the managerial networking index, and we can compare coefficients across models to evaluate their predictive validity. We estimate all performance models using the ordinary least square (OLS) estimator with clustered standard errors by service types. 10 This is to control for heterogeneity across hospitals due to different service specialization. In addition, we include a full set of state-fixed effects in all models to control for unobserved heterogeneity.
Table 5 reports three models taking total ER visits as the performance measure. Model 1 uses the factor index of managerial networking, Model 2 includes the empirical Bayes IRT networking index, and Model 3 includes the full Bayesian IRT networking index. Models 1 to 3 all report positive associations between managerial networking and hospital performance measured by total ER visits. The estimated coefficient size, however, changes across the three models. Overall, models using the two IRT indices yield greater coefficients than the one reported in Model 1.
The Association Between Hospital Performance (Emergency Room Visits) and the Three Managerial Networking Measures.
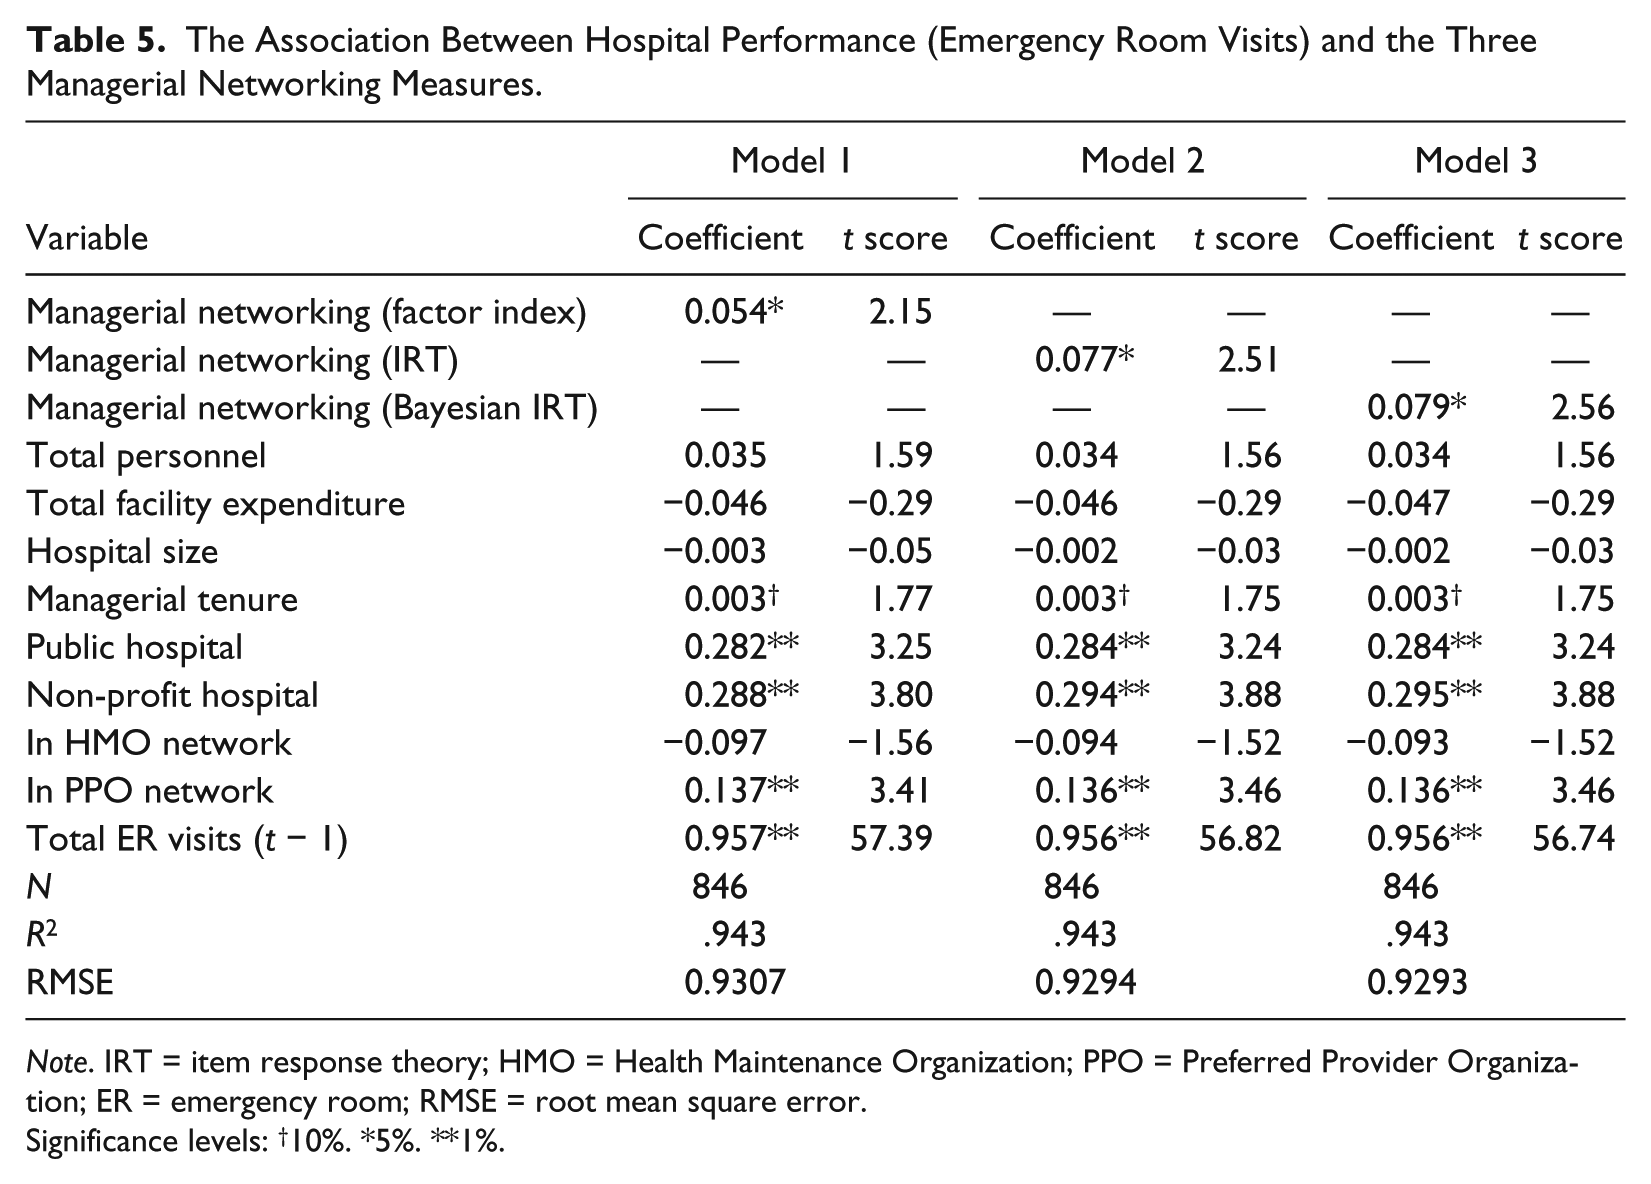
Note. IRT = item response theory; HMO = Health Maintenance Organization; PPO = Preferred Provider Organization; ER = emergency room; RMSE = root mean square error.
Significance levels: †10%. *5%. **1%.
Models 4 to 6 in Table 6 reveal a similar pattern. All three models report positive associations between managerial networking and hospital performance measured by total outpatient visits. Using the factor index, the estimated slope of networking management is 0.095 and statistically insignificant. Models 5 and 6 yield comparable slope coefficients, which are 0.120 and 0.124, respectively. Both coefficients, moreover, are statistically significant. Based on the point estimation of the slope coefficient, Model 4 seems to underestimate the impact of managerial networking on hospital performance. The comparison also suggests that the factor index may contain greater measurement error than the other two networking measures, because measurement error attenuates coefficient estimates. Last, comparing the three models in Tables 5 and 6, the two models using the full Bayesian IRT index produces the smallest root mean square error (RMSE) statistics (i.e., the best model fit by comparison). 11
The Association Between Hospital Performance (Outpatient Visits) and the Three Managerial Networking Measures.
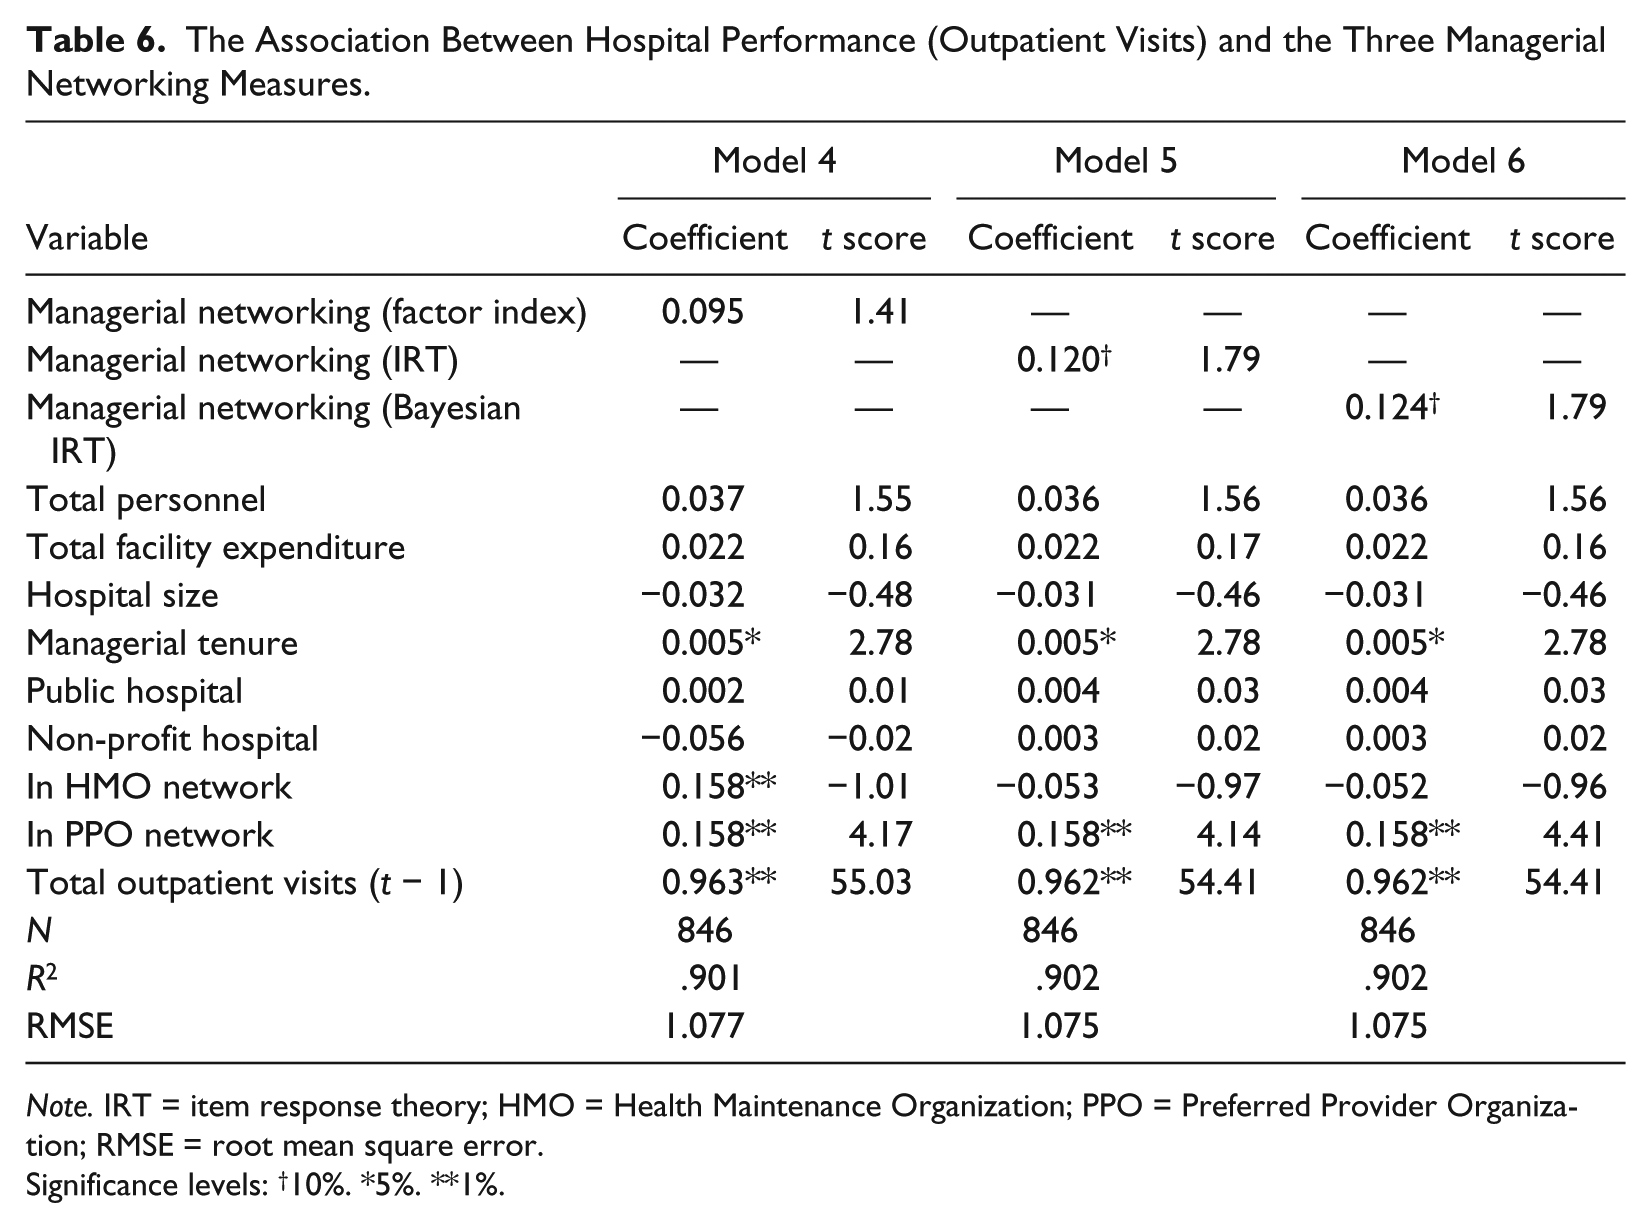
Note. IRT = item response theory; HMO = Health Maintenance Organization; PPO = Preferred Provider Organization; RMSE = root mean square error.
Significance levels: †10%. *5%. **1%.
Reduced influence of measurement bias: Monte Carlo experiments
Tables 5 and 6 provide a straightforward comparison regarding how the point estimation of the slope coefficients would change by using the three different networking measures. All these parameter estimates, however, are computed based on one observed sample of managerial networking. Because we do not have repeated samples of Hospital managers, we use Monte Carlo simulation exercise to shed light on relative bias of parameter estimates for these competing models (Robert & Casella, 2010). For each set of three models, we conduct four Monte Carlo experiments with sample sizes to be 50, 100, 600, and 850. The first two experiments (ns = 50 and 100) reflect small samples and the latter two (ns = 600 and 850) reflect relatively large samples in a typical empirical application. 12 Figure 7 reports the results based on the above-noted Monte Carlo experiments for Model 1 to 6. Figure 7a summarizes Monte Carlo results for Models 1 to 3 in the four different experiments. In all four experiments, the model includes the full Bayesian IRT index (Model 3) outperforms the other two models in terms of producing the smallest relative parameter bias. In the two experiments with relatively large samples sizes (ns = 600 and 800), relative parameter bias introduced by Model 1 (the model with the factor index) is not very large (less than 4%), but still noticeable. The Bayesian index reduces relative parameter bias in a more substantial way when sample size is relatively small. When the sample size is 50 (i.e., very small), the factor index introduces a substantial amount of relative parameter bias (roughly about 7%), while the Bayesian index is associated with a quite small relative bias (roughly 2.2%). Figure 7b reports Monte Carlo results for Models 4 to 6. Model 6 is the one that uses the full Bayesian networking index. The comparison is quite similar to that shown in Figure 7a. Overall, with a large sample size, all three networking measures perform fine, but the full Bayesian index yields the least amount of relative parameter bias. The influence of measurement bias associated with the factor index (reflected in Model 4) is substantial with a small sample size. Consider Figures 7a and 7b together, and it is clear that the full Bayesian IRT networking index has an advantage over the factor-analytic approach in terms of reducing the influence of measurement bias in statistical models. This advantage is particularly evident when the number of observations is relatively small.
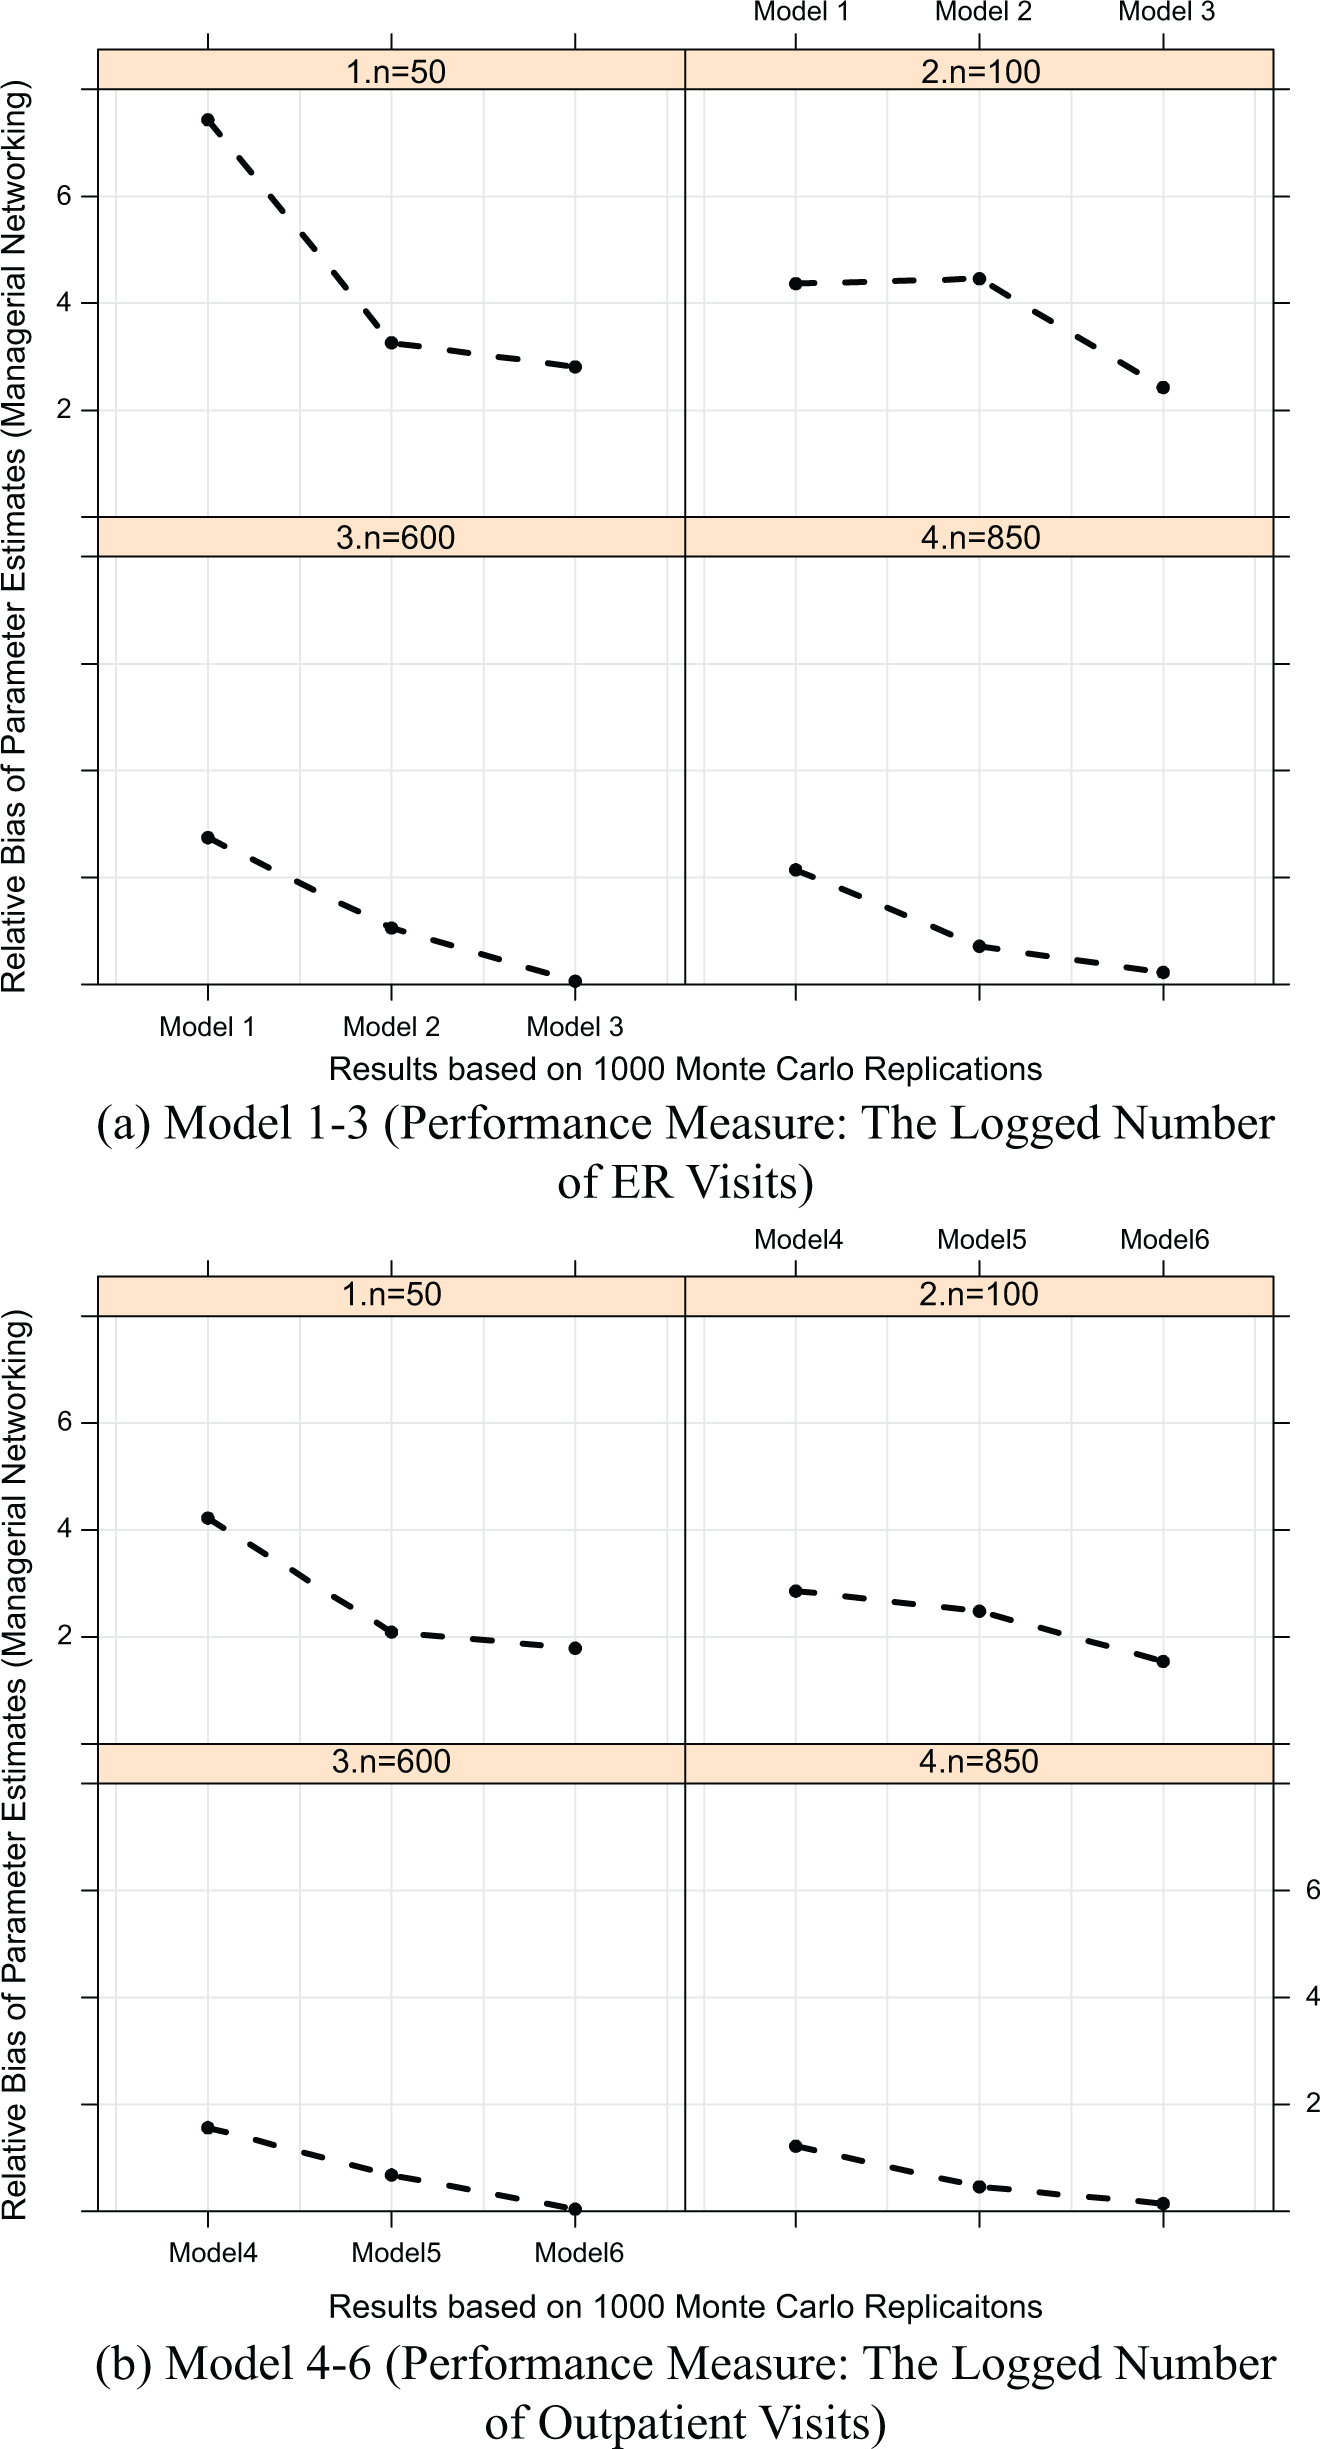
Comparing relative bias of parameter estimates for the three networking indices.
Concluding Discussion
The Bayesian IRT approach to measurement have three key features: the requirement of specifying assumptions about both the measurement items and the latent traits, statistical inferences in probabilistic (distributional) terms, and the flexibility in building complex models to explicitly acknowledge uncertainty in measurement. The requirement of specifying assumptions is particularly useful where measurement theory and conceptions of dimensionality are limited in the literature. The Bayesian IRT approach to measurement is particularly useful to deal with latent traits, which are not direct observable, or have multiple dimensions. It helps to improve measurement reliability and reduce the influence of measurement bias in statistical analysis. The unsettled nature of measurement in relation to collaborative networking is but one example. One could also find this approach useful in other areas with unsettled measurement such as red tape, public service motivation, and organizational performance.
The flexibility of the Bayesian IRT approach allows researchers to develop poorly suited models, especially when researchers operate with small samples and are uncertain about the unknown parameters. The Bayesian approach to measurement is not, though, a panacea to all measurement errors. Bayesian IRT models cannot themselves overcome the limitations of the input data. If the input data includes significant missing data or a small sample (limiting statistical power), strong skew (reducing variation and again limiting statistical power), or unreliable questions (resulting in either high variance or systematic bias in the responses), the Bayesian IRT approach will only allow one to incorporate these problems but will not produce simple or useful measures. The advantage in these cases is that Bayesian IRT makes these problems transparent rather than concealing their presence behind the assumption that resulting factors will always have a mean of zero and a standard deviation of one.
Just as any other statistical approach, researchers often face the trade-off between model flexibility and complexity when using the Bayesian methods. While there is no restriction to building complex model specifications in the Bayesian setup, computation procedures could become time-consuming and difficult as the number of parameters increases in a model. Bayesian models, moreover, cannot be implemented “in a cookbook fashion” (Gill & Witko, 2013, p.485) using off-the-shelf packaged routines in popular statistical packages such as STATA and SAS. When applying the Bayesian approach to measurement bias, researchers need to consider the specific empirical context and carefully develop model assumptions. Various computation tools, such as JAGS, WinBUGS, Stan, and many R packages, are freely available to interested researchers who want to implement Bayesian models using MCMC algorithms. 13
Our primary interest is to provide an alternative to the factor-analytic techniques now common in public administration research. Factor-analytic techniques provide powerful tools for addressing the measurement problems present in key areas of public administration research but bring with them a number of constraining assumptions (often ignored or otherwise concealed from readers). As an alternative, we propose a Bayesian IRT approach to measurement, where these assumptions are transparent and chosen by the researcher rather than imposed by the technique. The appropriate technique will depend on which assumptions are reasonable within the measurement model. If one can reasonably assume that each component item has no error correlation with other items and has homogeneous item difficulty, the traditional factor analysis approach may be appropriate. If differential item difficulty is present, one should move to an IRT approach—a Bayesian one, in particular, if inter-item error correlation may be a problem or if the sample size is small. Nevertheless, measurement errors might vary across different empirical contexts. If the Bayesian approach is to be correctly applied to deal with measurement errors, researchers need to carefully make assumptions about measurement and the underlying data-generating process. We do not recommend the fully Bayesian alternative in all cases, but the choice of simpler measurement models should be considered (and justified) carefully. 14
Of course, this approach is only the beginning of the use of Bayesian IRT in public administration research. We anticipate extending this analysis to including a discussion of missing data in measurement models and the intersection of imputation and IRT models. Furthermore, we would like to compare the measurement of external networking with the allocation of time connecting to internal nodes to assess the degree (or existence) of a trade-off between networking and internal management. Finally, we would like to compare various measurement approaches in the context of performance models. Does one measurement approach create measures that better explain organizational performance? What does this tell us about the nature of organizational performance and the survey reporting of such performance.
The field of public administration has not paid a great deal of attention to issues of measurement (Torenvlied et al., 2013; Whitford & Meier, 2013). As quantitative research extends into areas of study where existing, validated measures do not exist in other fields, it is important for public administration scholars to take measurement seriously. As this article illustrates, the Bayesian IRT approach provides an alternative to carefully assess measures and create what may turn out to be more effective elements for future research. Bayesian measurement applications using other substantive datasets (e.g., Bertelli, Mason, Connolly, & Gastwirth, 2013) will be useful for generalizing knowledge about how to deal with measurement issues in public administration research. As Gill and Witko (2013) prescribe, “the Bayesian approach will continue to gain in popularity” owing to the increase of Bayesian models in the social sciences and various freely available computation tools (p.461). Public administration scholars need to and will increasingly embrace the Bayesian methods as valuable tools to address methodological issues.
Footnotes
Acknowledgements
We thank the editor and the four anonymous reviewers for their thoughtful comments.
Authors’ Note
An earlier version of this paper was presented at the 70th Annual Meeting of the Midwest Political Science Association (Chicago, Illinois), April 2012. All errors remain the responsibility of the authors.
Declaration of Conflicting Interests
The author(s) declared no potential conflicts of interest with respect to the research, authorship, and/or publication of this article.
Funding
The author(s) received no financial support for the research, authorship, and/or publication of this article.