
Abstract
The influence of corruption convictions on government trust is complicated. On one hand, they may reflect the severity of corruption in a jurisdiction. On the other hand, they might indicate the degree of anticorruption efforts. Existing literature has suggested the severity of corruption’s negative effects and the positive effect of anticorruption efforts on institutional trust. This research synthesized existing studies, identified the intellectual puzzle in the literature, and developed open hypotheses to investigate the way in which corruption convictions systematically affect citizens’ trust in government. State-level panel data merged from different sources were used for the empirical analyses. The results showed a positive influence of corruption convictions on public trust in government.
Introduction
Corruption convictions vary across countries and over time. The question addressed in this research was whether more corruption convictions lead systematically to lower or higher levels of trust in government. Existing studies have tested the influence of public corruption on institutional or political trust, using citizen- or country-level survey data and corruption perception measures (e.g., Anderson & Tverdova, 2003; Catterberg & Moreno, 2006; Moreno, 2002). Anticorruption efforts, on the contrary, may help restore public trust in government in both the long and the short run (Christensen & Lægreid, 2008; Guo, 2014; Manion, 2004; E. W. Welch, Hinnant, & Moon, 2005). However, no empirical work has examined the effect of corruption or anticorruption efforts on public trust in government systematically. In the literature, corruption convictions have been perceived exclusively as an objective measure of the corruption level among states (Depken & Lafountain, 2006; Flavin & Ledet, 2013; Liu & Mikesell, 2014; Liu, Moldogaziev, & Mikesell, 2017; Meier & Holbrook, 1992; Rauh, 2016). However, some scholars have suggested that the number of corruption convictions may indicate the prosecutors’ capacities and anticorruption efforts at the state level, because the number of convictions is correlated highly with prosecutors’ resources (Alt & Lassen, 2014). This research attempted to understand the complexity of the relation between corruption convictions and trust in government. We investigated the way in which corruption convictions systematically affect U.S. citizens’ trust in government using state-level panel data from 1979 to 2012. While testing the major relation, other factors, including social, economic, and political contexts, also were considered in the equations.
Corruption and Public Trust
Scholars have conducted anticorruption research from two perspectives. First, corruption is the dependent variable used to explain and predict, as well as to devise ways to reduce corruption (Banerjee, Baul, & Rosenblat, 2015; Choi, 2007; Kwon, 2014; Lambsdorff, 2002). Second, scholars have investigated the consequences of corruption using corruption as the independent variable (Meier & Holbrook, 1992). Within the second group, there are two competing theories in the literature, functionalist and Weberian. These theories illustrate the way in which public corruption shapes citizens’ attitudes or perceptions about government. The functionalist approach, which emerged in the 1960s, holds that corruption might lubricate bureaucratic and political mechanisms that would otherwise hinder development; furthermore, corruption could lessen resources for political violence, and thus favor social integration and capital accumulation (Pharr & Putnam, 2000). The theory also suggests that corruption may help maintain a political system, particularly in developing countries, by providing benefits to political supporters and increasing political loyalty to the government (Bayley, 1966; Chang & Chu, 2006; Huntington, 2006; Merton, 1968). In contrast, the Weberian approach suggests that public corruption will sacrifice the public interest and reduce government’s equality, efficiency, and the efficacy of its official ability to provide public goods and services, and will erode public confidence in the government system thereby (Anderson & Tverdova, 2003; Chang & Chu, 2006; Della Porta, 2000; Doig & Theobald, 2013; Morris & Klesner, 2010; Villoria, Van Ryzin, & Lavena, 2013).
Democracy’s core values include respect of life, liberty, the common good, justice, equity, diversity, and truth. Warren (2004) believes that the fundamental element necessary for a democracy to work is inclusion or collective action—the process of collective deliberation and decision making. In a democracy, citizens select their political representatives collectively and delegate powers to them to operate government functions on their behalf and for their benefit. Government entities are expected to be trustworthy agencies that provide public services that citizens may not otherwise receive equally from the free market. When government officials are corrupt, citizens effectively are disempowered or excluded from the government agencies because government officials depart from citizens’ values and expectations. Thus, corruption undermines democracy because it leads to inefficient and ineffective government, and produces an arbitrary atmosphere permeated with differential treatment (Warren, 2004).
Empirical research largely has verified the negative effects of corruption and supported the Weberian theory, although corruption was measured primarily as perceptions. For example, Moreno (2002) and Catterberg and Moreno (2006) used citizens’ justification of certain dishonest behaviors, such as “cheating on taxes if you have a chance,” to measure what Moreno referred to as corruption’s permissiveness. They found that as citizens’ corruption permissiveness increased, the level of both their interpersonal and political trust decreased. Anderson and Tverdova (2003) examined whether citizens’ trust in civil servants declined as country-level corruption perception increased using the International Social Survey Program (ISSP) in 16 democracies, including the United States, and the Corruption Perception Index (CPI) from Transparency International. They observed that citizens in democracies with a greater level of perceived corruption are less likely to trust civil servants. Grönlund and Setälä (2012) and Hakhverdian and Mayne (2012) obtained similar results using country-level CPI to measure corruption. Based on survey data from the East Asia Barometer, Chang and Chu (2006) measured corruption as citizens’ perceptions of how widespread corruption and bribery-taking are in their respective Asian nations and local governments, including Japan, the Philippines, Thailand, and Taiwan. They showed a negative association between perceived corruption and citizens’ attitudes toward government performance. Using the American Barometer Survey in Mexico, Morris and Klesner (2010) surveyed citizens’ assessment of their political and administrative officials’ corruption levels, and asked them about their observations of corruption behaviors. They also confirmed the corrosive influence of perceived corruption on political trust and regime legitimacy at the individual level. Villoria et al. (2013) surveyed Spanish citizens’ perceptions of public corruption in major government functions while investigating its social and political consequences. Their results suggested that when citizens perceive that administrative and political systems are corrupt, they have a relatively low level of satisfaction with government, low levels of social and institutional trust, and greater willingness to break rules. In addition, Bauhr and Grimes (2014) examined the relation between control of corruption and institutional trust using the World Bank Governance Indicators and World Values Survey data for 52 countries. Kaufmann, Kraay, and Mastruzzi (2011) suggested that the corruption control indicator actually captures “. . . perceptions of the extent to which public power is exercised for private gain, including both petty and grand forms of corruption, as well as ‘capture’ of the state by elites and private interests” (p. 222). Finally, Bauhr and Grimes found that citizens’ institutional trust declined as their perception of corruption became more severe, which is consistent with previous research.
Table 1 summarizes previous empirical studies on the relation between corruption and trust. Interestingly, the studies share two key characteristics. First, corruption is measured as a subjective perception, either at the country or the individual citizen level. Second, the studies found that perceived corruption is associated negatively with trust. While these studies provide insightful contributions to the literature, and help us understand the corruption–trust relation, two questions remain: “How can corruption be measured differently?” and “How do anticorruption efforts influence public trust in government?”
Summary of Previous Empirical Studies on Corruption and Trust.

Note. CPI = Corruption Perception Index; ISSP = International Social Survey Program.
Anticorruption Efforts and Public Trust
Corruption is a sociopolitical disease, but citizens become more tolerant and acceptant of it over time. Without government control, corruption could become a practical rule in the operation of the political sphere and economic markets. A consequence of pervasive corruption is distrust in laws and institutions, as well as legal and ethical violations, which will, in turn, delegitimize government and further its dysfunction. With respect to the notion that anticorruption efforts help governments win back public support, some studies have presumed that anticorruption efforts could be considered a strategy for government and the governing party to win such support (Guo, 2014; Manion, 2004). In the long run, effective anticorruption efforts could reduce the occurrences of public corruption, and eventually mitigate the level of citizens’ perceptions of corruption, thus increasing public trust in government (e.g., Anderson & Tverdova, 2003; Bauhr & Grimes, 2014; Chang & Chu, 2006; Gronlund & Setala, 2012; Hakhverdian & Mayne, 2012; Villoria et al., 2013).
Two case studies in the literature revealed the long-term effects of anticorruption efforts on public trust in government. Doig and Riley (1998) studied Hong Kong’s anticorruption movement and attributed its success largely to the Commissioner for the Independent Commission Against Corruption (ICAC). The ICAC’s anticorruption reputation was established through persistent prosecution of corrupt officials and prominent community members, while it conducted simultaneous anticorruption mass media and public education campaigns. The authors found that public trust in the ICAC increased substantially from the 1970s to 1990s. Chandler (2006) investigated the role of the international administration in Bosnia, which prioritized anticorruption and good governance initiatives. Doig and Riley found that over 10 years, anticorruption policies and good governance practices have rebuilt trust in Bosnia’s public institutions. Questions in the literature yet to be examined systematically include discussions that focus on the way in which citizens react to anticorruption efforts in the short run, and whether citizens trust government more after officials are charged with wrongdoing.
Nevertheless, anticorruption is a critical component of government performance. Existing studies have investigated whether and how government performance leads to a higher level of public trust in government. For example, E. W. Welch et al. (2005) suggested that citizens’ satisfaction with government websites influenced their trust in government positively. Similarly, Christensen and Lægreid (2008) showed that citizens’ satisfaction with public service delivery could translate into greater trust in the institution providing the service and that such an effect holds across a range of services. While Kampen, De Walle, and Bouckaert (2006) verified this relation, they also pointed out that negative performance has a much stronger (negative) effect on trust in government than does positive performance. Studies also have emphasized, however, that there is not a direct relation between government performance and government trust. For example, Baekgaard and Serritzlew (2016) held that citizens interpret performance in ways that corroborate their previous attitudes about the public sector. Van Ryzin (2007) warned that it is too simplistic to assume that citizens respond directly to government outcomes gauged by traditional performance measures. Instead, citizens’ trust in government depends on the way in which they interpret government performance, and perceived government performance determines the level of public trust in government. E. W. Welch et al. (2005) and Christensen and Lægreid (2008) used satisfaction with government performance indicators rather than direct performance indicators in their empirical studies, which echoed Van Ryzin’s argument. In fact, there is little research on whether the pattern will hold, and the way in which government’s anticorruption efforts shape public trust in government. This study attempted to take one step further to examine whether the number of corruption convictions influence public trust in government, and the number of corruption convictions may be interpreted as an indicator of governmental anticorruption efforts. The following section will discuss corruption and anticorruption indicators.
Corruption and Anticorruption Indicators
Developing public corruption measures is a challenge. Previous empirical research largely has examined the corruption issue at the country and individual levels using subjective indicators. Three indicators are used to measure corruption at the country level: Transparency International’s CPI (e.g., Bastida & Benito, 2007; Bohara, Mitchell, Nepal, & Raheem, 2008; Gronlund & Setala, 2012; Peiffer & Alvarez, 2015; Themudo, 2013, 2014); the World Bank Governance Indicators’ Control of Corruption Index (CCI: for example, Bauhr & Grimes, 2014; Bohara et al., 2008; Rubin & Whitford, 2008; Tavits, 2007; Tian & Lo, 2008), and the Political Risk Services Group’s International Country Risk Guide (ICRG) Corruption Index (e.g., Heller, Kyriacou, & Roca-Sagales, 2016; Keefer, 2007; Yadav, 2012). These indices are calculated from surveys or expert opinions that measure people’s perceptions of corruption.
Among studies that have used individual-level data, few have assessed the punishment of corrupt officials (Gordon, 2009; S. Welch & Hibbing, 1997). Most studies applied survey instruments to measure corruption levels perceived by citizens (e.g., Chang & Chu, 2006; Chang & Kerr, 2016; Gong, Wang, & Ren, 2015; Knutsen, Kotsadam, Olsen, & Wig, 2017; Villoria et al., 2013), business managers (e.g., Loftis, 2015; J. Zhu & Zhang, 2016), or public employees or bureaucrats (e.g., Kwon, 2014; Moloney & Chu, 2016).
Some studies have examined corruption issues at the local government or state/provincial level. Among those, studies have aggregated the individual-level data of corruption perception at the local government or provincial levels (Beeri & Navot, 2013; Bussell, 2010; Grimes & Wängnerud, 2010), while others have made efforts to use more objective indicators to measure corruption. For example, Olken (2007) conducted field experiments at over 600 Indonesian village road projects and measured corruption by calculating the missing expenditures, the difference between what the village claimed it cost to build a road and what the engineers estimated it actually cost to build. Almost all other studies in this category used the number of corruption cases in a state or province to measure corruption. For example, B. Zhu (2017) collected the annual procuratorial reports from each province in China and identified three measures of corruption at the provincial level: the total number of corruption cases filed, the amount of corrupt funds recovered, and the number of senior cadres disciplined. A very similar approach to measuring state-level corruption in the United States is the number of corruption convictions gathered by the Department of Justice’s Public Integrity Section (PIS) for annual reports to Congress.
PIS data provide the number of federal, state, and local public officials convicted of corruption-related crimes across the states on an annual basis and is accepted within empirical studies that analyze the causes and consequences of public corruption in the United States (Alt & Lassen, 2014; Depken & Lafountain, 2006; Flavin & Ledet, 2013; Liu & Mikesell, 2014; Liu et al., 2017; Meier & Holbrook, 1992; Rauh, 2016). Cordis and Milyo (2016) suggested that the pervasiveness of PIS data is due to their “. . . imprimatur of originating from official documents” (p. 128). In the United States, prosecutions and convictions of corruption cases apply federal law rather than state or local laws, which adds stability and consistency to prosecutions (Depken & Lafountain, 2006). Furthermore, the data provide historical richness, as they cover the numbers of corruption convictions in each state for nearly four decades.
However, previous studies have interpreted these indicators differently and treated them as objective measures of public corruption across states (Depken & Lafountain, 2006; Flavin & Ledet, 2013; Liu & Mikesell, 2014; Liu et al., 2017; Meier & Holbrook, 1992; Rauh, 2016). For instance, Meier and Holbrook’s (1992) empirical analysis showed that rankings by state convictions matched Americans’ general perceptions of state corruption. Liu and Mikesell (2014) argued that the number of convictions could reflect the actual severity of corruption across states accurately, as it was not associated significantly with prosecutors’ capacities and the degree of law enforcement across states. Nevertheless, Alt and Lassen (2014) suggested that the number of corruption convictions may indicate such capacities and anticorruption efforts at the state level because they are correlated highly with prosecutors’ resources. For example, the number of corruption convictions increased substantially after the Watergate scandal because of intensified federal prosecutorial policy with respect to public corruption (Archambeault & Elmore, 1983; Maass, 1987).
Cordis and Milyo (2016) advised using caution in interpreting federal convictions of state and local officials. First, the PIS data are not administrative: The PIS surveyed prosecutors every year and required them to make a retrospective accounting of annual activities. Second, PIS data include not only elected and appointed government officials but also some low-level public employees such as postal employees. Third, convictions of federal officials and employees is the most common category in the data, comprising approximately 56% of all conviction cases, while corruption by local and state officials accounted for approximately 25% and 19%, respectively. Thus, Cordis and Milyo suggested that authors should understand the data fully when they use them for research.
We chose the PIS corruption convictions indicator for this study because it includes the most reliable and richest data available. Although it derives from prosecutors’ retrospective reports rather than administrative records, it is highly accurate and reliable because prosecutors have better knowledge of corruption convictions than does any other party. The data are not restricted to state and local government officials but are mixed with federal government officials and low-level government employees who are convicted of corruption. Yet, all corruption cases occurred in states where the prosecutor reports to the Department of Justice. More interestingly, this study may determine whether the number of corruption convictions is more likely to measure the severity of corruption, or to measure anticorruption efforts across states, given that previous theories on the corruption–trust and performance–trust relations are plausible. Therefore, unlike previous studies, we believed that the corruption convictions indicator may measure both corruption severity and anticorruption efforts, and developed our hypotheses accordingly. To explain trust in government more comprehensively, we also included hypotheses related to political and economic factors.
Research Hypotheses
The outcome variable in this research was citizens’ trust in government, and the key predictor was the number of corruption convictions. If the number of convictions is interpreted as the severity of corruption across states, according to previous studies, such convictions will be associated negatively with trust in government. However, if the number of corruption convictions measures anticorruption efforts, these convictions may exert a positive effect on trust in government. Therefore, we hypothesized an open relation between the number of corruption convictions and public trust in government.
Political Factors of Trust in Government
Citizens’ political ideologies and presidential party were included as political factors of trust in government, as political ideology has been shown to influence attitudes toward public-sector institutions (Christensen & Lægreid, 2005). Conservatives traditionally value limited government, often criticize government expansion, and view government programs as a potential threat to individual or state liberty. Thus, conservatives may be more skeptical about government programs than are liberals. In contrast, liberals are more willing to support most government programs to promote social or economic equality. Therefore, liberals may have stronger confidence in government than do conservatives (Cook & Gronke, 2005; Rudolph & Evans, 2005). On the contrary, liberals also tend to have higher expectations that government will promote social or economic equality, but it cannot meet those expectations because of financial and political constraints. Therefore, liberals may show a lower level of trust in government than do conservatives.
Furthermore, one may argue that conservatives tend to be more favorable to government policies designed by their ideological allies, and thus conservative citizens tend to trust government under Republican administrations more than liberal administrations (Cook & Gronke, 2005). Therefore, we hypothesized the following:
We considered the variation in trust in government over time under different presidential administrations. The 1974 Miller–Citrin debate (Citrin, 1974; Miller, 1974) addressed whether citizens’ distrust in government results from their rejection of the political regime as a whole (as Miller argued) or dissatisfaction with incumbent authorities (Citrin, 1974). A longitudinal dataset allowed us to test which theory was supported. Orren (1997) argued that the decline in public satisfaction with government might reflect diminished government performance, rising expectations, or some combination of the two. The Democratic Party usually supports larger government and more government programs, while the Republican Party supports reductions in “big government.” Therefore, we hypothesized the following:
Socioeconomic Factors and Trust in Government
A government’s improved economic performance may enhance public trust. Lipset (1987) found that unemployment and inflation rates coincided with a decline in trust in the government’s executive branch. Similarly, Japan’s economic collapse in the 1990s was associated with a decrease of public faith in government (Dalton, 2004), while the Clinton administration enjoyed a rebound in levels of trust because of an economic boom (Hetherington & Rudolph, 2008). These cases add further support for the positive relation between economic conditions and institutional trust. We extended this hypothesis from the country to the state level, and proposed that the average financial conditions at the state level are related positively to public trust in government.
Social capital and interpersonal trust may mediate social tensions and increase institutional trust (Uslaner, 2000). Using data from 23 European countries and the United States, Zmerli and Newton (2008) verified such an effect. Therefore, we hypothesized the following:
Method
Data Sources and Analysis Units
To test the hypotheses, we gathered a state-level panel dataset from multiple sources, primarily the PIS data and General Social Survey (GSS), which could prevent the common source bias that exists in previous research on corruption and trust (Chang & Chu, 2006; Morris & Klesner, 2010; Seligson, 2002; Villoria et al., 2013).
PIS has reported the number of corruption convictions annually since 1976. The GSS has collected data from individual citizens in the United States, which has been conducted annually by the National Opinion Research Center (NORC) since 1972, except for 1979, 1981, and 1992. In 1994, it then changed to a biennial survey in even years. In addition to collecting information about citizens’ trust in government and their political views, GSS also gathered respondents’ geographic information, including their residences, state, and county. However, it did not collect interpersonal trust information in 1982. To maintain equal time intervals for the panel data, we originally chose the GSS data collected in even years from 1976 to 2012, except 1992 and 1982.
As GSS collected data on the dependent variable of trust in government originally at the individual level, we had the flexibility to set the unit of analysis either at the state level or lower. We selected the state level because the dataset is more manageable, and the number of individual responses to the GSS in each state and year is much larger than that at a lower government level.
As reported later, we used 1- to 5-year lagged terms of state-level corruption convictions in the model to identify the effect of corruption convictions over time. Thus, the outcome variable of trust in government from 1981 to 2012 was supposed to be included in the analysis (PIS started in 1976). However, because GSS data derive from even years only and there was no interpersonal trust variable in 1982, ultimately we used GSS data collected in even years from 1984 to 2012, except 1992. Therefore, there were 14 time points for the panel data.
The number of states included in the analysis varied over those time points. For example, the dataset covered 25 states in 1984, 37 states in 1996, and 35 states in 2012. One reason for this is that the GSS did not collect responses from every state, especially in earlier years. Another reason is that, for the purpose of reliability, we dropped the states from analysis if they had fewer than 20 individual responses to the GSS. Therefore, there were 442 total valid observations in the panel data.
Measurement
The data for the dependent variable, trust in government, and independent variables, citizens’ political ideologies and interpersonal trust, were obtained from GSS. For this research, we aggregated data from the individual level to the state level. At the individual level, trust in government was measured by the three survey items below, where “hardly any” is coded as 1, “only some confidence” as 2, and “a great deal” as 3.
Would you say you have a great deal of confidence, only some confidence, or hardly any confidence at all in them? Read each item; Code one for each. (1) Executive Branch of the federal government, (2) U.S. Supreme Court, (3) Congress.
At the individual level, the overall average level of trust in the U.S. federal government was 1.92 on a scale of 3, which was below the midpoint of 2, indicating a relatively low level of trust in government. Figure 1 presents the trends of trust in government, aggregated from individual-level data by year, and shows that trust is declining over time. At the state level, we constructed overall trust in government, which was the average value of responses to all three items in each state and year.

Overall trends of trust in government.
The first independent variable, corruption level, was obtained from PIS. In this research, we weighted the number of corruption convictions by state population because large states automatically will have a larger number of corruption cases. The corruption convictions were computed as below:

With the assumption that it takes time to disseminate information about corruption convictions, we expected a lagged effect of convictions on public trust in government. Therefore, we used 1- and 2- to 5-year lagged terms of corruption convictions in the analysis, denoted as Corruptioni,t–1, and Corruptioni,t–2 to Corruptioni,t–5, rather than the corruption convictions in the current year. The lagged terms of corruption convictions allowed us to examine the way in which trust in government changes over time in response to such convictions. Because of the lagged terms, we collected the data on corruption convictions by state for the period 1979 to 2011 to match the GSS data from 1984 to 2012.
PIS data showed that the number of public corruption convictions (without adjustment by population) in the United States increased from 1979 to 2012, with a sharp rise in 1984 (see Figure 2). Part of this dramatic increase was attributable to the change in the way in which corruption was measured. Since 1983, the Department of Justice has used a broader definition to measure public corruption and has instructed prosecutors explicitly to report offenses by low-level public employees as well (including postal employees) that otherwise were not coded as official corruption (Cordis & Milyo, 2016).

Number of corruption convictions in the United States.
The second independent variable was citizens’ political ideology and was gathered from the GSS data as well. The original survey question in the GSS is as follows: We hear a lot of talk these days about liberals and conservatives. I’m going to show you a seven-point scale on which the political views that people might hold are arranged from extremely liberal, point 1, to extremely conservative, point 7. Where would you place yourself on this scale?
We aggregated the individual measure at the state level by taking the average value of the responses in each state and time point, with higher values being more conservative.
The third independent variable, presidential party, was a dichotomous variable coded as 1 if there was a Democratic president that year, and 0 if a Republican president. Obviously, in the panel data, this variable varies only over years, not across states.
The interaction term of citizens’ political ideology and presidential party was the fourth variable and was included in the models to determine whether conservatives have a greater level of trust in government under Republican administrations. This interaction term was the product of the two variables: citizens’ political ideology and presidential party.
The fifth independent variable was economic condition, measured by per capita income at the state level. This was calculated as annual total personal income (in U.S. dollars) in each state, divided by the state population in that year, then adjusted for that year’s annual inflation rate. We obtained the data on total personal income and inflation rates from the U.S. Bureau of Economic Analysis, and the population data from the U.S. Census Bureau.
The sixth independent variable was interpersonal trust, measured initially by the survey question in the GSS at the individual level: “Generally speaking, would you say that most people can be trusted or that you can’t be too careful in dealing with people?” It takes values of 1-3, where 1 is “You can’t be too careful in dealing with people,” 2 “It depends,” and 3 “Most people can be trusted,” indicating three levels of interpersonal trust from low to high.
We aggregated this variable from the individual to the state level by taking the average value of the responses for each state and time point, with a higher value indicating a higher level of interpersonal trust. Table 2 provides the measures for each variable, as well as the data sources. Tables 3 and 4 report the descriptive statistics.
Measurements and Data Sources.

Note. GSS = General Social Survey; PIS = Public Integrity Section.
Descriptive Statistics of Continuous Variables.

Descriptive Statistics of Categorical Variables.

Model Specification and Procedure
We analyzed the panel data with the following general equation of trust in government:
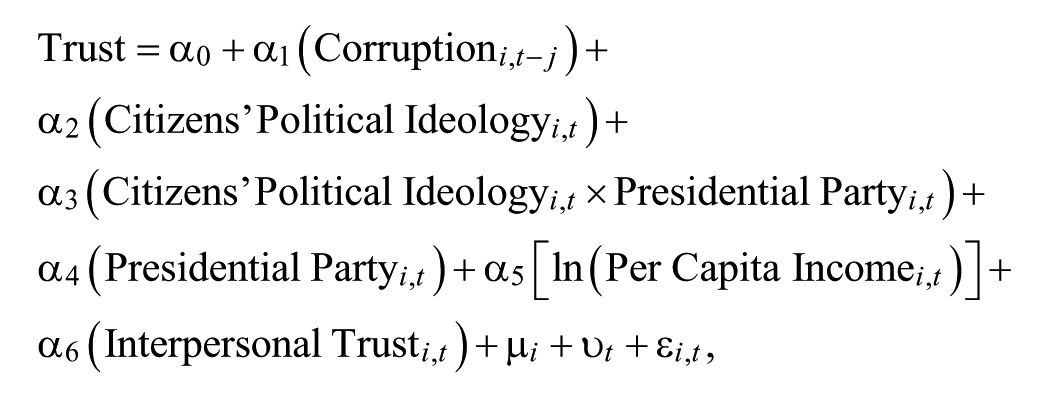
where the subscript i indicates the state, t the time point, and j the year from 1 to 5. Corruption i,t–j refers to the 1- to 5-year lag in corruption convictions. µ i infers a state-specific fixed effect,; ʋ t , denotes a time-specific fixed effect; ε i,t is a random error term, and α0 is the constant.
We evaluated both state- and time-related fixed effects in the panel data analyses and found that the time-related fixed effects were much more significant than were the state-related. Thus, we dropped µ i from the model. We constructed the random effects models and performed the Hausman model specification tests, which followed from the time-related fixed effects models, and suggested that the fixed effect model was appropriate. The significance of time-related fixed effects implied that there is a consistent time trend that explains trust in government over years, but the time-related fixed effect model canceled out the effect of time factors. Therefore, we also performed a linear trend ordinary least squares (OLS) model by including year as an independent variable to see whether and how the level of trust in government has declined systematically in the United States over time.
A dummy variable, “Year 2002,” was added to the models as a control. The existing literature has suggested that public trust in government increases immediately when there is an external threat and the government reacts to it properly. In American history, the concern for national defense during the Cold War helped solidify public trust in government (Chanley, Rudolph, & Rahn, 2000; Nye, Zelikow, & King, 1997). The September 11, 2001, terrorism event was perceived to increase public concern about national security and international affairs, and resulted in stronger support and greater trust in governmental authority (Chanley, 2002). The linear trend model provided results consistent with the fixed effect model and confirmed the time trend in government trust and the influence of the 2001 terrorist attack. Moreover, as reflected by R2, the linear trend model provided more accurate explanatory power by including the time factors in the calculation.
In our initial models, we also included other control variables, including population size, education level, and the percentage of minority population at the state level, gathered from the U.S. Census Bureau. However, none of these variables showed a statistically significant relation to trust in government. Thus, we dropped them from the final models for parsimony because excluding them had little influence on the model’s parameters. The variance inflation factor (VIF) test was conducted before running the models to detect any problems with multicollinearity. The highest VIF obtained was 1.11. Therefore, there was no concern for multicollinearity in the models.
Results
Wald chi-square tests and F tests indicated that both models (shown in Table 5) were statistically significant, with similar results regarding the effect of the independent variables. The fixed effects model had a relatively lower R2 of .17 because the time-related fixed effects were excluded from the calculation. The time trend OLS model had an R2 of .44, indicating that the model explained 44% of the variation in public trust in government.
Models of Trust in Government.

Note. Within R2 was used for fixed effects model. Presidential party in fixed effects model was omitted because it is part of the time-specific fixed effects. OLS = ordinary least squares.
p < .10. **p < .05. ***p < .01 (one-tailed test).
The influence of lagged terms in corruption convictions in government trust appeared interesting and controlled for the influence of certain political and socioeconomic factors. Except for the 1-year lagged term, the fixed effects model showed that all four lagged terms of corruption convictions exerted a positive effect on trust in government regardless of their significance levels. The positive effect of lagged terms on corruption convictions suggested that the public may interpret corruption convictions as an indicator of government anticorruption efforts, and generally may expect more corruption cases to be investigated and convicted. When their expectation is satisfied, they are more likely to trust government, while when there are fewer corruption convictions, they are less likely to trust government.
Nevertheless, the 1- and 2-year lagged terms of corruption convictions were not statistically significant: Only the 3- and 4-year lagged terms were significant at the .05 level, after which the 5-year lagged term became insignificant. This demonstrated the systematic pattern that the positive effect of government anticorruption efforts only occurs after 3 and 4 years. If the number of corruption convictions reflects the objective outcome of government anticorruption efforts closely, it may take time for the public to realize the change in government efforts and then reevaluate their perceptions of government performance gradually. This result may once again suggest that government performance does not shape public trust in government directly. However, as Van Ryzin (2007) argued, it may change public perceptions of government performance and influence public trust in government further thereafter. In addition, the coefficients for the 3- and 4-year lagged terms in the fixed effects model were greater than 5, illustrating that the influence corruption convictions have on government trust is remarkably substantial after 3 and 4 years, although the effect is not immediate. When the number of corruption convictions increased by one among 1,000 population, the level of trust in government improved by 5 on a 1 to 3 scale. In other words, if the number of corruption convictions increased by one among 5,000 population in a state, the level of trust in government in the state will be expected to improve one level (from low to medium, or from medium to high). In summary, the relation proposed in Hypothesis 1 illustrated a complicated link between corruption convictions and trust in government.
With respect to political factors, the influence of citizens’ political ideology had a significant and positive effect on trust in government. Citizens who are more conservative were more likely to trust government. In contrast, liberals tended to have a relatively lower level of trust in government. The coefficient for the interaction term between citizens’ political ideology and presidential party was negative and significant, indicating that a stronger conservative ideology leads to a higher level of public trust in government under Republican administrations, and a more liberal ideology is associated with a higher level of trust in government under Democratic administrations. This result confirmed Cook and Gronke’s (2005) argument that conservative citizens tend to trust government more under Republican administrations than under Democrat administrations. Moreover, citizens’ trust in government is systematically higher under Democratic presidents than Republican presidents, when other variables in the model are controlled.
Economic condition, indicated by per capita personal income, was associated significantly and positively with trust in government. The level of public trust in government was systematically higher in wealthier states and lower in poorer states. This is consistent with the previous literature that citizens hold government accountable for ensuring their economic well-being (Bok, 1997; Dalton, 1988; Wroe, 2014). Therefore, Hypothesis 5 was supported empirically. Furthermore, for Hypothesis 6, the coefficient for interpersonal trust was significant and positive. Citizens with a high level of interpersonal trust are more likely to trust government, which echoes the argument in previous studies that social trust can enhance confidence in governmental institutions (e.g., Zmerli & Newton, 2008).
The time trend OLS model supplemented the panel data analysis by demonstrating the way in which public trust in government has varied over time and providing results similar to the fixed effect model. The coefficient for the year variable was negative and significant, indicating that trust in government has declined systematically over time because of the ascendancy of the market state, individualism, and the dominance of technical rationality (Adams & Balfour, 2012). There was a significant rise in public trust in 2002, which indicated that the 9/11 terrorist attack did enhance trust in government, as Chanley (2002) suggested.
Conclusions and Implications
This research attempted to understand the complexity in the relation between corruption convictions and public trust in government. Previous research has suggested that a higher corruption level leads to weaker trust in government, and more anticorruption efforts may result in stronger government trust. Many existing studies have held that state corruption convictions are an objective measure of corruption levels, while other scholars have suggested that they may represent state anticorruption efforts. To address whether more corruption convictions jeopardize or improve government trust, we used state-level panel data merged from PIS and GSS data, which revealed interesting patterns.
The empirical results showed that corruption convictions do not exert an immediate effect on public trust in government, when the influence of various political and socioeconomic factors is controlled. However, corruption convictions may help government regain trust after 3 or 4 years. This result showed the way in which the public may actually react to corruption convictions: Citizens do not perceive simply that the government is becoming more corrupt when they see more public employees being prosecuted and punished for corruption, but they may recognize government anticorruption efforts gradually and thus develop more positive perceptions about government performance. Consequently, citizens show their support for anticorruption efforts and place more trust in government. However, when citizens see corruption convictions declining, they do not assume simply that government is becoming less corrupt. Instead, they may perceive that anticorruption efforts are insufficient, develop a negative perception of government performance, and therefore become less confident in government.
This research may imply an indirect relation between government performance and government trust, which is consistent with Van Ryzin’s (2007) findings. However, we were unable to examine the relations among corruption convictions, perceptions of government anticorruption efforts, and citizens’ trust in government thoroughly because we lacked data on citizens’ perceptions of government anticorruption efforts. Nevertheless, we synthesized the existing studies, identified the intellectual puzzle in the literature, and took the first step in illustrating the way in which corruption convictions may influence public trust in government. Future research is expected to make further progress by integrating the variable for citizens’ perceptions of anticorruption efforts.
The positive, although lagged, effect of corruption convictions on trust in government encourages prosecutors’ and law enforcement agencies’ anticorruption efforts. Investigating more corruption cases and achieving more convictions will not harm citizens’ perceptions of government performance or undermine their confidence in government further. Instead, if the fight against corruption is aggressive, trust in government may be improved or restored.
Political factors also influenced public trust in government. Our research suggested that states with a more conservative ideology are more likely to demonstrate a higher level of public trust than are those with a more liberal ideology, government under Democratic administrations is more likely to gain trust than that under Republican administrations, and Democratic administrations are more likely to earn trust from liberals, while Republican administrations are more likely to earn trust from conservatives. In addition, positive economic conditions and citizens’ interpersonal trust can help maintain or improve public trust in government. Government may collaborate with social groups or organizations to enhance interpersonal trust, while it continues to work to improve economic performance. The significance of time factors is not surprising. We observed a downward trend in government trust over time, which reminds us once again that the citizen–government relation is confronting critical challenges.
Footnotes
Declaration of Conflicting Interests
The author(s) declared no potential conflicts of interest with respect to the research, authorship, and/or publication of this article.
Funding
The author(s) received no financial support for the research, authorship, and/or publication of this article.