
Abstract
This article takes a first step toward analyzing the characteristics of a cross-policy, state-wide collaborative system. Specifically, using data from the Atlas of Collaboration project, we offer a big-picture analysis of how over 200 externally directed collaborative governance regimes (CGRs) are operationalized in a state-level collaborative system consisting of 13 collaborative platforms operating across five policy areas (economic development, education, health, natural resources, public safety) in Oregon. We focus on three attributes—geographic scope, collaborative size, and collaborative characteristics—aggregated at the system level across CGRs, as well as across collaborative platforms and policy areas. The descriptive findings reveal that collaborative efforts are geographically dispersed across the state, involve thousands of participants representing organizations from the public, private, and nonprofit sectors, and vary across multiple characteristics, such as organizational form, lead organization, funding model, structural roles, staffing, and extent of face-to-face dialogue. These findings lay the groundwork for future theoretical development and empirical research.
Keywords
Introduction
Collaborative governance refers to multi-organizational arrangements in which actors work across boundaries—whether sectoral, jurisdictional, geographic, or otherwise—to address public problems that cannot be easily addressed by a single organization or a single sector alone (e.g., Agranoff & McGuire, 2003; Ansell & Gash, 2008; Carlson, 2007; Emerson & Nabatchi, 2015a). Over the last several decades, collaborative governance has surged in both practice and research. Today, collaborative governance and other types of collaborative public management approaches (such as partnerships and networks) 1 are used at all levels of government and in numerous policy areas such as environmental conflict resolution (Emerson et al., 2009; Manring, 1998), management (Bitterman & Koliba, 2020; Brody, 2003; Fisher et al., 2020; Hardy & Koontz, 2008; Hui et al., 2020; Leach, 2006; Koontz & Thomas, 2006; Ulibarri, 2015a), planning (Scott & Carter, 2019; Singleton, 2002), health and welfare (Doberstein, 2016; Johnston et al., 2011; Hafer, 2018; Mosley, 2012; Scott, 2011), and emergency and disaster management (Brink & Wamsler, 2018; Edelenbos et al., 2017; Kapucu, 2014; Kapucu, Arslan, and Demiroz, 2010; Kapucu, Arslan, and Collins, 2010), among others.
As calls for and the use of collaborative governance grow, so too do demands for information about its forms and evidence about its efficacy; however, the provision of such evidence faces both conceptual and empirical challenges. Conceptually, scholars have produced rich and detailed frameworks about the development and functioning of collaborative governance arrangements (e.g., Ansell & Gash, 2008; Emerson et al., 2012; Emerson & Nabatchi, 2015a), the conditions that influence collaborative processes (e.g., Bingham, 1986; Gray, 1989; Gray & Wood, 1991; Huxham, 2003; Ring & Van de Ven, 1994; Thomson & Perry, 2006; Wood & Gray, 1991), and approaches for evaluation (Emerson & Nabatchi, 2015b; Thomson et al., 2008). However, these frameworks center on a single collaborative endeavor and do not explicitly address the use of multiple collaborative arrangements at a larger scale, for example, within or across policy fields.
Empirically, scholars have demonstrated that collaborative governance can increase stakeholder engagement and learning (Gerlak & Heikkila, 2011; Scott & Thomas, 2015; Scott et al., 2019; Ulibarri, 2015b; Ulibarri & Scott, 2017), improve outputs and outcomes for environmental quality (Biddle, 2017; Bitterman & Koliba, 2020; Emerson et al., 2009; Kalesnikaite, 2019; Mandarano, 2008; Scott, 2015, p. 2016), and facilitate regulatory processes (Scott et al., 2020; Ulibarri, 2018). Once again, however, performance results tend to rely on evidence from a single case study or a small number of comparative case studies (Emerson & Gerlak, 2014; Emerson, 2018; Heikkila & Gerlak, 2005) and do not assess the performance of collaborative governance on a larger scale.
Recently, scholars have introduced two concepts that provide useful insights for understanding collaborative governance as a policy tool applied to large-scale contexts: (1) “collaborative platforms,” which refer to organizations or programs dedicated to helping create and support multiple collaboratives or ongoing collaborative networks (Ansell & Gash, 2018), and (2) “collaborative systems,” which refer to the larger context in which collaborative governance regimes (CGRs) and collaborative platforms are embedded (Annis et al., 2020). While these two concepts ameliorate some of the conceptual challenges associated with exploring collaborative governance within and across policy fields, no empirical research about the characteristics of CGRs and platforms in a cross-policy, the state-wide collaborative system exists.
This article takes a first step toward filling that gap, extending the research on CGRs (Emerson et al., 2012; Emerson & Nabatchi, 2015a), collaborative platforms (Ansell & Gash, 2018), and collaborative systems (Annis et al., 2020). It draws on data from the Atlas of Collaboration project, which aims to gather the multi-site, multi-scale, systems-level data needed to understand and support complex collaborative governance ecosystems. Specifically, the article analyzes how 241 externally directed CGRs are operationalized across 13 collaborative platforms in five policy areas (economic development, education, health, natural resources, and public safety) in the State of Oregon. The analyses focus on three CGR attributes—geographic scope (spatial distribution), collaborative size (number of participating organizations and individuals), and collaborative characteristics (organizational form, lead organization, funding model, structural roles, staffing, extent of face-to-face dialogue)—with analyses aggregated across platforms, policy areas, and the collaborative system.
This kind of research provides a useful baseline for future scholarly and practitioner-oriented efforts, including the identification of key variables that shape collaborative governance and the conditions under which it is developed at the platform level and across policy contexts (for an empirical study of the evolution of collaborative governance, see Ulibarri et al., 2020). The analyses from this article open the opportunity for future theory-building efforts by illuminating important CGR, platform, and system characteristics that may influence collaborative processes, outputs, outcomes, and impacts. To that end, this article first provides an overview of collaborative governance and its history in Oregon. Next, it explains the methods used to collect and analyze data and presents the analyses. Finally, it offers a discussion of the findings, identifies avenues for future research, and concludes with a discussion of implications for practice.
Collaborative Governance
Collaborative governance research has a rich and deep provenance (Emerson & Nabatchi, 2015a), but often is traced to research on intergovernmental relations, where the focus is on how different levels of government interact with one another to attain policy goals that benefit and create value for the public (e.g., Guy Peters & Pierre, 2001; Kirlin, 1996; O’Toole & Christensen, 2012). Kirlin (1996, p. 175), for example, asserts that given the fragmentation of governmental policy making in the United States, governments can work to create value for society by changing the design of complex functional systems and improving the linkages among levels of government as well as among public, private, and nonprofit organizations.
From intergovernmental relations research emerged a focus on “governance” as a concept, theoretical perspective, and empirical reality that reflected “the collaborative nature of modern efforts to meet human needs, the widespread use of tools of action that engage complex networks of public and private actors, and the resulting need for a different style of public management, and a different type of public sector, emphasizing collaboration and enablement rather than hierarchy and control” (Salamon, 2002, p. vii). As evidence about the usefulness of multi-organizational, cross-jurisdictional, networked arrangements became well documented (e.g., Agranoff, 2001; Agranoff & McGuire, 2003; McGuire, 2006), scholars increasingly became interested in the collaborative nature of such arrangements, which prompted research in the area of collaborative governance.
Myriad definitions of collaborative governance exist (O’Leary & Vij, 2012). At its most basic level, collaborative governance means “working with others in cross-boundary, multi-organizational (and often multi-sectoral) arrangements, in which the actors … determine their working structure and tasks, including negotiating and setting goals, developing plans, and taking actions to address a shared problem” (Nabatchi & Emerson, 2021, p. 386; see also Ansell & Gash, 2008; Emerson et al., 2012; Emerson & Nabatchi, 2015a). Two more specific definitions have become prominent in the literature. Ansell and Gash (2008, p. 544) define collaborative governance as “a governing arrangement where one or more public agencies directly engage non-state stakeholders in a collective decision-making process that is formal, consensus-oriented, and deliberative and that aims to make or implement public policy or manage public programs or assets.” Similarly, Emerson and Nabatchi (2015a, p. 18) define collaborative governance as “the processes and structures of public policy decision making and management that engage people across the boundaries of public agencies, levels of government, and/or the public, private, and civic spheres to carry out a public purpose that could not otherwise be accomplished” (see also Emerson et al., 2012, p. 3).
The breadth of these definitions means that collaborative governance frequently is used as an umbrella term that includes the various structures, processes, and tools that shape specific collaborative arrangements, such as public-private partnerships, intergovernmental authorities, advisory committees, and local collaborative planning fora, among others (Scott & Thomas, 2017). The variations among the processes and structures of collaborative governance give rise to the concept of the CGR, a term that refers to a system for “public decision making in which cross-boundary collaboration represents the prevailing pattern of behavior and activity among autonomous participants who have come together to achieve some collective purpose defined by one or more target goals” (Emerson & Nabatchi, 2015a, p. 18; see also Emerson et al., 2012). In essence, a CGR refers to a more institutionalized or embedded approach to collaborative governance, one where the specific ongoing operating system or arrangement engages multiple autonomous organizational actors in cross-boundary governing and management through the interaction of relational, behavioral, and functional components over a sustained period to achieve some collective purpose (Emerson & Nabatchi, 2015a; Nabatchi & Emerson, 2021).
Most studies center on individual collaborative governance arrangements, for example, a single case study in a particular policy context (Biddle, 2017; Doberstein, 2016; Emerson et al., 2012; Gerlak & Heikkila, 2011; Scott, 2011). A few analyses address a small number of comparative case studies (e.g., Bell & Scott, 2020; Brody, 2003; Heikkila & Gerlak, 2005; Imperial, 2005; Ulibarri, 2015a), and even fewer studies take a medium-n approach using one to two dozen cases (Douglas et al., 2020; Ulibarri et al., 2020). While these studies have generated useful knowledge, they do not examine what collaborative governance looks like when it encompasses multiple policy areas across a large-scale, multi-jurisdictional context.
Two challenges have impeded efforts to examine collaborative governance at scale. First, scholars have lacked concepts to explain the multi-scalar nature of collaborative governance. Recently, however, Ansell and Gash (2018, p. 20) introduced the concept of a collaborative platform, defined as “an organization or program with dedicated competencies and resources for facilitating the creation, adaptation and success of multiple or ongoing collaborative projects or networks.” A collaborative platform provides a structured framework for promoting CGRs that operate in the same policy field and work toward the same (or similar) ends (Cochran et al., 2019). Such platforms, often sponsored by a central entity (e.g., a state agency) and supported by other entities (e.g., technical assistance providers, funders, and policy makers) help the CGRs share information and resources and work to improve and advance CGRs’ individual and collective efforts (Cochran et al., 2019; see also Ansell & Gash, 2018). Similarly, Annis et al. (2020) developed the concept of a collaborative system, defined as “the larger institutional context or networked space in which CGRs and collaborative platforms are embedded.” The collaborative system concept suggests that CGRs do not always operate in silos, but rather can be networked with other CGRs within and across collaborative platforms, which themselves also can be networked.
Figure 1 offers an illustration of CGRs, collaborative platforms, and collaborative systems. Specifically, the outmost circle with the heavy line indicates the broader collaborative system, within which are four collaborative platforms (indicated by the medium-sized light gray circles). Within those collaborative platforms are several CGRs (indicated by the small dark gray circles) that all work on the same policy issue or toward the same goal. The figure also has several CGRs that are not embedded within a collaborative platform but remain in the larger collaborative systems. This is meant to indicate the CGRs within a collaborative system may or may not work within a collaborative platform.
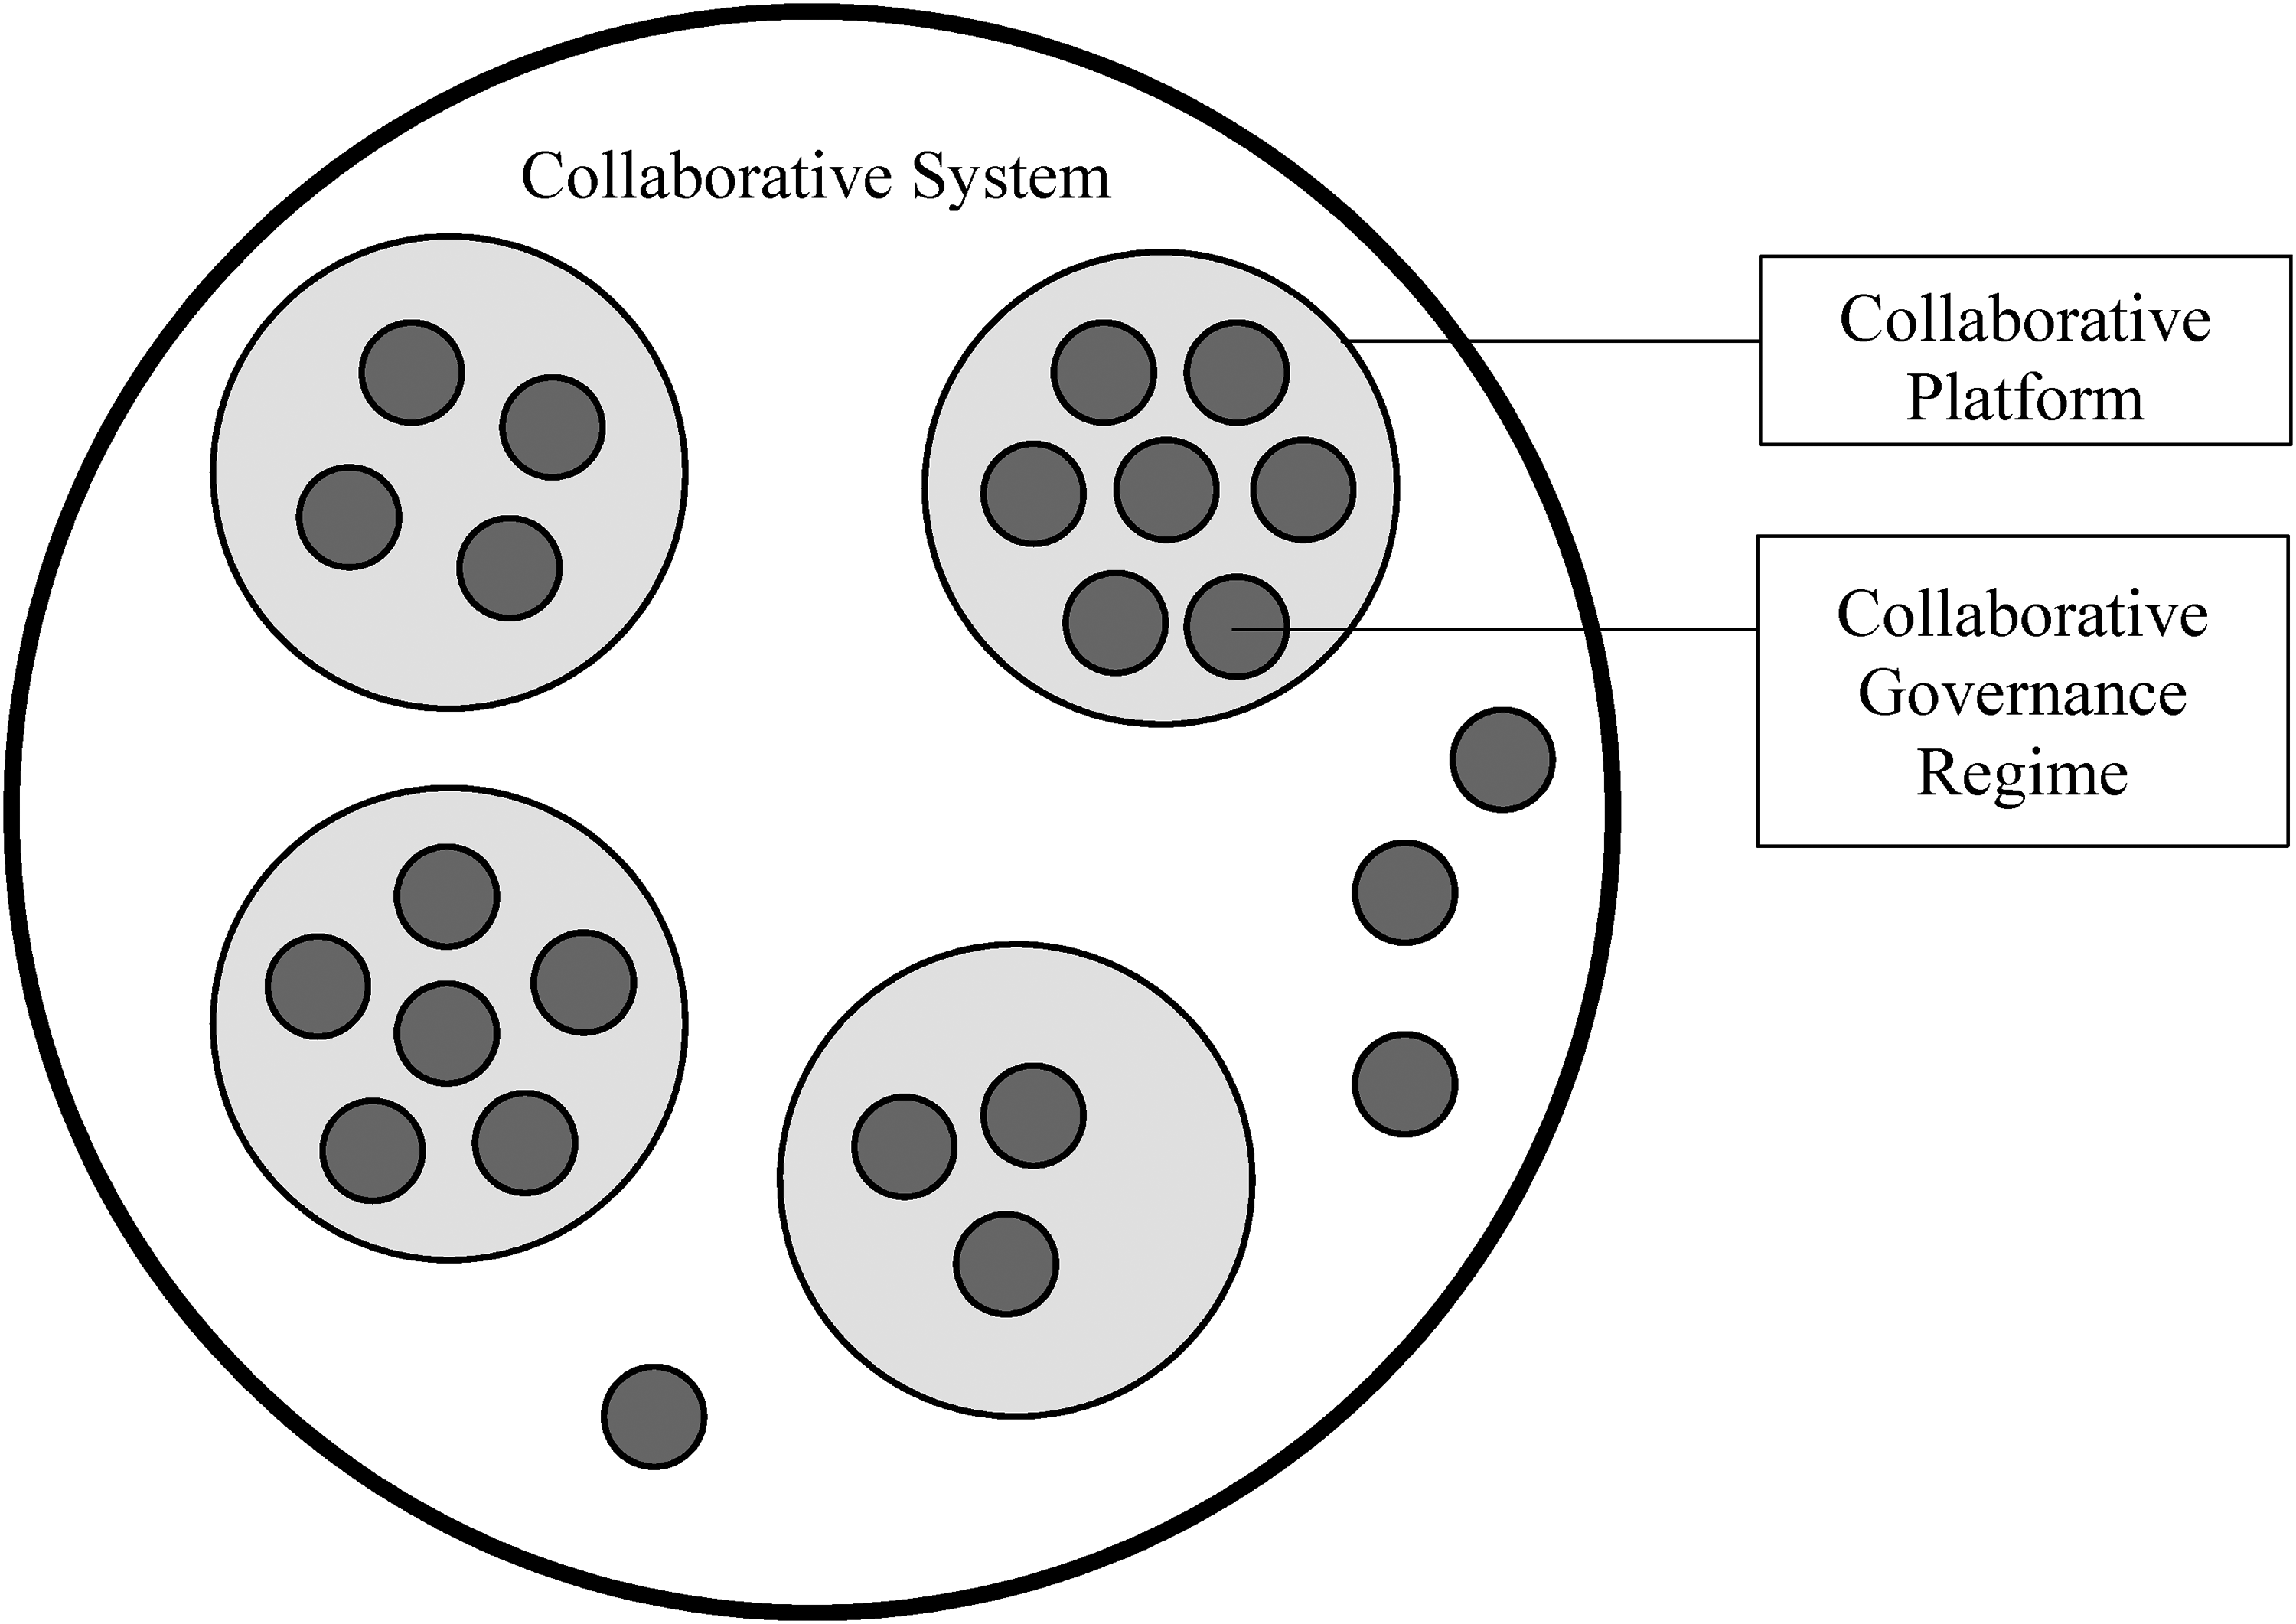
Illustration of collaborative governance regimes and collaborative platforms in a collaborative system.
Second, scholars have lacked research looking at multiple CGRs and platforms. Although the collaborative platforms and collaborative system concepts provide useful insights for understanding collaborative governance when applied in large-scale contexts, no analyses of multiple CGRs and platforms within a collaborative system exist. In this article, we take the first steps toward filling that gap by drawing on data about 241 externally directed CGRs operating across 13 collaborative platforms in five policy areas in the State of Oregon.
Collaborative Governance in Oregon
Oregon has been a pioneer and leader in the use of collaborative governance in the United States since the 1980s (Davis et al., 2015; O’Leary et al., 2006; Scott, 2016b). Its first experiments in collaborative governance can be traced to the state's Oregon Plan for Salmon and Watershed, which “relied on voluntary community-led work to solve a public problem [the endangered status of salmon populations] in a local way” (Fields et al., n.d.). Following the Oregon Plan, the state legislature passed a law giving counties the authority to create watershed councils that would use collaborative approaches to conserve and preserve watersheds and salmon habitats. These approaches were to be supported by the newly created Oregon Watershed Enhancement Board, which would come to act as a collaborative platform for the watershed councils.
The success of collaborative governance in improving watershed quality and salmon populations (see e.g., Dakins et al., 2005; Doherty, 2015; Ryan & Bidwell, 2007; Scott, 2016b) spurred what became called the “Oregon Way,” “The coming together of Oregonians from a variety of diverse backgrounds, to solve challenges that virtually everybody thinks cannot be solved” (Wyden, 2014) through “a political decision-making process that aims to overcome political barriers and achieve positive results for all in a respectful and inclusive manner” (Harris, 2019). As Dello (2019) notes, “The Oregon Way is more than a catchphrase—it's a framework for bottom-up collaborative approaches to solutions to challenges that the state faces. It is deeply embedded in the core values of generations of Oregonians, and it's evident across all types of policy in Oregon.” Indeed, the perceived strengths of “Oregon Way” are palpable in Oregon Solutions, a program initiated in 2001 “to develop sustainable solutions to community-based problems that support economic, environmental, and community objectives and that are built through the collaborative efforts of businesses, government, and nonprofit organizations” (https://orsolutions.org).
Since then, policy makers have used a variety of tools including legislation, policy mandates, and funding incentives to expand the use of collaborative governance not only in natural resources and economic development, but also in education, healthcare, and public safety. They also have created numerous platforms to support the efforts of localized CGRs operating within various policy areas. The presence of CGRs and collaborative platforms in multiple state-wide policy areas and in multiple jurisdictions 2 in Oregon provides an ideal context for examining collaborative governance at scale.
To this end, scholars from the National Policy Consensus Center at Portland State University and the Program for the Advancement of Research on Conflict and Collaboration at Syracuse University initiated a joint project called the Atlas of Collaboration. The goal of the project is to inventory and catalog the externally directed collaboratives and collaborative platforms operating in Oregon and eventually in other locations and policy areas. An externally directed CGR that either has been mandated by state legislation or agency action or incentivized via funding requirements (Emerson & Nabatchi, 2015a). 3 The platforms supporting these externally directed CGRs range in their degree of external direction from providing funding and information to mandating types of participation and decision rules.
Between 2018 and 2019, the team identified 241 externally directed CGRs operating across 13 collaborative platforms in five policy areas (economic development, education, health, natural resources, and public safety) in the State of Oregon. Many of the CGRs and platforms were identified through discussions with state-level technical assistance providers (e.g., the National Policy Consensus Center, the Association of Oregon Counties, and the Chalkboard Project). Table 1 provides an overview of the collaborative system in Oregon, by listing each policy area, providing the names, purposes, and supporting government authority(ies) of the collaborative platforms, and indicating the number of CGRs in each platform. For example, two collaborative platforms operate within the area of economic development: (1) Local Workforce Development Boards, a platform supported by the Oregon Workforce and Talent Development Board with nine CGRs that seek to catalyze economic opportunities in local communities through workforce education and training services, and (2) Regional Solutions Committees, a platform supported by the Oregon Governor's Office with eleven CGRs that seek to advance regional economic development by supporting locally driven economic decisions.
Policy Areas, Collaborative Platforms, and CGRs in Oregon.

In the following sections, we describe our data and the methods used to analyze the 241 CGRs in these 13 collaborative platforms. Specifically, we focus on their geographic scope, collaborative size, and collaborative characteristics.
Data and Methods
After identifying the CGRs and their associated platforms, the research team began to gather web-based data about each CGR. The team used two steps to determine the set of variables for data collection. First, the team reviewed the integrative framework for collaborative governance (Emerson et al., 2012; Emerson & Nabatchi, 2015a), as well as questionnaires developed by Huayhuaca (2019), and selected variables that likely would be available on websites or in other documents. Second, the team undertook an initial review of CGR websites to simultaneously add to and narrow the variables.
When the list of variables was finalized, the research team began reviewing CGR websites along with other online information compiled by state agencies in Oregon. At any given point in the data collection process, a minimum of three researchers entered data into web forms, which later were compiled into a spreadsheet. To help ensure consistency, an individual researcher typically handled all CGR entries for a particular platform. Moreover, the team randomly selected a set of CGRs from across the platforms to check for inter-coder reliability, which ranged from medium to high for all categories of data collected. Most data were collected between October 2018 and October 2019, although additional data on CGRs were added to the dataset in July 2020 to fill gaps.
The Oregon entry in the Atlas of Collaboration database has information on 241 externally directed CGRs in the state. Following recent research (Emerson et al., 2012; Emerson & Nabatchi, 2015a, p. 2015; Scott & Thomas, 2015; Ulibarri, 2015a, p. 2015), we examine key aspects of common interest, including (1) geographic scope (i.e., the spatial distribution of CGRs), (2) collaborative size (e.g., number of the individuals and organizations participating in the CGRs), and (3) collaborative characteristics (e.g., organizational form, lead organization, funding model, structural roles, staffing, extent of face-to-face dialogue in the CGRs). CGRs are the primary unit of analysis. We present descriptive statistics of CGRs by policy area and platform level in the following sections. We do not investigate any causal relationships, though such analyses are planned as data collection efforts progress.
While we recognize the limitations of descriptive analysis, we believe such analyses—and particularly descriptive analyses—serve important research purposes and can help with the development of useful insights about key variables and how collaborative governance operates in a cross-policy, state-wide collaborative system.
Results
We divide our results into three sections: (1) geographic scope, (2) collaborative size, and (3) collaborative characteristics. We report results for these attributes in the aggregate (i.e., for all CGRs in the collaborative system), as well as within and across collaborative platforms and policy areas.
Geographic Scope
Physical geography relates to the spatial distribution of CGRs. Figure 2 shows the geographic distribution of CGRs across the five policy areas and provides a sense of the diffusion and breadth of the externally directed collaborative system in Oregon. While the CGRs are dispersed across the state, some policy areas, such as natural resources, show more geographic concentration than others. Despite variation by policy area, Figure 3 shows that every county in Oregon has at least 10 to 15 CGRs, that most counties have 15 to 20 CGRs, and that two counties have over 30 CGRs. Additional analysis revealed that 177 CGRs (73%) operate across multiple jurisdictions and 64 CGRs (27%) operate within a single jurisdiction. Overall, the distribution of CGRs across the state is not surprising given state-level government mandates and incentives, however, the variations in their concentration are likely a result of multiple factors such as population size and density, geographic and environmental conditions, traditions and histories of collaboration, and strength of other governance structures. More research is needed to understand how the broader system context affects the distribution, concentration, and jurisdictional reach of CGRs.
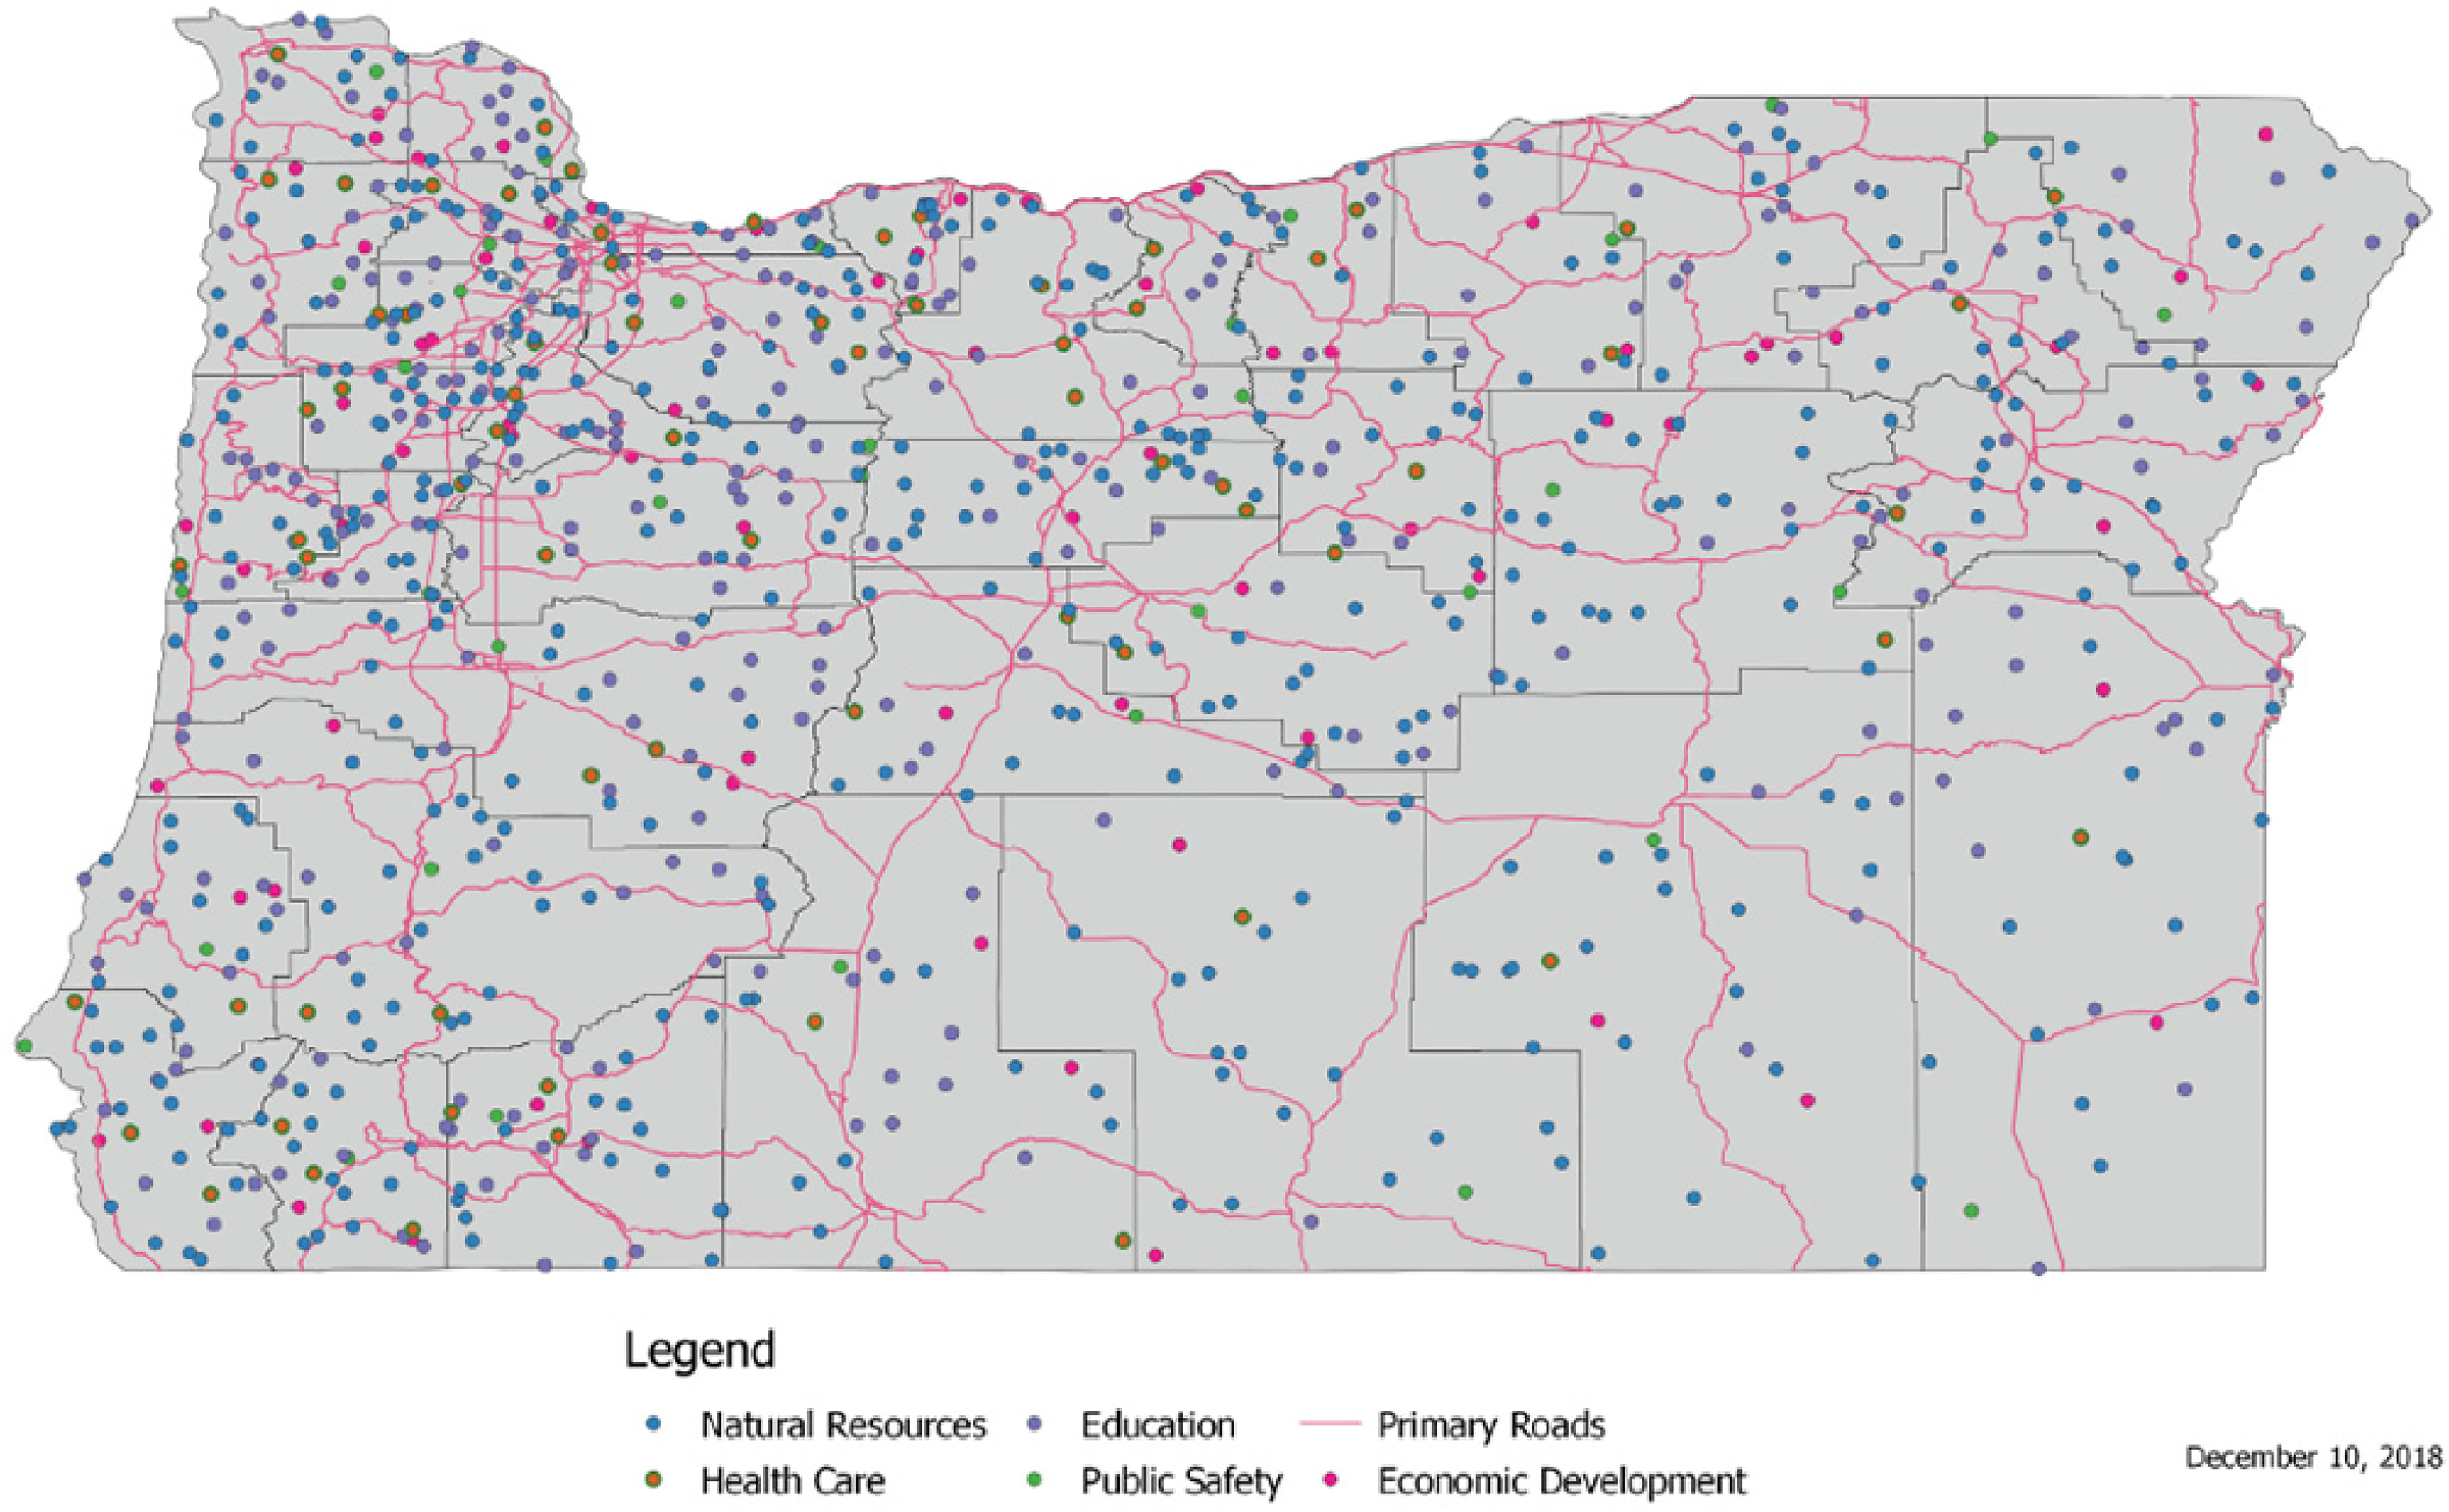
Geographic distribution of collaboratives by policy area.
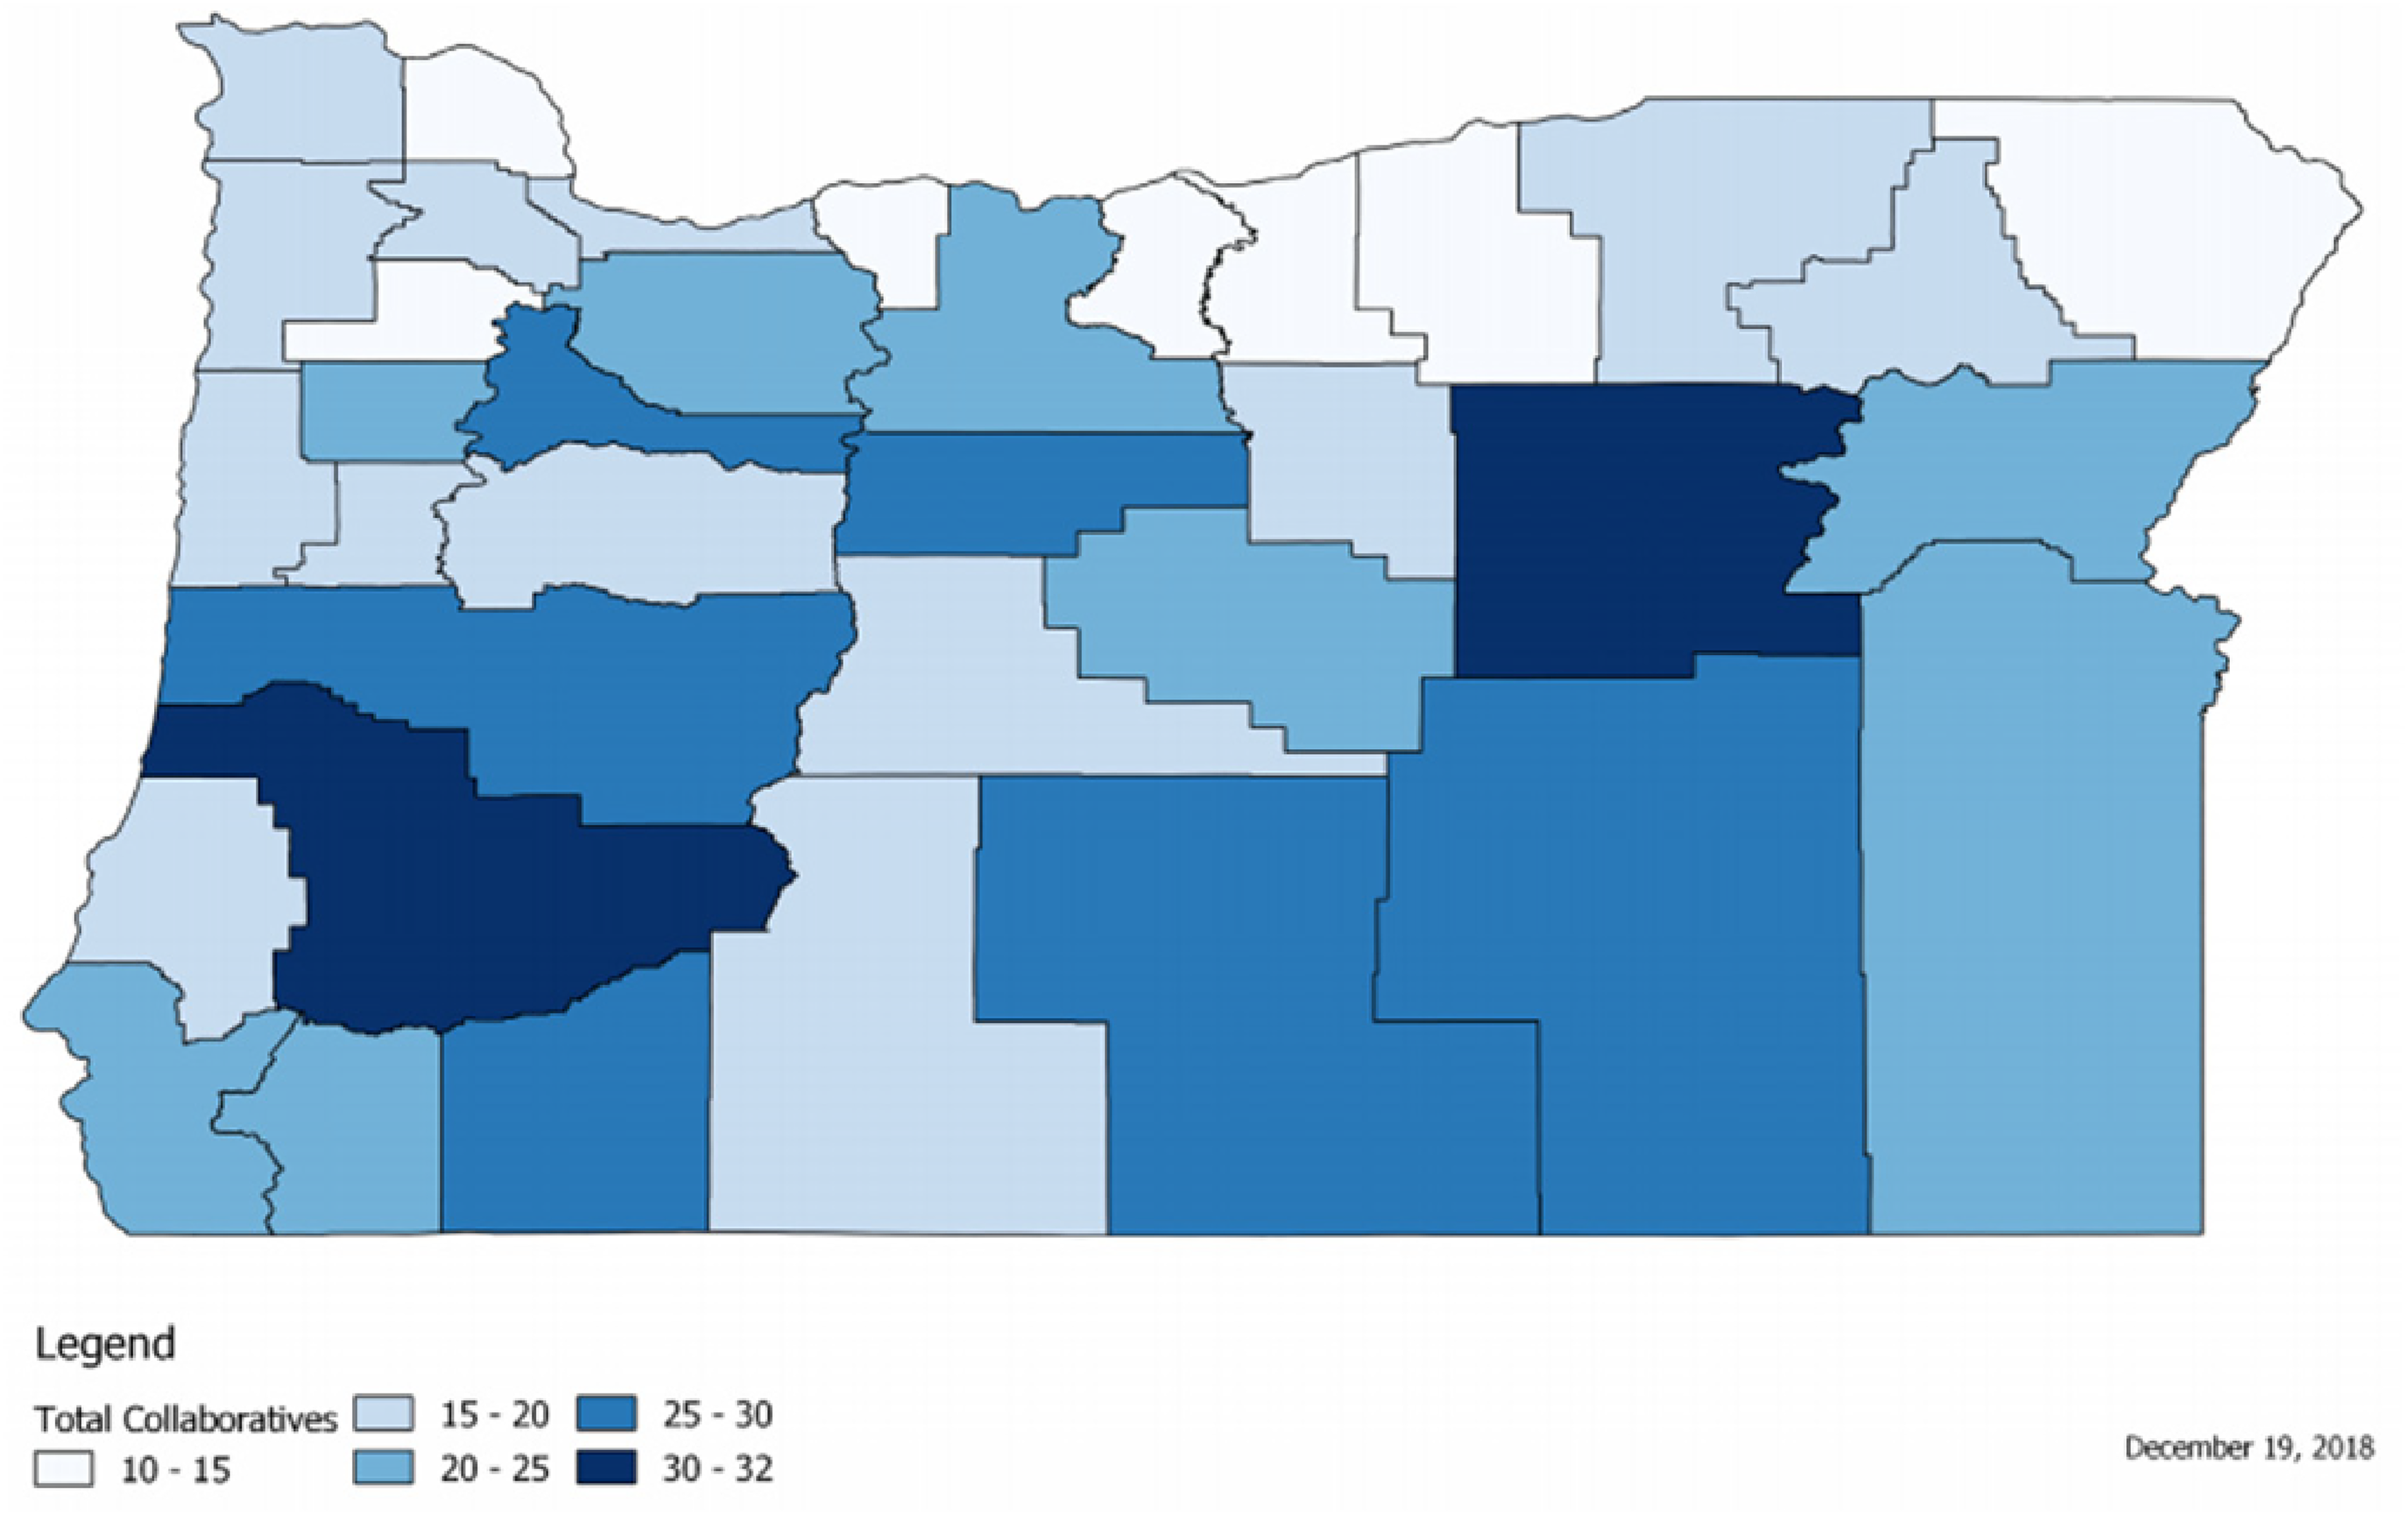
Density of collaboratives across counties.
Collaborative Size
The analysis of the collaborative size examines the number of organizations and the number of individual participants engaged in the CGRs in Oregon. We recognize the overlap in these two variables, but report both to offer a better sense of the scope of participation, since a CGR may involve numerous individuals but only a few organizations.
Number of organizations, measured as the mean number of organizations involved in the CGRs, is reported in Table 2 by policy area, collaborative platform, and the collaborative system. CGRs across all policy areas involve organizations from the public, private, and nonprofit sectors. On average, the individual CGRs involve 25 organizations, but wide variation exists across policy areas. For example, the single CGRs with the most participating organizations are in health policy (41 organizations) and education policy (30 organizations), while the single CGRs with the fewest participating organizations are in the policy areas of natural resources (22 organizations), economic development (18 organizations), and public safety (16 organizations). Variation also exists at the platform level. For example, in education policy, the Regional Health Equity Coalitions involve an average of 56 organizations, while the Early Learning Hubs involve an average of 18 organizations and STEM Hubs involve an average of 15 organizations. Similarly, in natural resources policy, the Place-Based Water Planning collaboratives involve an average of 53 organizations, while the Watershed Councils involve an average of 12 organizations.
Average Number of Organizations.
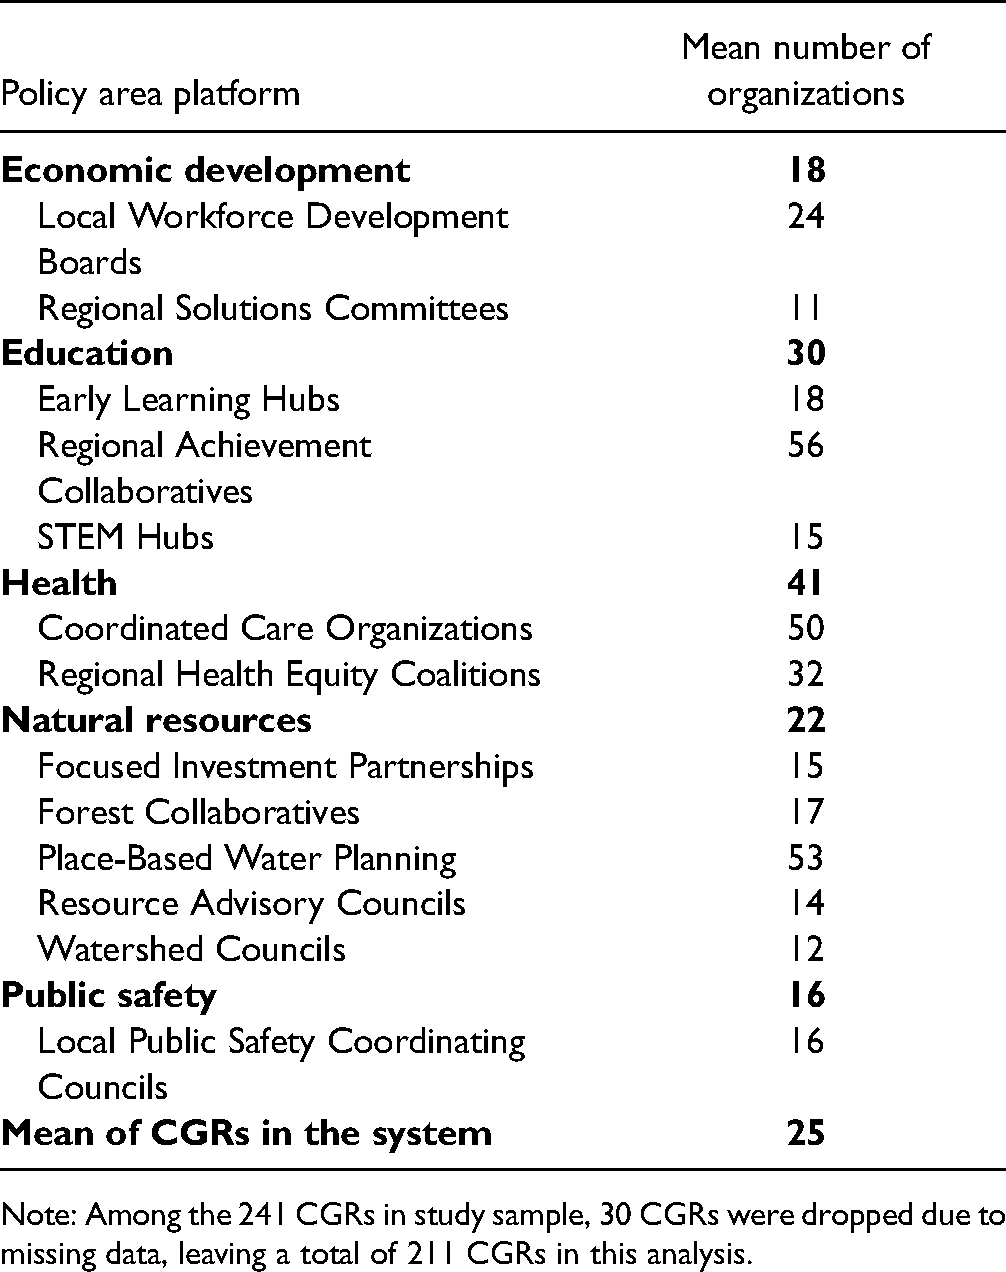
Note: Among the 241 CGRs in study sample, 30 CGRs were dropped due to missing data, leaving a total of 211 CGRs in this analysis.
Number of participants captures the number of individuals involved with the CGRs. The participants in the CGRs may consist of representatives from the public, private, and civic sectors, as well as people from other entities and the general community who have come together to achieve collaborative goals. In some cases, the types of representatives are dictated by state legislation or agency policy guidance. Individual participant data were not available on all CGR websites; therefore, we only report on nine of the 13 collaborative platforms for which we confidently were able to gather information. Together, these nine platforms engage nearly 2,900 people across the collaborative system, and among them, over 380 serve on more than two CGRs within and across policy areas. Table 3 reports summary statistics for the number of participants in CGRs by policy area and by platform.
Number of Participants.

Note: Participant information for some platforms (Regional Achievement Collaboratives, STEM Hubs, Regional Health Equity Coalitions, and Focused Investment Partnerships) is not presented due to limited data availability.
Across policy areas, the smallest CGRs are in education and natural resources (four participants), while the largest are in health (361 participants) and natural resources (53 participants). On average, however, the number of participants across policy fields ranges from 14 participants in public safety to 48 participants in health. Variation also exists across collaborative platforms. On average, the number of participants across collaborative platforms ranges from 12 to 48, with Watershed Councils engaging the fewest participants (12 people) and Coordinated Care Organizations engaging the most participants (48 people). Size differences exist within collaborative platforms as well. For example, the difference between the smallest and largest Resource Advisory Council is only seven participants, while the difference between the smallest and largest Coordinated Care Organization is 349 participants, and the difference between the smallest and largest Watershed Council is 35 participants.
A note about the Coordinated Care Organizations is useful. With 361 participants, one Coordinated Care Organization is a remarkable outlier. The size of this CGR is due, at least in part, to the presence of numerous county-level subcommittees within the collaborative that draw on multiple personnel from various levels within many organizations. When this CGR is removed from the analysis, the size of the other Coordinated Care Organizations becomes much more comparable within and across the platforms. Specifically, when the outlier is removed, the smallest CGR in this platform has 12 participants, while the largest has 44 participants, and the average is 26 participants.
Collaborative Characteristics
In this section, we analyze multiple CGR characteristics noted in the literature, including organizational form, lead organization, funding model, structural roles, staffing, and the extent of face-to-face meetings (e.g., Biddle, 2017; Clarke, 2017; Douglas et al., 2020; Mosley, 2012; Scott, 2016a, p. 2016; Ulibarri, 2015a, p. 2015).
Organizational form refers to the legal formation and structure of an entity. In this analysis, we identify the organizational form of CGRs as being (1) not incorporated, (2) having nonprofit (501(c)(3)) status, or (3) being a public entity (e.g., chartered under the Federal Advisory Committee Act, local public authority, or local public body such as counties or special districts). Table 4 shows that organizational forms vary by policy area and platforms. Across the collaborative system, most CGRs have nonprofit status (44%), while about one-third are public entities (32%), and about a quarter are not incorporated (24%). However, variations across policy areas and platforms exist. For example, CGRs in the economic development policy area are either nonprofit (42%) or public entities (58%), while CGRs in the education policy area primarily consist of not-incorporated entities (87%). Similarly, a majority of CGRs in health and natural resources are nonprofit organizations (67% and 75%, respectively), while all the CGRs in public safety are public entities.
Organizational Form.
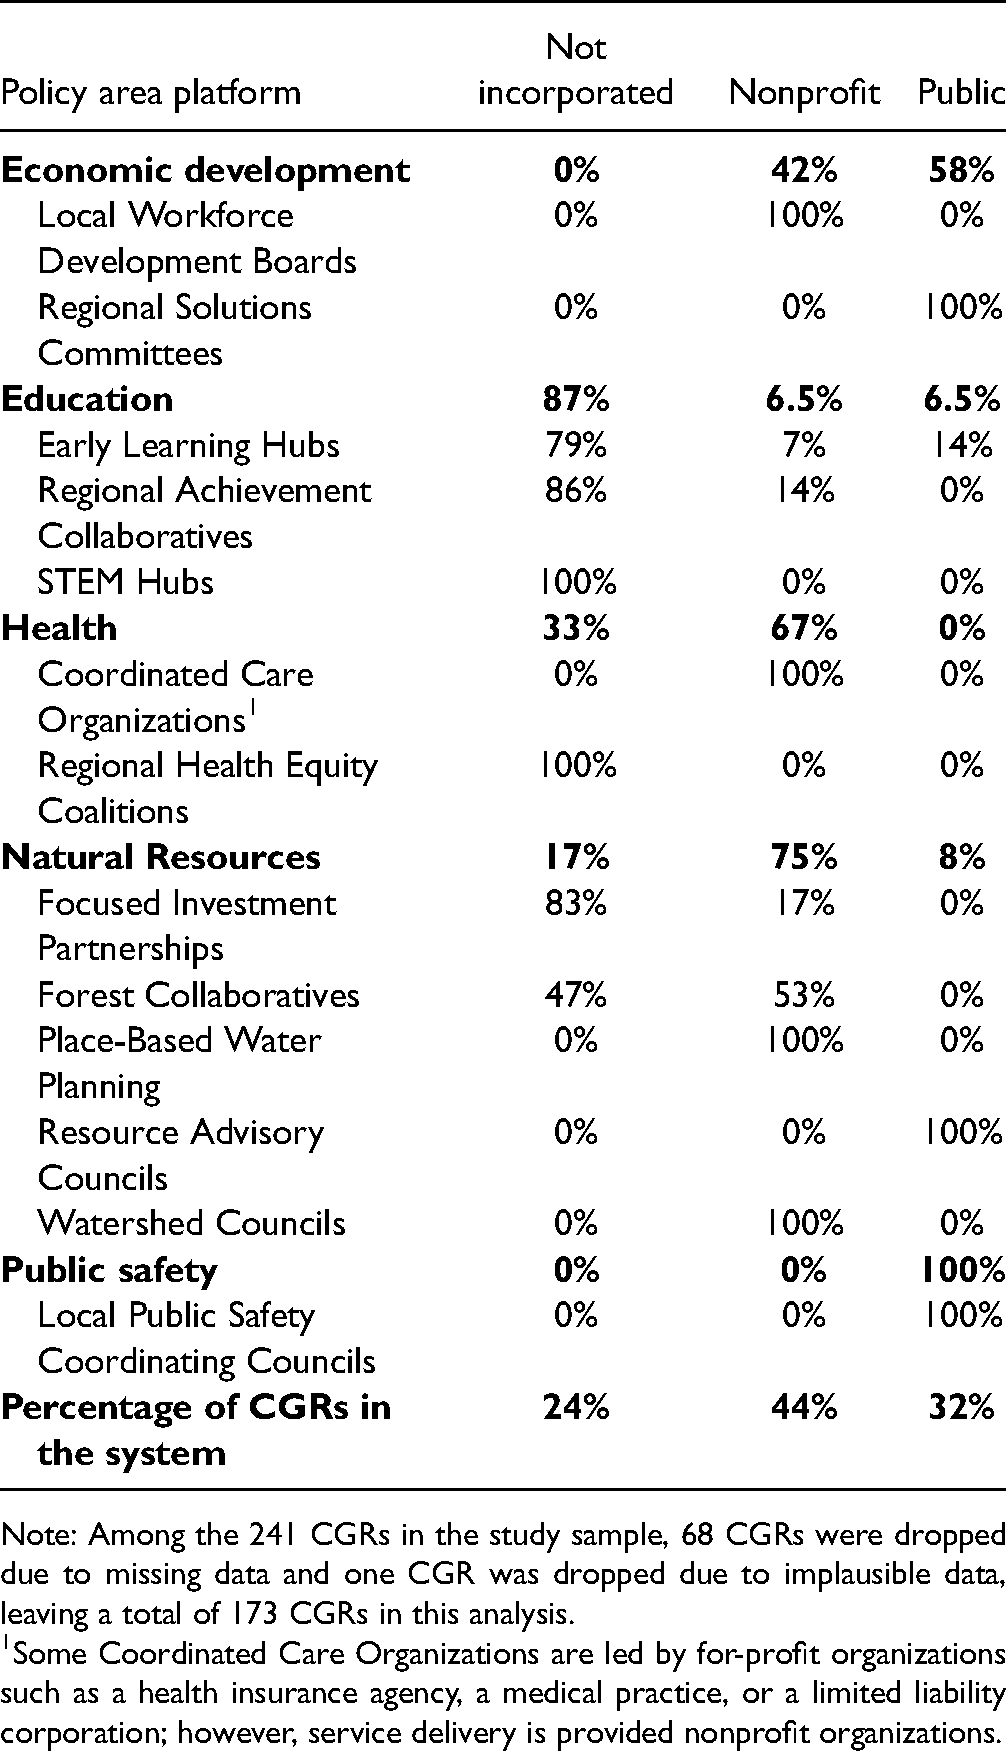
Note: Among the 241 CGRs in the study sample, 68 CGRs were dropped due to missing data and one CGR was dropped due to implausible data, leaving a total of 173 CGRs in this analysis.
Some Coordinated Care Organizations are led by for-profit organizations such as a health insurance agency, a medical practice, or a limited liability corporation; however, service delivery is provided nonprofit organizations.
The results also reveal large variations at the platform level. Within economic development, for example, all Local Workforce Development Boards are nonprofits, and all Regional Solutions Committees are public entities. Similarly, within health, most Coordinated Care Organizations are nonprofits, while all Regional Health Equity Coalitions are not incorporated. The most variation exists among the Early Learning Hubs, with 79% being not incorporated, 14% being public entities, and 7% being nonprofits.
Lead Organization refers to the type of organization listed as coordinating the overall effort of the CGR. Included in the categorization are political organizations (i.e., elected offices such as the Governor's Office, a County Commissioner office, or District Attorney office), public organizations (e.g., local or state government agencies), for-profit organizations, nonprofit organizations, and citizen organizations (e.g., community groups without a formal institutional affiliation). Table 5 shows the lead organization types across policy areas and platforms.
Lead Organization.
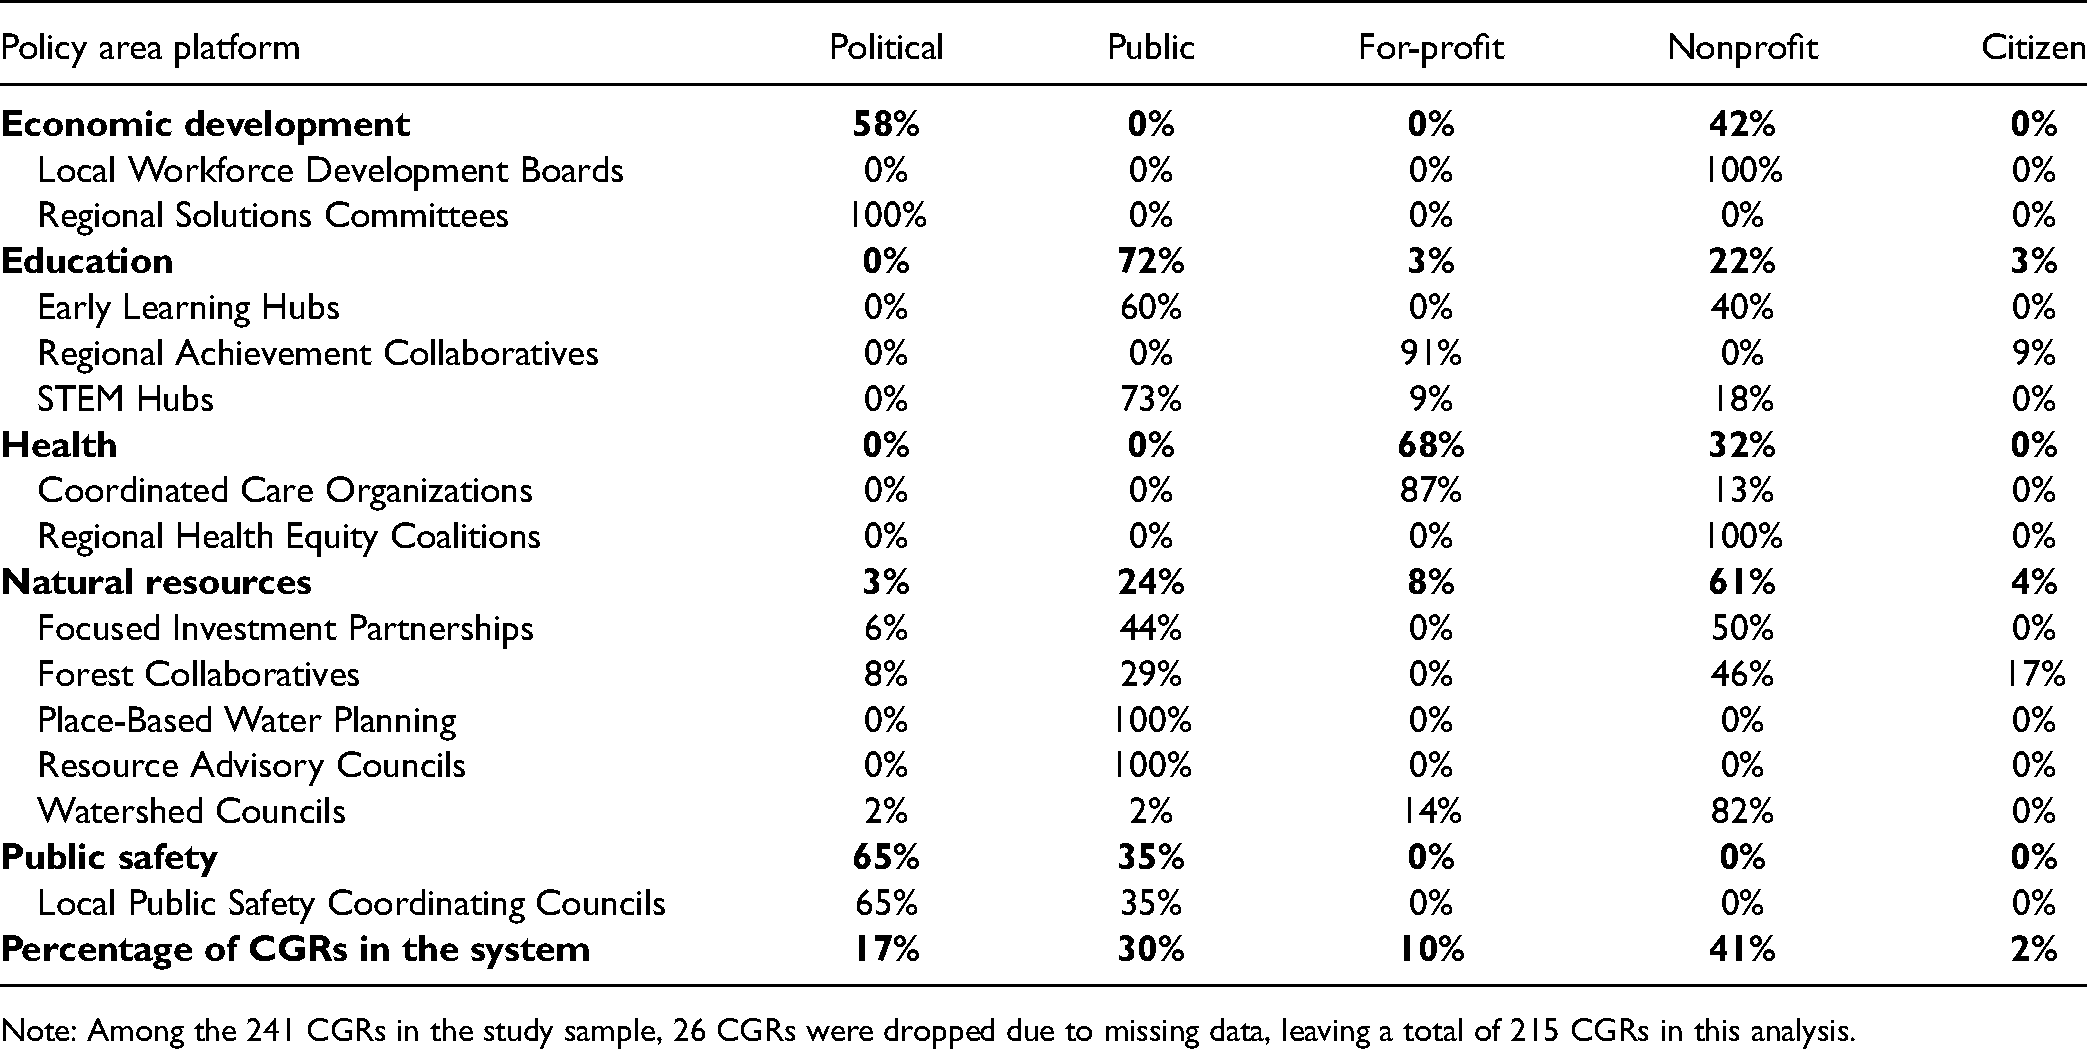
Note: Among the 241 CGRs in the study sample, 26 CGRs were dropped due to missing data, leaving a total of 215 CGRs in this analysis.
Across the collaborative system, 41% of CGRs are led by a nonprofit organization, while 30% are led by a public organization, 17% by a political organization, 10% by a for-profit organization, and 2% by a citizen organization. Patterns of variation can be seen across policy areas and platforms. At the policy level, three platforms have bifurcated variation in lead organizations. Specifically, 58% of CGRs within economic development are led by a political organization and 42% by a nonprofit, 68% of the CGRs within health are led by a for-profit organization and 32% by a nonprofit, and 65% of the CGRs within public safety are led by a political organization and 35% by a public organization. The two remaining policy areas have more variation in terms of lead organization. Specifically, 72% of the CGRs within education are led by a public organization, while 22% are led by a nonprofit, 3% by a for-profit, and 3% by a citizen organization. Likewise, in natural resources, 61% of CGRs are led by a nonprofit organization, while 24% are led by a public organization, 8% by a for-profit organization, 4% by a citizen organization, and 3% by a political organization.
The collaborative platforms show both consistency and variation in terms of lead organization. Some platforms have no variation. For example, all Regional Solutions Committees are led by political organizations, all Place-Based Water Planning groups and Resource Advisory Councils are led by public organizations, and all Local Workforce Development Boards and Regional Health Equity Coalitions are led by nonprofit organizations. Other platforms have bifurcated variation in terms of lead organization. For example, 91% of the Regional Achievement Collaboratives are led by for-profit organizations and 9% by citizen organizations, while 60% of the Early Learning Hubs are led by public organizations and 40% by nonprofits. Similarly, 87% of the Coordinated Care Organizations are led by for-profits and 13% by nonprofits, while 65% of the Local Public Safety Coordinating Councils are led by political organizations and 35% by other organizations. Still, other platforms, including the Stem Hubs, Focused Investment Partnerships, Forest Collaboratives, and Watershed Councils, have much more variation spanning three or more types of lead organizations.
Funding model refers to the sources from which a CGR obtains financial resources. While the amount of funding each CGR receives is an important variable, we do not have access to these data. However, our research shows that CGRs in Oregon receive funding from a variety of sources. Some receive funding from federal, state, and/or local government programs and grants, and others from nonprofits and private sector programs, grants, and support. Sometimes funding comes from a single sector, and other times it comes from a mix of sectors. Table 6 shows the funding models for CGRs across policy areas and platforms, as well as for the collaborative system.
Funding Models.
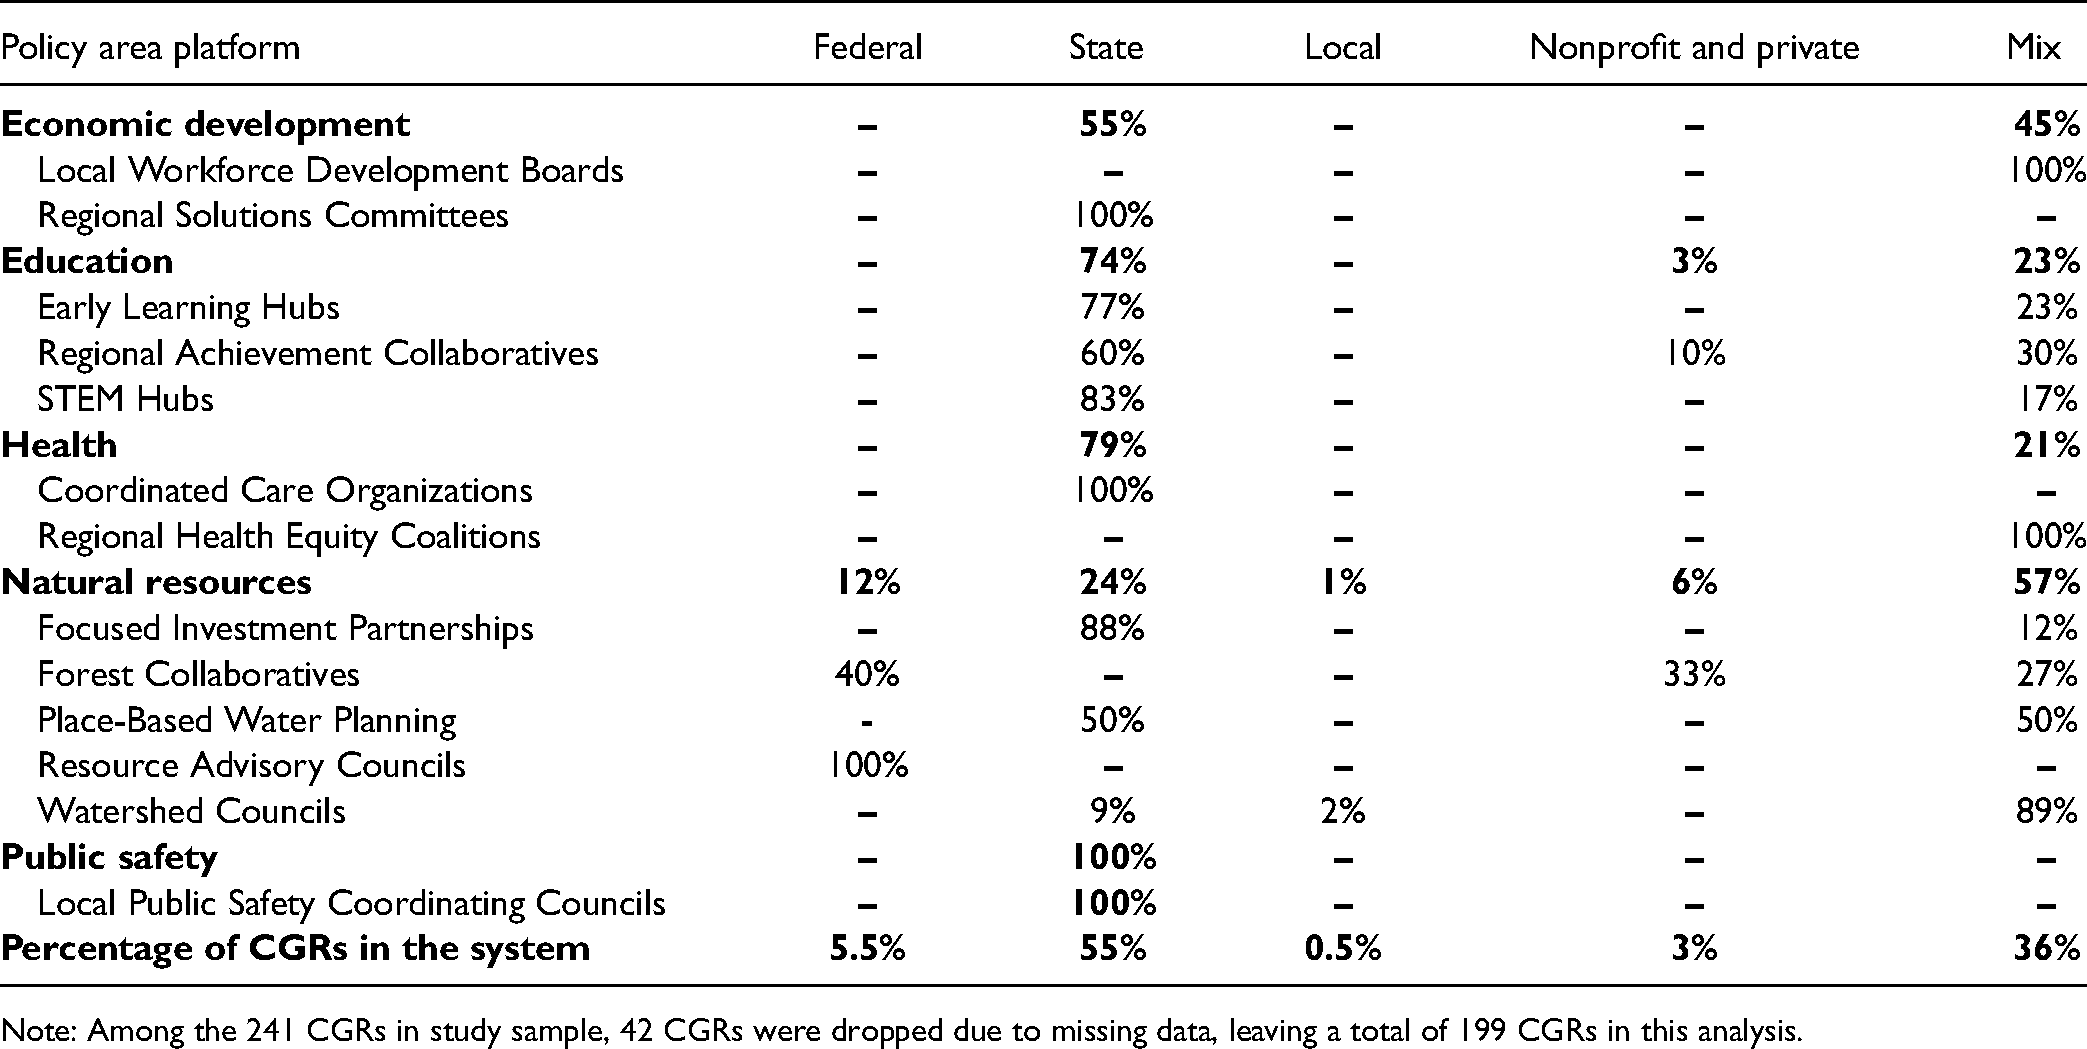
Note: Among the 241 CGRs in study sample, 42 CGRs were dropped due to missing data, leaving a total of 199 CGRs in this analysis.
Among all CGRs in the system, 61% receive funding from government, including state government (55%), federal government (5.5%), and local government (0.5%), while 36% receive funding from a mix of public, private, and nonprofit sources, and the remaining 3% receive nonprofit and private funding. Clear funding patterns exist within policy areas and platforms. For example, all CGRs in public safety receive their funding from the state government, and the majority of CGRs in economic development (55%), education (74%), and health (79%) rely on state funding. The largest variation exists within the natural resources area, with 57% of CGRs drawing on a mix of funding, and the remainder relying solely on state funding (24%), federal funding (12%), nonprofit and private funding (6%), or local government funding (1%). At the platform level within natural resources, all Resource Advisory Councils solely rely on federal funding, 89% of Watershed Councils rely on mixed funding, 88% of Focused Investment Partnerships, and 50% Place-Based Water Planning efforts rely on state government funding. In contrast, the Forest Collaboratives draw on several different funding sources, with 40% relying on federal sources, 33% on nonprofit and private sources, and 27% on mixed sources.
Structural roles are defined as the types of positions held by people in the CGR to execute its work. We identified three common structural roles in CGRs, including having a coordinator/facilitator, board/lead committee, and mixed (i.e., more than one role). Table 7 shows a rather consistent pattern of CGR structural roles across policy areas and platforms. Across the collaborative system, most CGRs have mixed structural roles (74%), and few have only a board/lead committee (14%) or a coordinator/facilitator (12%).
Structural Roles.
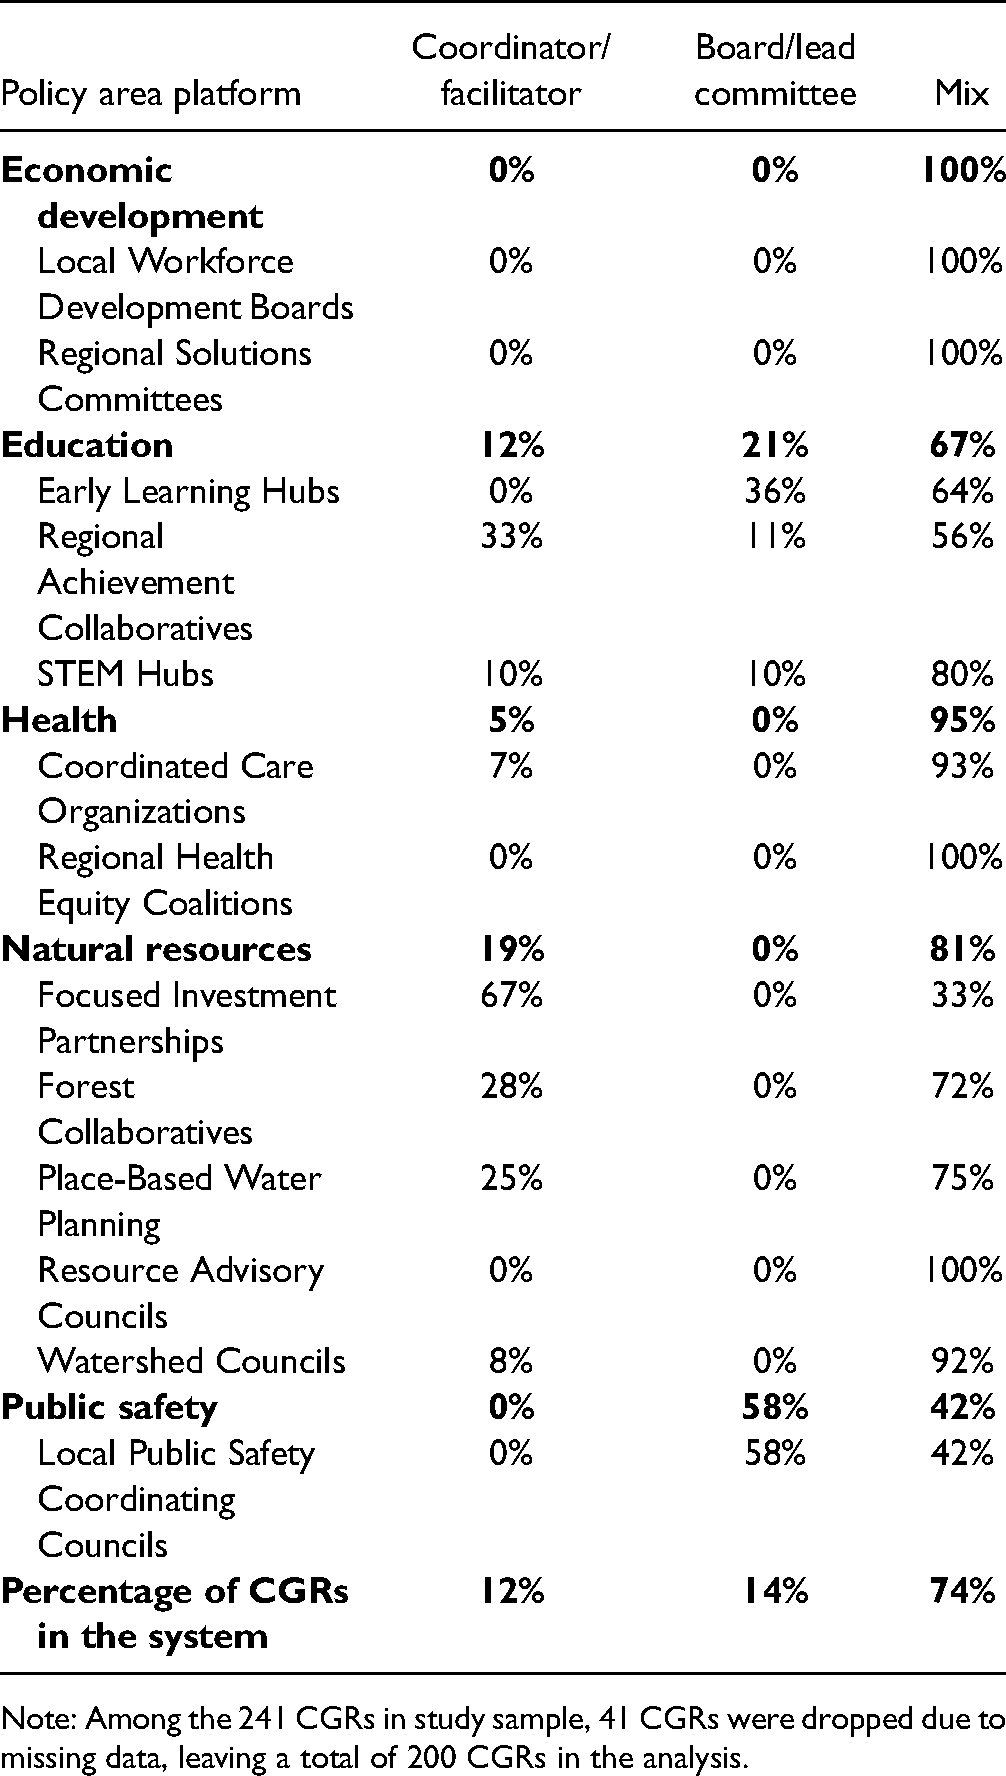
Note: Among the 241 CGRs in study sample, 41 CGRs were dropped due to missing data, leaving a total of 200 CGRs in the analysis.
Staffing, or the number of dedicated paid staff positions in a CGR, begins to capture the capacity of CGRs to do their work. To measure the number of dedicated paid staff, we calculated a full-time equivalent (FTE) indicator by adding the percentages of time dedicated by each employee listed on each CGR's website. Table 8 presents the median number of paid staff across policy areas and platforms, as well as for the collaborative system. We report the median rather than the mean given the skewed distribution of FTEs.
Number of Full-Time Equivalent (FTE) Paid Staff.
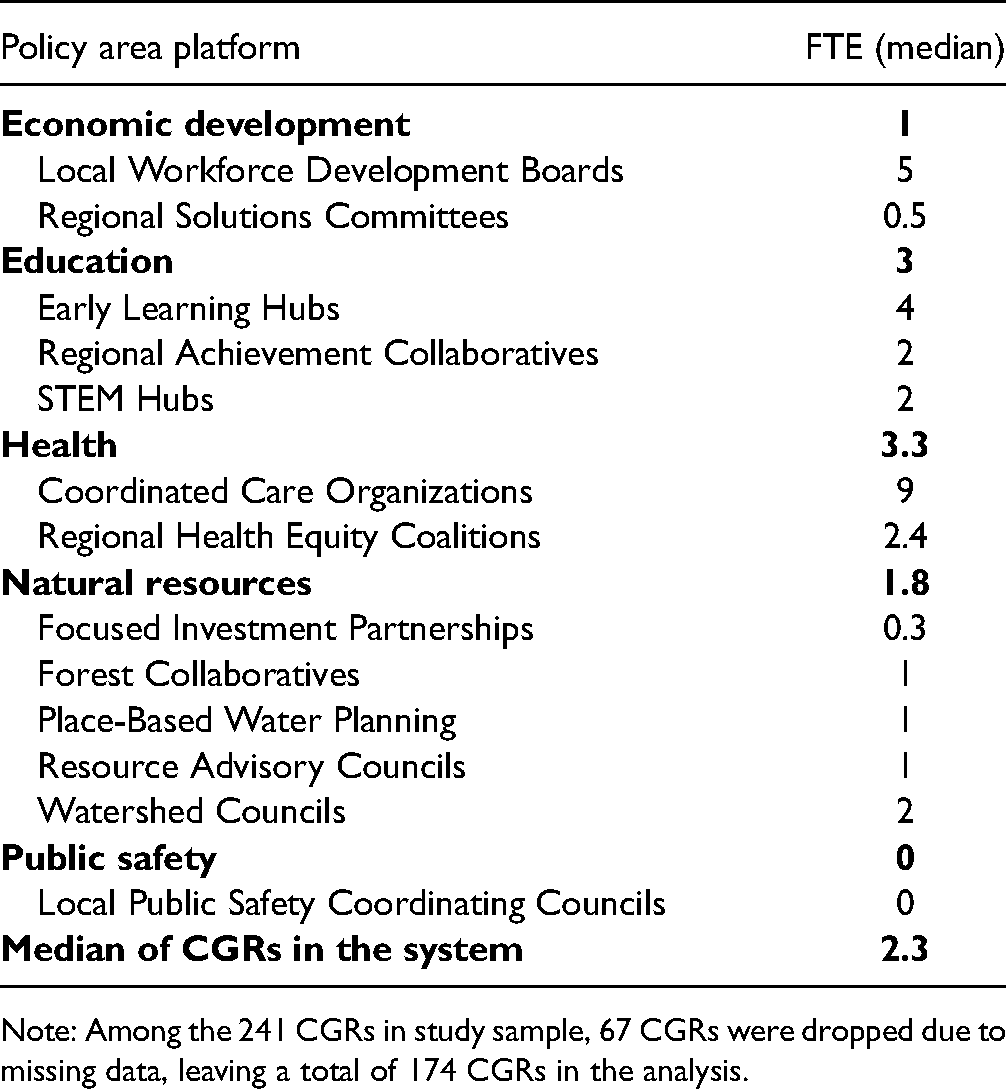
Note: Among the 241 CGRs in study sample, 67 CGRs were dropped due to missing data, leaving a total of 174 CGRs in the analysis.
For all CGRs in the system, the median number of staff across all CGRs is 2.3 FTE, but considerable variation exists across policy areas and collaborative platforms. At the policy level, for example, CGRs in health have the most staff (3.3 FTEs), followed by education (3.0 FTEs), natural resources (1.8 FTEs), and economic development (1 FTE). CGRs in public safety do not have dedicated, paid staff, although they do have a convener (such as the District Attorney) who does the work as part of their regular job. At the platform level, wide variation exists in economic development and health. In economic development, the median number of staff ranges from 5.0 FTEs for Local Workforce Development Boards to 0.5 for Regional Solutions Committees. Similarly, in health, the median number of staff ranges from 9.0 FTEs in Coordinated Care Organizations to 2.4 FTEs in Regional Health Equity Coalitions. We have some additional data regarding the coordinator/facilitator role for some CGRs. Specifically, for a subset of 152 CGRs, many have dedicated staff for their coordinator/facilitator position (71%). A total of 16% used dedicated staff supplied through the in-kind contribution of a participating organization, and 13% used dedicated staff paid by contract.
Extent of face-to-face dialogue captures the degree to which CGRs use in-person meetings to do their work. We measure the occurrence of face-to-face meetings as less than annually, annually to quarterly, quarterly, quarterly to monthly, and more than monthly. Table 9 shows the results across policy areas and platforms, as well as for the collaborative system. 4
Extent of Face-to-Face Meetings.

Note: Among the 241 CGRs in study sample, 73 CGRs were dropped from analysis due to missing data, leaving a total of 168 CGRs in the analysis.
For all CGRs across the system, most meet on a quarterly to monthly basis (43%), followed by a quarterly basis (31%), annually to quarterly (13%), more than monthly (10%), and less than annually (2%). Variations exist across policy areas and collaborative platforms. For example, CGRs in education and natural resources meet face-to-face across the full range of measures, from less than annually to more than monthly, and CGRs in economic development meet from annually to quarterly to more than monthly. CGRs in health meet at least quarterly, with most (74%) meeting quarterly to monthly, and all CGRs in public safety meet quarterly. At the platform level, several CGRs meet more than monthly, including 56% of the Forest Collaboratives, 50% of the Regional Health Equity Committees, 31% of the Early Learning Hubs, and 13% of the Coordinated Care Organizations. Several CGRs meet less than annually, including 17% of the Resource Advisory Councils, 17% of the STEM Hubs, 2% of the Watershed Councils, and 8% of the Early Learning Hubs.
Discussion
This article provides the first empirical, multi-policy area analysis of externally directed CGRs that either have been mandated by state legislation or agency action or incentivized via funding requirements. Taken together, the descriptive results about the geographic scope, collaborative size, and collaborative characteristics of the 241 CGRs provide useful insights into what a collaborative governance system looks like when it encompasses multiple policy areas and collaborative platforms.
First, collaborative efforts in all policy areas are geographically dispersed across Oregon. Most CGRs operate across multiple jurisdictions, although some operate within a single jurisdiction. Furthermore, some CGRs are concentrated in certain geographic locations such as densely populated counties. These findings give weight to the notion that collaborative governance may face different challenges and opportunities in engaging participants and securing resources depending on geographic variations such as urban versus rural regions (Hamilton & Lubell, 2018; Marwell & Calabrese, 2015; Mosley & Jarpe, 2019; Mosley & Park, 2021; Yoder et al., 2020).
Second, thousands of people are involved in CGRs representing organizations from the public, private, and nonprofit sectors. At the systems level, the CGRs involve 25 organizations on average, though this number varies considerably within and across platforms, as well as within and across policy areas. Future research should investigate whether and how group size influences membership, representation, and communication in collaborative decision making (Mosley & Wong, 2021; Siddiki et al., 2015). Future work on the Atlas of Collaboration project will explore the extent to which the state directs the numbers or types of organizational and/or individual participants, which may have implications for collaborative governance processes.
Third, the CGRs themselves vary across several characteristics, including organizational form, lead organization, funding model, structural roles, staffing, and the extent of face-to-face meetings. Across the collaborative system, most CGRs have nonprofit status, although about one-third are public entities and about a quarter are not incorporated. Likewise, most CGRs are led by nonprofit and public organizations, although nearly one-third are led by political, for-profit, or citizen organizations. Most receive funding only from government, and most frequently from state government, although about one-third have mixed funding sources, and a few receive only private funding. In terms of structural roles, nearly three-quarters have mixed roles, though some CGRs only have a board/lead committee or a coordinator/facilitator. Variations in staffing also exist, though the median number of paid staff at the system level is slightly more than two full-time equivalents. Finally, most CGRs meet on a quarterly to monthly basis or a quarterly basis, though some meet annually to quarterly or more than monthly, and very few meet less than annually. Overall, these findings provide descriptive evidence about key attributes of collaborative governance explored in the literature, including the leadership role of collaborative participants as convener and facilitator (Ansell & Gash, 2008; Emerson et al., 2009; Heikkila & Gerlak, 2005; Ulibarri, 2015b), role and size of staff and human capital (Hamilton & Lubell, 2018; Leach & Pelkey, 2001; Mosley, 2012; Scott, 2016a; Ulibarri, 2015b), and deliberation in face-to-face meetings (Biddle, 2017; Douglas et al., 2020; Scott, 2016b; Ulibarri, 2015a, p. 2015).
The variations in collaborative characteristics at the system level also are found across policy areas and platforms. While differences across the policy areas are to be expected, the differences within the platforms are somewhat surprising. Given that their work is externally directed by the state, one might expect more homogeneity in the operations and structures of CGRs within platforms. Still, the results suggest that state government plays a critical role in the initiation, development, and direction of CGRs through a variety of mechanisms, including at the very least, approval of organizational forms and funding.
Our findings shed light on several areas where additional empirical research is needed, including the role of government in shaping CGRs, collaborative platforms, and the collaborative system, the nature of the networked connections among CGRs and platforms within the collaborative system, and the effects of various structural characteristics on goal achievement and policy outcomes.
First, more research is needed to investigate the role of government in the initiation and promotion of CGRs, particularly in terms of how, through legislation and agency policy and action, government shapes the operation and structure of the CGRs within a collaborative platform, and how those platforms are connected and coordinated in the larger collaborative system. Studies emphasizing the nature or purpose of CGRs have grown over the years (Hardy & Koontz, 2008; Scott & Thomas, 2015; Scott, 2015, 2016a, 2016b), yet we still know little about the extent to which government enables and constrains collaborative governance through legislative or policy means, for example, by dictating organizational forms, lead organization and other structural elements, staffing, or participant requirements, or through operational mechanisms such as administrative support, funding, and incentives (Ansell & Gash, 2008; Emerson et al., 2012; Emerson & Nabatchi 2015a; Schneider et al., 2003). Similarly, we need more research examining how collaborative platforms facilitate and impede collaborative work at the individual and collective levels.
Second, more research is needed to explore the connections among CGRs within and across collaborative platforms, as well as among platforms within and across the entire collaborative system. Structural, affiliation, and relational information can reveal how CGR networks are situated in the broader collaborative system, allowing scholars to scale research on collaboration and understand whether, how, and to what extent the CGRs and collaborative platforms are connected in a networked space. Moreover, future research should investigate longitudinal aspects of CGRs, collaborative platforms, and collaborative systems, particularly in terms of how they develop and adapt over time.
Third, future research should examine the impacts of collaborative governance on their intended outcomes, that is, whether CGRs and collaborative platforms are achieving their goals and objectives and improving conditions or resources in their locus of action. Moreover, scholars should assess whether and how variations in geographic scope, collaborative size, and collaborative characteristics impact outcomes. Despite growing interest, empirical research on the performance of cross-boundary collaboration continues to be limited by conceptual and methodological challenges (e.g., Emerson & Nabatchi, 2015b; Gerlak et al., 2013), which is further complicated not only by variations in collaborative arrangements, but also by politics and law (Amsler, 2016; Amsler & Vieilledent, 2021), policy rules (Siddiki et al., 2015), and other factors. However, given that the CGRs and collaborative platforms in Oregon are externally directed, we presumably can determine what the state intended the CGRs to do and achieve, identify relevant outcome data collected by the state (or other entities), assess whether the CGRs are meeting their intended goals, and examine whether CGR features impact outcomes. Our research team is working to collect data that will allow us to conduct such assessments within and across policy fields. Such research on the efficacy of CGRs and collaborative platforms is necessary for advancing our understanding of where, when, and how collaborative does (and does not) work.
Finally, more research that centers on collaborative platforms as the unit of analysis is needed. For example, scholars should assess what the platforms look like, how they function and perform in terms of responsibilities, activities, and mechanisms, and whether they differ across policy domains. As with the other areas, our research team is working on data collection about collaborative platforms that will assist with these and other assessments.
Research addressing these and other areas becomes more feasible with the large-n data available in the Atlas of Collaboration, and the research team is already conducting such analyses. The current study aids those efforts by laying the groundwork for such research. The findings presented here are descriptive, derived from web-based data, and centered on collaborative governance in a single state, which means they may not be generalizable to other geographic locations. Future research may benefit from coupling web-based descriptive information with in-depth interview data to develop useful aggregate cases for theory development and empirical testing (e.g., Flyvbjerg, 2017; Ostrom, 1990; Provan & Milward, 1995). Nevertheless, the findings offer the first empirical, large-n assessment of what collaborative governance looks like across platforms, policy areas, and a collaborative system, providing an essential foundation for research questions that can be addressed in the future.
Conclusion
Over the last several decades, collaborative governance has moved from the occasional experiment to a mainstay practice in public administration and governance. Examples are readily found in virtually every policy area and around the world at every level of government from national to subnational. Until recently, most conceptual, theoretical, and empirical research focused on single cases of collaborative governance and did not explicitly address the use of multiple collaborative arrangements at larger scales, for example, within or across policy fields or localities. As a result, practitioners are left with little guidance on how to think about and organize such arrangements, even though such arrangements are increasingly common. However, new concepts, such as collaborative platforms (Ansell & Gash, 2018) and collaborative systems (Annis et al., 2020), can help both practitioners and scholars move beyond the single case of a CGR to explore and design the connections among multiple CGRs in a broader landscape.
The State of Oregon has a long history of using collaborative governance to address myriad policy issues, and has, over the last few decades, worked to expand and support collaborative efforts (Scott, 2016b). The externally directed CGRs and platforms in Oregon's collaborative system can serve as a model for practitioners, including state agency coordinators and on-the-ground collaborative staff and participants, as they seek to expand and strengthen collaborative work in and across their jurisdictions. Our descriptive exploration of the collaborative system in Oregon shows significant variations across CGRs at the platform, policy, and system levels, suggesting that there is no “one-size-fits-all” approach to collaborative governance. Still, understanding the broader landscape of CGRs in a region or a state, as well as their operationalization through collaborative platforms and the collaborative system, can inform policy makers and public administrators about different options for advancing collaborative governance at a larger scale. As we continue to examine the CGRs, collaborative platforms, and collaborative systems in Oregon, and work to expand the Atlas of Collaboration project, scholars will be better able to conduct the kinds of multi-scale, system-level analyses needed to inform practitioners about how to create and support larger, complex ecosystems of collaborative governance.
Footnotes
Acknowledgments
The authors would like to thank Rebecca McLain, Qasim Mehdi, Jiho Kim, and Brian Ohl for their comments on previous versions of the manuscript.
Declaration of Conflicting Interests
The authors declared no potential conflicts of interest with respect to the research, authorship, and/or publication of this article.
Funding
The authors received no financial support for the research, authorship, and/or publication of this article.