



Abstract
Background
Measurements of attenuation (in Hounsfield units [HU]) and contrast wash-out are widely used to characterize adrenal lesions as benign or indeterminate/malignant at computed tomography (CT). Clinical experience suggests that such measurements of adrenal lesions may vary over time and between observers, making evaluation difficult.
Purpose
To investigate the change over time of adrenal lesion size, attenuation, and contrast wash-out at CT, to determine inter-observer variability, and to analyze other factors underlying the variability.
Material and Methods
In a cohort of patients, with or without malignant disease, undergoing CT, adrenal lesions were prospectively analyzed. Lesions with growth >20% or >5 mm over 6 months were excluded. Non-enhanced attenuation and contrast medium wash-out over 2-year follow-up were analyzed. An inter-observer analysis with five observers and a phantom study of eight different CT scanners were performed to assess measurement variability.
Results
Mean adrenal lesion non-enhanced attenuation values decreased by 0.5 HU/year during follow-up. Using 10 HU or 40% relative wash-out as threshold values for benign versus indeterminate lesions, 27 (20%) and 39 (29%) of 136 lesions, respectively, would be reclassified at some occasion during follow-up. In the observer analysis 37 of 40 lesions demonstrated agreement between all observers, using established threshold values. The phantom study showed an intra-scanner variability of 1–3 HU, but an inter-scanner variability of up to 8 HU for water.
Conclusion
The clinically widespread use of specific attenuation threshold values for characterizing adrenal lesions must be used with great caution, considering that multiple factors, related to patient, equipment, scanning technique, and observer influence the outcome.
Several studies have shown the ability of CT to distinguish between benign and malignant adrenal lesions by measuring the lesion attenuation in absolute Hounsfield unit (HU) values on native images or by the calculation of the time-dependent percentage wash-out of intravenously injected contrast material. Many benign adrenal adenomas are rich in intracytoplasmic lipid, which lowers the density and hence reduces the unenhanced CT number. Such benign adrenal lesions will typically have attenuation values ≤10 HU (1, 2), while some benign adenomas as well as most malignant adrenal lesions are lipid poor and therefore have higher attenuation values. If a lesion is lipid poor the absolute or relative percentage wash-out of contrast material can be calculated using the CT numbers of the lesion on native and/or early (venous phase, 60–90 s) and late (10–15 min) contrast-enhanced series. Benign adenomas are characterized by a higher percentage wash-out in the late phase as compared to non-benign lesions, and cut-off values for differentiation between benign and non-benign lesions have been established (3–7). In daily practice, such cut-off values, e.g. 10 HU on non-enhanced images and 40–60% wash-out, are now widely used for clinical decision-making. However, clinical radiologists often experience difficulties in applying such strict cut-offs when measuring and interpreting the attenuation, as it may vary between CT slices of the same lesion, between scanners and sometimes over time in the same patient. Thus, several technical parameters have been shown to have an impact on the estimated attenuation of the tissue and the accuracy of CT numbers has been questioned (8–11). For example, if scanning protocols with similar parameters are used on different scanners on the same objects some diversity will still occur in the attenuation values (12).
As differentiation between a benign adenoma and a malignant lesion may have a profound impact on patient handling, it is of fundamental importance to understand, and minimize, the factors that contribute to the variability in characterizing adrenal lesions.
The aim of this clinical and experimental study was to investigate change over time of size, attenuation, and contrast wash-out characteristics of adrenal lesions, and to determine the inter-observer and inter-scanner variability.
Material and Methods
Variability of adrenal characterization over time
Patients
A prospective study on incidentally detected adrenal lesions was performed in the region of Västra Götaland including the northern part of the county of Halland (total population of 1.7 million inhabitants), Sweden, from October 2002 to April 2004. All adult patients (≥18 years) with an adrenal lesion detected at CT, magnetic resonance imaging (MRI) or ultrasonography (US) were reported from the radiology departments and a 2-year clinical and radiological follow-up program was performed. A radiological re-evaluation of 3827 randomly selected CT cases from the original cohort was performed in order to confirm the detection rate, and patients with adrenal lesions not earlier reported to the study were thereby included in the follow-up. Detection and follow-up data have been presented earlier (13, 14).
In the present study, patients without as well as with extra-adrenal malignancy were included. In order to minimize the risk of including fast growing, malignant lesions that exhibit obvious interval change in size and attenuation, lesions had to exhibit size stability for at least 6 months at CT, using criteria adopted from RECIST, version 1.1 (15). Growth was defined as an increase in lesion diameter >20% (at least >5 mm) and decrease in size as a decrease in diameter >30%.
All available patients with two or more dedicated adrenal CT examinations were analyzed (n = 113). Lesions radiologically characterized as a cyst or a hematoma were excluded from this analysis. Adrenal lesion attenuation on unenhanced series and relative percentage wash-out calculations were compared over time.
Among these 113 patients, 33 were randomly selected for a comparison of attenuation in the adrenal lesion, aorta and portal vein to investigate the influence of vascular enhancement on the attenuation of the adrenal lesions. Measurements in aorta were made at the level of the superior mesenteric artery exit and the portal vein was measured close to the superior mesenteric vein entry.
In addition, 57 patients with follow-up abdominal CT other than dedicated adrenal CT were included in an analysis regarding variations in lesion size and attenuation values on unenhanced CT over time. Thus, this analysis comprised a total of 170 patients.
The patient study was approved by the local Regional Ethical Review Board (s202–02).
CT scanners and protocol
During the inclusion and follow-up period, a variety of CT scanners were used in the centers of the study region. Initially, there were two non-spiral, 10 single-detector CT (SDCT), seven 4-slice, one 8-slice, and one 16-slice multidetector CT (MDCT) in the region. Throughout the study period until latest follow-up examinations in 2007, CT scanners were gradually replaced by 8-, 16-, and 64-slice MDCTs. All scanners were maintained and calibrated according to the manufactures' specifications by the manufacturers' service personnel.
The examinations at which the adrenal lesions were incidentally detected were performed according to routine protocols designed for the specific clinical situation. Follow-up examinations, on the other hand, were performed according to a predesigned dedicated adrenal CT protocol; an unenhanced scan followed by a contrast-enhanced scan 80 s after the start of injection and a delayed scan after 10 min. Single-detector CT scan parameters were: tube voltage, 120 kV; tube current, 250 mA; rotation time, 0.7–1.0 s; slice thickness, ≤3 mm; interval, 2.0 mm; pitch, 1:5; and reconstruction algorithm for abdominal imaging. A corresponding protocol was used with MDCT but usually with thinner scan slices reconstructed to 2–3 mm. Intravenous contrast medium used was of non-ionic low- or iso-osmolar type with a concentration of 300 mg I/mL and an injection rate of 3 mL/s.
All examinations from the different hospitals were sent to a common regional digital image archive which made it possible to view all images on the same digital radiological workstation (Centricity RA600; GE Healthcare, Chalfont St. Giles, UK) at the study center, using a high-resolution screen (Coronis 3 MP; Barco N.V., Kortrijk, Belgium) calibrated according to DICOM PS 3.14-2009 (16). All measurements were done using the same equipment.
Lesion measurements
For every adrenal lesion, comparison between CT examinations was made at the same occasion. Lesion size was defined as its largest diameter on transaxial images obtained in venous phase. Attenuation of the lesion was measured with an oval or round region of interest (ROI), as large as possible but avoiding lesion borders (at least covering half of the lesion area). Necrotic, cystic, hemorrhagic, and calcified areas were avoided if possible. A mean attenuation value was calculated from at least two measurements in each scanning phase (unenhanced, enhanced, and delayed phases). Relative wash-out was calculated with the aid of a computer software (OmniVis 4.0, GE Healthcare, Stockholm, Sweden) using the following equation for relative percentage wash-out (RPW):

Inter-observer analyses
Inter-observer variation in assessing size, attenuation, and contrast wash-out of adrenal lesions was determined by measurements performed by five observers independently. All were board-certified radiologists, specialized in abdominal imaging (experience ranging from 1–30 years). The observers were blinded to clinical history, radiological, and other patient information, and the patient identity was replaced by code numbers.
Patients with documented adrenal lesions, examined with a dedicated adrenal CT protocol at the study center during a 7-month period (from 1 May 2010 to 31 Dec 2010), were included in the analysis (n = 40). These patients were examined with 8- or 16-MDCT scanners routinely used at the study center (LightSpeed Ultra and LightSpeed Pro 16; GE Healthcare, Milwaukee, WI, USA).
The dedicated adrenal CT protocol included an unenhanced scan, a contrast-enhanced scan in the venous phase (70–80 s after the start of injection) and a late scan after 15 min. Helical 0.7 s per rotation scans were obtained with tube voltage 120 kV, tube current 440 mA, beam collimation 10 mm, slice thickness 2.5 mm with an interval of 2.0 mm, pitch 0.94 or 1.35, 50-cm scan field of view (SFOV) and display field of view (DFOV) of 36 cm and standard reconstruction algorithm.
The instructions to the observers were the same as those used in the original adrenal study, i.e. adrenal lesion size and attenuation were to be measured in the same way as described earlier. All measurements by all observers were performed on the same digital radiological workstation (Centricity RA600; GE Healthcare, Chalfont St. Giles, UK) using a high resolution screen (Coronis 3 MP; Barco N.V., Kortrijk, Belgium) calibrated according to DICOM part 14 (16) before the analysis. In case of bilateral adrenal lesions, the protocol specified which side to measure (right or left). If there were multiple adrenal lesions on one side, the observer should select the largest lesion for the analysis. The observers were asked to use the abdominal window settings by which they could appreciate the lesion best (close to window width 40 HU; level 400 HU). Based on the observer measurements, relative wash-out values for each lesion and each observer were later calculated by one radiologist (LH) according to the equations given above. As the dedicated adrenal CT protocol of the study center had changed after the adrenal study follow-up was completed a delayed phase of 15 min was used instead of 10 min. Thus a threshold of ≤10 HU on unenhanced images and/or a RPW >50% was used to categorize lesions as benign; the other lesions were categorized as indeterminate (5).
Phantom analysis
In order to analyze variation of CT attenuation in the same object between different scanner types, a body CT phantom (RMI, model 461A, snr 461A1077, Radiation Measurement Inc., Middleton, WI, USA) was used. The phantom is a uniform disc of Solid Water® phantom material (water equivalent), 6 cm thick and 33 cm in outer diameter (Fig. 1). It has nine conical tapered insert cavities of identical sizes (4.5 cm in diameter centrally). In the central conical insert a test tube measuring 2.7 cm in diameter is placed, making it possible to scan different materials. Solid water inserts are used in the rest of the cavities. The center of the phantom was placed in the isocentre of the gantry. All images were analyzed in the same digital radiological workstation (Centricity RA600, GE Healthcare) as described above. Attenuation measurements of the central inserts were made in the three most central images. Measurements were made with a ROI size of approximately 200–250 mm2, and a mean value was calculated. The ROI standard deviation displayed on the workstation was also noted.
(a) Body CT phantom used in the study (RMI, model 461A, snr 461A1077, Radiation Measurement Inc., Middleton, USA). (b) Conical tapered inserts of uniform water equivalent composition (Solid water®). (c) Centrally placed insert with possibility to contain test tubes. (d) Different test tubes containing tap water, acrylic, and polypropylene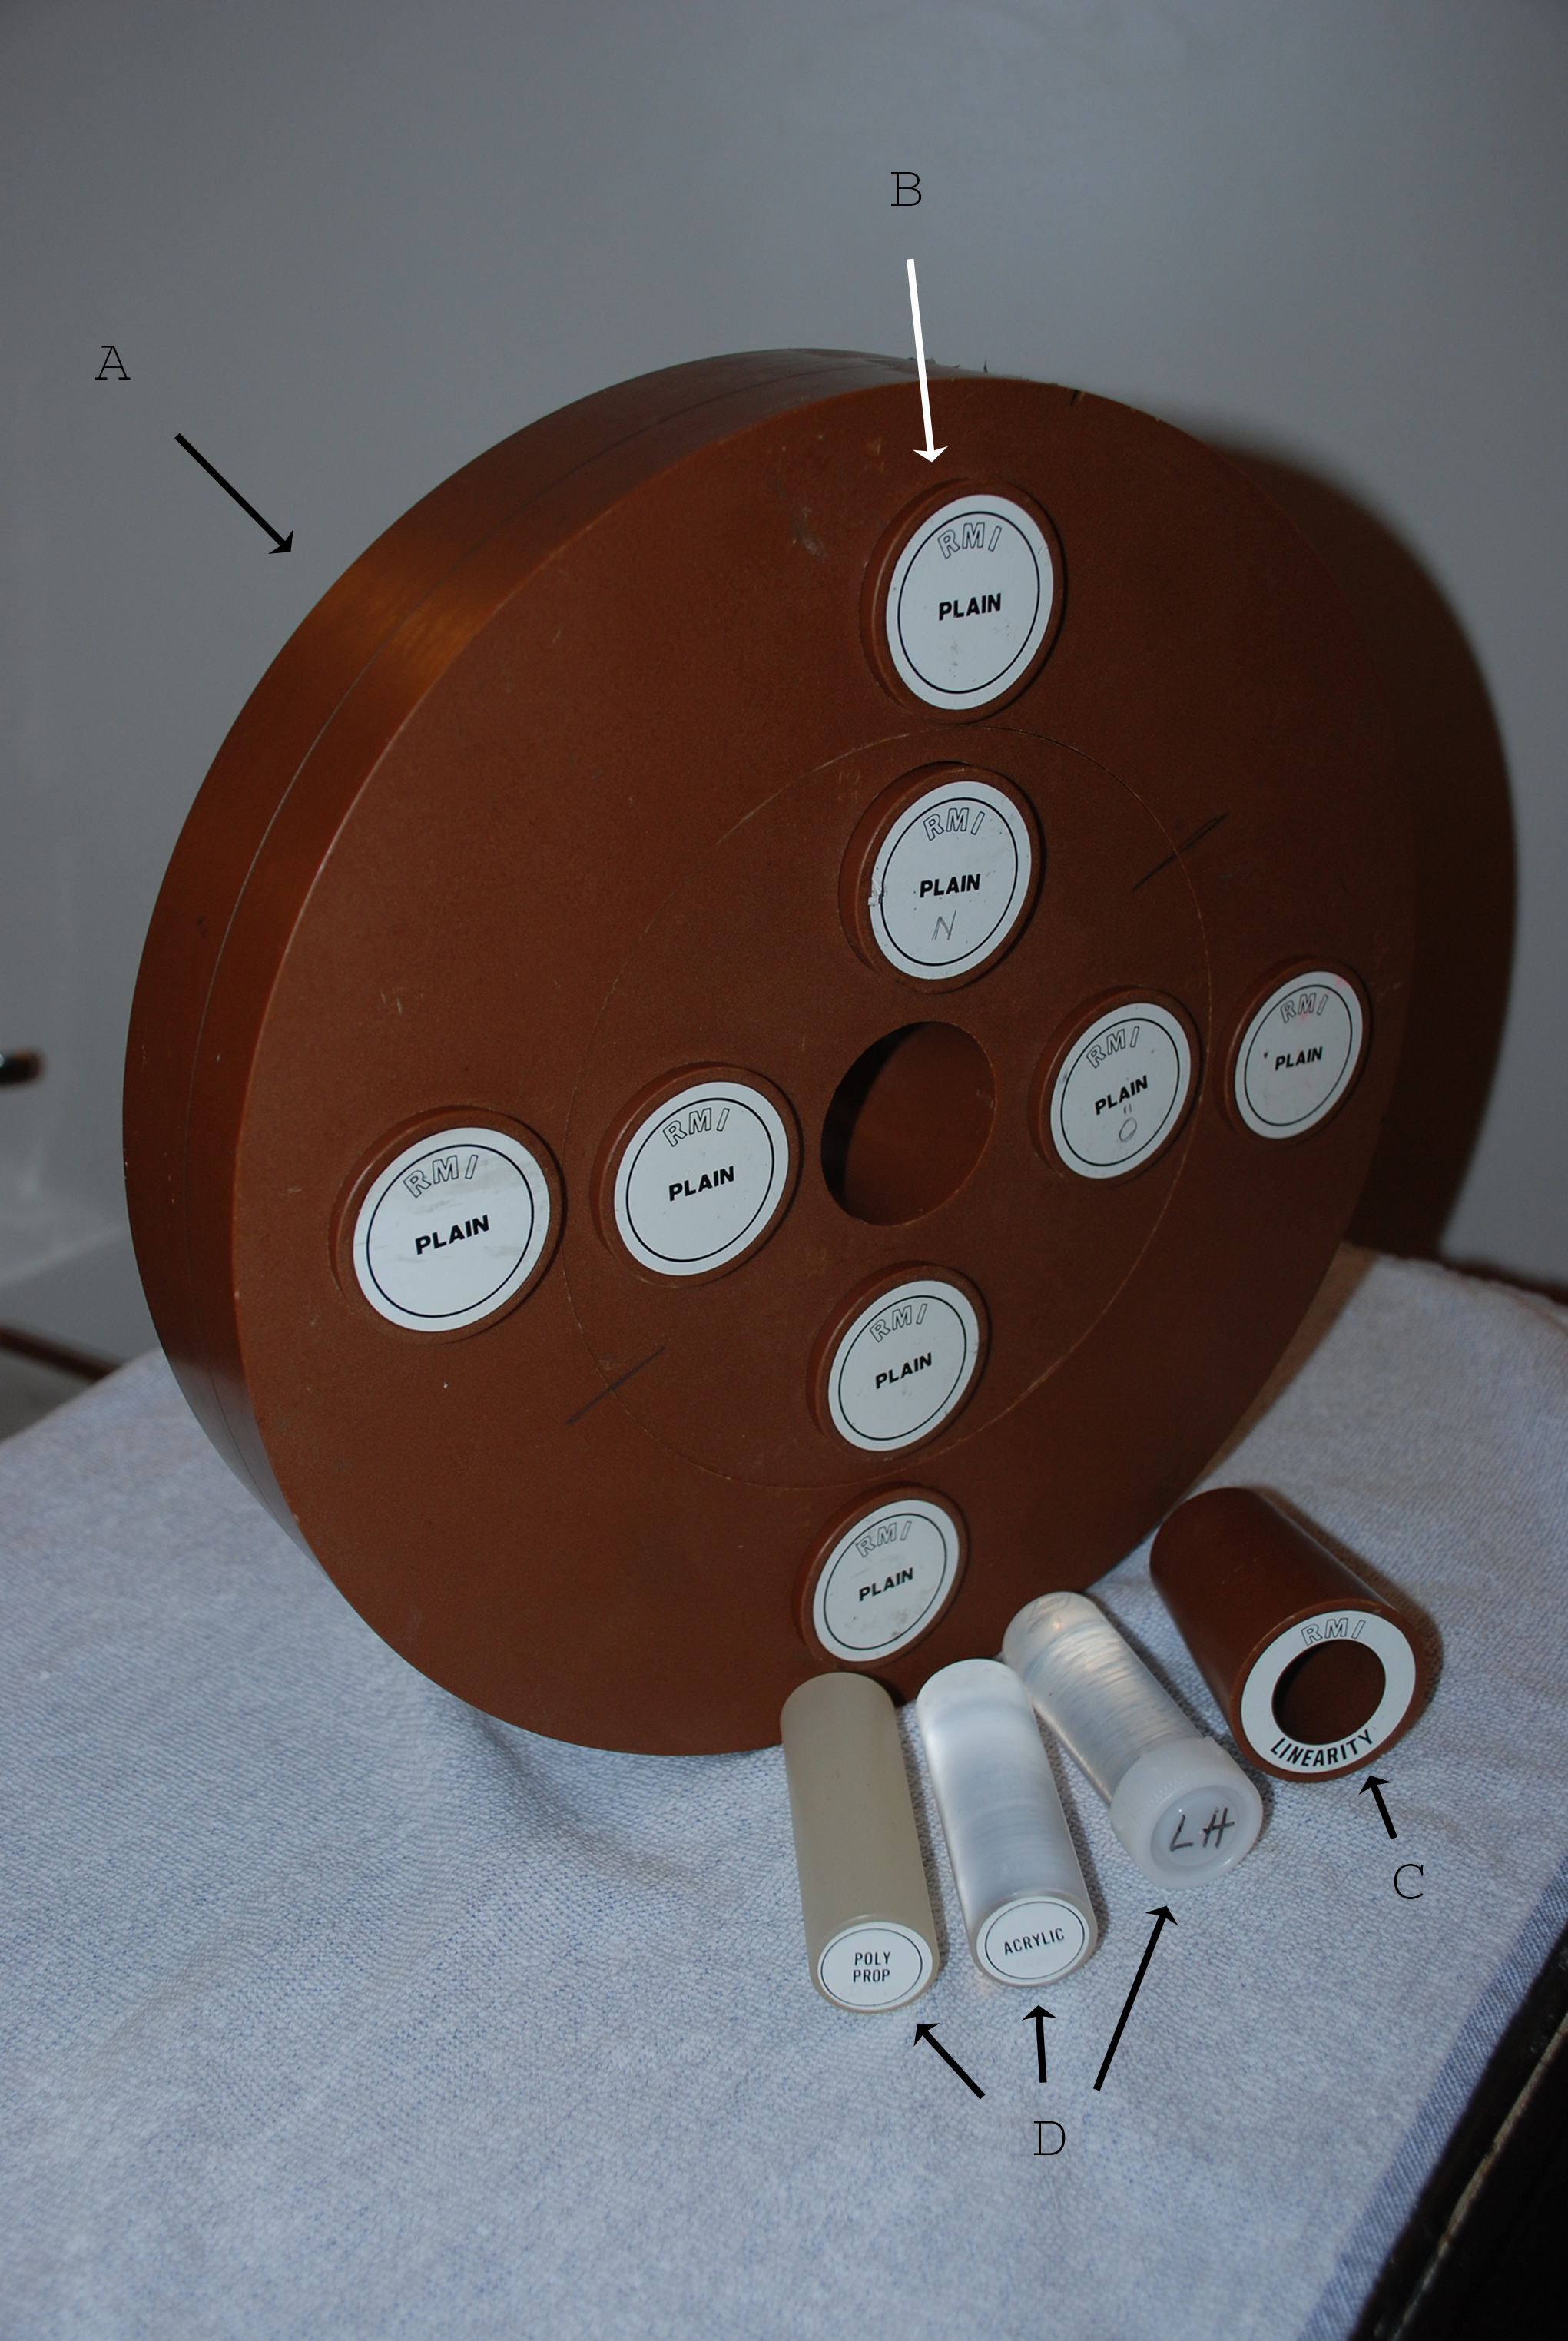
The first test included two repeated scans of each different object in the central test tube (containing solid water insert, room temperature tap water, polypropylene, and acrylic inserts, respectively) in each scanner. The other test was to investigate possible differences in water attenuation using different temperature (cold, room temperature, and warm, respectively). In this test the GE 8-MDCT was used. The phantom was examined on one occasion at each CT machine. To investigate intra-scanner consistency over time the phantom was also examined three times during one day (at 07:00, 11:00, and 17:00) and two times >4 weeks apart with the GE 8-MDCT.
CT scanners and protocol in the phantom analysis
The CT scanners compared were one SDCT, and one each of 4-, 8-, 16-, and 64-MDCT from GE (HiSpeed FX/i, LightSpeed QX/i, LightSpeed Ultra, LightSpeed Pro 16, LightSpeed VCT, GE Healthcare, Milwaukee, WI, USA) and one 16-MDCT from Toshiba (Aquilion 16, Toshiba Medical Systems Corporation, Tokyo, Japan) and one each of 16- and 64-MDCT from Siemens (Somatom Sensation 16, Somatom Definition, Siemens Healthcare, Erlangen, Germany). The CT scanners are hereafter referred to as GE HiSpeed, GE 4, GE 8, GE 16, GE 64, Siemens 16, Siemens 64, and Toshiba 16.
Convolution kernel, image slice thickness, and pitch factor used for the CT scanners in the phantom analysis

Statistical analyses
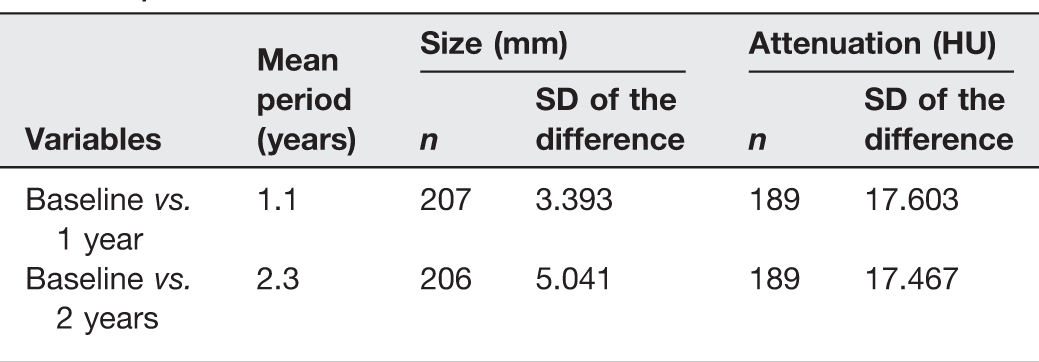
The analysis of the intrapatient variation with time of measurements of lesion size and attenuation in patients with adrenal lesions was performed in two steps. The first one comprised the calculation of the standard deviation (SD) of the difference between the baseline value and the value after approximately 1 year and the corresponding standard deviation after 2 years. Then an assumption for a special type of stochastic process, Wiener process, was applied to calculate the standard deviation for the difference for small steps. The variance when the difference in time is t units is σ2 · t, where σ2 is the variance corresponding to 1 unit of time.
In the inter-observer analysis, for each patient five observers determined the value of the variables size, unenhanced HU, postcontrast venous phase HU, late postcontrast phase HU, and wash-out (%) was calculated. The mean and standard deviation (SD) was calculated for each patient. The SD reflected the variation between the observers. The square root of the sum of variances divided by the number of patients was calculated for each one of the variables. We also determined the mean over all patients as well as the correlation coefficient between mean and SD. The correlation between mean and SD was tested by Pitman's test (17), which is a non-parametric test of correlation. The regression function with SD as the dependent variable and mean as the independent one was determined in order to assess whether the coefficient of variation was an appropriate quantity to use.
The P values were determined by Pitman's test.
Results
Variability of adrenal characterization over time
From the total of 443 patient included for follow-up in the original adrenal study, 263 were excluded because of too short or no follow-up with CT (n = 225), adrenal hemorrhage (n = 5), or change in size according to RECIST criteria (n = 33). Thirty of these 33 patients had lesions that increased and three had lesions that decreased in size. Of the increasing lesions eight had otherwise benign characteristics, while 20 had characteristics suggesting non-benign etiology (heterogeneous, high attenuation at unenhanced series, and/or poor delineation).
Variability of adrenal lesion contrast wash-out over time
Number of lesions with unenhanced CT attenuation value ≤10 HU and relative percentage wash-out (RPW) >40% (criteria for benign lesions) over time for the total of 136 lesions examined at least twice using dedicated adrenal CT protocol, and change in classification using these criteria for classifying lesions as benign versus indeterminate

Numbers in parentheses denote percentages in relation to the total number of lesions
In the 33 patients that were analyzed with comparison of the attenuation values in the aorta, portal vein, and adrenal lesions, there was a statistically significant correlation between contrast-enhanced attenuation in the adrenal lesion and the portal vein (P < 0.001).
Variability of adrenal lesion size and unenhanced attenuation over time
In total, 170 patients (100 women [59%]) with 207 lesions (mean diameter, 23.2 mm; range, 10–50 mm) had initial CT and follow-up CT examination performed after ≥1 year. Of these, 68% (140 lesions), had an attenuation value ≤10 HU at some occasion during follow-up.
The standard deviation (SD) of the difference in size (mm) and attenuation (HU) in patients with adrenal lesions and with a CT follow-up time of ≥12 months
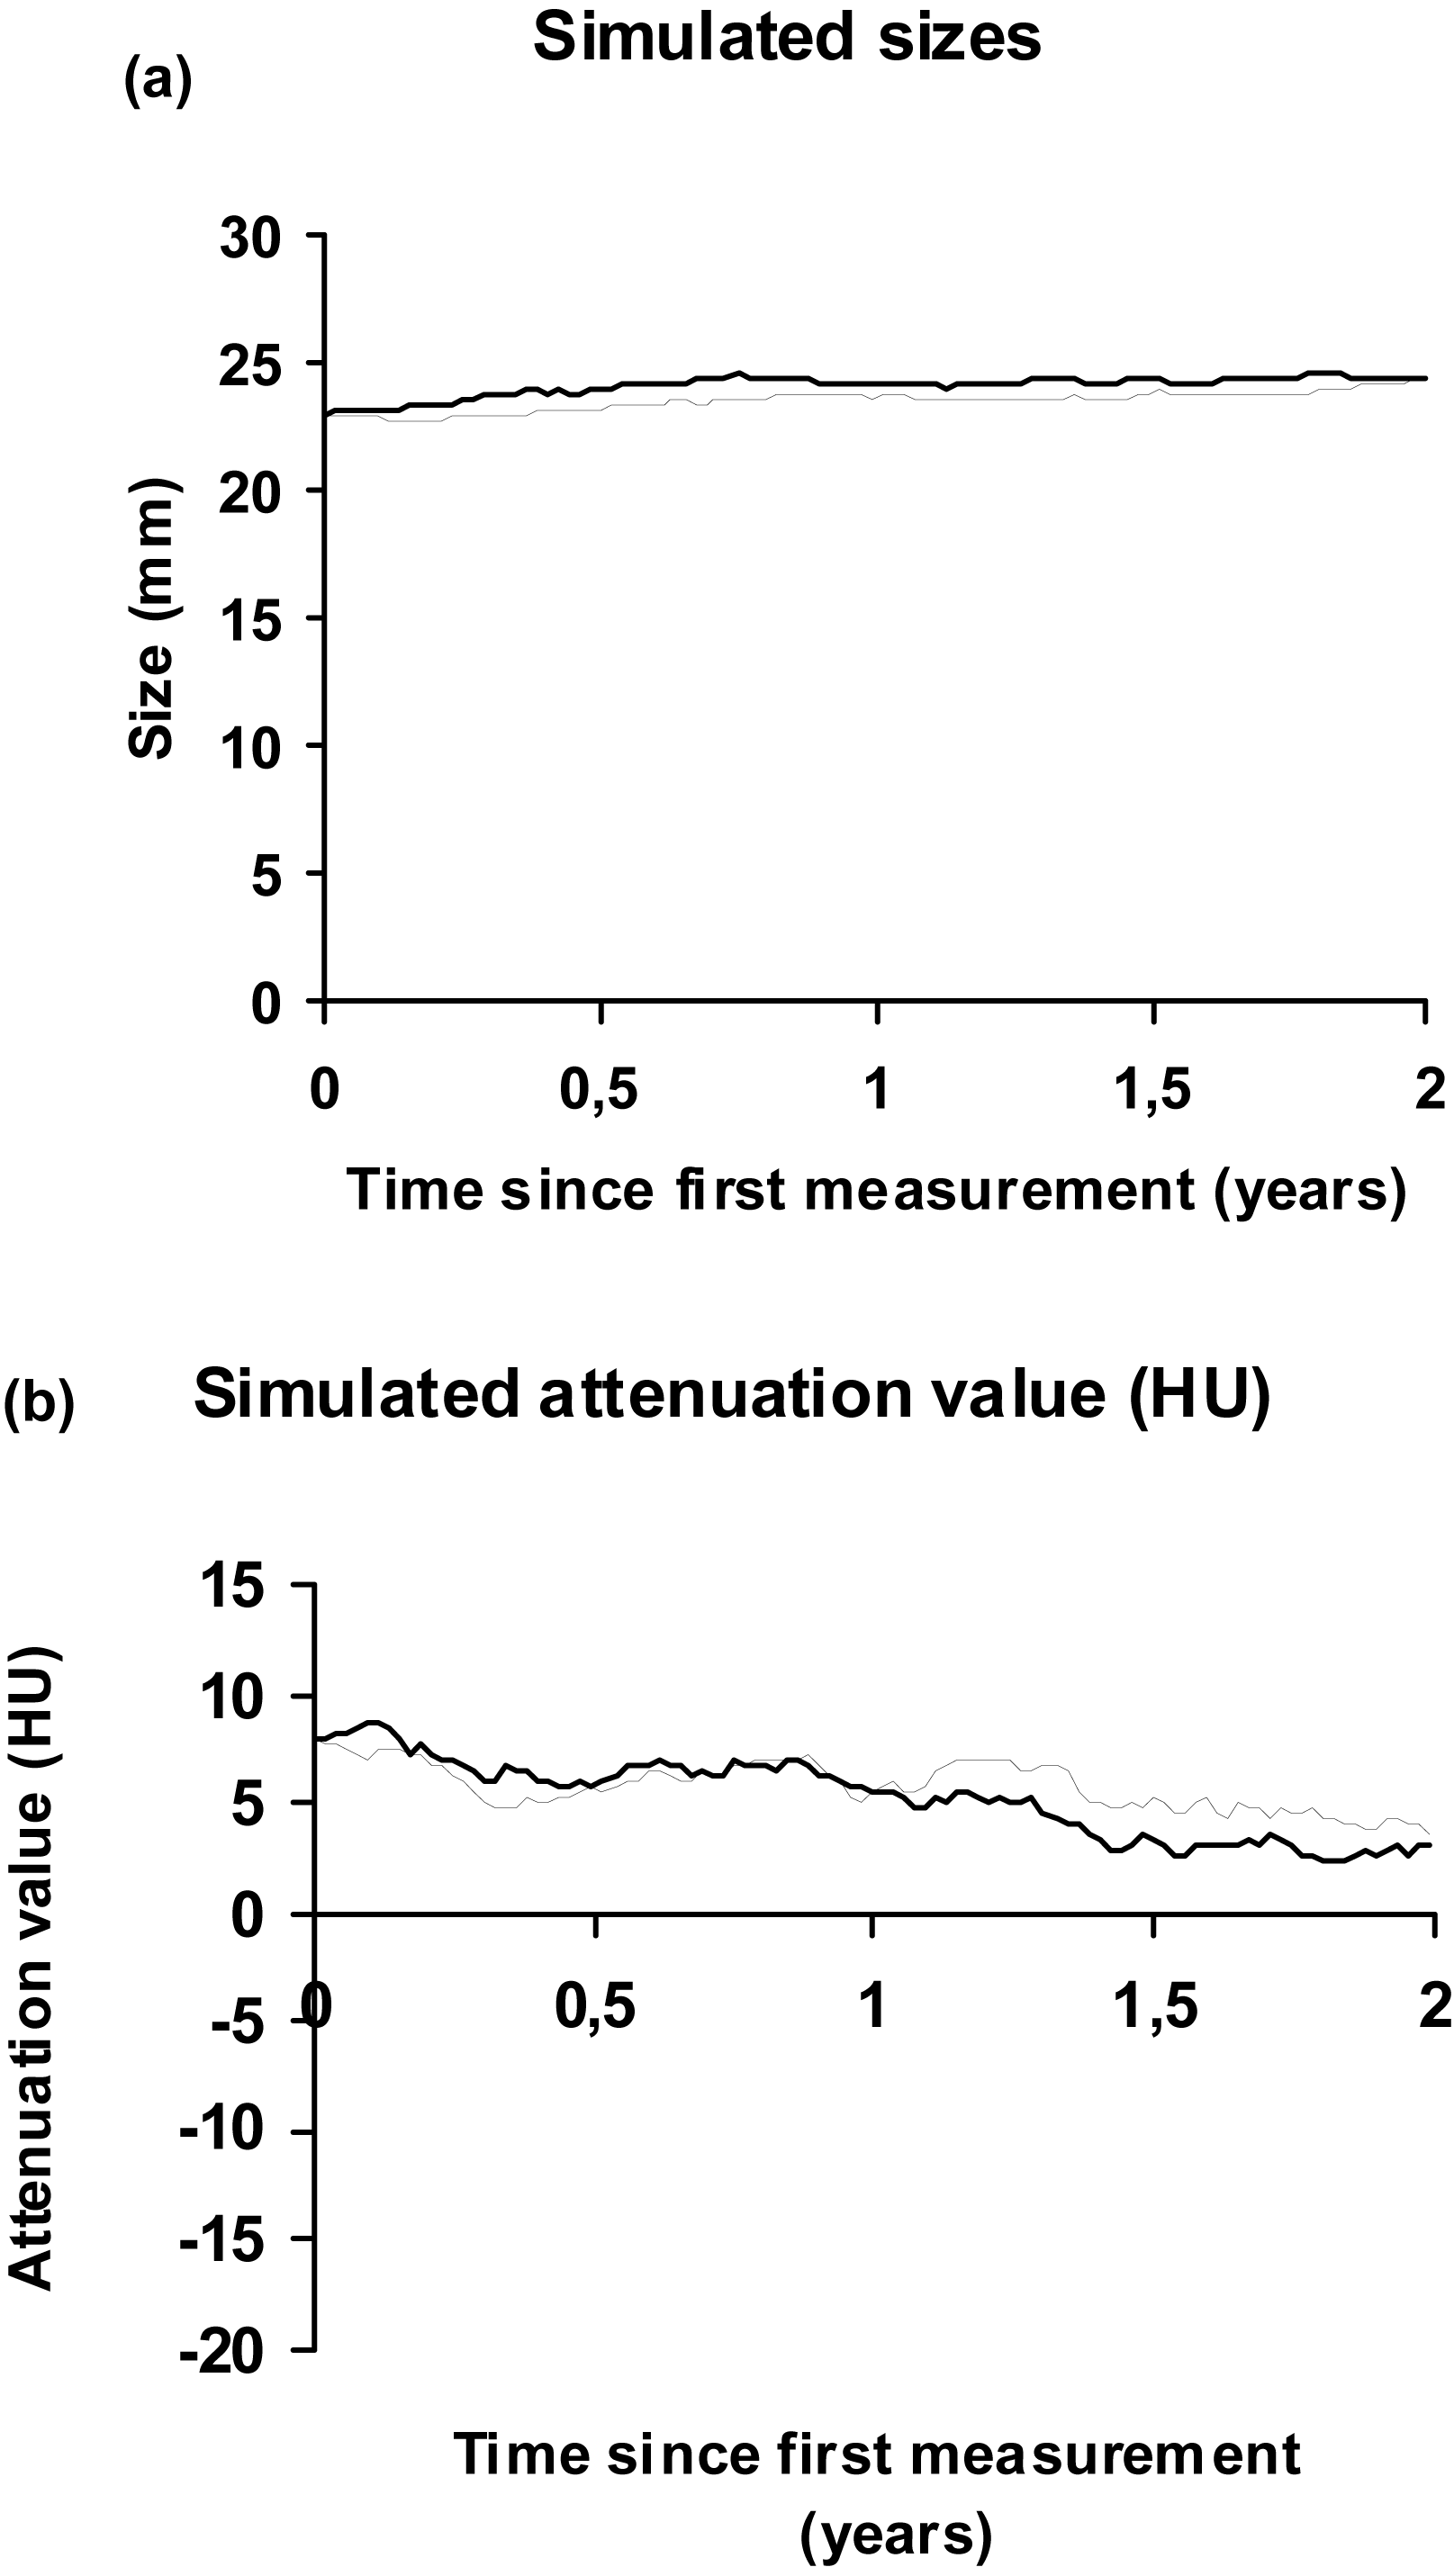
Simulation of variation in size (a) and attenuation value (b) in two pairs of individuals with adrenal lesions using the “Wiener process assumption”. The lesion size was assumed to be 23 mm and attenuation value assumed to be 8 HU at baseline for both individuals (using baseline mean values)
Inter-observer analyses
Tables 4 and 5 show the variation between the five observers.
Inter-observer analysis based on five observers with estimated standard deviation of measurement error (σSD2/n)½, mean, range, correlation coefficient between mean and SD, and P value

*Highly significant
†Significant
Regression functions in the inter-observer analyses

The estimated standard deviation of the measurement error (ΣSD2/n)½ can be used to elucidate the distribution of the difference between two observers when they both investigate the same, randomly chosen patient. Let X1 and X2 denote their measurement value and set σ (sigma) = (ΣSD2/n)½ then the probability that the difference is less than for example 0.5 · σ is P(|X1 − X2| ≤ 0.5 · σ) ≈ Φ(0.5 · σ/√2 · σ) − Φ(−0.5 · σ/√2 · σ) = 0.28.
If 0.5 times sigma is exchanged for 2.0, 1.0, 0.25, or 0.125 times sigma we will obtain the probabilities 0.84, 0.52, 0.14 and 0.07, respectively. If we consider the variable size, then σ = 2.38 (Table 4). Thus the probability that the two observers differ <2.38 mm is approximately 0.52.
The maximum difference in measurements of unenhanced attenuation value between the five observers ranged from 0 to 20 HU (mean, 4.6 HU). The larger range was seen in three lesions (15–20 HU) but in the rest (37 lesions) the range was 0–8 HU with a mean of 3.6 HU. In the late contrast-enhanced phase the difference was 0–23 HU (mean, 5.7 HU) but in 36 of the lesions the range was 0–9 HU. Of the 40 lesions analyzed, 31 lesions were categorized as benign by all the observers using the predefined threshold values; six were categorized as indeterminate by all observers while there was disagreement between the observers in three cases. In two of these three lesions 4/5 observers were in agreement and in the third case 3/5 were in agreement. These three lesions measured 10–15 mm, 29–34 mm, and 29–34 mm, respectively, while their unenhanced attenuation values measured 7–11 HU, 15–35 HU, and 56 HU (all observers), respectively, according to the five observers.
Phantom analysis
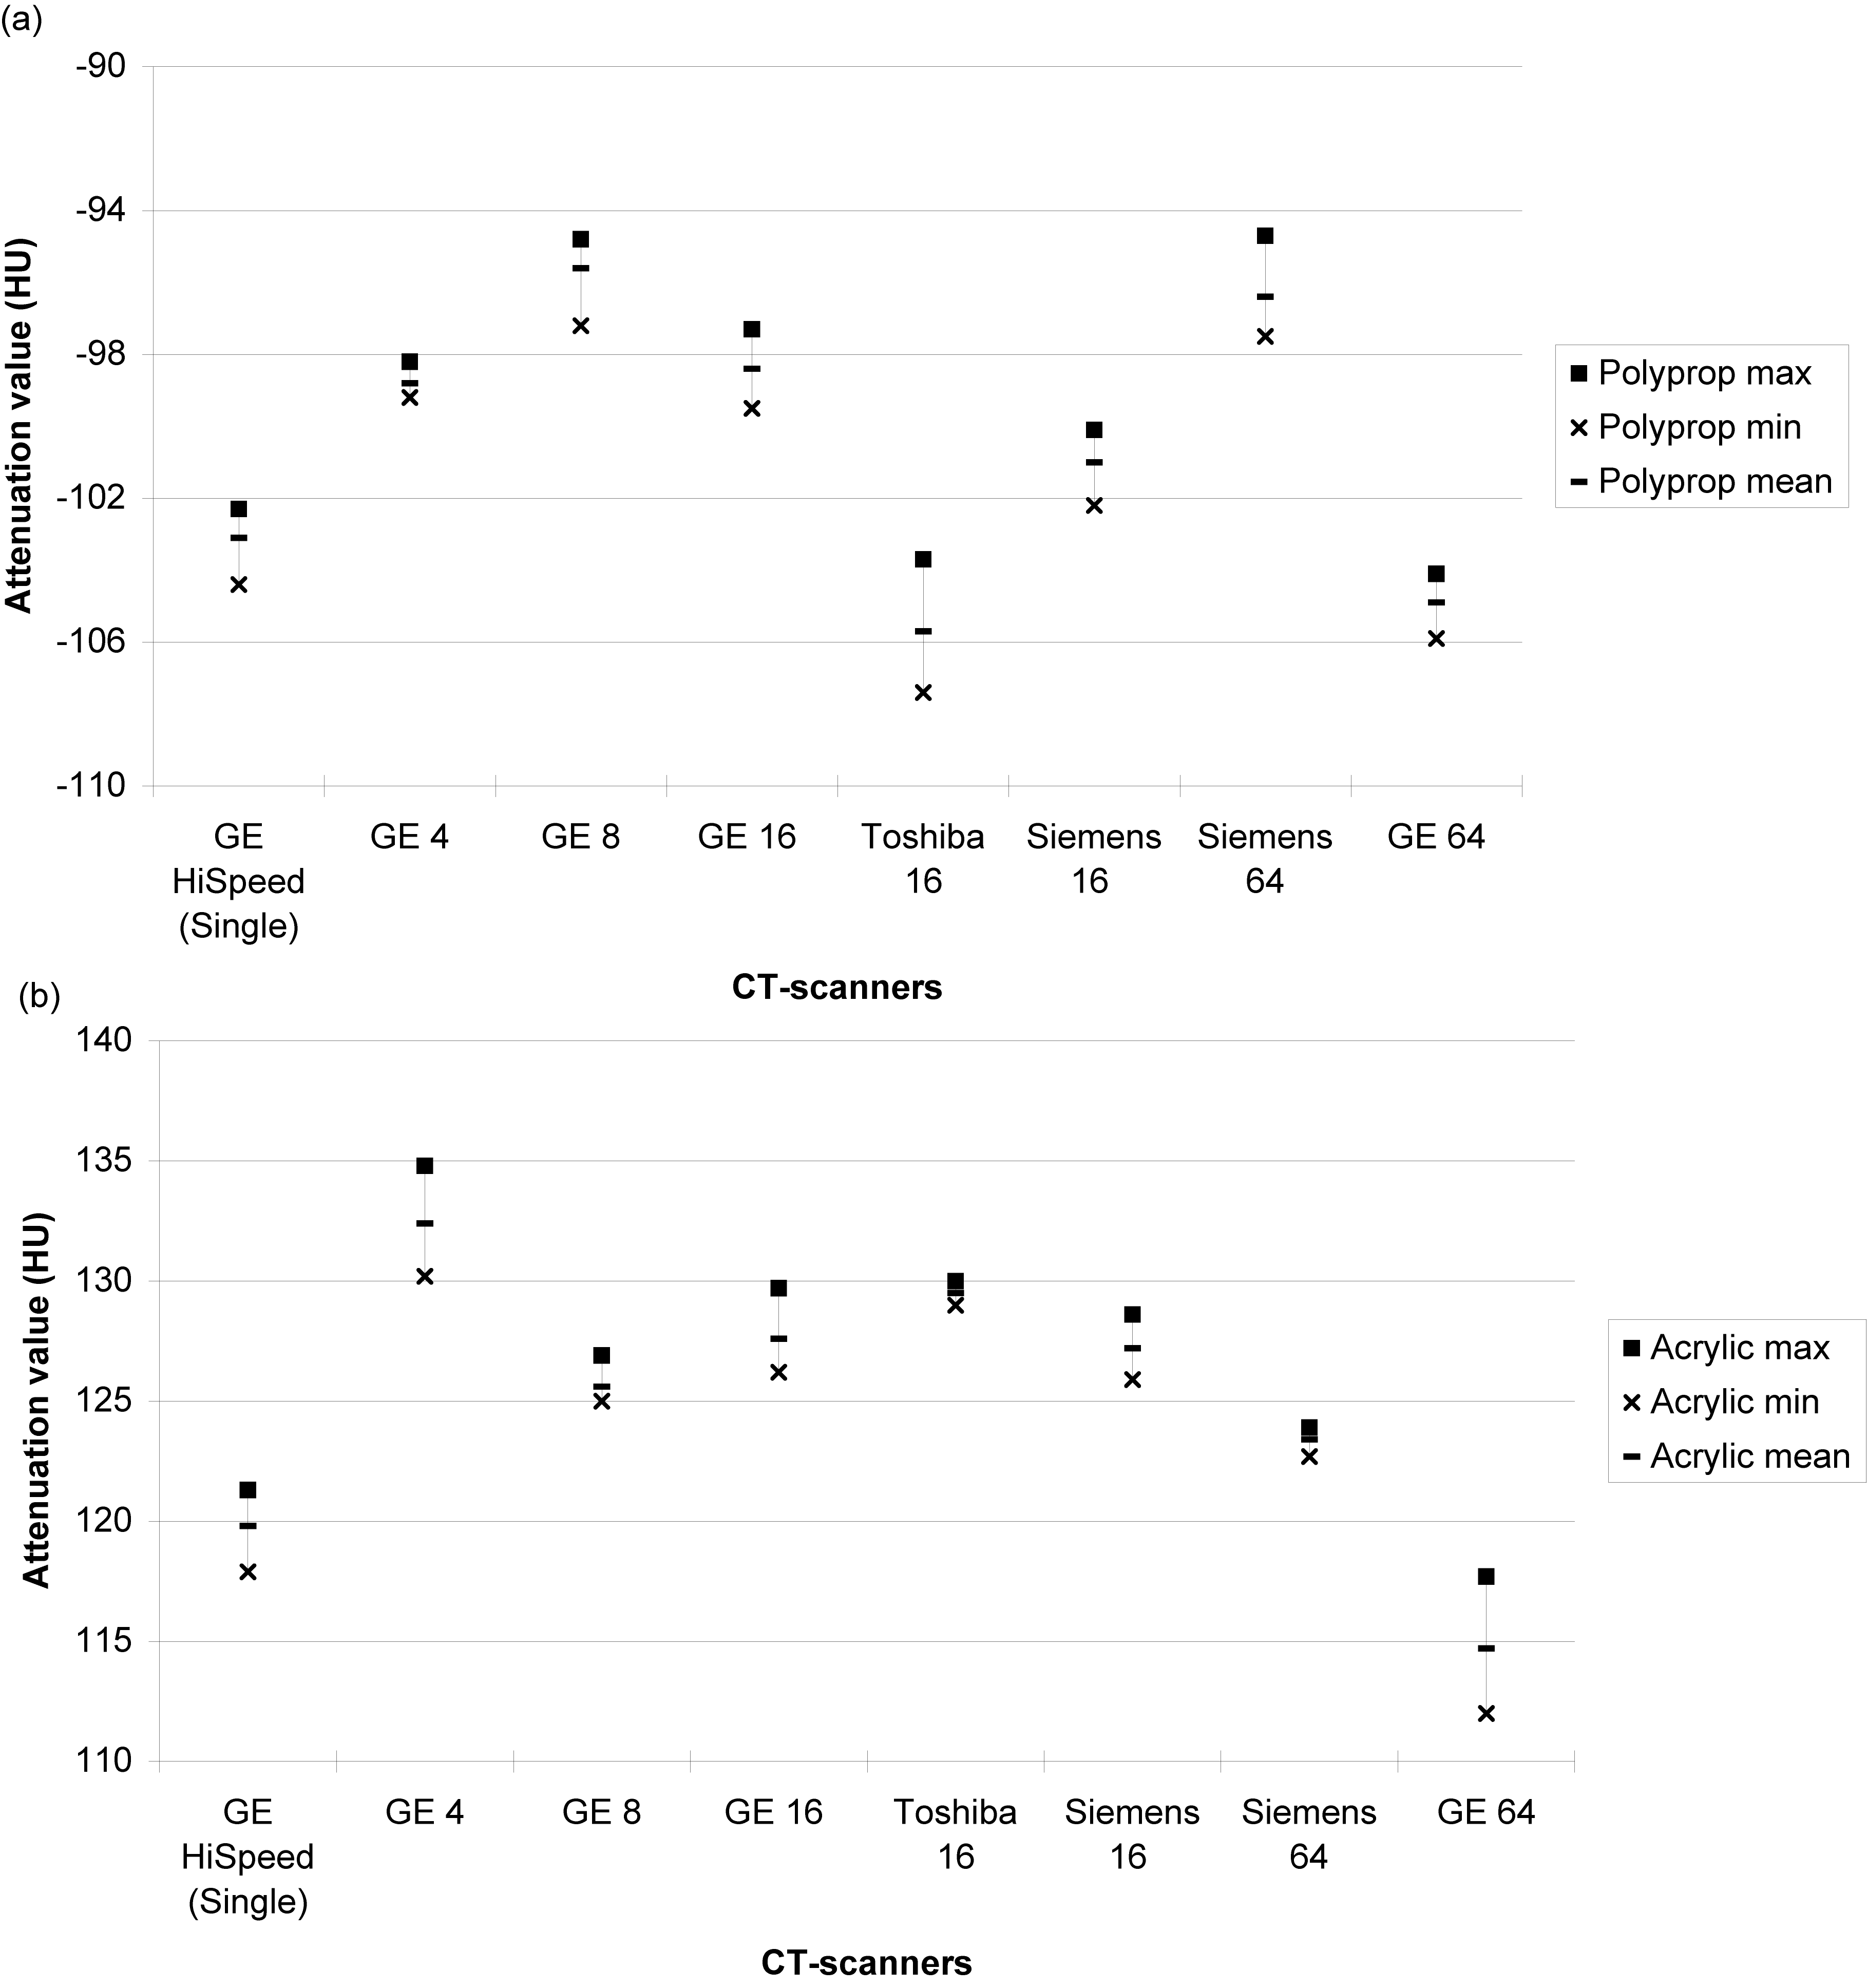
The variation in attenuation of solid and tap water inserts between scanners are given in Fig. 3 A and B. Fig. 4 shows the intra-scanner variation over time of measurement on the GE 8 scanner examined on four separate occasions. The difference in HU between tap water of different temperature, and between tap water and saline, are also demonstrated in Fig. 4. The difference in mean attenuation value for tap water within each scanner was 2.7 HU (range, 1.8–5.1 HU) and between scanners a maximum difference of 0.3–8 HU was found. The stated manufacturer specifications for measurements on these scanners are to obtain a CT number of water within ± 3 HU or ± 4 HU. Fig. 5 demonstrates the inter-scanner variation of attenuation of inserts with polypropylene (a) and acrylic (b) test tubes. The inter-scanner difference between mean attenuation for polypropylene ranged from 0.4 to 9.9 HU and for acrylic insert from 0.4 to 17.7 HU.
Inter-scanner variability of attenuation measurements of the centrally placed room temperate solid water insert (a) and tap water insert (b) in the phantom Intra-scanner (8-MDCT GE scanner) variability over time of attenuation measurements at repeated CT examinations on different occasions (dates given), using room temperate tap water insert centrally in the phantom and cold tap water, warm tap water, and normal saline (0.9% solution) at room temperature in the inserts, respectively Inter-scanner variability of attenuation measurements of centrally placed polypropylene inserts (a) and acrylic inserts (b) in the phantom

Discussion
The rationale for using attenuation values for characterization of adrenal lesions has been supported by a large number of studies (3, 18, 19). However, the use of absolute CT attenuation values as a diagnostic tool has been questioned (8–12). First of all, it is obvious that the HU values of an adrenal lesion are associated with a considerable imprecision, reflected in the standard deviation of the measurement. The attenuation value is depending on several factors, e.g. CT scanner, scanning technique, the patient, and the observer.
Our follow-up data showed that there was a slight, but statistically insignificant increase over time of adrenal lesion size, and there was a slight reduction in mean HU values over time. This suggests a benign course, providing that stable size and increased lipid content (and thereby a lower HU value) are accepted as indicators of benign development. Nevertheless, repeated scanning of the same adrenal lesion may result in different risk stratifications. In our clinical material, 20% and 29% (totally 44%) of the patients would have their classification (benign versus indeterminate) altered at follow-up if applying 10 HU and 40% as thresholds for unenhanced and wash-out attenuation measurements, respectively. It should be remembered that patients with larger interval increase in size (>20% or >5 mm) of the adrenal lesions, suggesting malignancy, were not included in this analysis, as they are easy to identify and therefore do not constitute a clinical problem, especially if combined with other features of malignancy, e.g. inhomogeneous attenuation pattern, irregular shape, and poor delineation.
We found a slight decrease in CT attenuation of the adrenal lesions over time. It can be speculated if a change in individual lesion attenuation may be associated with a biological tissue alteration over time. This seems unlikely, as other characteristics, e.g. lesion size, changed very little during the limited follow-up period. The variability is more likely to be associated with technical or observer-related factors. It can also be speculated that variations in the circulation and distribution of contrast media (related to, for example, cardiac output and heart frequency) may have an impact on the attenuation of adrenal lesions. We could demonstrate that the contrast enhancement of the adrenal lesions correlated with the attenuation of the portal vein, while aortic attenuation did not. Further studies on the influence of contrast media concentration, rate of injection, and timing of post-injection scanning seems warranted to further elucidate its potential role for variations in attenuation.
One source of measurement variation is variation between observers. Our inter-observer study using clinical cases showed a moderate variation between abdominal radiologists with varying degrees of experience. Lesion size measurements appeared relatively stable between observers, while much larger variations between observers were noted regarding lesion attenuation measurements. Thus, there was a statistically significant difference between different observers regarding both unenhanced and late phase attenuation measurements. In 90% of the cases, however, the nominal differences were relatively small, ranging from 0 to 8 HU (mean, 3.5 HU) on unenhanced series, and 0–9 HU (mean, 4.3 HU) on late phase series, respectively. Nevertheless, there were cases with larger discrepancies, and even small variations around the cut-off value 10 HU, or any other cut-off, have an impact on clinical handling and follow-up. The relative percentage wash-out determinations, based on the attenuation measurements in the early and late contrast-enhanced phases, also showed notable inter-observer variability, but did not quite reach statistical significance. The calculated chances that two observers would differ by 2.4 mm in size estimates or by 5.0 HU in attenuation measurements were 50%. From a clinical viewpoint, these differences may still seem acceptable. Wider discrepancies could be expected in less homogenous groups of observers and in routine clinical work, where less favorable reading conditions prevail, including stress and time constraints. Siegel et al. (20) showed that agreement between observers in measuring attenuation is higher in simple than in complicated and small lesions. Hopper et al. (21) found similar results regarding size measurement on poorly defined and irregular lesions. As all observers in our inter-observer study analyzed the same cases using the same work station, it can be assumed that the inter-reader variability is due to individual selection of CT slice used for measurement, and individual selection of size and placement of ROI cursor.
Our phantom study shows that within a single CT scanner, repeated measurements of the same object at different times of the day and 1 month later appear relatively stable, resulting in a change in mean attenuation values by only 1.5 HU, while the range of individual measurements was 1–3 HU. The variation of attenuation values measured in the phantom analysis is thus in range of the CT manufacturers' specification. However, the temperature of the object had a great impact on the CT number as density of water changes with temperature. As intra- and inter-patient body temperature varies only slightly, this is of little significance when comparing HU measurements over time and between patients. However, it may be of importance when applying a calibration instrument/phantom, which ideally should be applied at a defined temperature, e.g. by using tap water at room temperature. As expected, the variation between scanners of different types and generations was greater than the intra-scanner variation, with mean attenuation for both tap and solid water ranging >8 HU between scanners. This has clear clinical implications when classifying and following adrenal lesions, and suggests that repeated examinations of the same adrenal lesion should preferably be performed with the same scanning protocol and at the same scanner providing that it has been properly calibrated.
As suggested by our results, a limitation of multicenter and follow-up studies, including our own (13, 14), is that CT examinations may not be uniform, when different scanners are used. A limitation of our study is that we used 10 min instead of 15 min delay to calculate the wash-out. This was due to the routine used at the time of the start of the study. The use of a 10-min delay has recently been questioned (22) and the proportion of lesions that were reclassified based on 10 min wash-out might possibly be larger than if we had used a 15-min delay. Still, the general attenuation variability shown in all enhancement phases would not be affected by this.
To summarize, in our clinical material we have shown that benign appearing adrenal lesions tend to increase only slightly in nominal size over a 2-year period, and nominal CT attenuation of the lesions tends to decrease slightly. However, when applying established, fixed cut-off values for unenhanced HU values (10 HU) and relative contrast wash-out (40%) for classification of adrenal lesions as benign or indeterminate, nearly half (44%) of the lesions would be reclassified if using the same criteria at a follow-up CT examination, even when using the same CT scanner. This does not necessarily indicate a systematic change in biological behavior of the adrenal lesions, as change in classification went both ways. Inter-observer variation in classifying lesions as benign or indeterminate was small, but may add to the variation at repeated examinations when using different observers. Some of the variation can be attributed to different hardware and software, as attenuation values also varied between CT scanners in the phantom analysis. Obviously, calibration of CT scanners is often suboptimal. Some authors suggest the use of a calibration instrument to adjust image attenuation values in CT scanning both in research and clinical practice, especially when the measurement value is in the range of 0–20 HU (11, 12). Our results support this but the calibration instrument has to be accurate and easy to use, e.g. a syringe containing room temperature water, as measurements of water are temperature sensitive.
In conclusion, the clinically widespread use of specific CT numbers as thresholds for characterizing adrenal lesions must be used with great caution, considering that multiple factors, related to patient, equipment, scanning technique, and observer influence the outcome. This emphasizes that not only native HU and wash-out values, but also other criteria, such as growth rate, lesion homogeneity, and demarcation need to be taken into account in classifying adrenal lesions. Ideally, follow-up examinations of adrenal lesions should be performed at one and the same, well-calibrated CT scanner and images should be read by the same reader, in order to minimize measurement error.
Footnotes
Acknowledgements
The study was supported by grants from The Swedish Cancer Society, The Gothenburg Medical Society, The Västra Götaland Region Research Fund and Government grants under the LUA/ALF agreement. The research was independent of the funders.
We wish to express our sincere thanks to Mats Asztély, Fredrik Thorén, Charlotte Sandström, and Eva Michaëlsson for help with the inter-observer analysis and research radiography nurse Lena Björneld for all assistance and advice. The authors also wish to thank all the staff of the participating hospitals for their great assistance and support of this study.