




Abstract
Background
Diffusion-weighted imaging (DWI) is commonly used to distinguish between benign and malignant liver lesions. However, different b-values are recommended.
Purpose
To determine the most suitable b-value in DWI for differentiation of benign and malignant liver lesions.
Material and Methods
A total of 124 lesions in 89 consecutive patients (43 men, 46 women; age, mean ± standard deviation, 58 ± 14 years) with a pathological or radiological diagnosis of malignant or benign focal liver lesions after magnetic resonance imaging (MRI) were included in this study. Routine abdominal MRI and DWI were performed using seven b-values (0, 50, 200, 400, 600, 800, 1000 s/mm2). Lesions were analyzed for benignity/malignity using apparent diffusion coefficient (ADC) values with 10 b-value combinations and by measuring the lesion/normal parenchyma ADC ratio.
Results
Mean ADC values were significantly different between malignant and benign lesions for all b-value combinations (P = 0.000). The best b-value combination was 0 and 800 (Az = 0.935). Using lower b-values such as 0 and 50 together with higher b-values ≥600 s/mm2 was beneficial (Az = 0.928 and 0.927). Mean ADC values were approximately 13% (1–15%) higher in total when b = 0 and b = 50 s/mm2 were included in multiple b-value combinations.
Conclusion
In DWI, we recommend the use of b-values of 0 and 800 s/mm2 as two b-values, or b = 0, 50, 600, 800, and 1000 s/mm2 as multiple b-values for distinguishing between benign and malignant liver lesions. Mean ADC value is 13% higher in total by additional use of b = 0 and b = 50 s/mm2 in multiple b-value combinations.
Keywords
Introduction
Diffusion is based on the movement of water molecules in biological tissues, also known as Brownian motion (1). Diffusion-weighted imaging (DWI) provides information regarding the biophysical constitution of tissues such as microcirculation, microstructure, density, and cell organization. Determination of apparent diffusion coefficient (ADC) values obtained from DW images with the addition of a bipolar diffusion gradient is the most reliable imaging method for measuring the cumulative effects of water diffusion and capillary perfusion (1,2).
DWI is now commonly used to distinguish between benign and malignant abdominal lesions (3–5). Several studies have examined the characterization and differentiation of malignant and benign liver lesions using different b-value combinations (6–8). In these studies, ADC values of tissues and lesions were calculated using DWI, and the results showed that these different b-values can be used for differential diagnosis. However, different b-values are recommended for the differential diagnosis of benign and malignant liver lesions (5–8).
The present study was performed to determine the optimum b-value for differentiation of benign and malignant liver lesions on DWI, and to compare the success rate of DWI with the final diagnosis.
Material and Methods
Study population
Diagnosis and size of lesions.
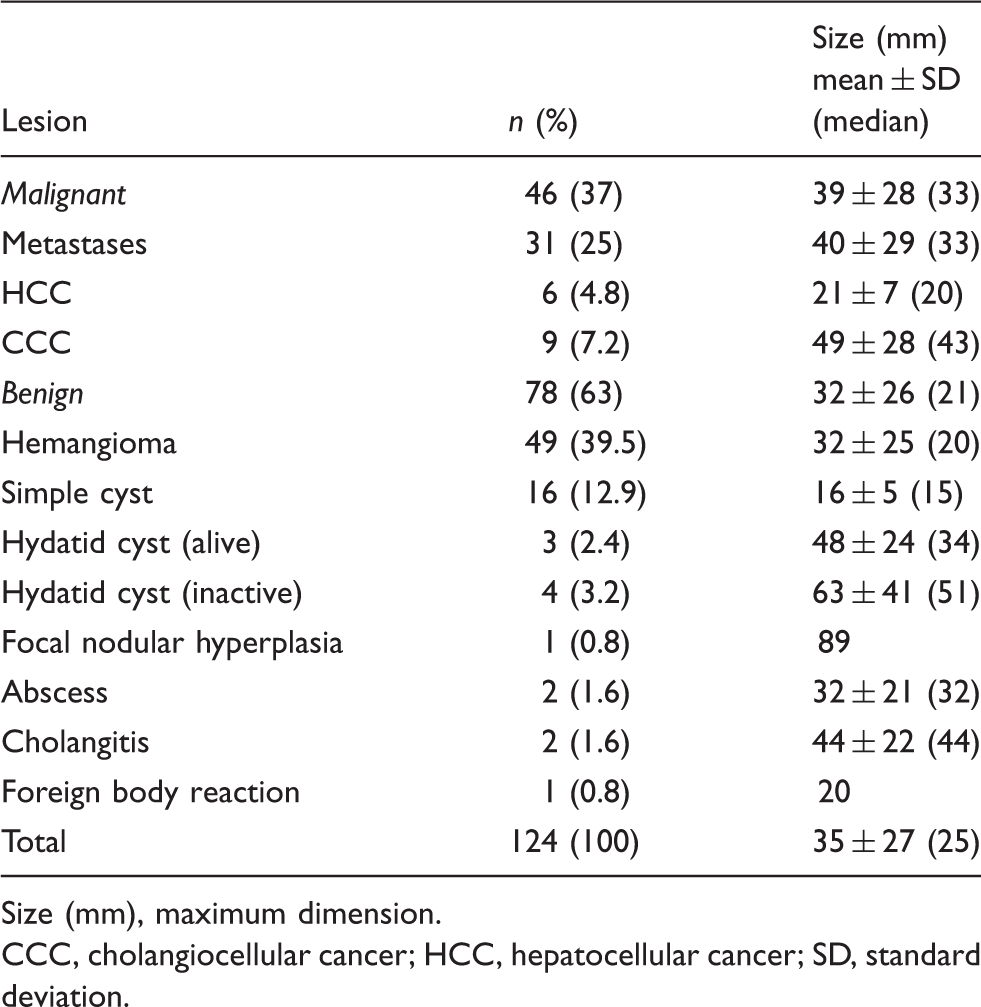
Size (mm), maximum dimension.
CCC, cholangiocellular cancer; HCC, hepatocellular cancer; SD, standard deviation.
MRI protocol
All MRI examinations were performed using a 1.5-T MR system (Magnetom Avanto; Siemens, Erlangen, Germany) with a 33 mT/m maximum gradient strength, 75 mT/m/ms peak slew rate using an 18-element torso phased array body coil. All patients underwent a routine abdominal MRI protocol, including T2-weighted fast spin echo, pre- and postcontrast T1-weighted gradient echo sequences using a 3–5 mm slice thickness, 0.6–1 mm (20%) intersection gap, and 160–190 × 256 matrix, 260 Hz/pixel bandwidth, and a sensitivity-encoding factor of 2. We routinely perform DWI as part of the abdominal and pelvic MRI protocol at our institution. Before intravenous contrast material injection, axial abdominal DWIs are acquired in the same plane and orientation used in the routine sequences using a free-breathing single-shot echo-planar imaging (SSH-EPI) sequence. Sequence parameters were as follows: repetition time (TR)/echo delay time (TE), 5200 ms/87 ms; field of view, 350–400 mm; section thickness, 5 mm; intersection gap, 20% (1 mm); sections, 24–38; matrix, 141 × 192; echo planar imaging (EPI) factor, 156; bandwidth, 1736 Hz/pixel; and two excitations. The examination time was approximately 3 min, and parallel imaging (integrated parallel acquisition techniques [iPAT], modified sensitivity encoding [mSENSE]; Siemens) with a reduction factor of two was applied. Spectral presaturation was used to suppress chemical shift artifacts. Seven different b-values (0, 50, 200, 400, 600, 800, and 1000 s/mm2) were used. Isotropic DWIs with different b-values were obtained after calculating the geometric average from the three-set abdominal DWIs.
ADC calculations
Ten ADC maps were obtained on a commercial workstation using standard software (Leonardo console software, ver.2.0; Siemens AG Medical Solutions, Forchheim, Germany). ADC (mm2/s) values were calculated using the following formula: ADC = (−1/b) Log S1/S0; where b = diffusion factor, S0 = signal intensity (SI) for b = 0 (before application of the diffusion gradient), S1 = SI after application of the diffusion gradient. There were six different ADC maps created using b = 0 s/mm2 and six different b-values (i.e. 0 and 50 s/mm2, 0 and 200 s/mm2, and so on), and ADC maps created using six b-values (multiple b1 = 0, 600, 800, and 1000 s/mm2), four b-values (multiple b2 = 200, 600, 800, and 1000 s/mm2), five b-values (multiple b3 = 200, 400, 600, 800, and 1000 s/mm2), and all b-values (multiple b4 = 0, 50, 200, 400, 600, 800, and 1000 s/mm2) were obtained. The combined mean ADC values of the detected lesions were measured directly from these ADC maps.
Image analysis
Image analyses were performed using a different workstation (Advantage Workstation 4.4; GE Healthcare, Milwaukee, WI, USA) and were randomly evaluated by two radiologists. Observers were blinded to clinical history, MRI reports, surgical findings, and pathology results. Observers reviewed the DW and T2-weighted images in consensus for defining the lesions and image number. For lesions not properly visualized on DWIs, the location was determined using pre- and postcontrast T1-weighted images. Although all benign and malignant lesions were seen on DWIs, there was a need for detailed visualization of some lesion on T1 weighted images for ADC measurement of the solid component. Seven lesions were not visualized properly on DWI. These were related to the liver left lobe cardiac movement artifacts (n = 1; hemangioma), T2 hypointensity of the lesions (n = 2; foreign body reaction, inactive hydatid cyst), HCC (n = 2; well differentiated HCC, small HCC on cirrhotic liver), small CCC (n = 1) and cholangitis (n = 1). After defining the lesions, the two observers retrospectively and randomly analyzed DWIs by consensus in different sessions separated from the lesion-defining process by at least 3 weeks to minimize recall bias.
The lesion SI values were measured by placing manually defined regions of interest (ROIs) in the lesions on the DWIs for each b-value (0, 50, 200, 400, 600, 800, and 1000 s/mm2). The ROI was placed carefully, and the size of the ROI was kept as large as possible, covering at least two-thirds of the lesion without necrotic cores, if present, yet avoiding interference from the surrounding normal tissue. Each ROI was copied and pasted using the same size and location as on DWIs obtained using different b-values in the same lesion. For homogeneous and solid lesions, ROIs were drawn as large as possible to fit the lesion size. An average of three measurements per lesion was performed. For heterogeneous and necrotic lesions, measurements of the SI and ADC values for focal lesions were performed by drawing ROIs so that they eccentrically covered the visualized low-ADC area and hyperintense area at high b-values (b = 800 or 1000 s/mm2). Care was taken to avoid sampling necrotic, hemorrhagic, calcified, and cystic areas, as well as to avoid interference from the surrounding normal tissue. Each ROI was copied to ensure they were of the same size and location as on DW images obtained using different b-values in the same lesion. If a lesion was completely cystic, the entire lesion was included in the ROI. If a necrotic or cystic lesion had a solid component, only the solid portion of the lesion was included.
In addition, the ADC values of the normal liver parenchyma were measured in three locations in the right lobe of the liver. Care was taken so that the ROIs did not include vascular structures. The ROI was placed carefully, and was copied and pasted as mentioned above. The normal liver parenchyma measurements were obtained in the left lobe of the liver in three patients because of extensive right lobe lesions. Normal liver parenchyma measurements could not be obtained in two patients because of diffuse infiltrative lesions of the liver (n = 1) and diffuse low ADC values related to chronic liver disease (n = 1).
ADC measurement
The lesions were analyzed quantitatively for the assessment of benignity/malignity by measuring ADC values. The two observers retrospectively measured the ADC values with SDs in consensus on defined lesions by placing manually defined ROIs in the lesions on the 10 ADC maps. The ROI was carefully placed and copied and pasted similar to that described above. The ROI size varied according to lesion size and, depending on the lesion size, they were outlined on up to three sections in each mass. The ADC values of the lesions are reported as the means ± SD.
Statistical analysis
Statistical analyses were performed using SPSS software (version 16.0 for Windows; SPSS Inc., Chicago, IL, USA). The normality of distribution of the parameters was assessed using the Shapiro-Wilks test. Wilcoxon’s signed-ranked test was used for comparison of lesion ADC values obtained from the different b-values. Comparisons between groups were performed using t-test and the Mann-Whitney test. Receiver-operating characteristic (ROC) analysis was used to evaluate the diagnostic performance of the quantitative ADC values for differentiating between benign and malignant lesions, and corresponding sensitivities, specificities, and accuracies were calculated. P values <0.05 were deemed to indicate statistical significance.
Results
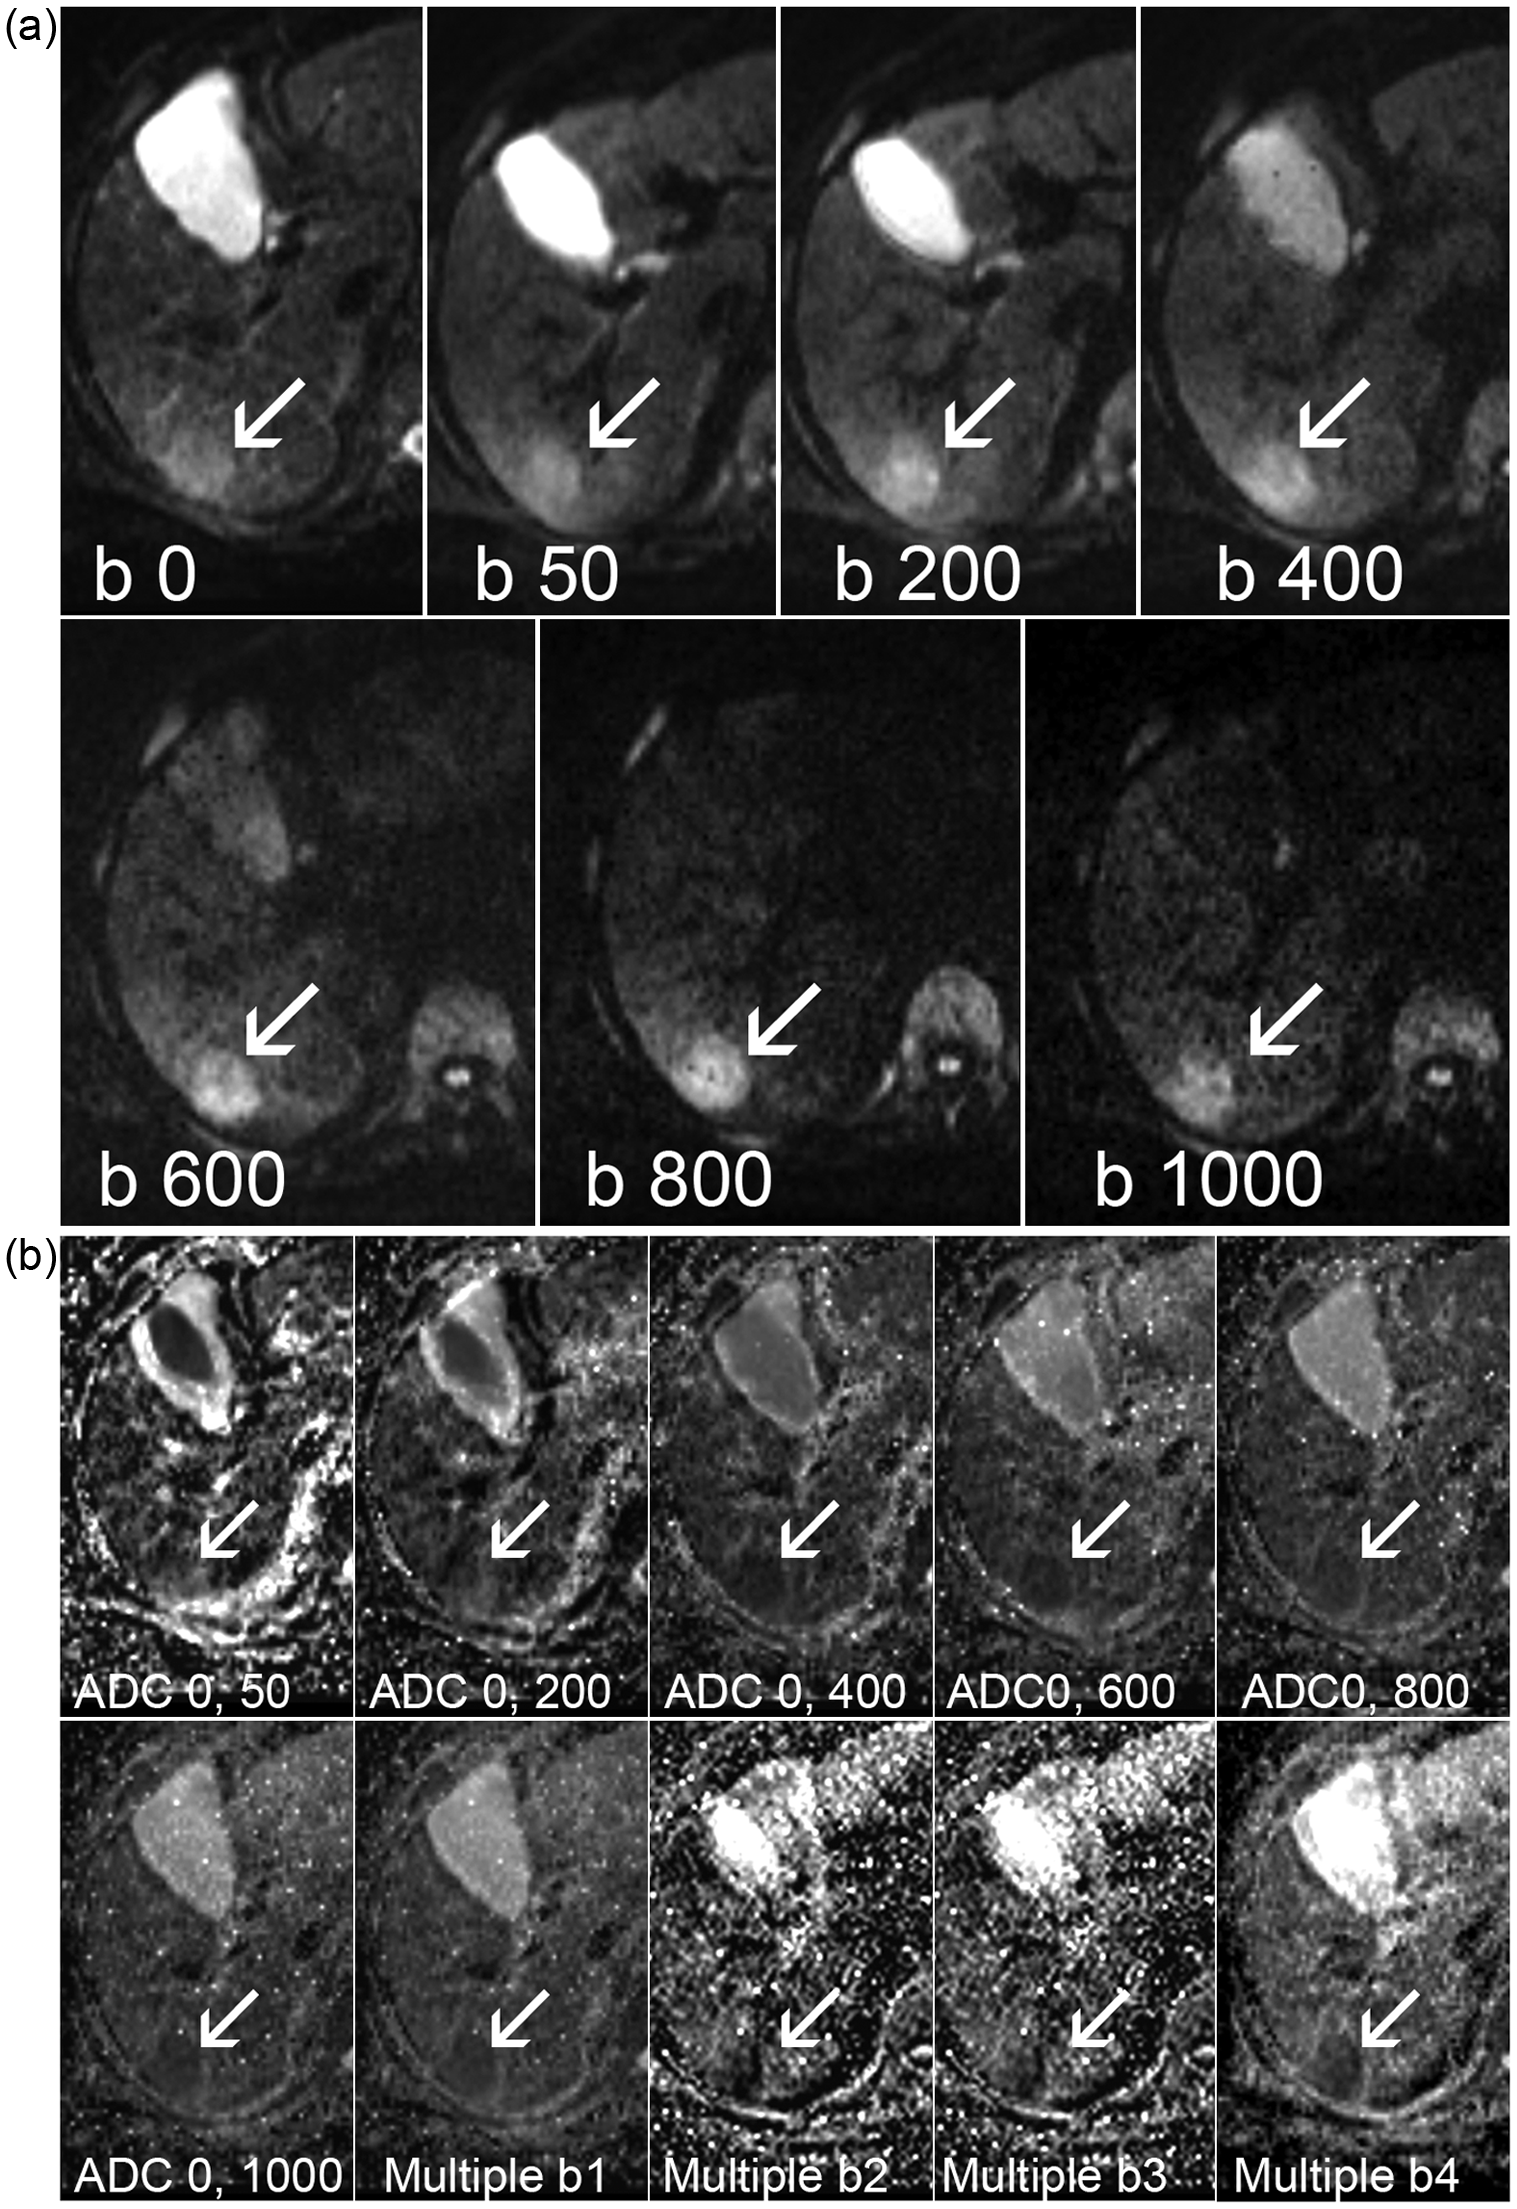
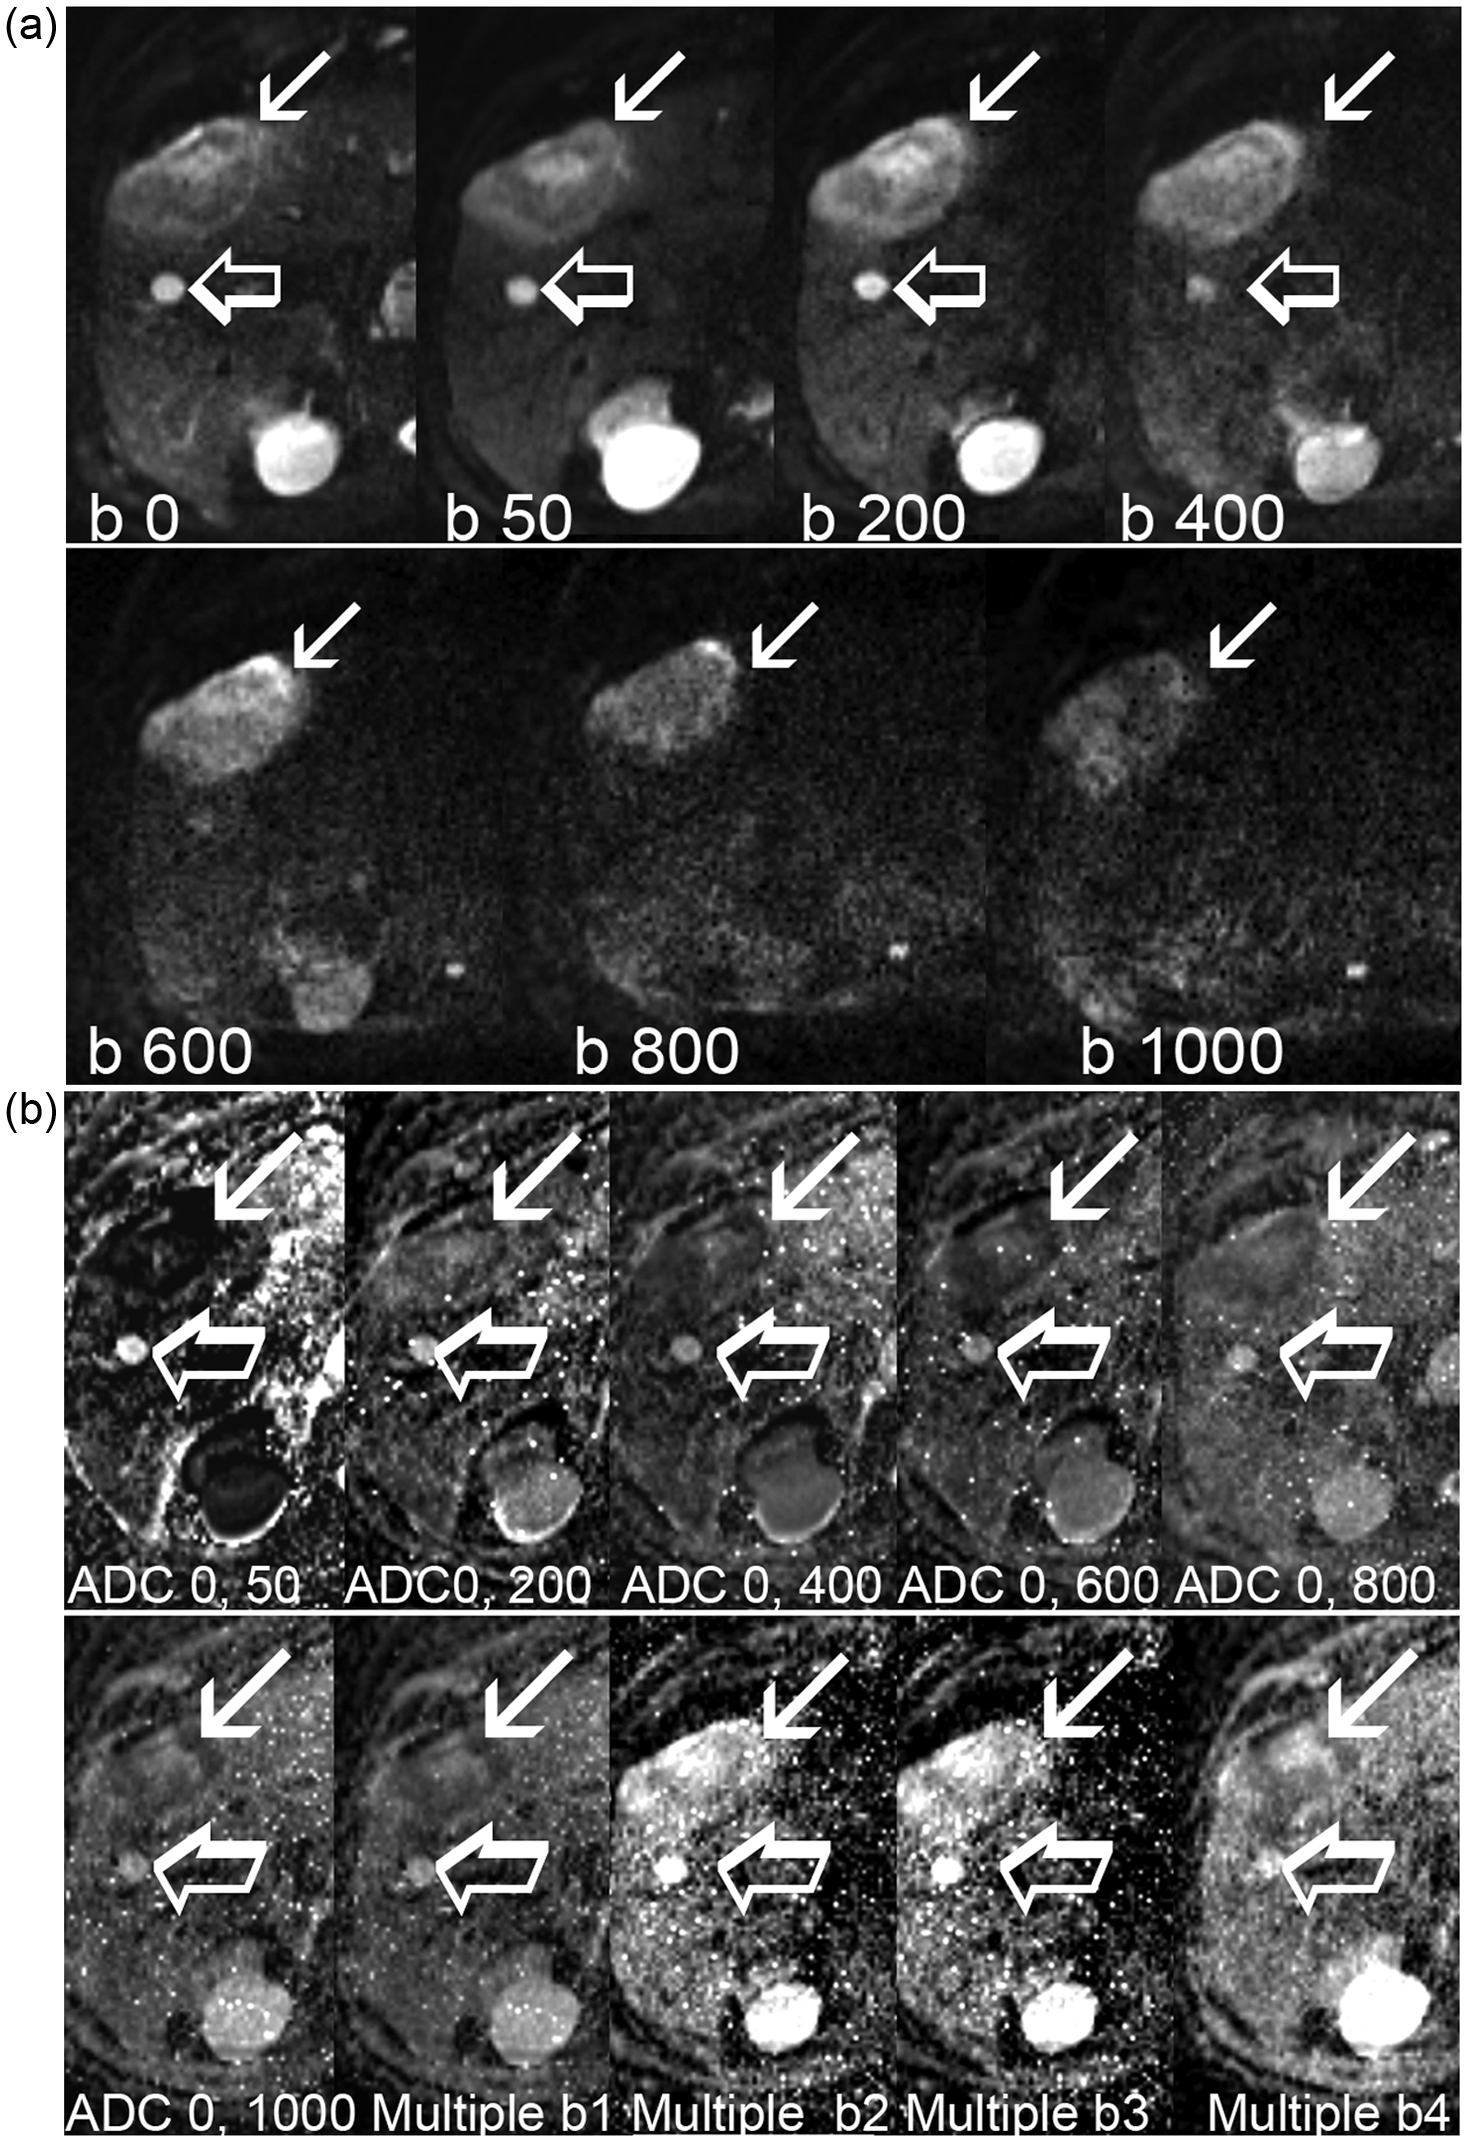
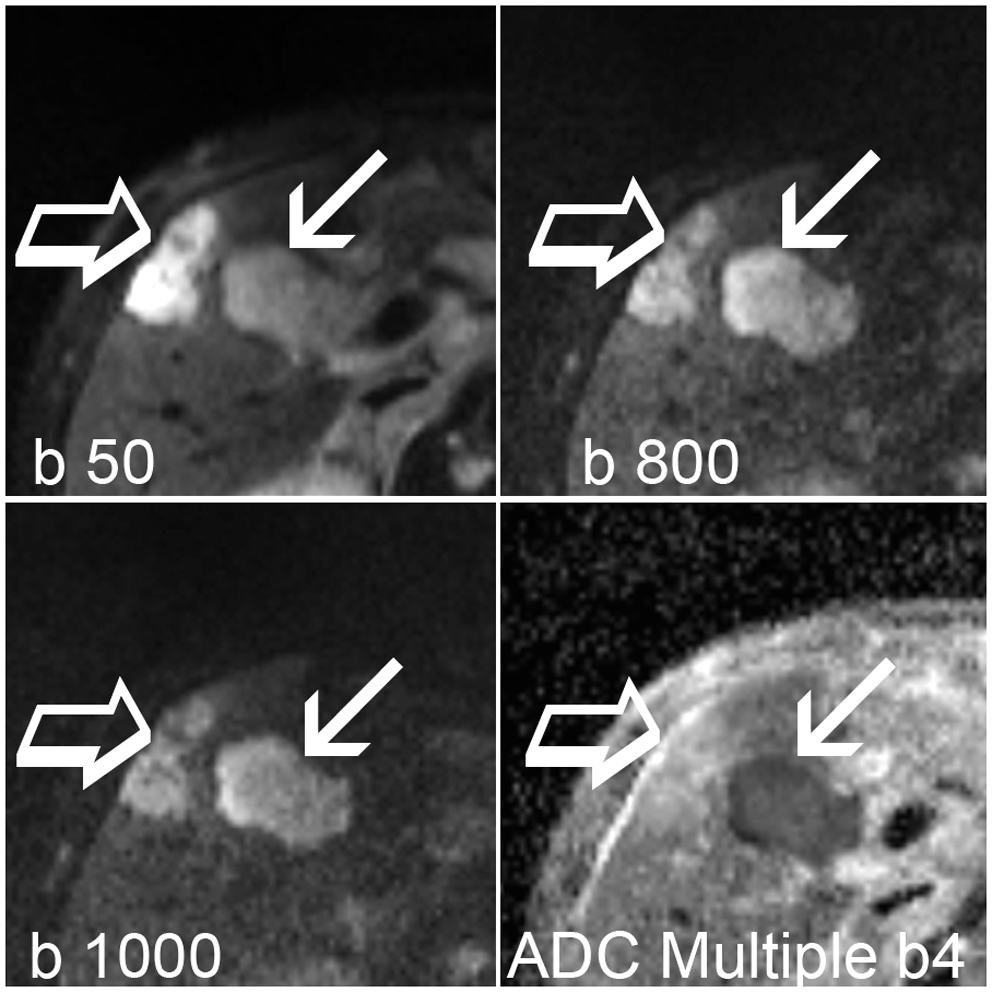
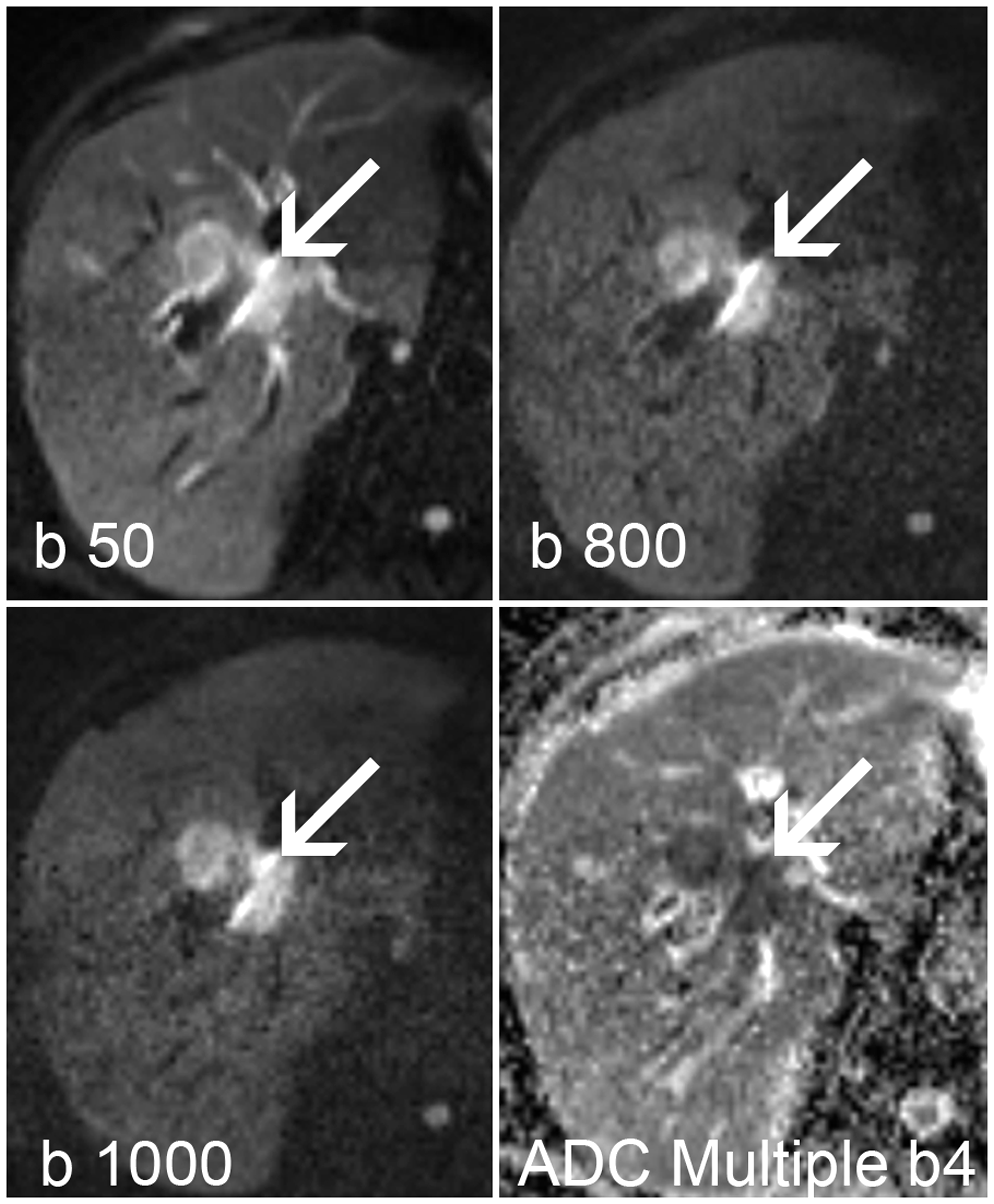
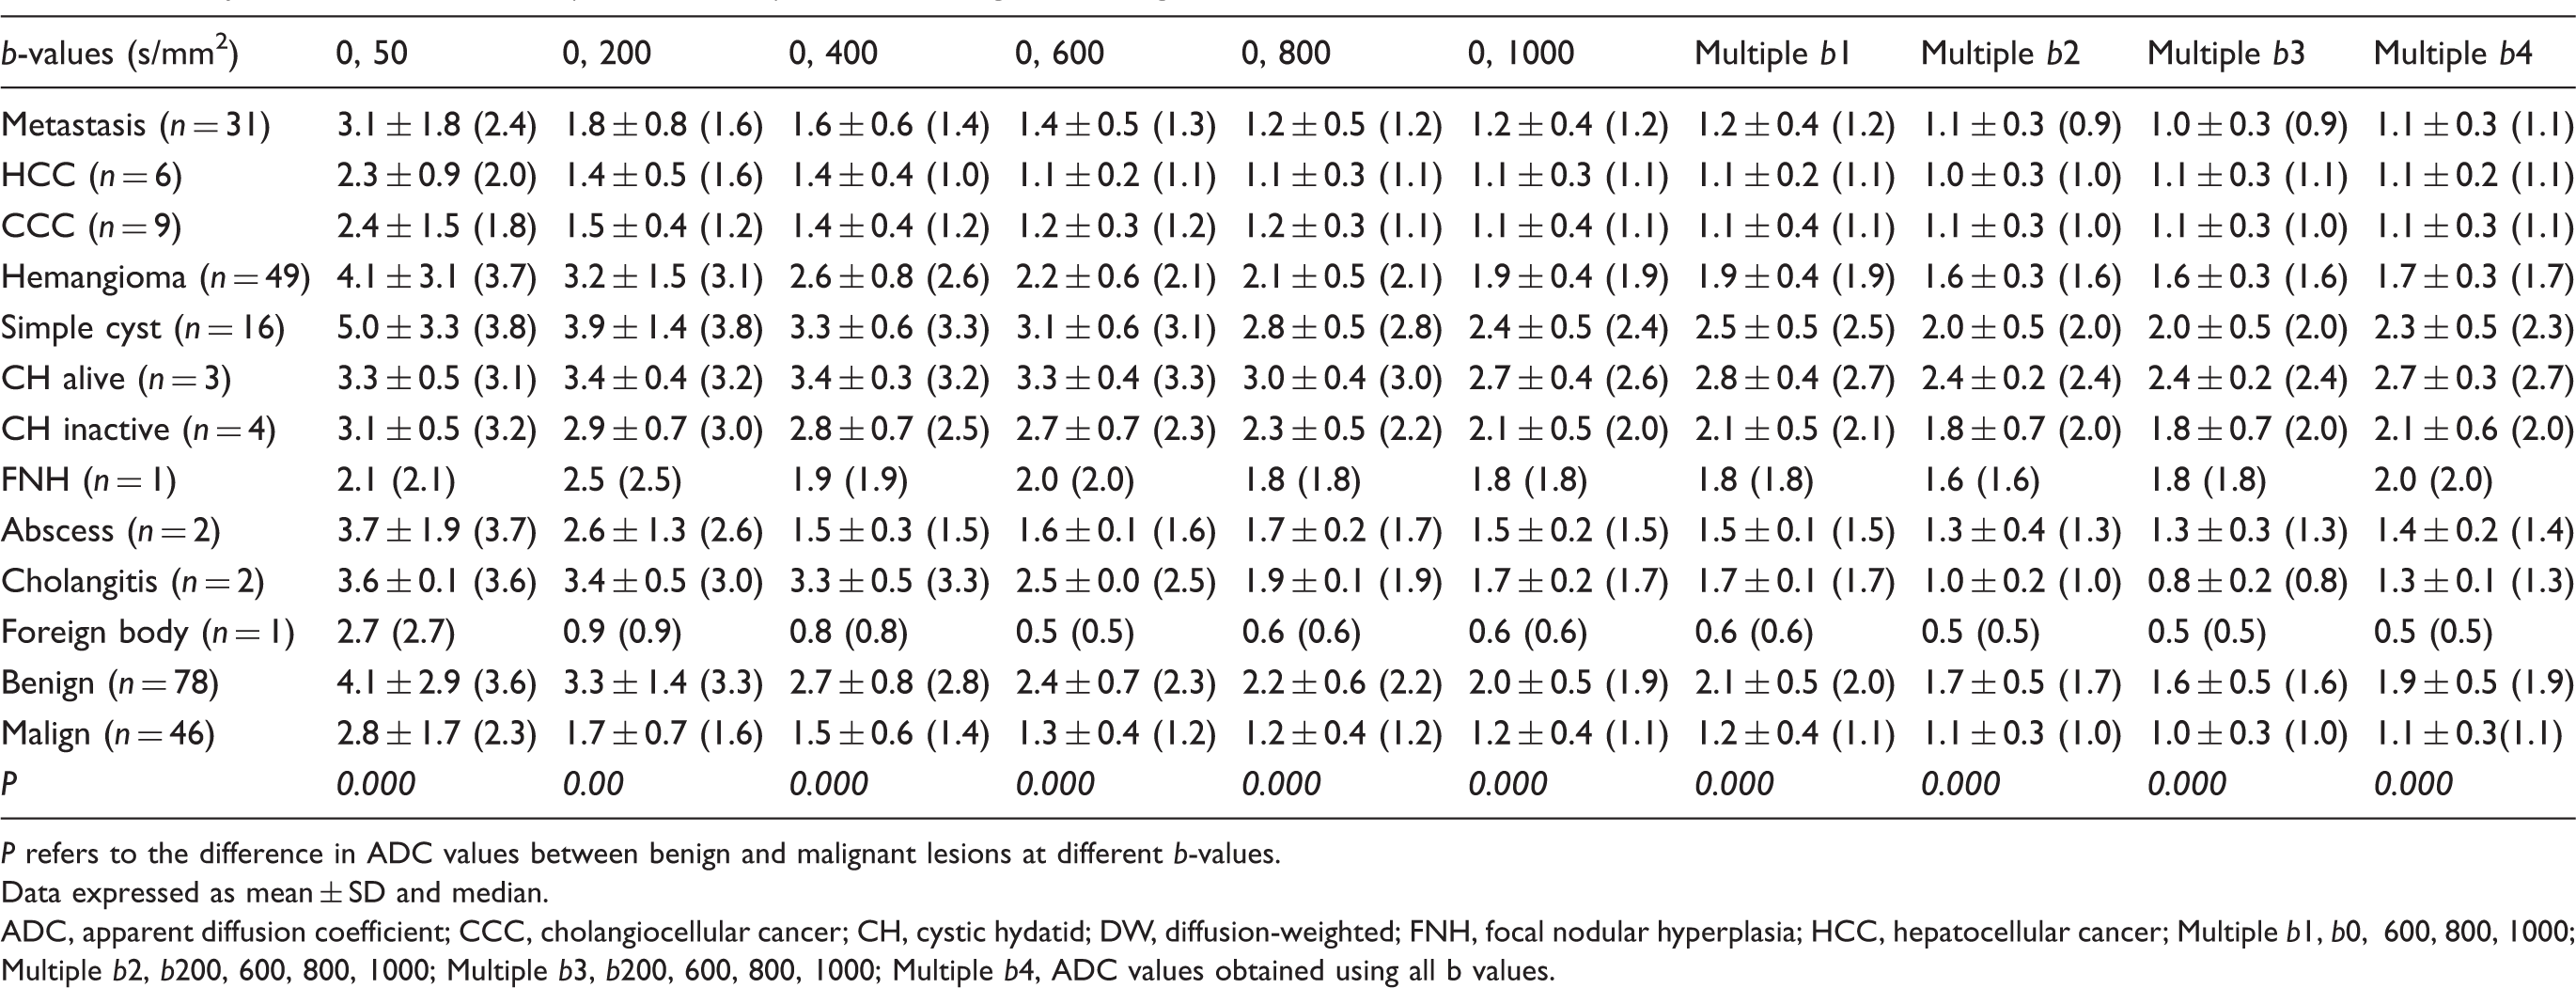
The lesion SI of DWIs obtained using different b-values are summarized in Fig. 1. Comparisons of ADC values (×10−3 mm2/s) between benign and malignant liver lesion groups on DWI with different b-value combinations are shown in Table 2 and Fig. 2a and b. ADC values showed significant differences between benign and malignant lesions for all b-value combinations (P < 0.000). Malignant lesions showed markedly low ADC values (Figs. 3–6). In malignant lesions, the lowest ADC values were observed in metastases (Fig. 4), whereas the highest ADC values were observed in cases of cholangiocellular carcinoma (CCC) (Fig. 6). The highest ADC values were observed in simple liver cysts in all cases (Fig. 4). ADC measurements of hemangioma were lower compared to fluid but were higher than those of the normal parenchyma (Fig. 5). In the malignant lesion group, high ADC values were observed in well-differentiated hepatocellular carcinoma (HCC) (n = 1, 16% of HCC lesions; b 0, 800 ADC value 1.51 × 10⁻³ mm2/s) and CCC cases (n = 2, 22% of CCC lesions; b 0, 800 ADC values 1.75 and 1.60 × 10⁻³ mm2/s). Low ADC values in the benign group were observed in hemangioma (n = 6, 12% of hemangiomas b 0, 800 ADC values 1.12–1.51 × 10⁻³ mm2/s), in abscess (n = 1, 50% of abscesses b 0, 800 ADC value 1.52 × 10⁻³ mm2/s), and in cases of foreign body reaction (n = 1,100%, b 0, 800 ADC value 0.61 × 10⁻³ mm2/s). There were six atypical hemangiomas that showed low ADC-related central fibrosis or hemorrhage. Atypical cysts were not observed.
Signal intensity curves of benign and malignant liver lesions in DW-MRI obtained using different b-values. Comparison of (a) lesion ADC values (×10−3 mm2/s), and (b) lesion/normal liver parenchyma ADC ratios for benign and malignant liver lesions using different b-value combinations. CCC, cholangiocellular carcinoma; HCC, hepatocellular carcinoma. A 68-year-old woman with a pathologically confirmed diagnosis of hepatocellular cancer (arrows). (a) The lesion (arrows) showed hyperintense signal intensity in diffusion-weighted images obtained using different b-values. (b) The lesion (arrows) showed restricted diffusion with a low ADC value on ADC maps obtained using different b-value combinations. A 70-year-old man with a simple cyst (open arrows) and a pathologically confirmed diagnosis of liver metastasis from colon adenocarcinoma. (a) The simple cyst (open arrows) showed signal loss with increasing b-value and was not detected on higher b-value diffusion-weighted images, whereas the metastatic lesion (arrows) showed relatively high signal intensity compared to the liver parenchyma. (b) The metastatic lesion (arrows) showed restricted diffusion with low ADC value, and the simple cyst (open arrows) showed increased diffusion with high ADC value on ADC maps obtained using different b-value combinations. A 59-year-old man with hemangioma (open arrows) and pathologically confirmed lymphoma infiltration (arrows) of the liver. Both of the lesions showed hyperintense signals on diffusion-weighted images obtained using different b-values A 74-year-old man with a pathologically confirmed diagnosis of cholangiocellular carcinoma. A mildly hyperintense lesion (arrows) was observed on diffusion-weighted images obtained using different b-values. The lesion (arrow) showed restricted diffusion with low ADC value on ADC map obtained using all b-values (Multiple b4). Comparison of ADC values (×10−3 mm2/s) between benign and malignant liver lesions in DW-MRI with different b-values. P refers to the difference in ADC values between benign and malignant lesions at different b-values. Data expressed as mean ± SD and median. ADC, apparent diffusion coefficient; CCC, cholangiocellular cancer; CH, cystic hydatid; DW, diffusion-weighted; FNH, focal nodular hyperplasia; HCC, hepatocellular cancer; Multiple b1, b0, 600, 800, 1000; Multiple b2, b200, 600, 800, 1000; Multiple b3, b200, 600, 800, 1000; Multiple b4, ADC values obtained using all b values.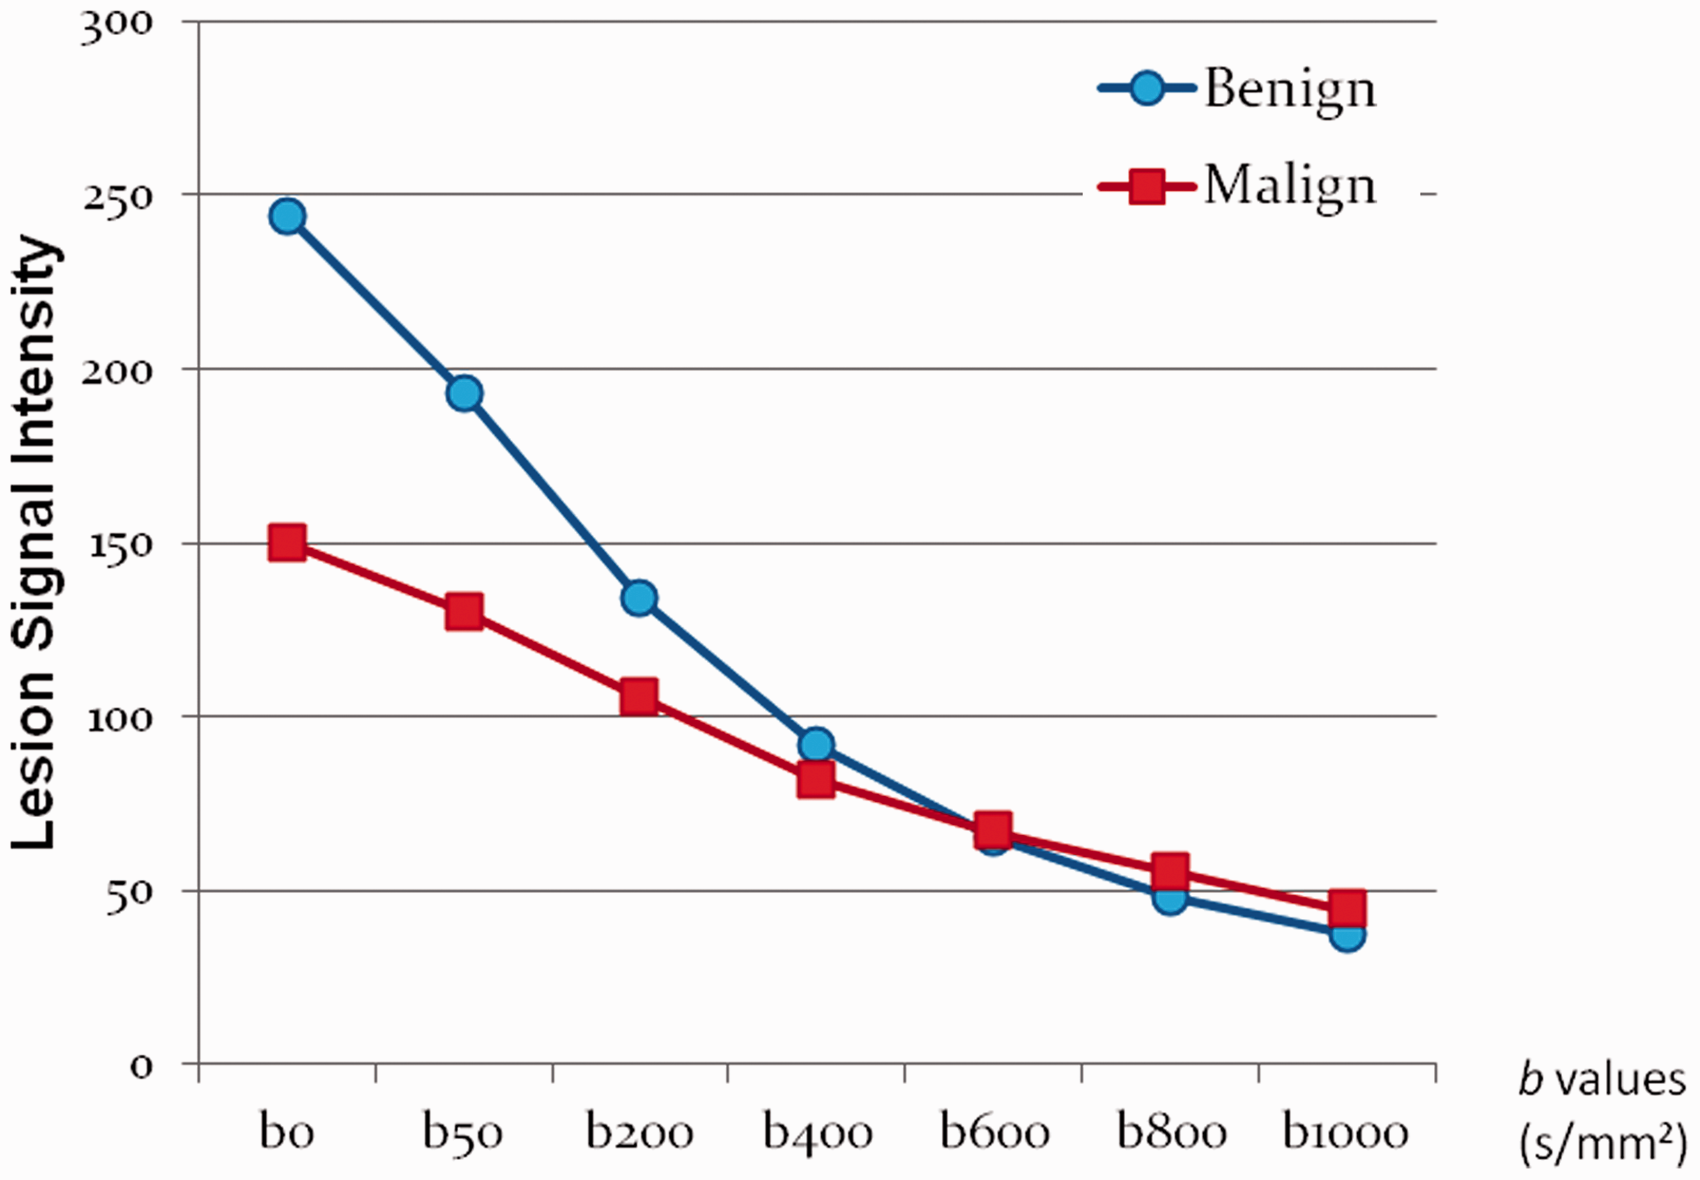

ROC analysis of the ADC values in differentiation of the benign and malignant lesions for each b-value combination.

ADC, apparent diffusion coefficient; AUC, area under the curve; Multiple b1, b0, 600, 800, 1000; Multiple b2, b200, 600, 800, 1000; Multiple b3, b200, 600, 800, 1000; Multiple b4, ADC values obtained using all b-values; ROC, receiver-operating characteristics; SE; standard error.
In ROC analysis, which was performed to evaluate the diagnostic performance of the ADC value for differentiation of benign and malignant lesions using different b-value combinations, multiple b1, b = 0, 1000 s/mm2, and b = 0, 800 s/mm2 were found to show the highest performance (Az = 0.917, Az = 0.914, and Az = 0.913, respectively). For the most appropriate cut-off points and ROC curves calculated for all b-value combinations, the corresponding success rates with a final diagnosis, including sensitivity, specificity, and accuracy, are shown in Table 3. For example, when the ADC ratio (lesion ADC/normal parenchyma) cut-off point was set to 1.2 the sensitivity and specificity for differentiation of malignant and benign lesions were 95% and 77%, respectively.
Discussion
Although there were significant differences between the SI of malignant and benign lesions at low b-values, such as 0, 50, and 200 s/mm2, it was not possible to distinguish benign from malignant lesion using SI alone at b = 600 s/mm2 at the intersection point (Fig. 1). There were significant differences in ADC values between benign and malignant lesions for all b-value combinations. If only two b-values were used, we suggest that b 0, 800 s/mm2 should be used. However, b = 0, 50, 600, 800, and 1000 s/mm2 should be used as multiple-b-value combinations. When b = 0 and b = 50 s/mm2 values were included in the multiple b-value combinations, sensitivity, specificity, and accuracy increased, and ADC values also increased by 13% (1–15%) (Table 2). When lesion/normal liver parenchyma ADC values were taken into consideration, significant differences were observed between malignant and benign lesions for all b-value combinations; multiple b l and b 0, 1000 s/mm2 were found to be the most successful. With regard to differentiation of malignant and benign lesions, however, only ADC value was found to be better than the ratio of lesion/normal liver parenchyma ADC. Lesion/normal liver parenchyma ADC ratios can be used for differentiation of benign and malignant liver lesions in the presence of measurable normal background liver parenchyma.
On DWI, to distinguish benign from malignant lesions, although it is sufficient to use two different b-values, the number of b-values can be increased. However, this may lead to longer MRI duration, which may be a disadvantage but may also increase the accuracy of the measurements. Although ADC values increase using low b-values (b < 100), accuracy also increases for differentiation of benign and malignant lesions as shown in the present study.
In the present study, a small number of lesions was not properly visualized on DWIs. In these circumstances, conventional MRI sequences, including T2- and T1-weighted and enhanced sequences, are helpful for detailed visualization of the lesions. Coronal or sagittal plane images can be useful for movement artifacts. The possible cause of SI differences observed between benign and malignant lesions (Fig. 1) are related to the DWI SI components. DWI SI is affected by intra- and extracellular water diffusion, temperature, capillary perfusion, and the T2 relaxation time (9,10). Differences in the DWI SI are related to the weighting of these effects and b-values used (11). Using low b-values, lesions appear hyperintense because the T2-weighted contrast is still dominant. An area with a very long T2 relaxation time may remain at a high signal at DWI and be mistaken for restricted diffusion. This is known as the “T2 shine-through effect” and decreases by increasing b-value (9,11). The perfusion and T2 shine through effect are higher at low b-values (9,10). Problems related to the T2 shine-through effect can be resolved by concurrent evaluation of the DWIs and corresponding ADC maps (9). We can overcome the perfusion effect using higher b-values. Freiman et al. reported that the perfusion effect can be minimized to <7% by combining b min = 270 s/mm2 and b max = 800 s/mm2 to obtain adequate perfusion insensitive ADC measurements (12). The influences of tissue diffusion and microcirculation can be separated using the intravoxel incoherent motion (IVIM) model (13). Although quantitative DWI has been reported in liver disorders, the imaging parameters, particularly b-values, were diverse, producing variable results (3,5,14–20). It was suggested that three different b-values (b = 0, b < 100, b ≥ 500) can be used for liver DWI (9). DWI obtained using low b-values increases lesion detection by suppressing normal liver SI (6,7,14,21–23). A significant ADC difference was reported between benign and malignant liver lesions (16). The combined use of low and high b-values can be used to discriminate between benign and malignant liver lesions (8,24). The ADC value increases for low b-values (b < 100) due to the perfusion effect (25). In previous studies, b-values of ≥400 s/mm2 have been used for differentiation of benign/malignant lesions on abdominal DWI (6,22,23,26). Bruegel et al. reported that they could differentiate malignant from benign lesions with 88% accuracy with an ADC value of 1.63 × 10⁻³ mm2/s as a cut-off for b = 50, 300, and 600 s/mm2 (6). However, Hardie et al. reported 75.7% sensitivity and 81% specificity with a cut-off ADC value of 2.0 × 10⁻³ for b = 0, 50, and 500 s/mm2 (27). In the present study, with a lesion ADC value cut-off point of 1.59 × 10⁻³ mm2/s for b = 0, 800 s/mm2, the sensitivity and specificity were 87% and 90%, respectively. Necrotic areas in malignant lesions can lead to heterogeneity and high ADC values (28,29). To eliminate this factor, we only measured the solid component of the lesions, if present. Due to the technical differences, liver parenchyma ADC values were low in some studies (17), high in others, and average compared to other groups in other studies (28). Some studies indicated significant differences between the ADC values of four liver segments (30). Due to cardiac movement artifacts, it is sometimes difficult to evaluate ADC on the left lobe (16). Hepatic fatty infiltration, fibrotic collagen, or iron deposition in cirrhosis can also decrease ADC values (21,31). In accordance with the results of previous studies, liver cysts had the highest ADC values in the present study (6). The ADC of hemangiomas was lower than that of the fluid and higher than that of the normal parenchyma (27). Although differential diagnosis in the cases with typical cysts and hemangiomas is usually not a problem without DWI, we can perform differential diagnosis of these lesions in a relatively short examination period using DWI rather than conventional MRI sequences, and without using contrast materials. Benign lesions such as adenomas and FNH can have restricted diffusion (27,32). In contrast to these results, we found that focal nodular hyperplasia (FNH) lesions had notably higher ADC values than malignant lesions (Table 2). Among the malignant lesions, metastases showed the highest ADC value, whereas CCC had the lowest value (5,26).
In the present study, high ADC values were observed in some of the malignant lesions, including well-differentiated HCC (n = 1) and CCC (n = 2). In the case of well-differentiated HCC, lesions were classified as malignant according to the b 0, 800 ADC cut-off. In HCC cases, a relatively high ADC value is an indicator of low malignant potential and is related to histopathological differentiation (33). Reliable diagnosis of small HCC is possible using DWI and gadoxetic acid-enhanced MRI (34,35). In our two cases of CCC, the benign/malignant status of the lesions could not be determined due to the high ADC values. Among the benign lesions, abscesses have been reported to have the lowest ADC values (26). We found similar results. Visual evaluation of the DWI and ADC maps together is also useful. Central restricted diffusion of an abscess can be helpful for differentiation from necrotic tumors showing peripheral restricted diffusion (10).
Low ADC values were observed in some of the other benign lesions, including hemangioma (n = 6) and foreign body reaction (n = 1), and benign/malignant status could not be determined when only ADC values were taken into account. Low ADC values of some benign lesions such as hemangiomas can be related to hemorrhage, thrombosis, hemosiderin deposition, and fibrosis (10). Recent meta-analysis studies have shown that ADC values are useful for differentiating between malignant and benign focal liver lesions, by providing rapid quantifiable information (36,37). Further study is required for standardization and reproducibility of the used techniques and methods. Case-based phantom correlations of measured ADC values can be used to improve results.
The present study has some limitations. First, the observers did not perform the evaluations independently. However, we do not consider this much of a limitation, as these two observers’ combined efforts to compromise increased the sensitivity of the measurements. Second, inter- or intra-observer variability was not assessed. Another limitation is the small number of some solid benign lesions such as FNH. Although histopathological analyses were not performed for some benign lesions, biopsy is accepted as invasive in diagnosis of these benign lesions.
In conclusion, we recommend the use of b-values of 0 and 800 s/mm2 as two b-values, or b = 0, 50, 600, 800, and 1000 s/mm2 as multiple b-values for distinguishing between benign and malignant liver lesions. Additionally, a mean ADC value 13% higher in total can be achieved by the additional use of b = 0 and b = 50 s/mm2 in multiple b-value combinations.
Footnotes
Funding
This research received no specific grant from any funding agency in the public, commercial, or not-for-profit sectors.