
Abstract
Background
Diffusion-weighted (DW) imaging is commonly used to distinguish between benign and malignant liver lesions.
Purpose
To prospectively evaluate the true molecular-diffusion coefficient (D), perfusion-related diffusion coefficient (D*), perfusion fraction (f), and ADC of focal hepatic lesions using a free-breathing intravoxel incoherent motion (IVIM) DW sequence, and to determine if these parameters are useful for characterizing focal hepatic lesions.
Material and Methods
One hundred and twenty hepatic lesions (34 metastases, 32 hepatocellular carcinoma [HCC], 33 hemangiomas, and 21 liver cysts) in 74 patients were examined. Mean D, D*, f, and ADC values of hepatic lesions were compared among pathologies. ROC curve analyses were performed to assess the performances of D, D*, f, and ADC values for the characterization of liver lesions as benign or malignant.
Results
The mean D and ADC values of benign lesions were greater than those of malignant lesions (P < 0.001). Although the mean D and ADC values of liver cysts were greater than those of hemangiomas (P < 0.001), and these values were not significantly different between metastases and HCCs (P = 0.99). Area under the ROC curve for ADC values (0.98) was significantly greater (P = 0.048) than that for D values (0.96) for the differentiation of benign and malignant lesions. Sensitivity and specificity for the detection of malignant lesion were 89% and 98%, respectively, when an ADC cut-off value of 1.40 was applied.
Conclusion
D and ADC values have more potential for characterizing focal hepatic lesions than D* or f values, and for the differentiation of malignancy and benignity.
Introduction
Intravoxel incoherent motion (IVIM) imaging was initially developed by Le Bihan et al. (1) to quantitatively assess the microscopic translational motions that occur in each image voxel in magnetic resonance (MR) images. They demonstrated that true molecular diffusion and microcirculation by blood perfusion can be distinguished by IVIM-based diffusion-weighted (DW) imaging, provided that multiple b values encompassing low ( < 200 s/mm2) and high (>200 s/mm2) values are used.
Recently, Luciani et al. (2) demonstrated that apparent diffusion coefficient (ADC) and perfusion-related diffusion coefficient (D*) values are lower in cirrhotic than in healthy livers, while true molecular-diffusion coefficient (D) and perfusion fraction (f) are similar by respiratory-gated IVIM MR imaging (MRI) using 10 different b values (0, 10, 20, 30, 50, 80, 100, 200, 400, and 800 s/mm2). Yamada et al. (3) first proposed the usefulnesses of D and f values for the characterization of hepatic lesions by breath-hold IVIM DW MRI, but used only a limited number of b values (30, 300, 900, and 1100 s/mm2) and did not calculate D* values.
No previous study has evaluated the merits of D, D*, f , and ADC values for the characterization of focal hepatic lesions using a 3-T IVIM MR DW sequence or has determined its diagnostic performance by receiver-operating characteristic (ROC) curve analysis, and thus, we undertook this study.
Material and Methods
Patients
This prospective study was approved by our institutional review board, and written informed consent was obtained from all study subjects. During the 9-month period from December 2010 to August 2011, 250 consecutive patients with suspected chronic liver disease or with a focal hepatic lesion determined clinically or by ultrasonography or computed tomography (CT) underwent IVIM DW MRI in our department. One hundred and seventy-six patients were excluded because of no evidence of a hepatic lesion (n = 116 patients), prior radiofrequency ablation (n = 15), prior transarterial chemoembolization (n = 15), an unknown lesion (n = 14), dysplastic nodules (n = 7), prior partial hepatectomy (n = 3), focal nodular hyperplasia (n = 3), biliary hamartoma (n = 1), intrahepatic cholangiocarcinoma (n = 1), or a complicated cyst (n = 1). The remaining 74 patients (46 men, 28 women; age range, 30–92 years; mean, 66.4 years) with a total of 120 focal liver lesions (size range, 5–170 mm; mean, 20.5 ± 17.5 mm) constituted the study population. Three patients had five lesions, three patients had four lesions, seven patients had three lesions, 14 patients had two lesions, and 47 patients had one lesion. When a patient had lesions of different pathologies, all pathologies were included in the study.
Thirty-eight patients had 66 malignant lesions (34 metastases [size range, 5–76 mm; mean, 22.0 ± 4.7 mm] and 32 hepatocellular carcinoma [HCC] [size range, 10–34 mm; mean, 18.0 ± 6.1 mm]). Fourteen metastases and four HCCs were diagnosed by partial hepatectomy, 10 HCCs by ultrasonographically-guided percutaneous tumor biopsy, and 20 metastases and 18 HCCs by pathognomonic imaging findings and elevated serum tumor markers, or a finding of lesion growth at follow-up imaging over 1–6 months (mean, 3.2 months). For hepatic metastases, the primary malignancies were colorectal cancer in 11 patients, gastric cancer in two patients, breast cancer in one patient, pancreatic adenocarcinoma in one patient, gall bladder adenocarcinoma in one patient, and fibromyxosarcoma in one patient. Three hepatic metastases in two patients were previously treated with systemic chemotherapy.
Thirty patients had 54 benign lesions (33 hemangiomas [size range, 5–170 mm; mean, 22.0 ± 28.2 mm] and 21 cysts [size range, 8–52 mm; mean, 19.2 ± 10.0 mm]). One hemangioma was diagnosed by partial hepatectomy, and the remaining 32 hemangiomas and 21 liver cysts were diagnosed based on pathognomonic MRI findings and follow-up study over 6–13 months (mean, 10.5 months). For hemangiomas, a diagnosis was made when a lesion was found to be round or lobulated with high signal intensity on T2-weighted (T2W) images, a typical enhancement pattern on contrast-enhanced CT or MR images, and no interval change in size during follow-up. Liver cysts were diagnosed when a lesion was round or oval with high signal intensity on T2W images, no enhancement on contrast-enhanced CT or MR images, and no interval size change during follow-up.
Liver MRI
MRI was performed using a 3-T superconducting system (Intera Achieva Quasar Dual, Philips Healthcare, Best, The Netherlands) and a 6-channel torso array coil. The protocol used consisted of the following sequences: dual-echo T1-weighted (T1W) fast field-echo (TR/TE, 292/2.3 msec at in-phase; 292/1.1 at opposed phase; number of signals averaged, 1; slice thickness/gap, 6/1 mm; image matrix, 272 × 218, with 512 × 512 reconstruction; 25-s breath-hold acquisition for 30 slices in phase and in opposed phase); fat-suppressed respiration-triggered T2W turbo spin-echo (effective TR/effective TE, 1,600–3,600/80 ms; number of signals averaged, 2; slice thickness/gap, 6/1 mm; image matrix, 512 × 256, with 512 × 512 reconstruction; 1.5-min acquisition for 30 slices); and breath-hold gadoxetate disodium-enhanced imaging with fat-suppressed three-dimensional spoiled fast field-echo (TR/TE, 4.0/2.1 ms; flip angle, 12°; slice thickness, 4 mm with 2 mm-overlap; image matrix, 448 × 224, with 512 × 512 reconstruction; 12-s breath-hold acquisition for 90 slices during each phase) sequences. Scanning delays from abdominal aortic contrast arrival to the central k-space acquisition for the hepatic arterial, portal venous, and delayed phases were 10, 50, and 160 s, respectively. Hepatocyte-phase imaging was initiated at 15–20 min after contrast injection.
IVIM DW imaging
IVIM DW images were acquired during free-breathing approximately 5–6 min after dynamic gadoxetate disodium-enhanced imaging. The sequence used was based on single-shot spin echo-planar imaging with 10 distinct b values ranging from 0 s/mm2 to a maximum of 800 s/mm2 (0, 10, 20, 30, 50, 80, 100, 200, 400, and 800 s/mm2). The MR sequence parameters were: repetition time, 1597 ms; echo time, 55 ms; flip angle, 90°; number of signals averaged, 3; matrix, 112 × 90, with 256 × 256 reconstruction; field of view, 380 × 304 mm; bandwidth, 59.3/7.32 Hz/pixel; parallel imaging factor, 3; 40 slices of 6 mm thickness with a 0-mm gap; and acquisition time, 4 min 37 s.
Quantitative image analysis
All IVIM DW MR image visualizations and the analysis were performed using PRIDE software (Philips Research Imaging Development Environment) in IDL 6.3 (ITT Visual Information Solutions, Boulder, CO, USA). Based on IVIM theory (1,4), we estimated signal attenuation using the following equation: SI/SI0 = (1 − f ) · exp(−bD) + f · exp(−bD*), where SI is the mean signal intensity, f is the fraction of diffusion linked to microcirculation, D is the diffusion parameter representing pure molecular diffusion, and D* is the diffusion parameter representing incoherent microcirculation within voxels (perfusion-related diffusion).
The signal intensities on 10 IVIM DW images obtained using the different b factors were fed into the equation of the Levenberg-Marquardt non-linear least-squares algorithm, and D, f, and D* values were then calculated for the hepatic lesions. Analysis was performed in regions of interest (ROI) placed on different hepatic lesions. All ROIs were manually positioned by one author unaware of patient details on IVIM DW images obtained using PRIDE software. ROIs were drawn to encompass as much of the hepatic lesions as possible so it was positioned devoid of large vessels, bile ducts, or artifacts by referring to T1W, T2W, and contrast-enhanced MR images. ADC values were obtained using all 10 b factors and the following equation: ADC = ln (SI0/SI)/b, where SI0 is SI for b = 0 and SI is that for each b value.
Statistical analysis
Statistical analyses were performed using statistical software (SPSS, version 20.0.0; SPSS/IBM, Chicago, IL, USA and MedCalc, version 12.1.0.1, MedCalc, Mariakierke, Belgium). Mean sizes and D, D*, f, and ADC values of hepatic lesions were compared among pathologies using one-way analysis of variance with multiple comparisons with the Tukey criterion. ROC curve analyses were performed to assess the performances of D, D*, f and ADC values for the characterization of liver lesions as benign or malignant, or as hemangiomas or metastases. Statistical significance was accepted for P values < 0.05.
Results
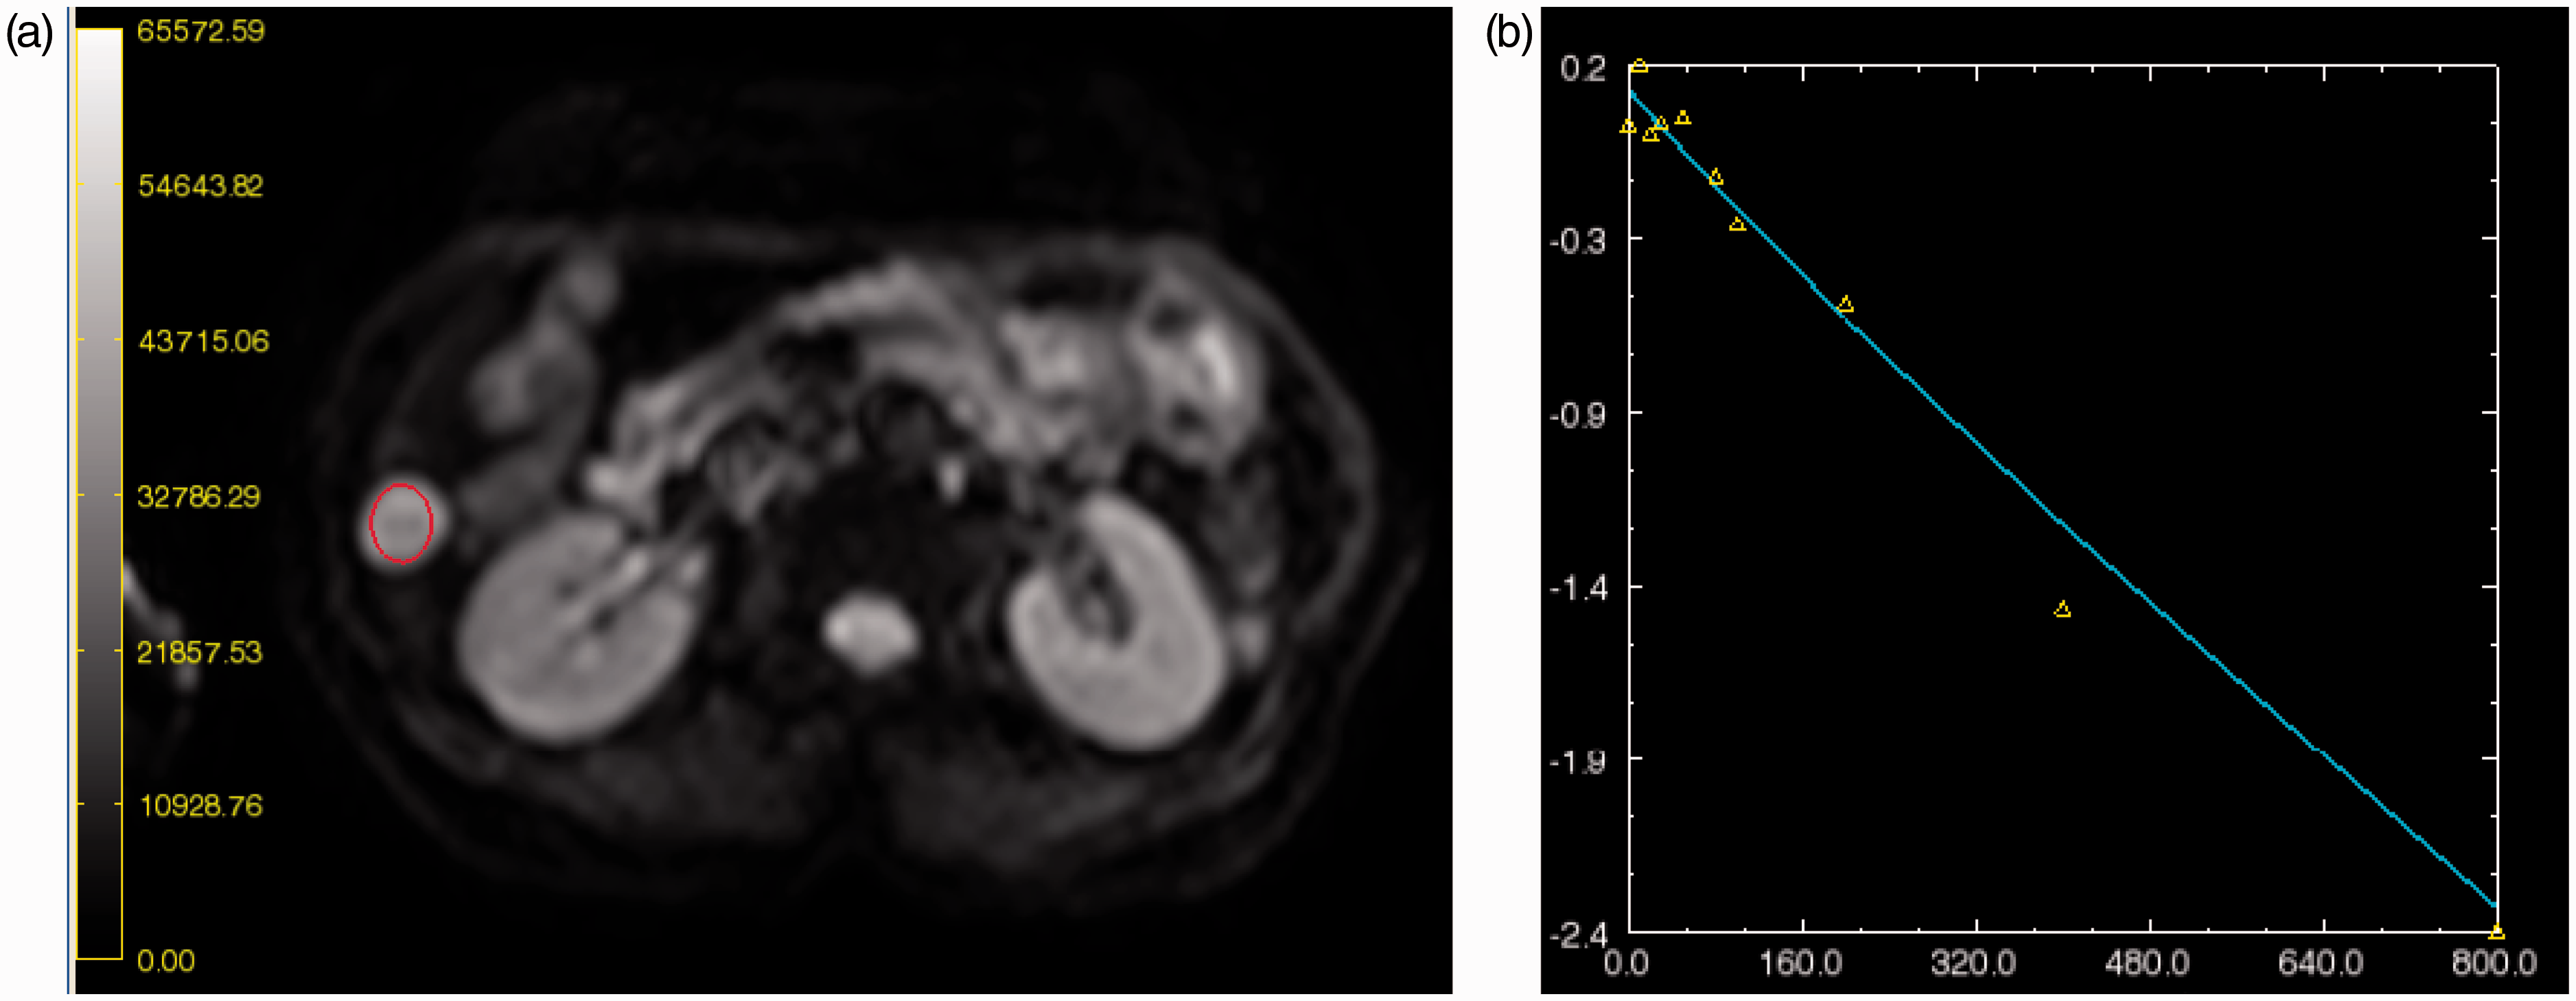
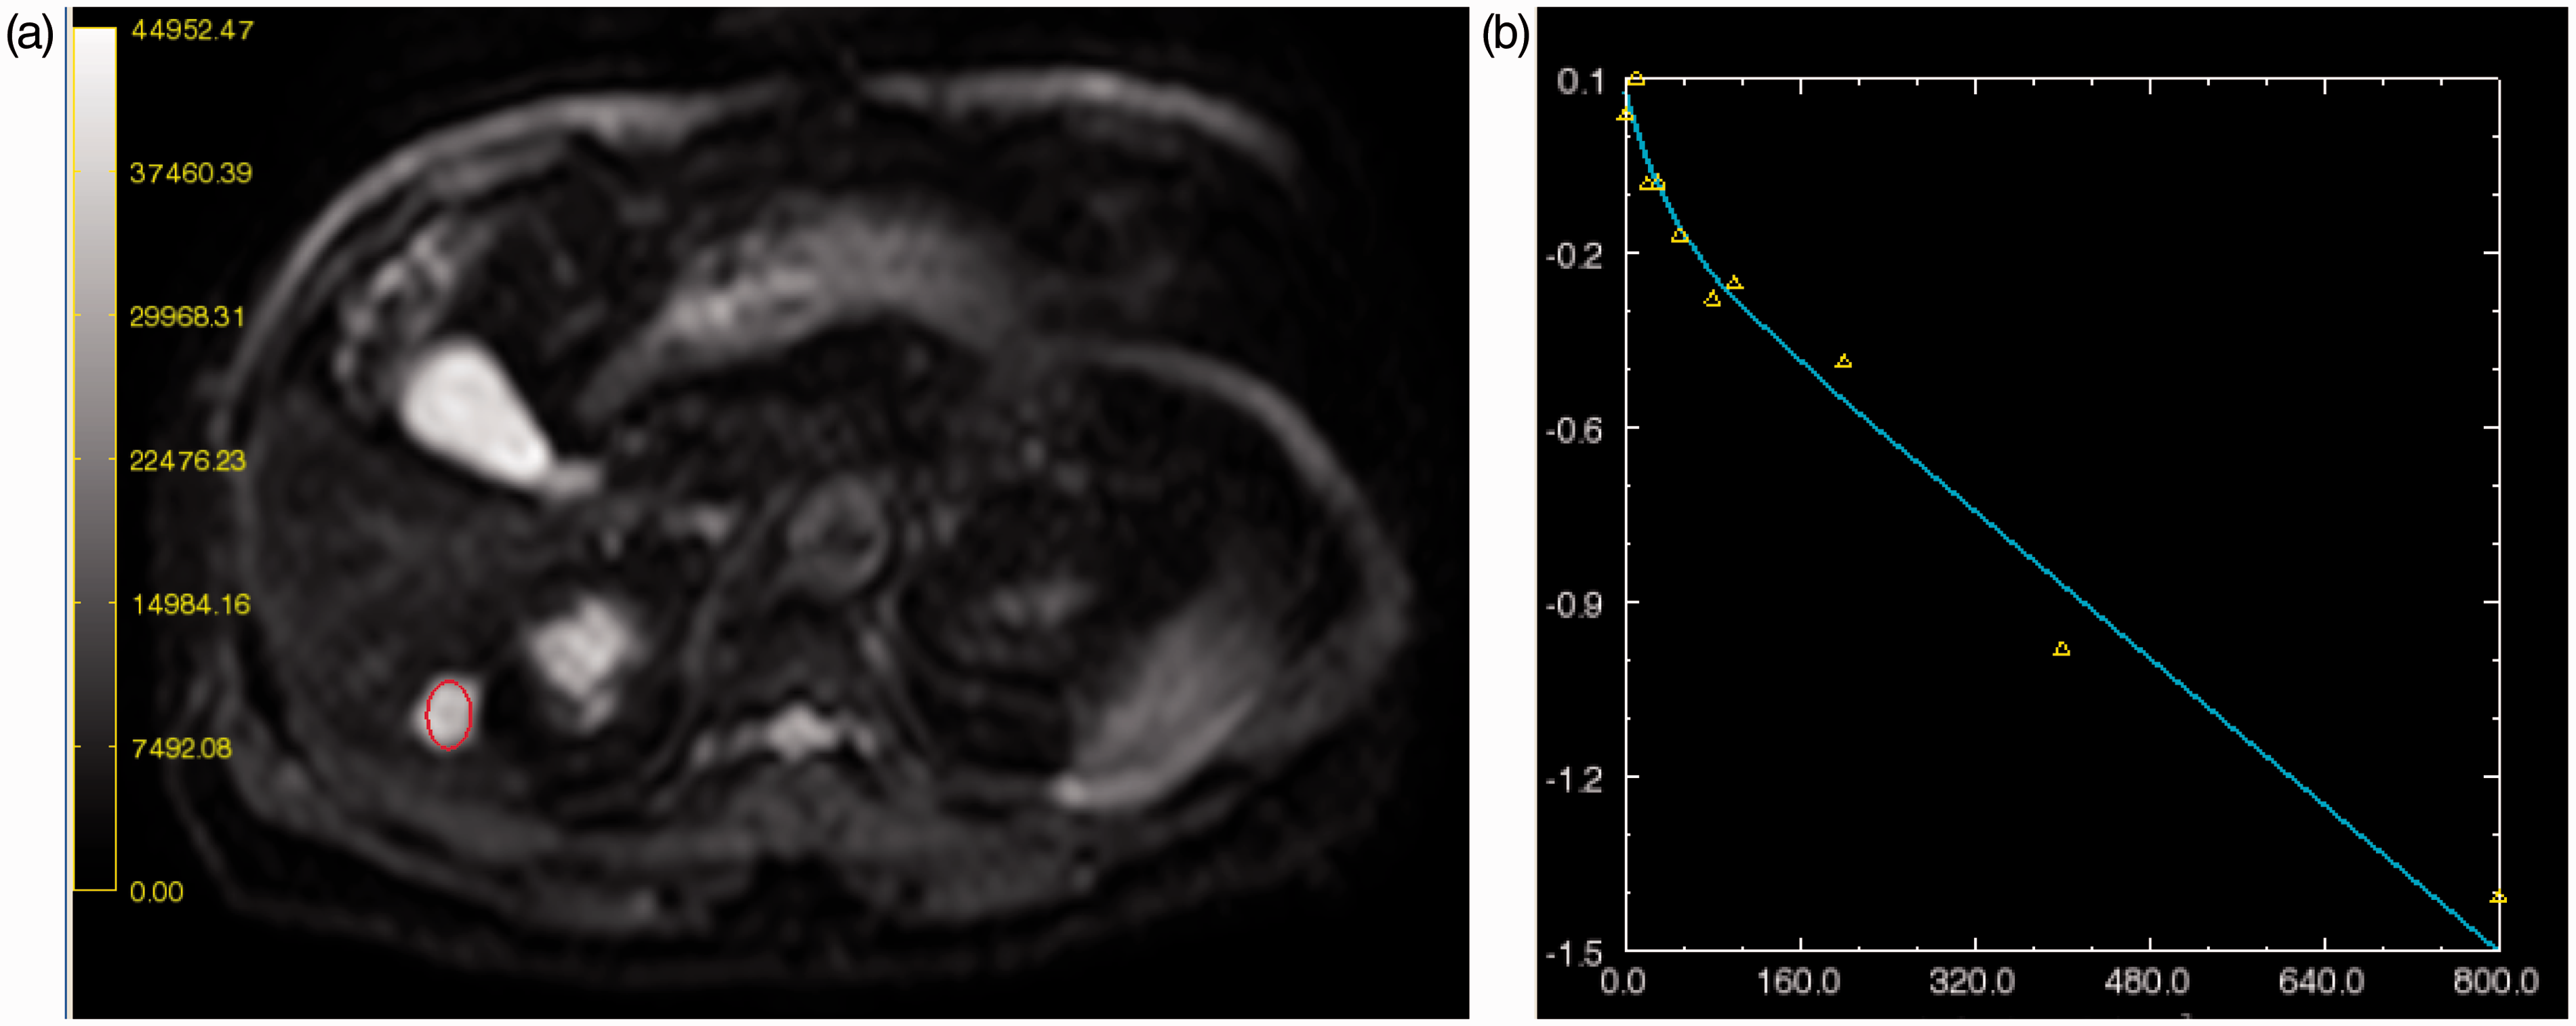
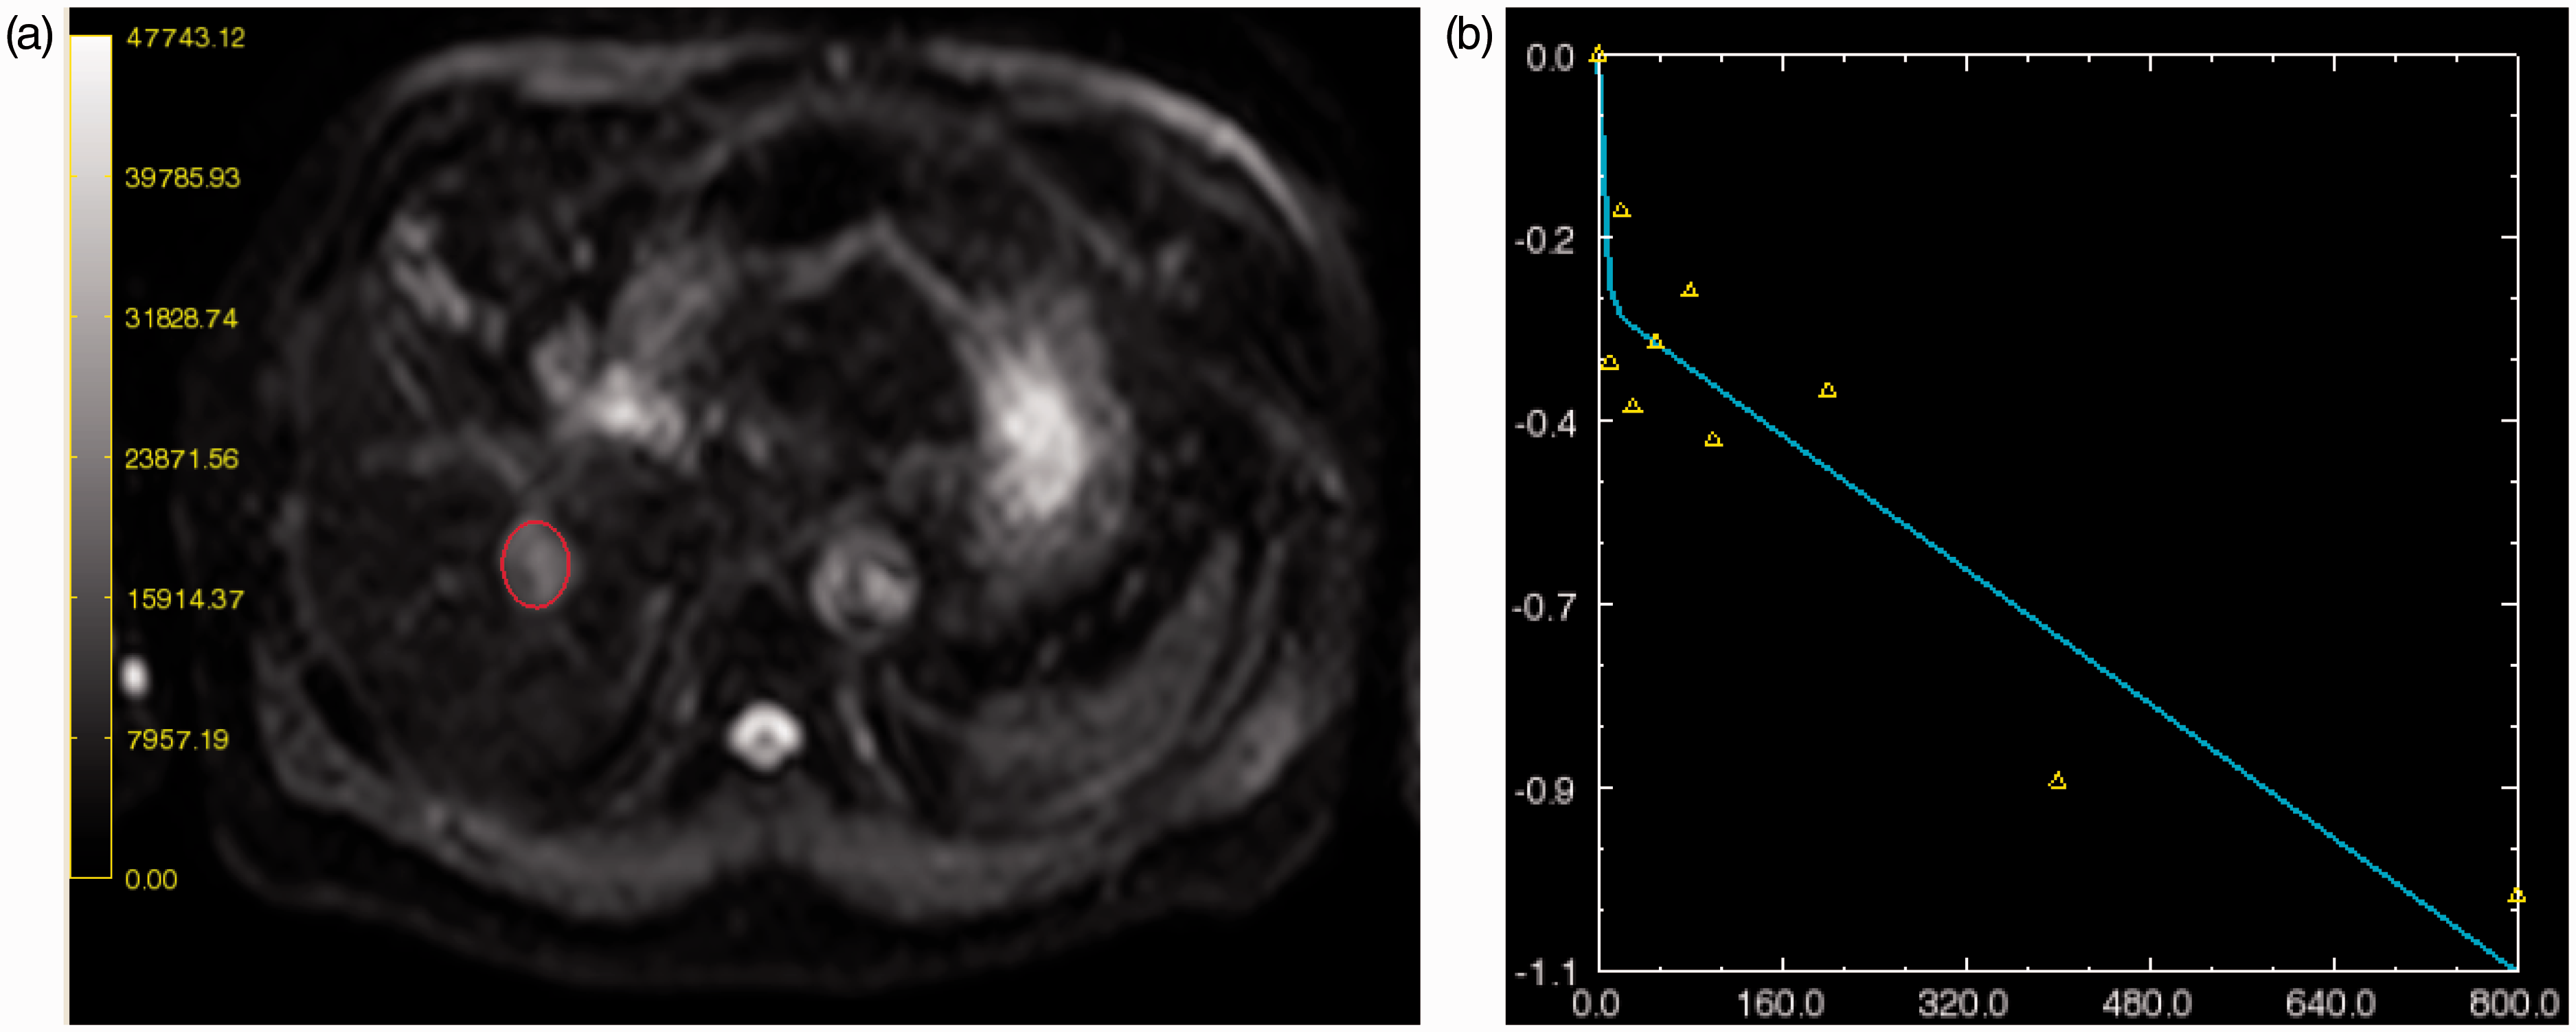
The mean size, D, D*, f, and ADC values of hepatic lesions are summarized in Table 1. Box plots of the D and ADC values of each hepatic lesion are illustrated in Fig. 1. Mean hepatic lesion size was not significantly different among pathologies (p = 0.80−1.00). However, mean D values of hemangiomas (1.77 ± 0.46 × 10⁻³ mm2/s) and liver cysts (2.53 ± 0.21 × 10⁻³ mm2/s) were significantly greater than those of hepatic metastases (0.98 ± 0.39 × 10⁻³ mm2/s) and HCCs (1.00 ± 0.30 × 10⁻³ mm2/s) (P < 0.001, all pairwise comparisons), and the mean D value of liver cysts was greater than that of hemangiomas (P < 0.001). However, the mean D values of metastases and HCCs were similar (P = 0.99) (Figs 2–5).
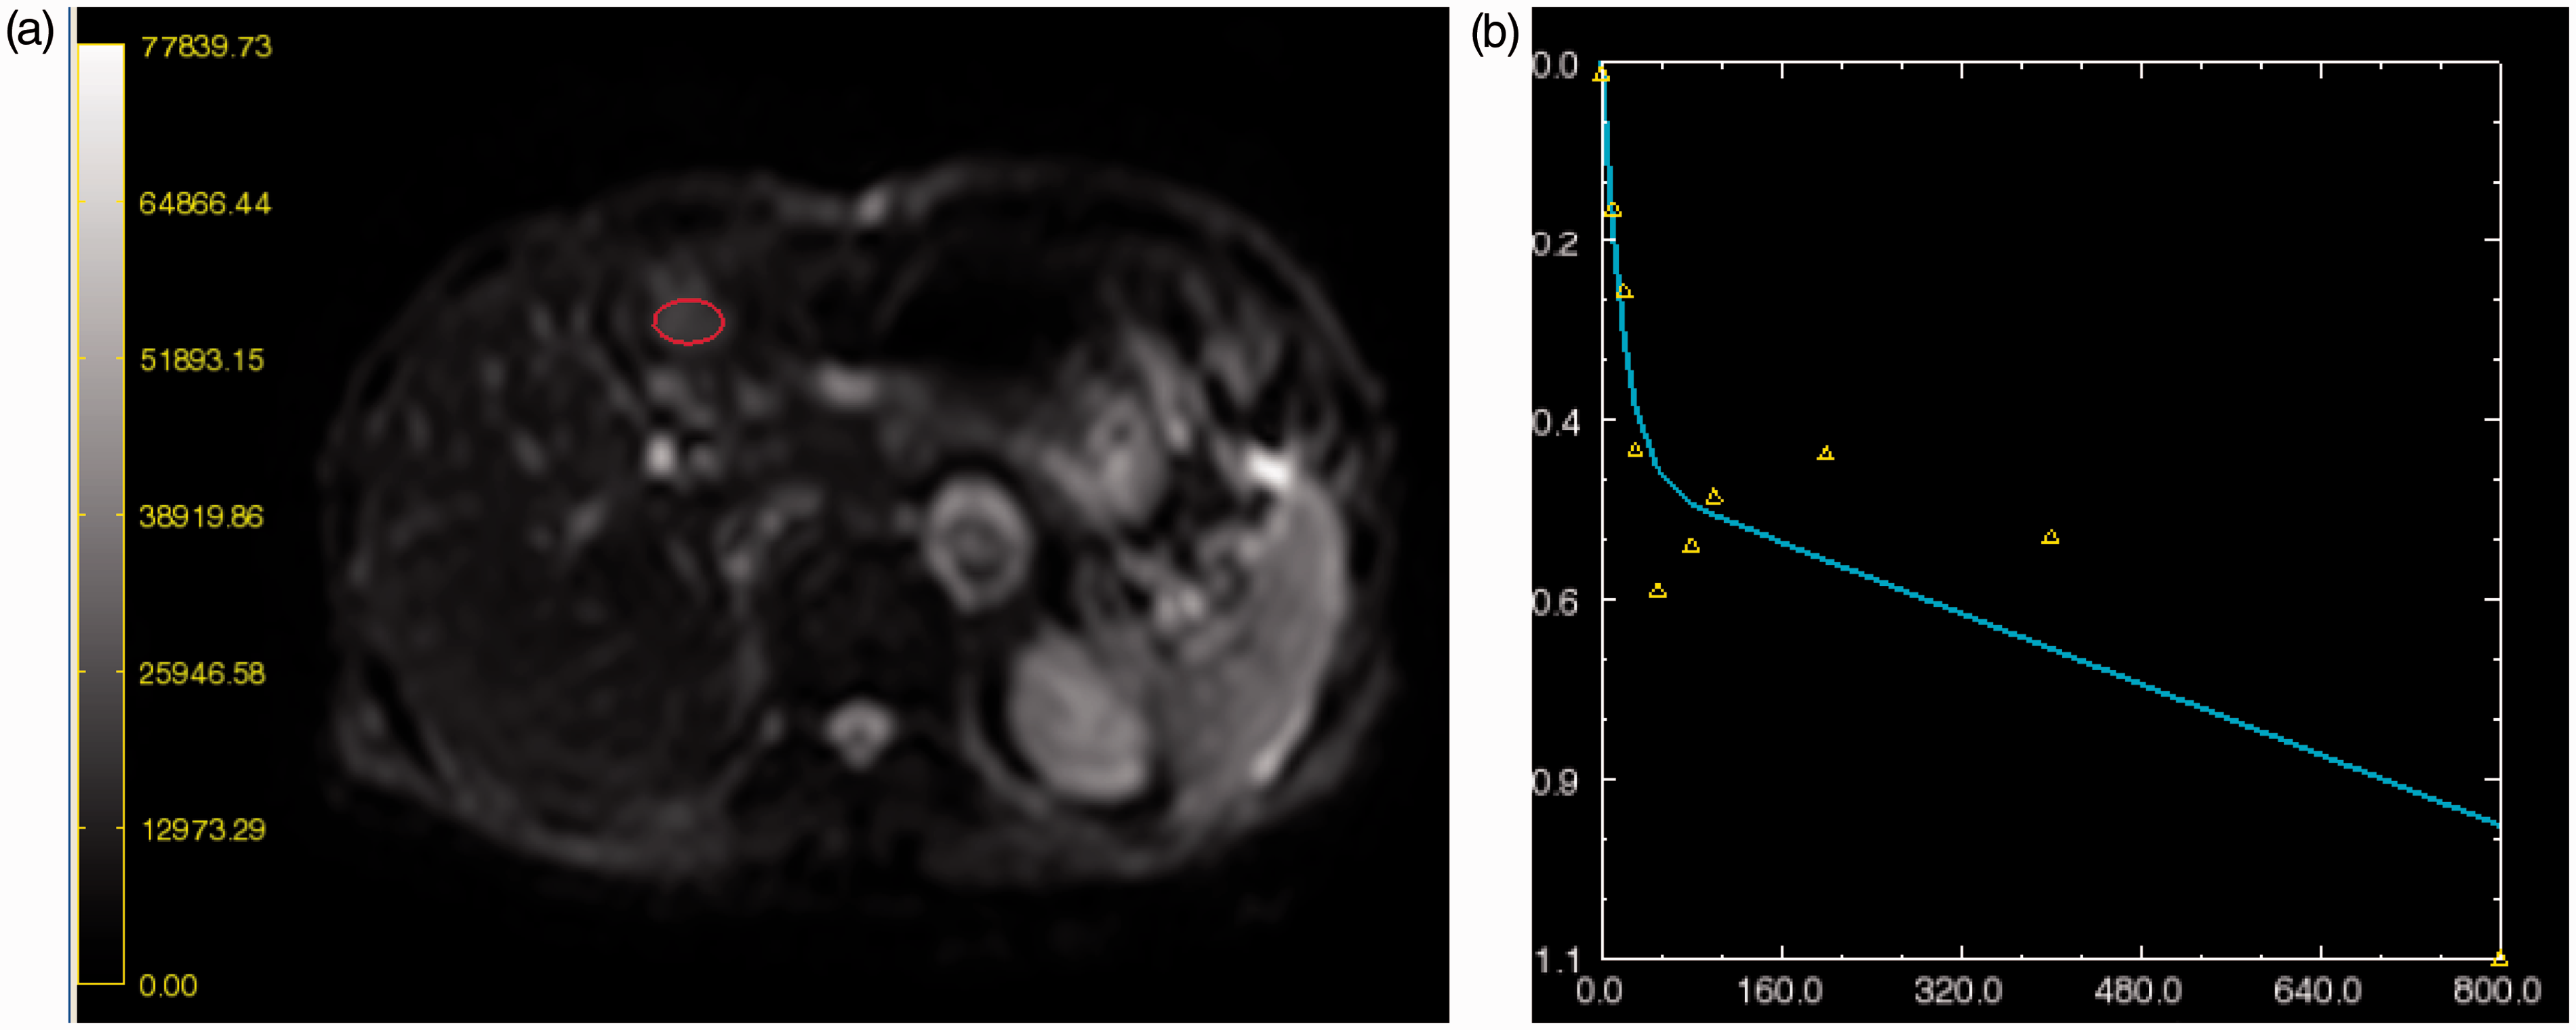
Box plots of D and ADC values for the hepatic lesions. Boundaries of boxes closest to zero indicate 25th percentiles, lines within boxes medians, and boundaries of boxes farthest from zero 75th percentiles. Error bars indicate smallest and largest values within 1.5 box lengths of 25th and 75th percentiles. ○ = Outliers, ∗ = extreme values. No significant differences were observed between the D and ADC values of metastasis and hepatocellular carcinoma. HCC, hepatocellular carcinoma. A 61-year-old woman with a liver cyst in posteroinferior segment of the right liver lobe. IVIM DW image (a) and bi-exponential fitting curve (b). Note the hepatic cyst and its circular ROI (circled in a) in segment VI of the liver. The D, D*, and f values of this cyst were 2.80, 5.00, and 0.19, respectively. Microperfusion fraction f was unusually high in this case, and was presumed to be due measurement error. A 68-year-old man with a cavernous hemangioma in posteroinferior segment of the right liver lobe. IVIM DW image (a) and bi-exponential fitting curve (b). Note the cavernous hemangioma and its circular ROI (circled in a) in segment VI of the liver. The D, D*, and f values of this cyst were 1.66, 26.88, and 0.20, respectively. A 63-year-old man with hepatocellular carcinoma in posteroinferior segment of right liver lobe. IVIM DW) image (a) and bi-exponential fitting curve (b). Note the hepatocellular carcinoma (HCC) and its circular ROI (circled in a) in segment VI of the liver. The D, D*, and f values of this HCC were 0.99, 250.0, and 0.25, respectively. The high value of D* was attributed to flow-related water molecule diffusion in this hypervascular HCC. A 77-year-old man with liver metastasis from gastric cancer in the lateral segment of the left liver lobe. IVIM DW image (a) and bi-exponential fitting curve (b). Note the liver metastasis and its circular ROI (circled in A) in segment III of the liver. D, D*, and f values of the liver mass were 0.54, 62.01, and 0.40, respectively. The IVIM parameters alone are not difficult to distinguish liver metastases from HCC. Mean sizes and D, D*, f, and ADC values of hepatic lesions. Data are means ± standard deviations.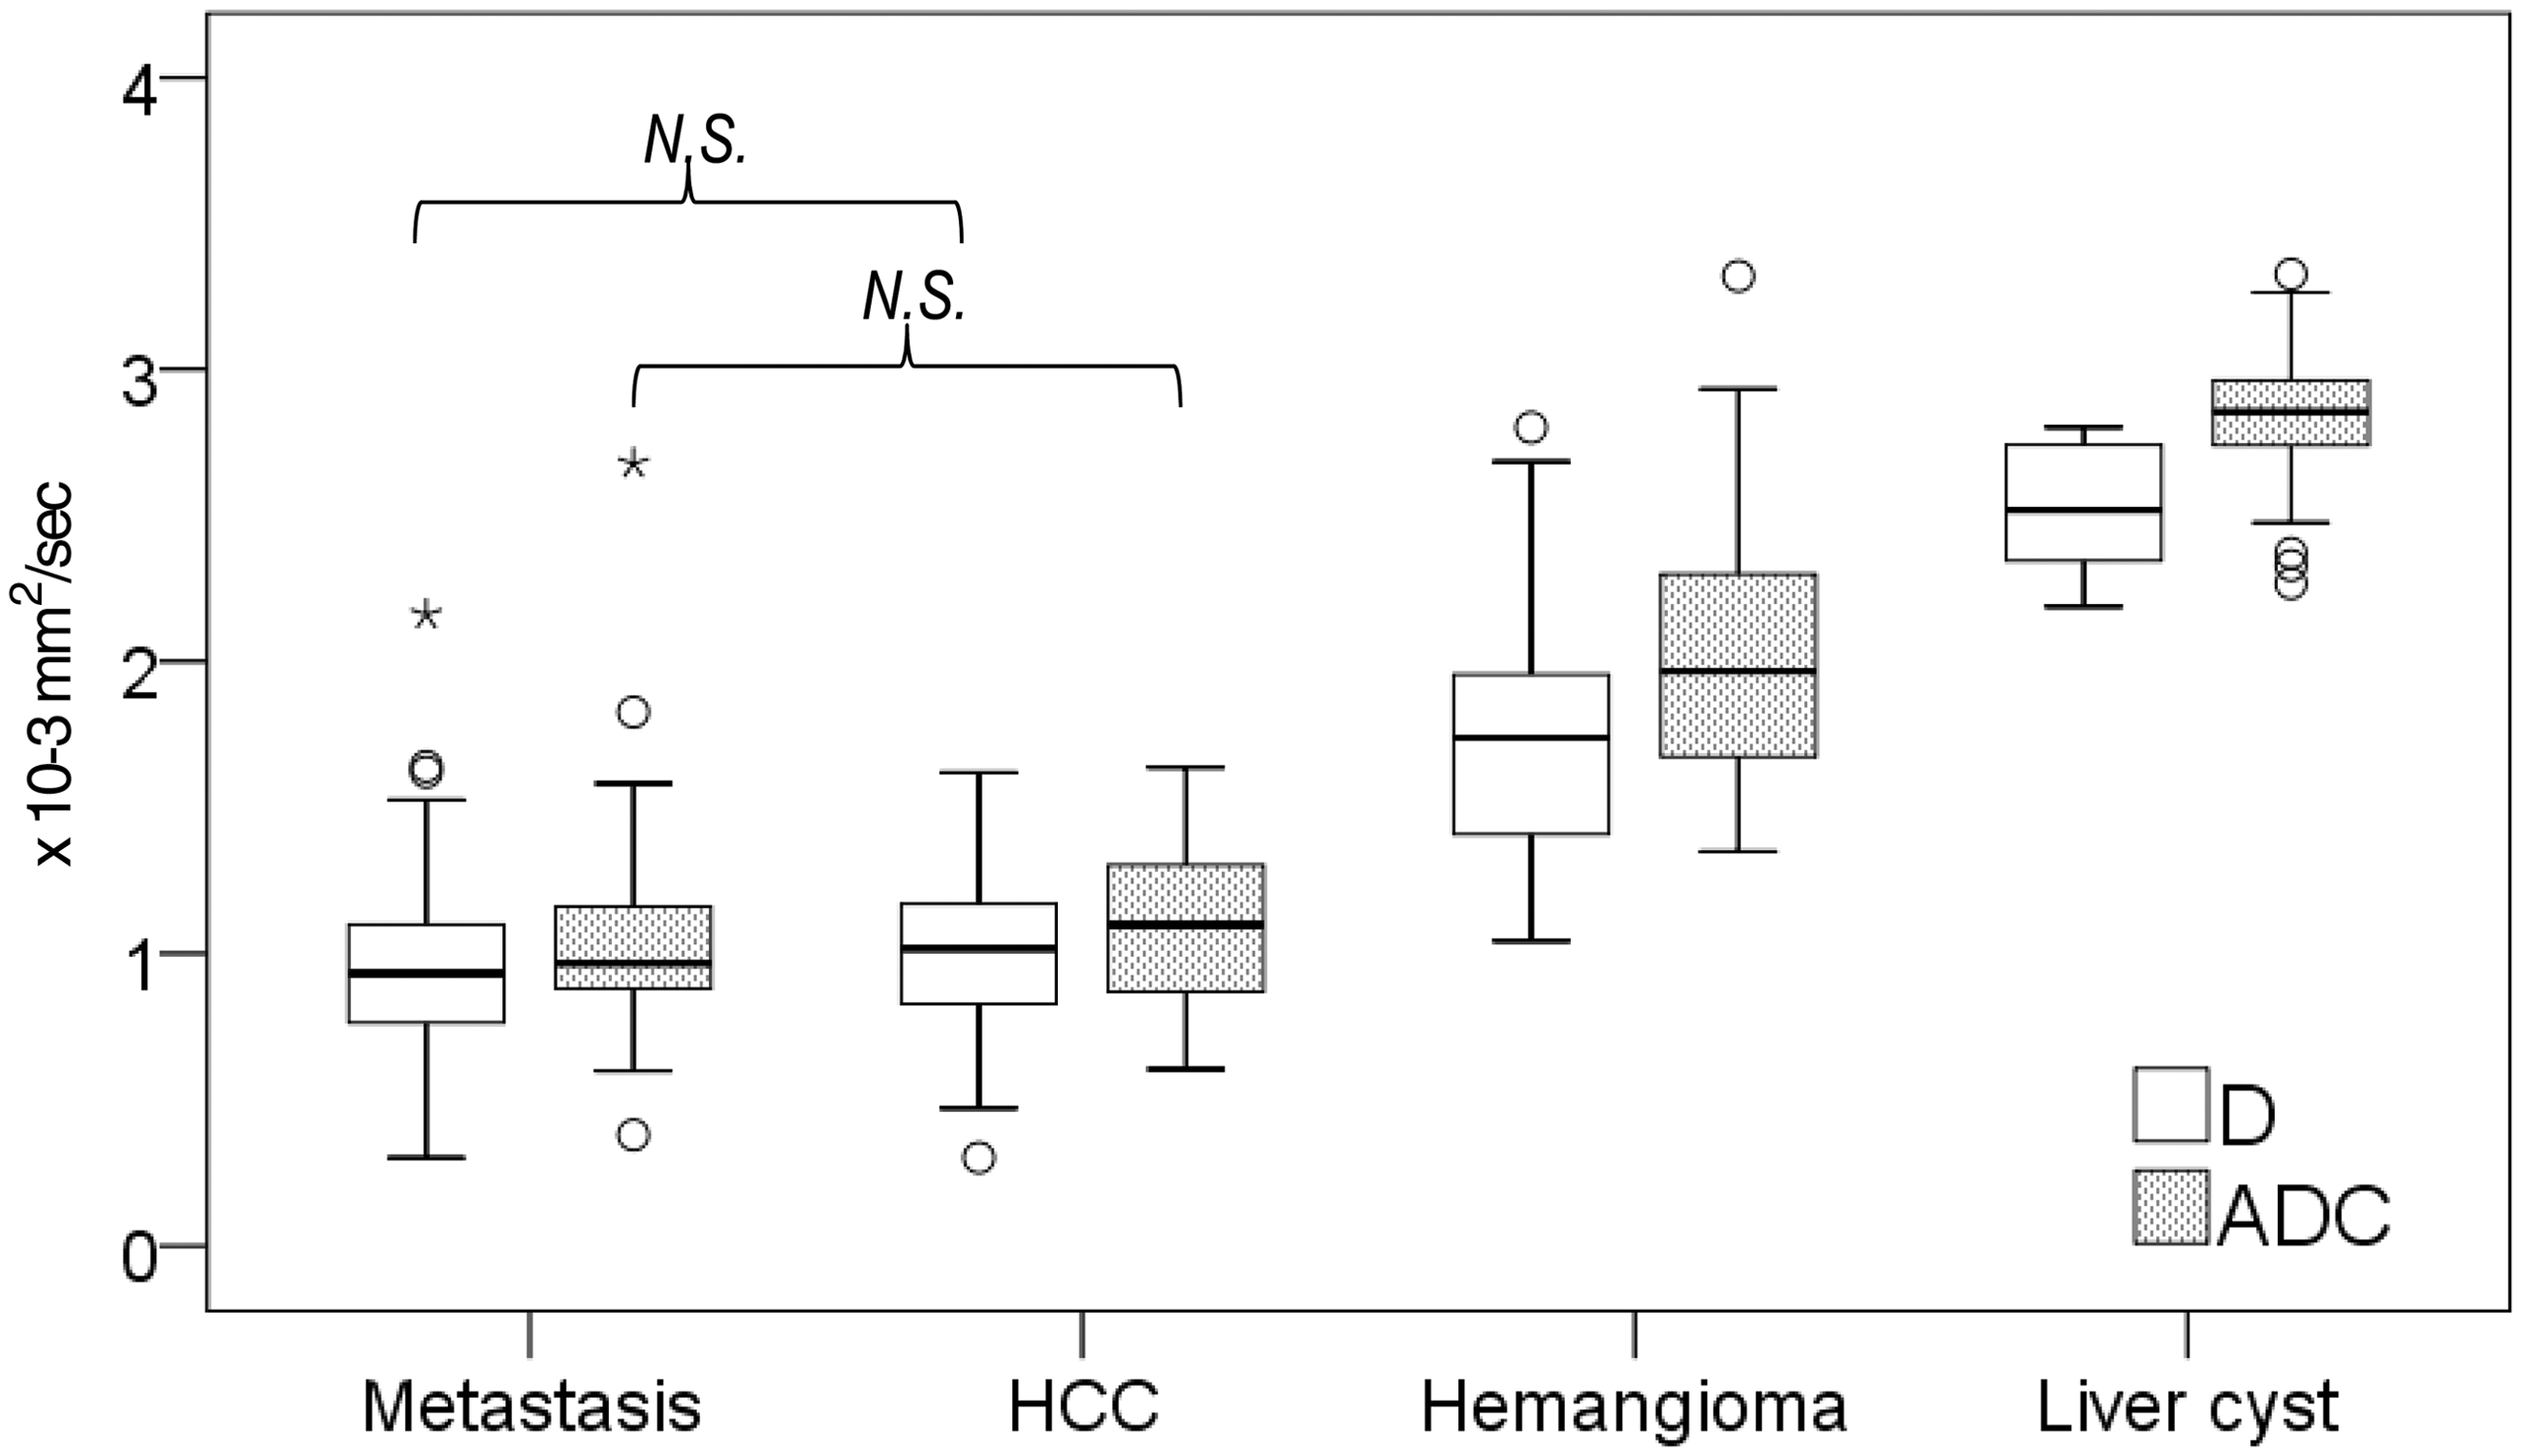
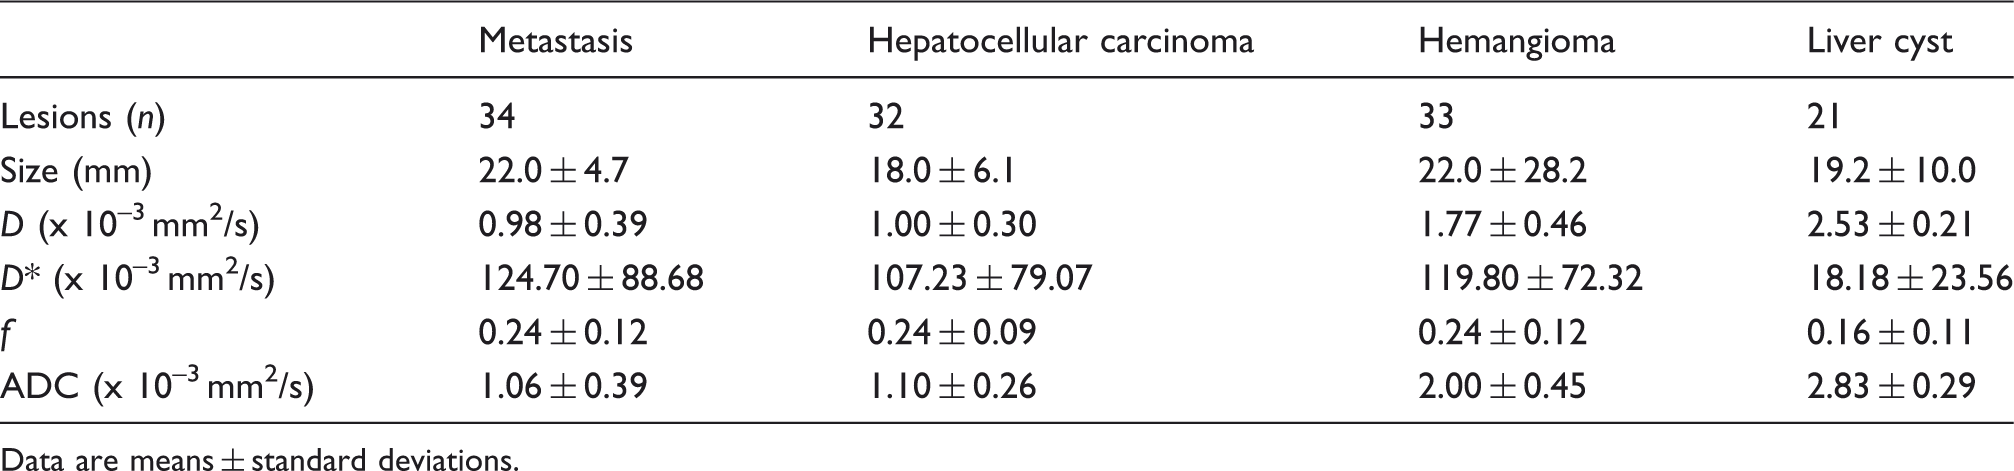
The mean D* value of liver cysts (18.18 ± 23.56 × 10⁻³ mm2/s) was lower than those of other hepatic lesions (P < 0.001), but no significant difference was found between metastases (124.70 ± 88.68 × 10⁻³ mm2/s), HCCs (107.23 ± 79.07 × 10⁻³ mm2/s), and hemangiomas (119.80 ± 72.32 × 10⁻³ mm2/s) (P = 0.77−0.99). The f values of hepatic lesions were not significantly different (P = 0.058−1.00).
Mean ADC values of hemangiomas (2.00 ± 0.45 × 10⁻³ mm2/s) and liver cysts (2.83 ± 0.29 × 10⁻³ mm2/s) were higher than those of hepatic metastases (1.06 ± 0.39 × 10⁻³ mm2/s) and HCCs (1.10 ± 0.26 × 10⁻³ mm2/s) (P < 0.001, all pairwise comparisons), and the mean ADC value of liver cysts was greater than that of hemangiomas (P < 0.001). However, the mean ADC values of metastases and HCCs were not significantly different (P = 0.99).
ROC curves for D, D*, f, and ADC values are illustrated in Fig. 6. In terms of the differentiation of benign and malignant lesions, the area under the ROC curve (AUC) was significantly greater (P = 0.048) for ADC values (0.98) than for D values (0.96) (Table 2). The AUC of ADC values was greater than that of D* or f (P < 0.0001), and AUC of D was greater than that of D* or f (P < 0.0001). No difference was found between the AUCs of D* and f (P = 0.27). Sensitivities and specificities for the detection of a malignant lesion were 89% and 98%, respectively, when an ADC cut-off of 1.40 was applied. In terms of the differentiation of hemangiomas and hepatic metastases, the AUCs of ADC values (0.95) and D (0.92) were comparable (P = 0.22). In addition, the AUC of ADC values was greater than that of D* or f (P < 0.0001), and the AUC of D was greater than that of D* or f (P < 0.0001). No difference was found between the AUCs of D* and f (P = 0.95).
ROC curves for D (solid line), D* (dashed line), f (dotted line), and ADC values (alternate long and short dashed line) of hepatic lesions. (a) Areas under ROC curves were 0.96 for D, 0.64 for D*, 0.57 for f, and 0.98 for ADC for the differentiation of benignity and malignancy. (b) Areas under ROC curves were 0.92 for D, 0.52 for D*, 0.52 for f, and 0.95 for ADC for the differentiation of hemangioma and metastasis. Diagnostic performance of D and ADC for the characterization of focal hepatic lesions.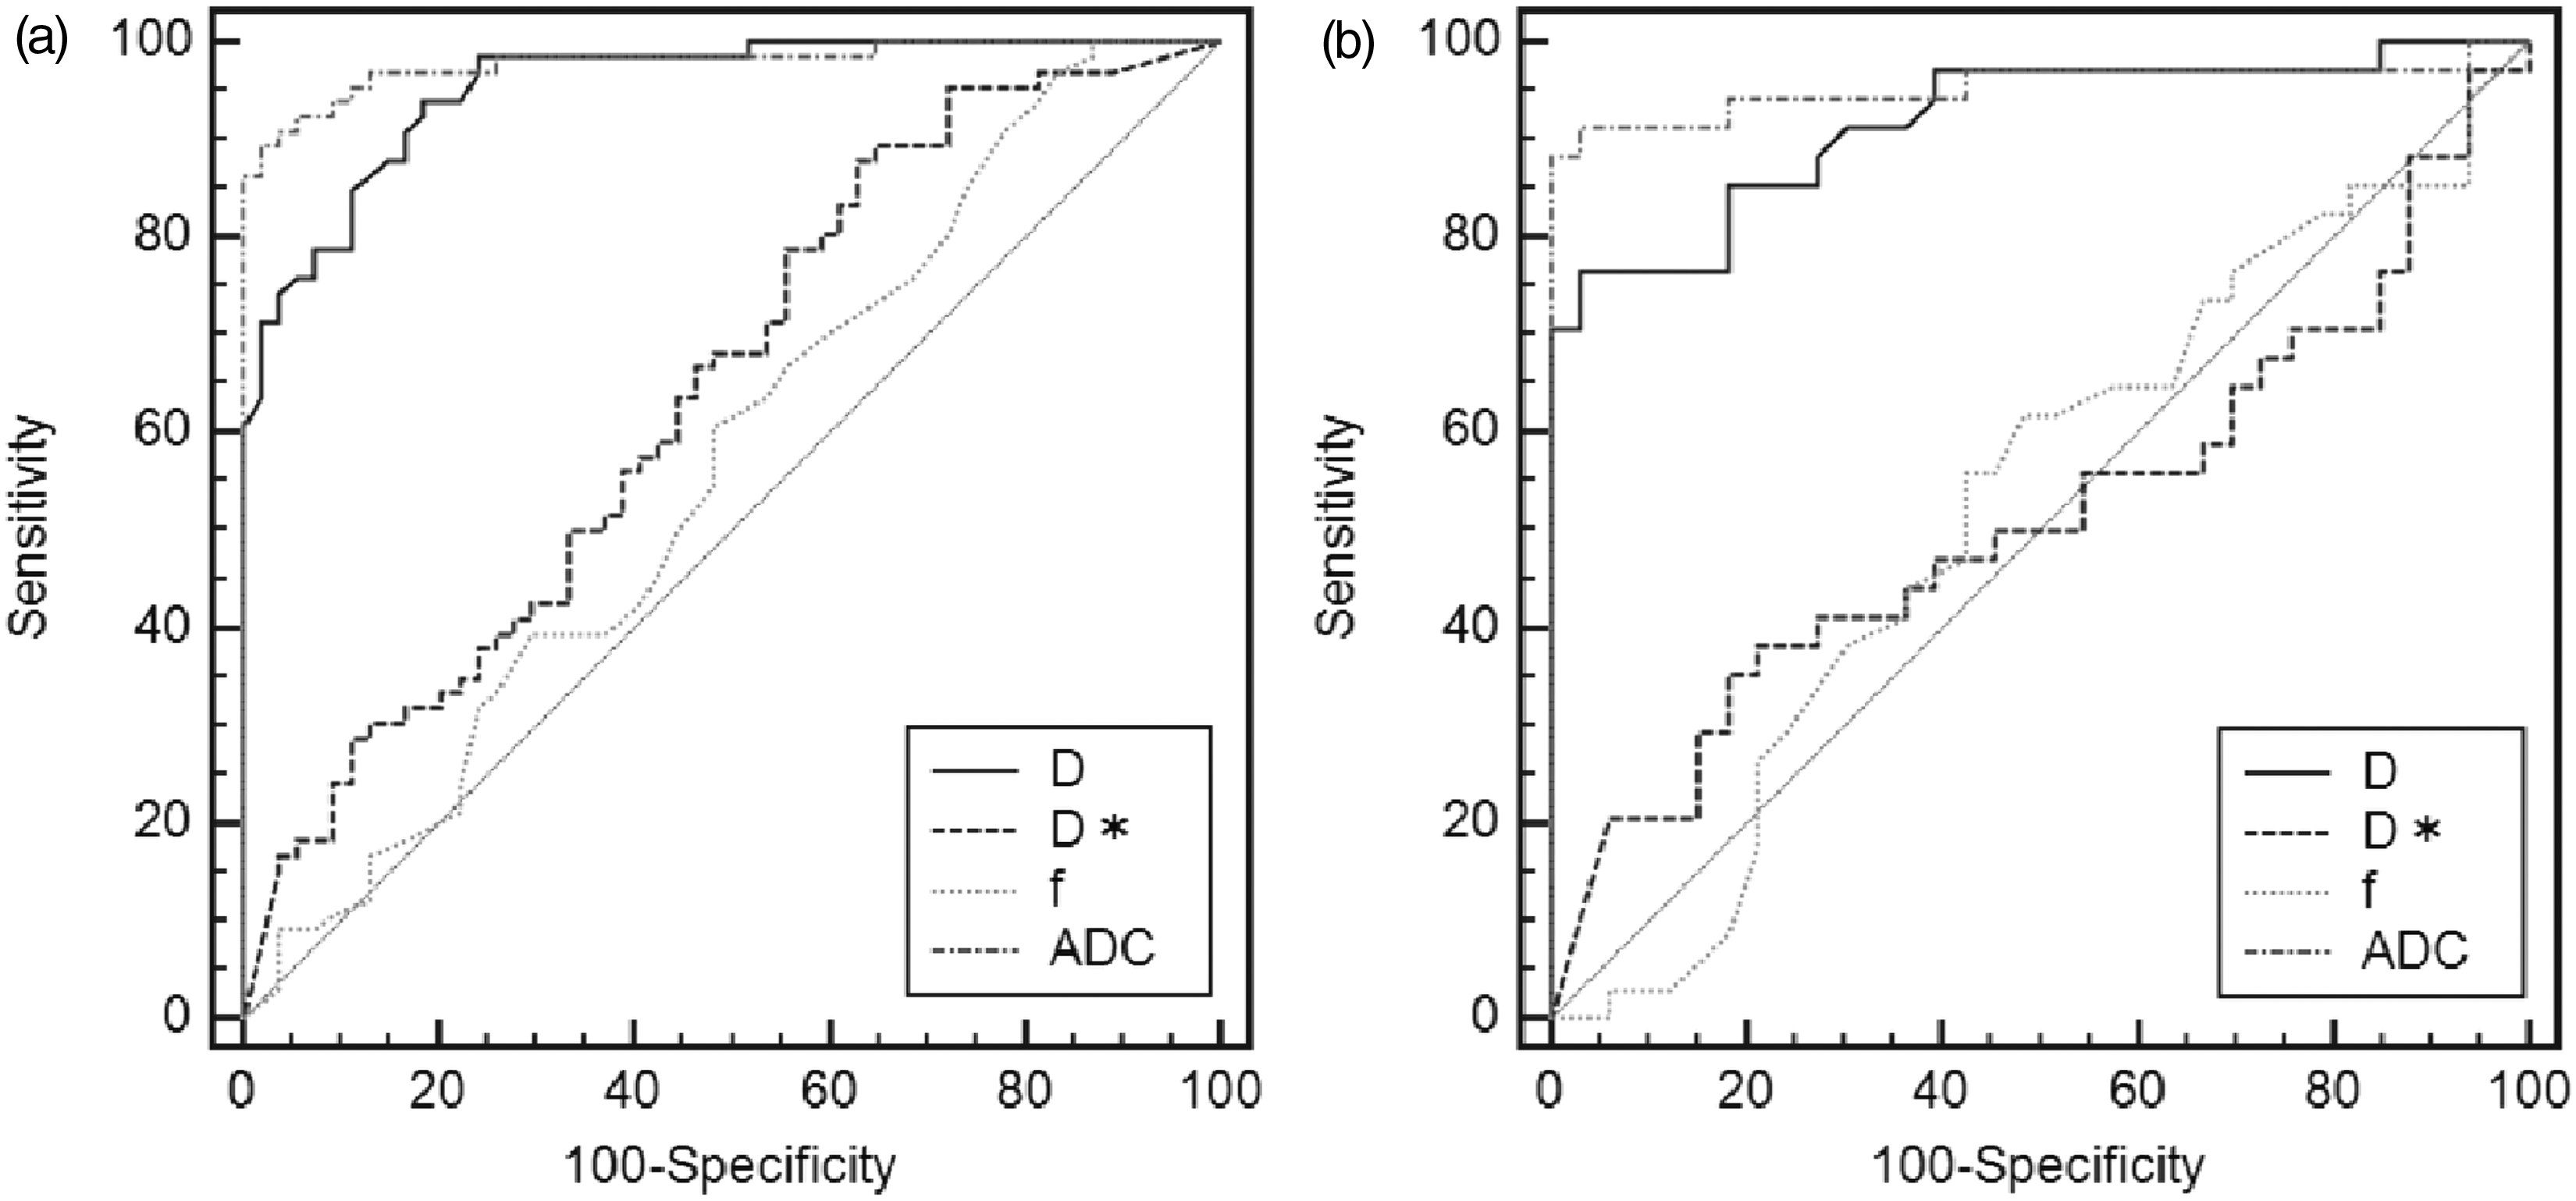

Discussion
Our results show that D and ADC values are helpful for the differentiation of benignity and malignancy on free-breathing IVIM MR images, which suggests that true and apparent molecular diffusions may be more informative for the characterization of hepatic lesions than pseudodiffusion (D*) or perfusion fraction (f). In a previous study, perfusion fractions were found to be correlated with relative blood volumes, and pseudodiffusion coefficients to be correlated with relative blood flows (5). However, the IVIM model represents only one particular description of water diffusion in tissues related to the signal attenuation phenomenon observed at low b values, which is usually ascribed to tissue perfusion (6). As previously discussed, although imaging at low b value is sensitive to tissue vascular perfusion, other secretory physiologic processes in organs (e.g. glandular secretion and ductal or axonal flow) may be difficult or impossible to distinguish from vascular perfusion by DW MRI. The reason why no significant difference in D* and f values was observed between hepatic lesions is unclear, but may be because blood volume, blood flow, or secretion have different effects on perfusion properties in different lesion types.
It is important to remember that the process of image acquisition, image processing, model fitting to acquired data, and analysis of parametric maps need to be sufficiently robust to allow accurate and reproducible measurements that can be interpreted to yield biologically relevant and clinically meaningful results. If applied inappropriately, quantitative indexes obtained using IVIM or other more sophisticated mathematic models may be uncertain, erroneous, or even misleading (7). Yamada (3) reported that the mean ADC value of cysts on breath-hold DW images was not significantly different from the mean D value, and estimated the perfusion fraction of cysts to be 0, meaning that cysts do not have a perfusion fraction. However, in our study, D* and f values of cysts were non-zero, which we attribute to the setting of multiple b values, respiratory motion artifact, and/or misregistration.
Breath-hold single-shot spin-echo echo-planar imaging of the liver can be performed quickly, and thus, reduces the adverse effects of motions, and enables the whole liver to be evaluated in one or two breath-holds of 20–30 s each, depending on liver size and sequence parameters. However, the disadvantages of breath-hold imaging include poorer signal-to-noise ratio (SNR), greater sensitivity to distortion and ghosting artifacts, and lower spatial resolution (with a wider section thickness of approximately 8–10 mm), and it limits the number of b values that can be included in the measurement. Moreover, it has been reported that signal measurements at low b values (e.g. ≤100 s/mm2) are more prone to measurement errors and are highly sensitive to signal-to-noise variations (8,9), and that there is also a large standard variation in the estimation of perfusion fraction (10). In contrast, free-breathing multiple-signal-acquisition single-shot spin-echo echo-planar imaging is highly versatile and can be implemented reasonably well across different vendor MR platforms. The liver is typically evaluated in 3–6 min, and the use of multiple signal acquisitions results in images with improved SNRs. Consequently, thinner image sections ( < 5 mm) can be obtained, and more b values can be accommodated within the longer measurement. High-quality diffusion images of the liver can also be obtained using the free-breathing technique, because cyclical respiration is a coherent motion that does not result in additional liver signal attenuation. Respiratory-triggered DW imaging suffers from a two- to three-fold increased scan time compared with free-breathing DW imaging (11). Furthermore, respiratory triggering potentially suffers from unexpected severe scan time prolongation if respiration becomes irregular or elongated by apnea due to the patient's deep sleep, and also there is a risk of pseudo-anisotropy artifact with use of respiratory triggering, which induces errors in the ADC calculation, especially in non-cirrhotic livers (12). On the other hand, free-breathing DW imaging suffers from image blurring thereby decreasing lesion conspicuity and lesion delineation.
In our study, IVIM MR images were obtained after the administration of gadoxetate disodium. There was mild decrease in T2 signal intensity of the liver after Gd-EOB-DTPA administration but no significant change in lesion contrast-to-noise ratio (13). On the other hand, Gulani et al. (14) showed that postcontrast ADC values of the liver approaches precontrast values 6 min after contrast injection, and Colagrande et al. reported that D, D*, f, and ADC did not show any significant difference before and after contrast agent administration (15). Thus, we believed that gadoxetate disodium-enhanced liver protocol can be shortened by performing T2W images immediately after the late-dynamic phase, followed by DW images without affecting IVIM DW image analysis.
IVIM MRI might have potential value in clinical use. Our result showed that D and ADC were significantly lower in malignant lesions than in benign lesions, which was consistent with recent work by Yoon et al. (16). Moreover, D and ADC correlated with the degree of liver metastasis necrosis following systemic chemotherapy (17), and D may serve as valuable and robust tool in detecting and characterizing liver fibrosis at early stages during the progression of liver fibrosis (18). Thus, IVIM MRI may provide a non-invasive diagnostic option for differentiation of malignant lesions from benign lesions, for assessment of treatment response, and for determination of the severity of liver fibrosis and steatosis.
This study has several limitations. First, no histologic confirmation was available for most metastases and HCCs. Also, three hepatic metastases in two patients were previously treated with systemic chemotherapy, and this could influence D and ADC measurements in our study, as the previous study reported (16). Second, we applied a free-breathing sequence, which may have the disadvantage of image blurring, and subsequent suboptimal quantitative analyses due to the partial volume averaging effect. Furthermore, it has been shown that respiratory-triggered DW MRI improves image quality, SNR, and ADC quantification (19). However, the implementation of respiratory triggering increases the acquisition time (approximately 5–6 min), as images are acquired only in some parts of the respiratory cycle, and the longer acquisition times required increase the chance of patient movement. In addition, although we were not able to differentiate metastases from HCCs efficiently using IVIM imaging parameters, this is supposed to be clinically feasible by interpreting signal intensities on T1W and T2W images and enhancement characteristics on contrast-enhanced images and evaluating clinical data.
In conclusion, D and ADC values obtained using the free-breathing IVIM MRI were found to be potentially more useful parameters for the characterization of focal hepatic lesions than D* or f values, and were found to differentiate benignity and malignancy.
Footnotes
Funding
This work was supported by Japan Society for the Promotion of Science KAKENHI (23591758) and in part by the Grant for Scientific Research Expenses for Health, Labor, and Welfare Programs; Foundation for the Promotion of Cancer Research; and Research on Cancer Prevention and Health Services.