



Abstract
Background
Magnetic resonance angiogram (MRA) of the brain is a widely employed non-invasive test to diagnose aneurysms. However, its overall accuracy is less than digital subtraction angiography and is prone to give false-positive or false-negative results. False-negative results can be seen with hemorrhage, lipoma, dermoid, posterior lobe of the pituitary gland, and the flow artifacts.
Purpose
To describe the findings associated with false aneurysms in the anterior communicating artery on the time of flight MRA and review the physical principles behind this artifact.
Material and Methods
This short series comprises of four patients whose MRA showed suspicious aneurysms in the region of the anterior communicating artery (ACOM) on time of flight MRA.
Results
Two patients underwent catheter angiogram and the other two patients had computed tomography angiogram. None of these cases proved to have aneurysms and normal anterior communicating arteries were seen in all the patients. The findings on the MR angiograms were considered artifacts. All of the pseudoaneurysm had tapered appearance.
Conclusion
MR angiogram can result in artifacts at ACOM which may be mistaken for aneurysm. Such pseudoaneurysms have characteristic appearance and should be followed up with non-invasive tests.
Keywords
Introduction
The anterior communicating artery (ACOM) complex is one of the most common sites for the development of saccular aneurysms. Estimates of frequency of the ACOM aneurysm are in the range of 27–35% (1).
The time of flight (TOF) technique of magnetic resonance angiogram (MRA) depends on the flow-related signal enhancement. The moving protons produce signal while the stationary background tissue is suppressed by repeated radiofrequency pulses. This technique works best when the imaging plane is perpendicular to the flow and the flow within the vessel is laminar in character. In the vessels with turbulent flow or when the flow is parallel to the imaging plane, the protons can get dephased and lose signal (2). The ACOM region has unusual anatomy and flow dynamics. It is well known that direction of the flow in the ACOM varies. Moreover, at times there may be no flow or there may be a dead zone in the ACOM (3). We propose that this peculiar flow dynamic in the ACOM can rarely produce an artifact on the MRA which mimics aneurysm.
Material and Methods
This is a short case series comprising four MRAs where the possibility of ACOM aneurysm was raised on the TOF MRA and a follow-up was requested. This suspicious finding was refuted by follow-up digital subtraction angiography (n = 2) and computed tomography angiography (CTA) (n = 2).
MRA technique
MRA was performed on 1.5 T systems (GE Healthcare, Milwaukee, WI, USA) with an 8-channel head coil using TOF multiple overlapped thin slab acquisition (MOTSA) technique. The following parameters were utilized: repetition time/echo time, 33/6.9 ms; flip angle, 20°; field of view, 20 cm; slice thickness, 1.4 mm; overlap, 1 mm; matrix, 256 × 224; flow compensation, extended dynamic range, and ZIP of 512. Three-dimensional (3D) MIP reconstructions and in select cases volume-rendered images created.
Results
Ancillary findings on MRA and on follow-up studies.
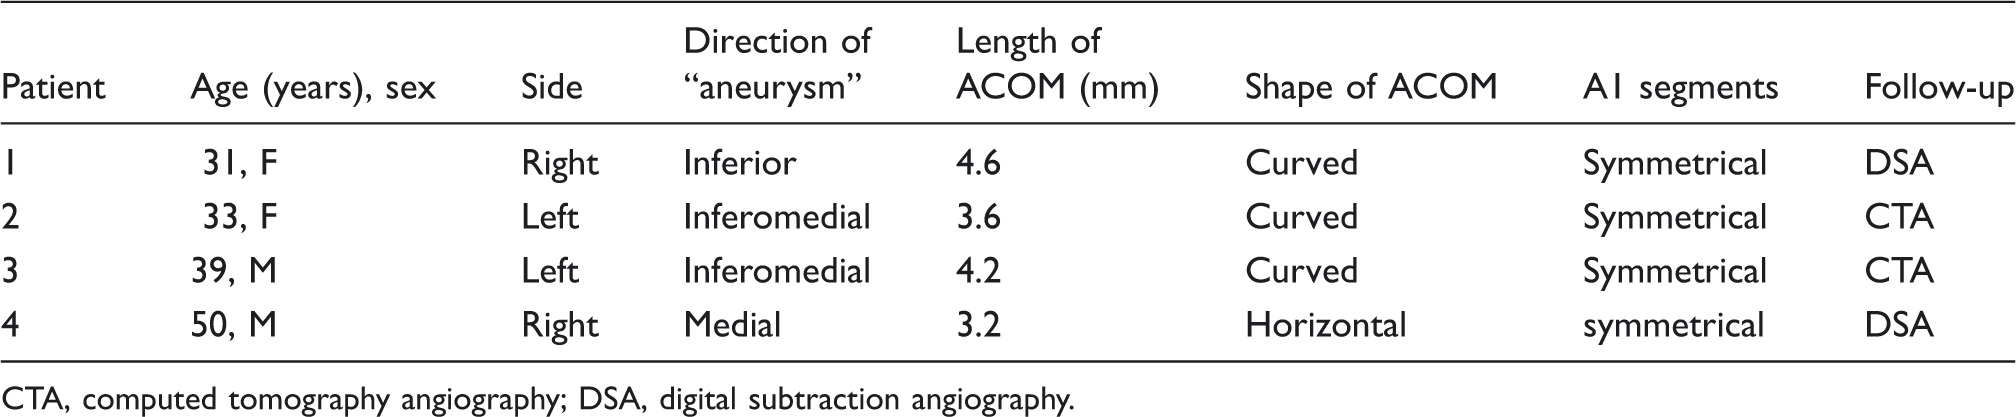
CTA, computed tomography angiography; DSA, digital subtraction angiography.
The pseudoaneurysms in this series have the following characteristics:
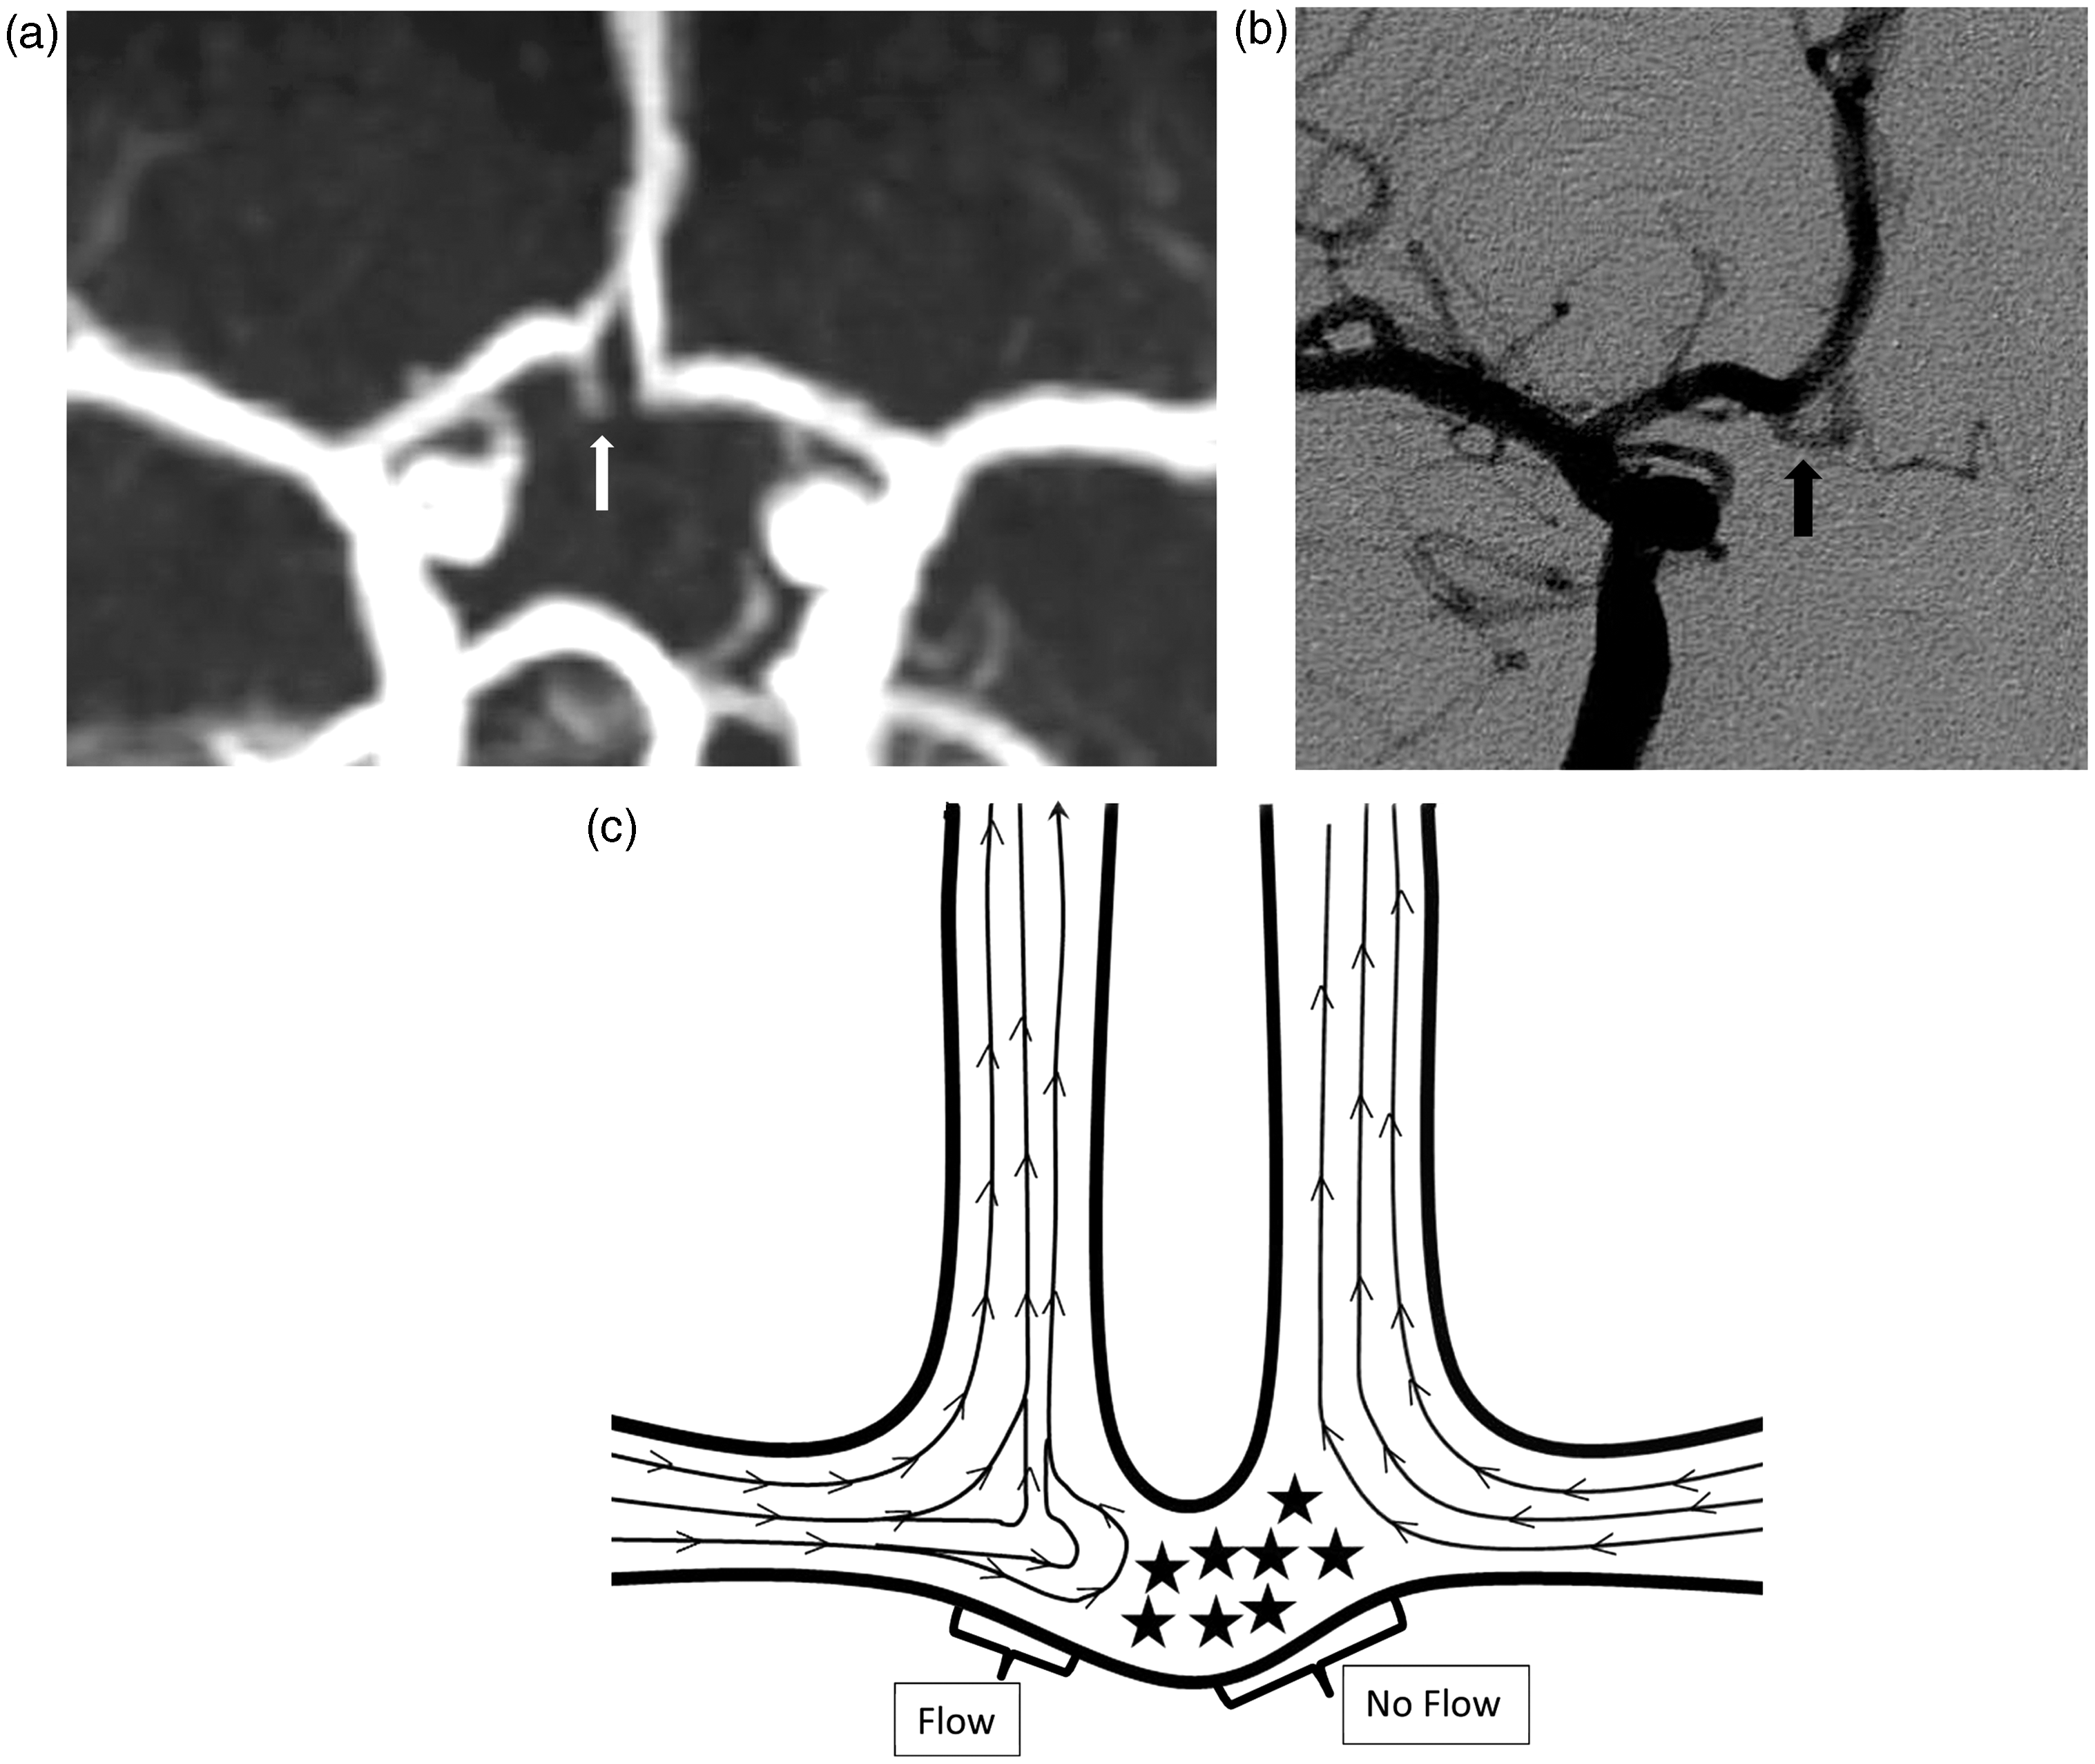
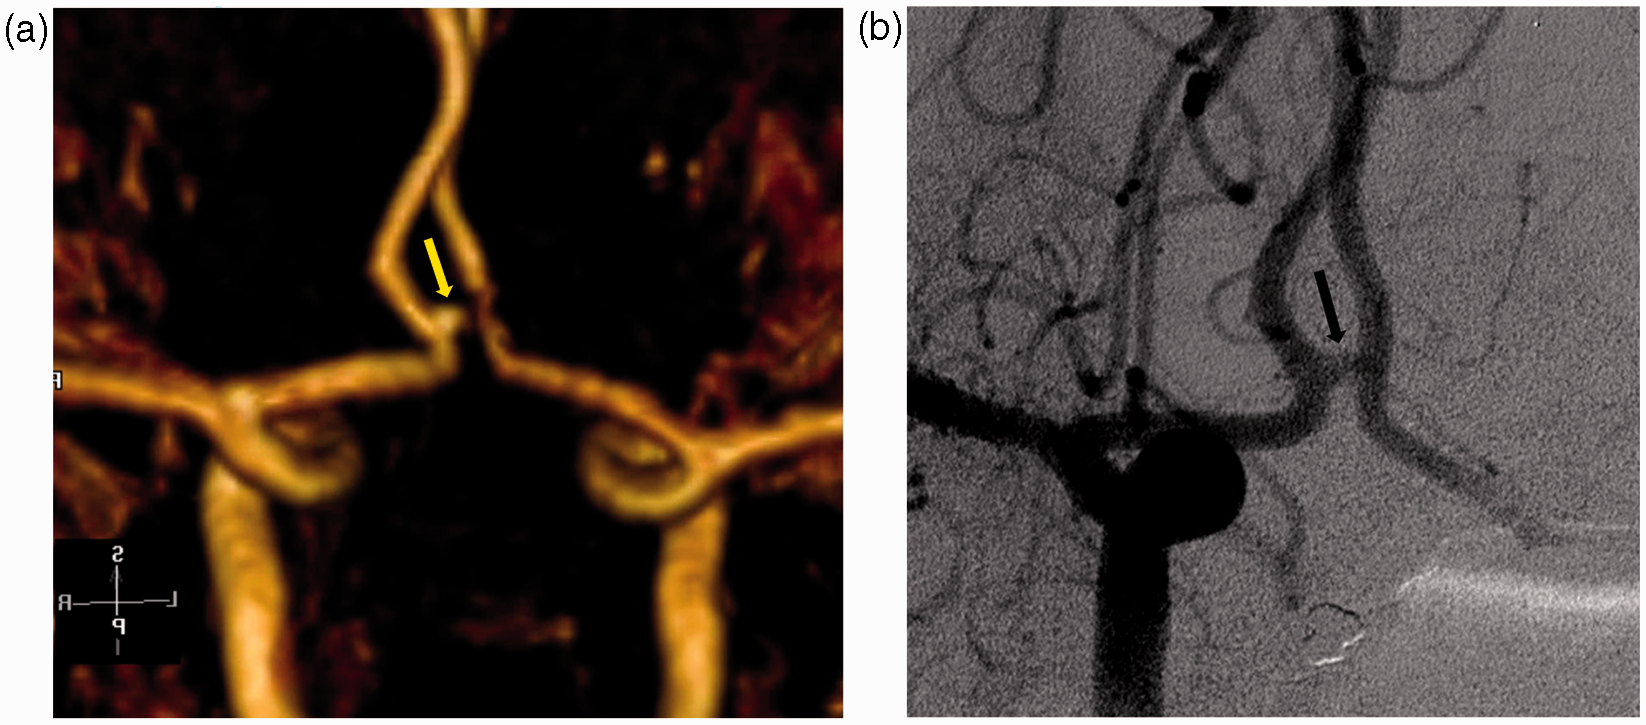
The pseudoaneurysms are never larger in diameter than the adjacent vessels (Fig. 1); The pseudoaneurysms have a tapering body rather than a bulging sac (Fig. 2); The ACOMs are symmetrical; The ACOMS are relatively longer and curved as seen on the follow-up digital subtraction angiography (DSA) and CTA; The pseudoaneurysms point in the direction of the normal ACOM on catheter and CT angiograms. (a) A 39-year-old woman with history of headaches. A MIP image of 3D TOF MRA demonstrates an out pouching from the right A1- ACOM junction suspicious for an aneurysm (arrow). (b) A catheter angiogram shows normal ACOM without evidence of aneurysm (arrow). (c) Schematic diagram showing part of the ACOM with flow (pseudoaneurysm) and dead zone (stars) corresponding to the defect seen in the ACOM (Fig. 1a). (a) A 52-year-old man with history of headaches. The MRA shows a tapering excrescence from the right A1- ACOM junction suspicious for an aneurysm (arrow). (b) Injection into right carotid on the conventional angiogram shows anatomically normal ACOM (arrow).
Discussion
Although, DSA remains the gold standard for diagnosis of aneurysm; it rarely can have serious side-effects (4) and hence the screening for aneurysm is done with MRA or CTA.
The MRA of the brain is usually performed by non-contrast 3D TOF MOTSA (Multiple Overlapping Thin Slab Acquisition) technique using two or three axial slabs to cover an area from skull base through 4–5 cm above the sella. In one large study, MRA had an accuracy of 90%, sensitivity of 87%, specificity of 95%, positive predictive value of 97%, and negative predictive value of 77% in the diagnosis of aneurysms (5).
Sensitivity of MRA in the detection of intracranial aneurysms is improved when the source images are combined with MIPS (6). MIP and 3D volume rendering provide better contrast between the flow enhancement and low intensity surrounding tissue. However, there may be loss of visualization of part of vessels on MIPS with suppression of lesser signal pixels from slow flow and turbulence; hence source images must always be reviewed (7). In our cases, however, even on the source images of the MRA, the anterior communicating arteries were not visualized in entirety.
To understand the mechanism of flow artifact on TOF MRA, a brief discussion on the physics of flow is described. For any flow to occur there must be a pressure difference between the two sides of the tube. The rate of flow is directly proportional to difference in pressure. In other words, the greater the pressure difference, greater will be the flow.
The flow in a tube is of two different types: laminar and turbulent. There are a number of different physical characteristics, which determine whether the fluid will obey the principles of one or the other.
In the laminar flow, the molecules of the fluid move in layers, which have varying velocities. As the fluid flows through the tube, there is a resistance between the fluid and the vessel wall. The resistance is greatest at the vessel wall and least in the center of the tube. Laminar flow is suitable for producing signal on MRA.
On the contrary, under certain physical conditions, molecules in the flow become disorganized and begin to swirl with the formation of Eddy currents. When flow is disorderly, the eddy currents bump into each other increasing resistance and cause drag on the flow leading to loss of signal on the TOF MRA. Turbulent flow occurs at high velocity, in large diameter tubes, or when the fluid is relatively dense with low viscosity. For a given fluid in a tube, once a critical velocity is reached, the flow becomes turbulent. The relevance of this physical principle within the body is that whenever a vessel divides, or there is a sharp bend or narrowing, the velocity of the fluid distal to stenosis increases creating turbulent flow with resultant loss of signal on the MRA. For example, the blood flow in the carotid artery becomes turbulent as it flows past an atheromatous plaque resulting in signal loss. Thus, in a vessel with turbulent stream, MRA can produce artifacts, which in most cases result in loss of signal leading to pseudo stenosis and false-negative results for aneurysms.
On the other hand, false-positive aneurysms occur either due to non-flow or flow-related artifacts. False-positive non-flow-related artifacts happen due to presence of substance or structure which is inherently bright on T1, like subacute blood, fat, and certain types of calcifications. These are not suppressed on the TOF MRA and may be mistaken for aneurysm (8). Such suspicious structure should be traced to see its contiguity with arteries to differentiate it from true aneurysm. Lipoma can also be discriminated based on the fact that it has an unbroken rim of out-of-phase India ink artifact on the source images due to chemical shift effect at fat-water interphase at TE of 6.9 ms (8).
The anatomy of the anterior cerebral artery–anterior communicating artery complex is extremely variable due to the redundancy of vessel loops, duplication of branches, and early bifurcation of the A2 segment (9). This anatomical variability also leads to severe hemodynamic stress. Anatomic variants of the circle of Willis such as A1 dominance, which supply both A2 segments, are a strong risk factor for ACOM aneurysm (10).
The length of ACOM is usually between 2 and 3 mm, varying from 0.3 to 7.0 mm (average, 2.6 mm). The longer ACOMs are curved, kinked, or tortuous. The ACOMS can measure up to 3.4 mm in diameter. There is a positive correlation between the diameter of the anterior communicating artery and the degree of asymmetry of the A1 segments. This compensates for hypoplasia of the smaller A1 vessel (9). Asymmetric A1 segment has an important impact on the likelihood of aneurysm formation of the anterior communicating artery. The end-on hemodynamic impact of pulsatile flow in the larger A1 segment directed against anterior inferior wall of the anterior communicating artery is thought to explain the higher rate of aneurysm formation. Up to 80% of the ACOM aneurysms have significant A1 asymmetry. This hemodynamic force also explains why approximately 70% of such aneurysms project inferiorly (11).
The anterior communicating artery has a unique flow dynamics. In an experiment on replica of human anterior communicating arteries, it has been shown that there is very little flow across the ACOM when the flow is symmetrical on both sides. Unequal flow in the carotid arteries is necessary for the flow to enter anterior communicating artery. Thus ACOM is not visualized on MR angiography when the flow is symmetric (12). In another investigation using glass model of anterior cerebral arteries, flow patterns and flow induced shear stress were studied. It is shown that when there is asymmetric flow in the anterior cerebral arteries, there is generation of complex vortices and flow separation at the entrance of the A1 branch. However, when there is symmetric flow in the A2, there is a dead zone in the ACOM (3).
Thus complex or stagnant flow pattern within the ACOM can either produce partial signal resembling aneurysm (Fig. 1c) or non-visualization. In patients with hypoplastic A1 segments, pseudoaneurysms have been reported (13). However in our patients, A1 segments were symmetric and of normal size; the ACOMs were patent and single, and the A2 segments of ACA were also symmetric. Ours is the first case series describing the spurious aneurysm with symmetric A1 segments. All the cases in our series had relatively long ACOM and this too could have been a factor in production of the artifact as it increases chances of complex flow pattern.
Two of our first four patients underwent conventional angiography. Learning from this experience, the last two of our patients underwent CTA instead of catheter angiography and helped rule out aneurysm. CTA does not suffer from flow-related artifacts unlike MRA (5).
There are a few limitations in our study. Although not attempted in our patients, a repeat MRA with lower TE or use of 3 T magnet may theoretically overcome this artifact as lower TE gives less time for dephasing thus reduce signal loss (8,14). We are also unable to give the incidence of this artifact because these were isolated examples reported from three different MRI centers.
In conclusion, we have presented a short series of four cases with flow-related artifacts in ACOM appearing like aneurysms which we believe occur due to complex flow in the ACOM with symmetric A1 segments. These pseudoaneurysms tend to taper along the path of ACOM rather than form a bulging sac. Such suspicious lesions should be followed up with non-invasive investigation like CTA rather than catheter angiogram.
Footnotes
Funding
This research received no specific grant from any funding agency in the public, commercial, or not-for-profit sectors.