



Abstract
Background
Imaging is vital in diagnosis of complicated pyelonephritis and has been traditionally performed by computed tomography (CT). However, CT with contrast agents cannot be performed in patients with renal failure. Diffusion-weighted (DW) magnetic resonance imaging (MRI) has the potential to overcome this disadvantage.
Purpose
To prospectively evaluate the accuracy of quantitative apparent diffusion coefficient (ADC) values to differentiate nephritis from renal abscesses in patients with pyelonephritis.
Material and Methods
Forty-two patients with clinical and laboratory diagnosis of pyelonephritis underwent CT and DW MRI examinations. Diffusion images were obtained by using a non-breath-hold, single-shot echo-planar sequence with b values of 0, 600, and 1000 s/mm2. Circular regions of interest were places on areas of nephritis, normal renal parenchyma, and renal abscesses as localized by CT and DW MRI images to obtain the ADC values of each of these regions. The ADC values of these three different tissue types were statistically compared using the one-way analysis of variance test for statistical significance. A P value <0.05 was considered to be statistically significant.
Results
For the diagnosis of pyelonephritis, DW MRI had a higher sensitivity of 95.3% as compared to that of non-contrast CT (66.7%) and contrast-enhanced CT (88.1%). Areas of nephritis had significantly lower ADC values (P < 0.001) than the normal renal cortical parenchyma. Also, renal abscesses had significantly lower ADC values (P < 0.001) than areas of nephritis. However, CT is more useful for the diagnosis of renal calculi and emphysematous pyelonephritis.
Conclusion
ADC values derived from the diffusion sequence have significantly lower values in renal abscesses than in areas of nephritis.
Introduction
Acute pyelonephritis is a serious condition affecting predominantly young adult women (1). Diagnosis is mainly based on clinical and laboratory parameters with imaging reserved for unresponsive or high-risk patients (2). When indicated, computed tomography (CT) is the imaging modality of choice and helps in accurately delineating both intra- and extrarenal disease. However, non-contrast CT may be normal and contrast-enhanced scans are often required (2). Administration of iodinated contrast agents is associated with adverse reactions and is limited to patients with normal renal function (3,4). Diffusion-weighted magnetic resonance imaging (DW MRI) has the potential to overcome these drawbacks of contrast media administration in patients with renal dysfunction (4). Utility of DW MRI has been reported in single case reports and short case series (4–6). A good agreement in between DW-MRI and gadolinium-enhanced MRI for the diagnosis of acute pyelonephritis has been shown in two retrospective analyses (7,8). In another retrospective study, significant difference was demonstrated between apparent diffusion coefficient (ADC) values of healthy renal parenchyma and acute pyelonephritis foci as well as between acute pyelonephritis foci and abscesses (9). The aim of this study was to describe results of the first prospective study to evaluate accuracy of quantitative ADC values to differentiate nephritis from renal abscesses in patients with acute pyelonephritis using contrast-enhanced CT as the gold standard.
Material and Methods
Study population
The study was conducted after obtaining approval from the Institutional Ethics Committee. Patients presenting with clinical diagnosis of acute pyelonephritis (temperature >100° Fahrenheit, chills, flank pain, and renal angle tenderness), positive urine microscopic examination (>10 leucocytes per high power field), and unresponsive to 72 h of antibiotics were invited to participate in the study. Patients with deranged serum creatinine levels (>1.5 mg/dl) were excluded from the study (n = 8). Patients were scheduled for CT and MRI study on the same day after obtaining a written informed consent. Forty-two patients (14 men, 28 women; median age, 45 years; age range, 20–80 years) participated in the study.
CT imaging
CT scan was conducted on a 40-row CT scanner (Brilliance-40, Philips, Eindhoven, The Netherlands). Both non-contrast CT (NCCT) and contrast-enhanced CT (CECT) were performed in all patients. NCCT was followed by CECT performed by injecting 80 mL of a non-ionic contrast agent at 2.5 mL/s through a pressure injector followed by 20 mL saline chase. Corticomedullary phase was acquired at 18–25 s, nephrogenic phase at 60–90 s, and urographic phase at 8–10 min after initiation of contrast agent injection. Scan parameters were as follows: field of view (FOV), 35 cm; matrix, 514 × 514; pitch, 0.82; rotation time, 0.7 s; tube voltage, 120 kV; and tube current time product, 220 mAs. Images were reconstructed at 3 mm slice thickness.
MRI
MRI examination was performed on a 1.5 Tesla MRI scanner (Achieva, Philips, Eindhoven, The Netherlands) using an eight phase array body coil. T1-weighted (T1W) axial and coronal sections were obtained using a navigator triggered non-fat-suppressed gradient echo technique with the following parameters: slice thickness, 5.0 mm; interslice gap, 1.0 mm; voxel size, 1.4 × 1.4 × 5.0 mm; FOV, 400 × 400 mm; matrix, 252 × 186; flip angle, 15; repetition time ms/echo time ms, 10/4.6. Single-shot T2-weighted (T2W) axial and coronal sections were also obtained using a navigator triggered fat-suppressed technique with following scan parameters: slice thickness, 5.0 mm; interslice gap, 1.0 mm; voxel size, 1.0 × 1.0 × 5.0 mm; FOV, 400 × 400 mm; matrix, 236 × 208; flip angle, 90; repetition time ms/echo time ms, 434/80. DW images were then obtained in the axial plane using navigator triggered single-shot echo-planar imaging during free breathing with following diffusion gradient b values: 0, 600, and 1000 s/mm2. The following scan parameters were used: slice thickness, 5.0 mm; interslice gap, 1.0 mm; voxel size, 1.4 × 1.4 × 5.0 mm; FOV, 380 × 380 mm; matrix, 124 × 124; flip angle, 90; repetition time ms/echo time ms, 2572/60. ADC maps were calculated automatically by the MR scanner.
Image analysis
Image analysis was performed on a Linux work station. Image interpretation was performed in consensus by two experienced radiologists. Areas of abscess formation were identified on contrast-enhanced CT images. On axial ADC maps, circular regions of interest (ROIs) were placed on areas of nephritis, as identified on DW MRI, abscesses, as identified on CECT, and also on normal renal cortical parenchyma. ADC values of normal renal parenchyma were not calculated in patients who showed generalized restriction of diffusion in both kidneys (n = 2). Single ADC values were calculated using the following monoexponential fit model equation: Si = So × e− bi × ADC where Si is the signal intensity measured on ith b-value image and bi is the corresponding b value. So represents signal intensity for b = 0 s/mm2.
Statistical analysis
Sensitivities of NCCT, CECT, and DW MRI in the detection of pyelonephritis were calculated. The ADC values of pyelonephritic areas, renal abscesses, and normal cortical parenchyma were reported as mean +/− standard deviation. Statistical analysis was performed by using the one-way analysis of variance (ANOVA) test for comparing ADC values of these three different tissue types. A P value <0.05 was considered to be statistically significant.
Results
Out of the 42 patients who participated in the study, NCCT was able to detect morphologic changes in 28 patients thus providing a sensitivity of 66.7% for the detection of pyelonephritis. Out of the 14 patients not diagnosed by NCCT, CECT was able to detect changes of pyelonephritis in nine patients. Thus, addition of CECT increased the sensitivity of CT scan for detection of acute pyelonephritis from 66.7% to 88.1%. In addition to this, CECT was capable of detecting renal abscess formation in five patients.
On MRI most of the lesions showed focal or diffuse areas of low intensity on T1W and high intensity on T2W images. Alterations in signal intensity on T1W images were seen in 22 patients (52.4%) and on T2W images were seen in 27 patients (64.3%). As against this, DW MRI demonstrated areas of restricted diffusion in 40 patients, thus providing a high sensitivity of 95.3% (Fig. 1).
A 34-year-old woman with pyelonephritis. (a) CECT image shows normal homogenous enhancement of the kidneys in the nephrographic phase. (b) Axial ADC map in the same patient shows an area of restricted diffusion (arrow) in the left kidney.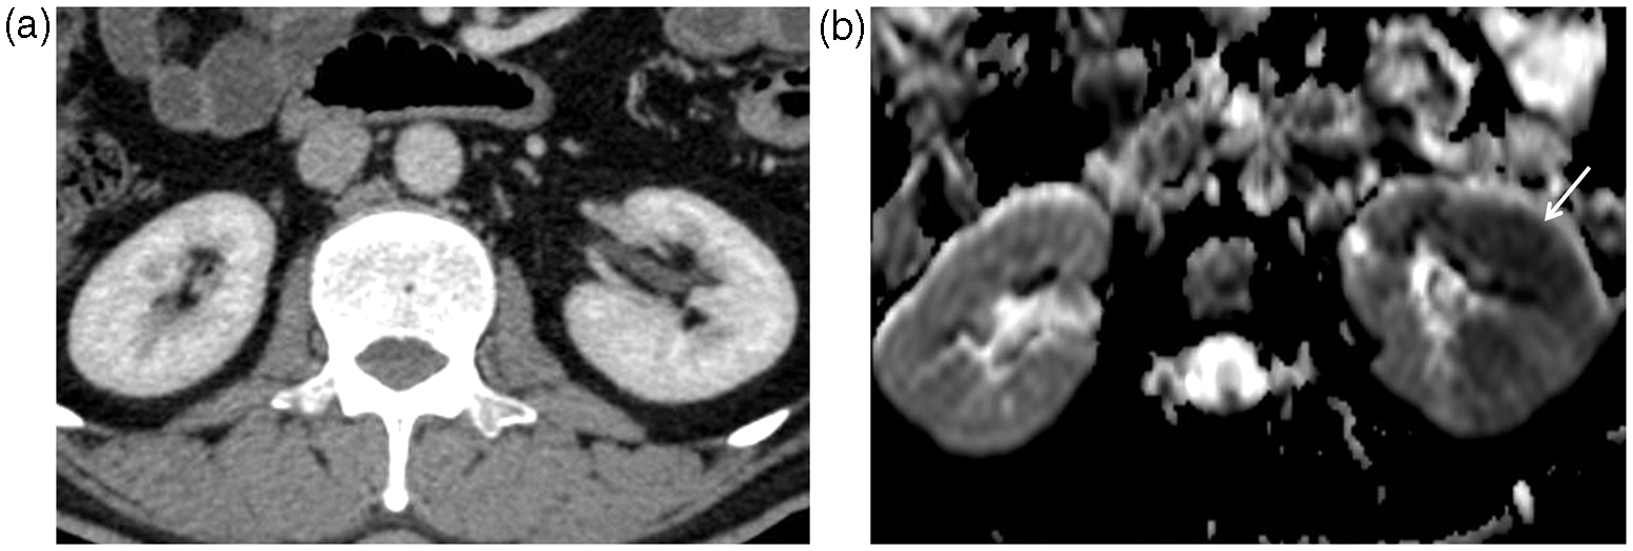
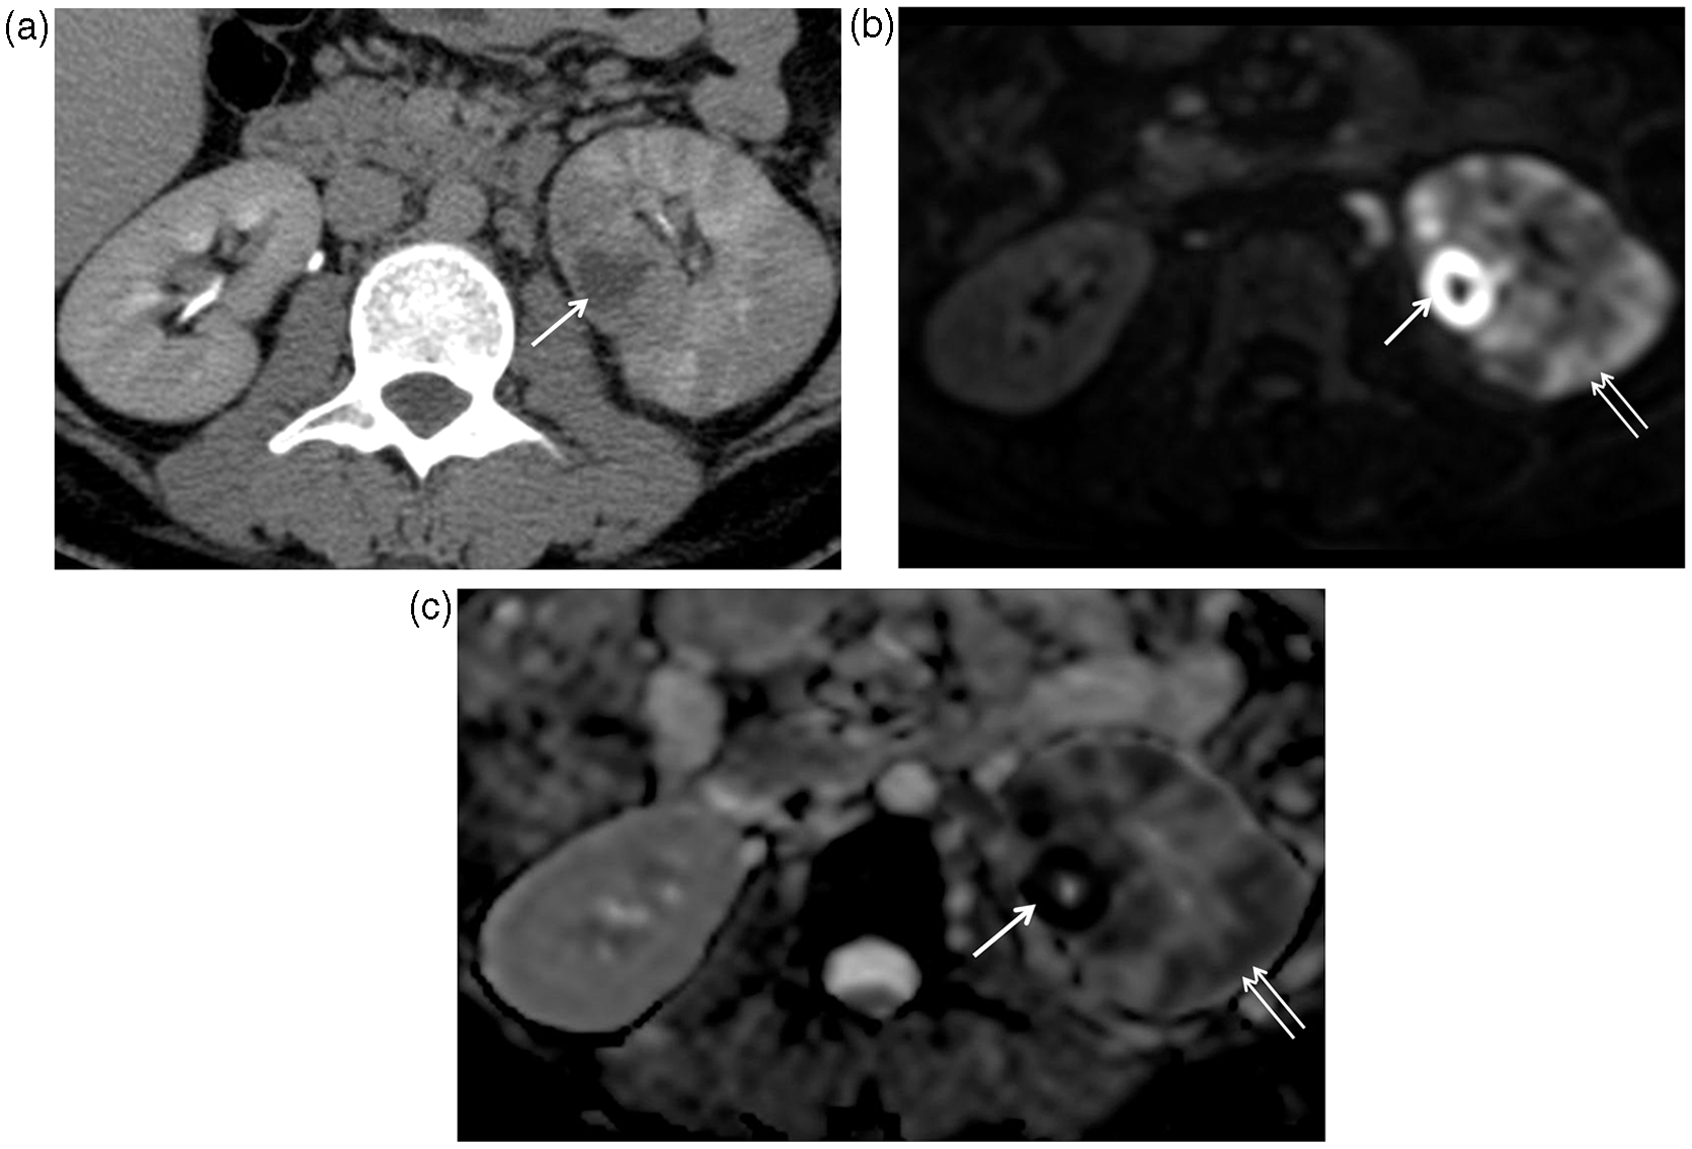
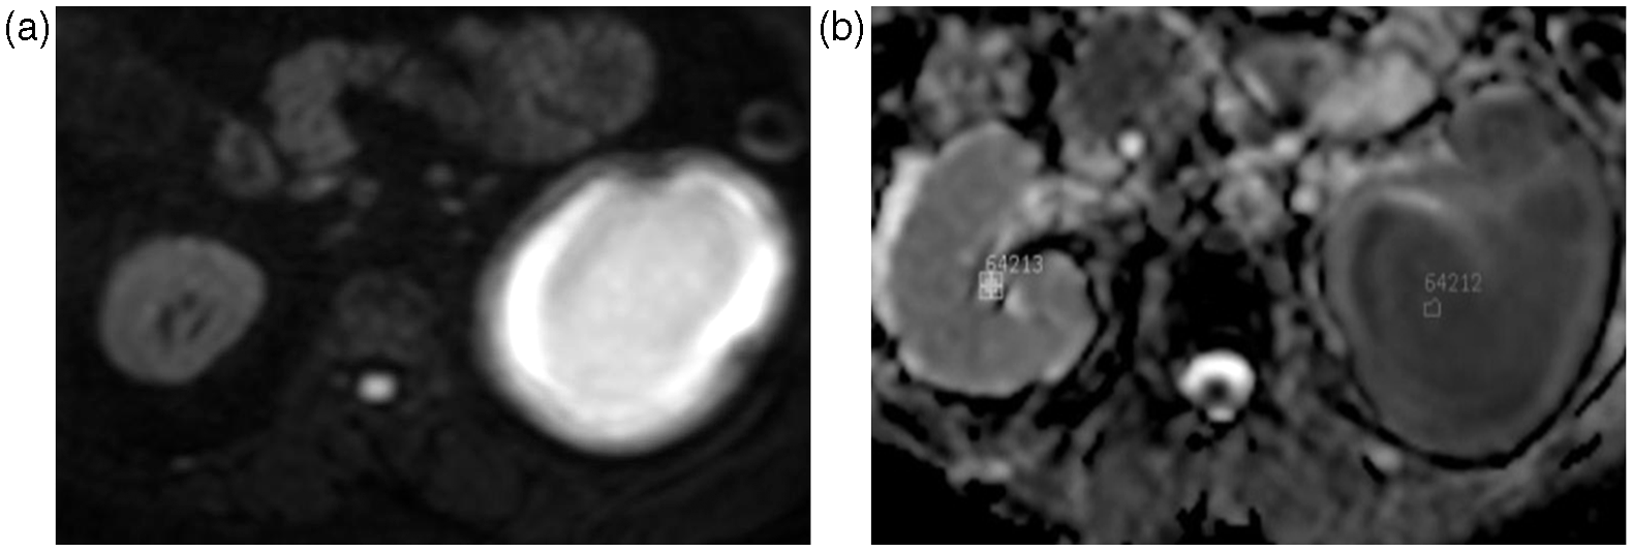
The normal renal cortical parenchyma showed ADC values of (2.10 +/− 0.4) × 10−3 mm2/s. As against this, the areas of nephritis had ADC values of (1.30 +/− 0.13) × 10−3 mm2/s (Fig. 2). Four patients with presence of emphysematous pyelonephritis were not included in calculating ADC values so as to avoid any potential distortion of the ADC values caused by presence of air. Five patients were identified to have developed renal abscesses on CECT. On DW MRI, these abscesses showed a more hyperintense signal as compared to rest of the renal parenchyma involved by nephritis (Fig. 3).The size of the renal abscesses were in the range of 14–30 mL with a mean size of 21 mL. ADC values of these renal abscesses were (0.77 +/− 0.08) × 10−3 mm2/s. Each one of these five patients was later confirmed as having renal abscess by US-guided aspiration of pus from the abscess cavity. Restriction of diffusion was observed in the dilated pelvicalyceal system of one of the patients with corresponding dark signal on ADC maps (Fig. 4). A diagnosis of pyonephrosis was suggested and later on confirmed by aspiration of pus.
A 40-year-old woman with pyelonephritis. (a) Axial DW image shows an increase in signal intensity of the right kidney (arrow). (b) Axial ADC map calculated from the DW images shows the right kidney to be hypointense (arrow) suggestive of restricted diffusion. A 48-year-old man with pyelonephritis and renal abscess. (a) Axial CECT image showing left renal abscess(arrow). (b) Axial DW image shows the abscess as a markedly hyperintense focal lesion(arrow) in the left kidney with a relatively less hyperintense signal in rest of the left kidney (nephritis) (double arrow). The uninvolved right kidney appears relatively hypointense. (c) Axial ADC maps calculated from the DW images shows marked hypointensity in the renal abscess (arrow) with a lesser hypointense signal in the areas of nephritis in the rest of the left kidney (double arrow). The uninvolved right kidney appears relatively hyperintense. A 32-year-old man with pyonephrosis. DW image (a) and corresponding ADC map (b) demonstrating restricted diffusion in the left pelvicalyceal system.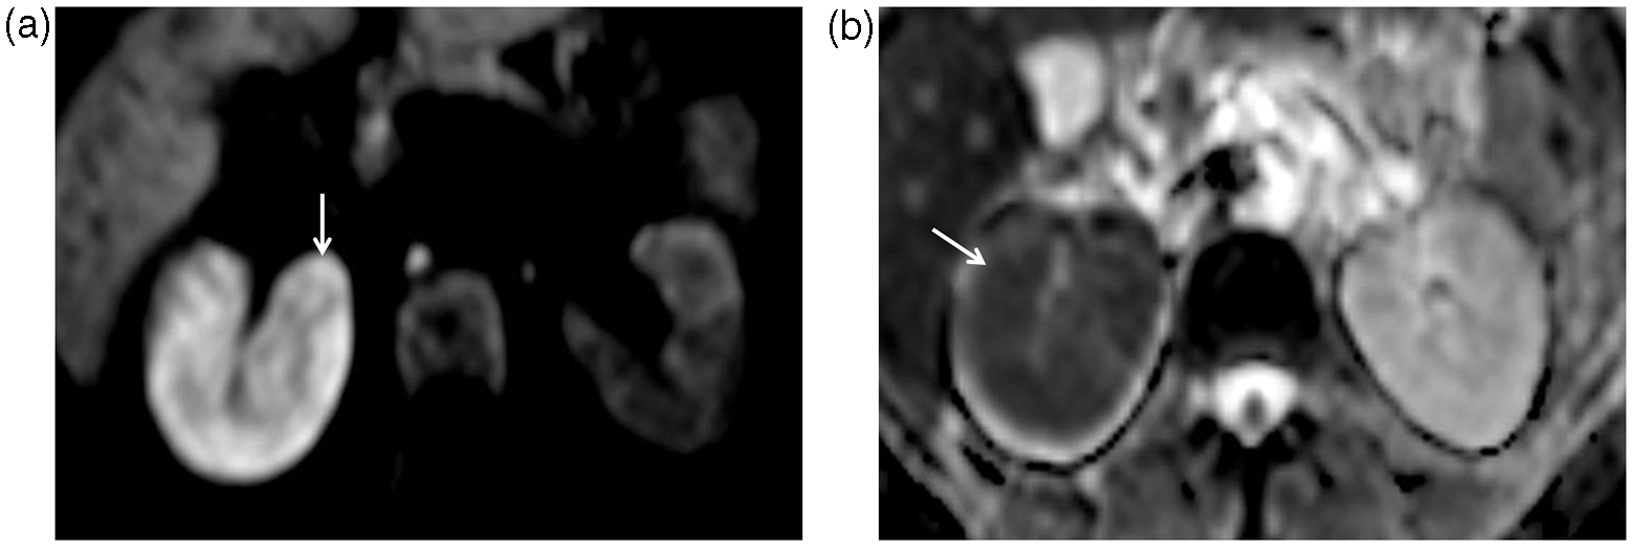
On statistical analysis using the one-way ANOVA test, the areas of nephritis showed significantly low ADC values compared to that of the uninvolved renal cortical parenchyma (P value <0.001). Also, renal abscesses showed significantly low ADC values as compared to areas of nephritis (P value <0.001).
Discussion
The diffusion sequence is an important part of MRI of the brain (10). It has recently gained increasing importance in evaluation of extra-cranial organs (11). Thoeny et al. studied DW MRI in healthy volunteers and were able to obtain reproducible measurements of ADC values of the kidneys. A significant difference was seen in ADC values of the renal cortex and renal medulla. Different studies have reported different ADC values for the kidneys. These differences are probably due to choice of different b values in various studies (4).
In our study, DW MRI provided a high sensitivity of 95.3% in the detection of pyelonephritis. This is similar to a sensitivity of 95.2% and 100% reported in two different retrospective studies (7,8). In a study that compared the accuracy of different diagnostic modalities in the diagnosis of pyelonephritis in a pig model, sensitivity of CT was reported to be 86.8% and that of MRI to be 89.5% (12). In our study, the sensitivity of CT for detection of pyelonephritis was 88.1%, which is in concordance with this study.
We found a significant difference in ADC values of nephritic and normal renal parenchyma. The areas of nephritis demonstrated restricted diffusion with lower ADC values. The ADC values of normal renal cortical parenchyma were (2.10 +/− 0.4) × 10−3 mm2/s and those of nephritic areas were (1.30 +/− 0.13) × 10−3 mm2/s. Similarly, a significant difference in the ADC values of healthy and nephritic renal parenchyma was demonstrated in a retrospective study with ADC values of (2.16 +/− 0.24) × 10−3 mm2/s in healthy renal parenchyma and (1.46 +/− 0.27) × 10−3 mm2/s in pyelonephritis foci (9). Hence, our prospective study further strengthens the observations made in the latter retrospective study. Verswijvel et al. reported findings of DW MRI in three patients of pyelonephritis. They reported ADC values of 1.63 and 1.9 (× 10−3 mm2/s) in the normal contralateral kidney and 1.1 +/− 0.3 × 10⁻³ mm2/s in areas of restricted diffusion in the affected kidneys (6). Substantial differences in the ADC values of both the renal cortex and medulla were also reported in a patient of pyelonephritis in another study (5).
A significant difference was also seen in ADC values of nephritis [(1.30 +/− 0.13) × 10−3 mm2/s] and renal abscesses [(0.77 +/− 0.08) × 10−3 mm2/s] in our study, abscesses having a lower ADC values. These findings are in agreement with the retrospective study performed by Faletti et al., which demonstrated ADC values of (1.46 +/− 0.27) × 10−3 mm2/s in nephritic foci and (1.13 +/− 0.4) × 10−3 mm2/s in abscesses with a significant difference between the two (9). A substantial low ADC value of 0.83 × 10⁻³ mm2/s was also reported in a renal abscess by Verswijvel et al. (6). This is in concordance with previously reported DW MRI findings in brain abscesses in vivo as well as in aspirated abscess fluid in vitro (13–15). It is hypothesized that the high viscosity and cellularity of pus restricts the movement of water protons (15).
There are important implications of this study. DW MRI may be used to confirm the clinical suspicion of acute pyelonephritis. Also, it has the potential to be used to detect renal abscess formation in patients already diagnosed with pyelonephritis. This, we feel, is a huge advantage of DW MRI as it may be capable of diagnosing renal abscesses without the need to administer iodinated contrast agents or gadolinium. It is vital to detect formation of renal abscesses in patients with pyelonephritis as a change in the medical management or even surgical drainage may be required (16). Thus, DW MRI could potentially benefit patients of acute pyelonephritis with co-existent renal failure, in whom contrast administration should be particularly avoided. However, MRI is not without limitations. CT is more beneficial than MRI in the diagnosis of stones and emphysematous pyelonephritis and can easily differentiate between the two. Hence, DW MRI cannot replace CT in all clinical situations and the imaging modality should be decided based upon the clinical question at hand.
We would like to point out several limitations of our study. First, diagnosis of pyelonephritis was not confirmed by histopathology. Hence, the specificity of DW MRI for the diagnosis of pyelonephritis was not determined. In fact, several studies have reported decreased renal ADC values in pathological conditions other than pyelonephritis such as renal tumors, renal artery stenosis, and renal failure (5,17,18). Hence, DW MRI cannot be used to differentiate among these conditions. Second, patients with renal failure (serum creatinine >1.5 mg/dl) were not included in this study. This was done to avoid any potential changes in ADC values caused by renal failure to interfere from changes caused due to pyelonephritis and renal abscesses. However, this is the very group of patients that is poised to benefit from the clinical application of DW MRI to detect abscess formation in patients with pyelonephritis. Further studies are needed in patients with pyelonephritis and co-existent renal failure, to determine the ability of DW MRI to differentiate abscesses from pyelonephritis in this subgroup of patients. Also, studies are required to determine sensitivity and specificity of ADC values for detection of renal abscesses.
In conclusion, DW MRI has a higher sensitivity that CECT for detection of acute pyelonephritis. However, CT is better for detection of calculi and emphysematous pyelonephritis. Also, the ADC values of renal abscesses are significantly lower than that of areas of pyelonephritis. Hence, DW MRI could be potentially used to detect abscess formation in patients with pyelonephritis, especially if contrast administration is to be avoided due to renal dysfunction. Further prospective studies in larger number of patients would be useful to consolidate these observations.
Footnotes
Acknowledgements
The authors thank Dr. Ravi Ramakantan, for his teachings and undying support.
Funding
This research received no specific grant from any funding agency in the public, commercial, or not-for-profit sectors.