



Abstract
Background
Biopsy remains the current gold-standard for assessing non-alcoholic fatty liver disease (NAFLD). To develop a non-invasive means of assessing the disease, 31P magnetic resonance spectroscopy (31P-MRS) has been explored, but the severe spectral overlaps and low signal-to-noise-ratio in 31P-MRS spectra at clinical field strength are clearly limiting factors.
Purpose
To investigate potential advantages of high resolution in vivo 31P-MRS in assessing NAFLD.
Material and Methods
The study was conducted at 9.4T in control and carbon tetrachloride (CCl4)-treated rats. Rats were divided according to histopathologic findings into a control group (n = 15), a non-alcoholic steatohepatitis group (n = 17), and a cirrhosis group (n = 12). Data were presented with different reference peaks that are commonly used for peak normalization such as total phosphorous signal, phosphomonoester + phosphodiester (PME + PDE), and nucleotide triphosphate (NTP). Then, multivariate analyses were performed.
Results
In all spectra PME and PDE were well resolved into phosphoethanolamine (PE) and phosphocholine (PC), and into glycerophosphorylethanolamine (GPE) and glycerophosphorylcholine (GPC), respectively. Those MRS measures quantifiable only in highly resolved spectra had higher correlations with histology than those conventional MRS measures such as PME, PDE, and NTP. The optimized partial least-squares discriminant analysis (PLS-DA) model correctly classified 79% (22/28) of the rats in the training set and correctly predicted 69% (11/16) of the rats in the test set.
Conclusion
PE, PC, GPE, GPC, and nicotinamide adenine dinucleotide phosphate (NADP) that can be separately quantifiable in highly resolved spectra may further improve the potential efficacy of 31P-MRS in the diagnosis of NAFLD.
Keywords
Introduction
Non-alcoholic fatty liver disease (NAFLD) includes fatty liver, non-alcoholic steatohepatitis (NASH) and cirrhosis with histopathologic changes such as steatosis, necrosis, inflammation, and fibrosis (1). Recently, NAFLD is considered one of the most common liver diseases in adults (2). Nonetheless, biopsy remains the current gold-standard for assessing the disease (3,4). To address limitations with liver biopsy several other approaches have been employed such as serological markers, transient elastography, computed tomography (CT), and conventional magnetic resonance imaging (MRI). However, they are not capable of reliably assessing NASH and fibrosis (3,4). Advanced MRI methods such as diffusion MRI, perfusion MRI, and MR elastography have also been tested, but require more clinical evidence before they are widely accepted as a robust means of diagnosing the disease (3).
The performance of 31P magnetic resonance spectroscopy (31P-MRS) in assessing injured livers has also been explored extensively (5–8), which provides insights into hepatic phosphorous metabolism non-invasively. As NAFLD is strongly linked to the metabolic syndrome (3,4), of which the hypothetical pathogenesis includes altered energy metabolism (9), and hepatic inflammation and fibrosis can alter membrane phospholipid metabolism (8), 31P-MRS could be a promising alternative to those imaging methods in the development of a diagnostic tool for the disease. However, the severe spectral overlaps and low signal-to-noise-ratio (SNR) in 31P-MRS spectra at clinical field strength such as 1.5T or 3.0T are clearly limiting factors, allowing only a few spectral components to be detected such as phosphomonoester (PME), phosphodiester (PDE), and nucleotide triphosphate (NTP). To address this issue, studies employing proton decoupling and nuclear Overhauser enhancement (NOE) have been reported (8,10,11). Using these techniques phosphoethanolamine (PE), phosphocholine (PC), glycerophosphorylethanolamine (GPE), and glycerophosphorylcholine (GPC) can be resolved from the humps of PME and PDE signal with improved SNR (8,10,11), and even nicotinamide adenine dinucleotide phosphate (NADP) may also be separately detectable (8). However, there have been only a few in vivo studies reported to date in association with NAFLD with such enhanced spectral dispersion and SNR (8,11). Meanwhile, the data in previous 31 P-MRS studies have been presented with different reference peaks for peak normalization such as total phosphorous signal (Ptotal), PME + PDE, and NTP, which makes it difficult to compare across other studies.
Given the increasing prevalence of NAFLD and availability of high field clinical scanners or those capable of double resonance 31 P-MRS, therefore, the purpose of this study was to investigate whether or not the separate quantification of PE, PC, GPE, GPC, and NADP is advantageous over the conventional PME, PDE, and NTP measurement in assessing NAFLD. The study was conducted in vivo at 9.4T in animals with a broad range of disease severity, and the data were presented using those commonly used reference peaks, followed by multivariate analyses (12) for efficient management of the increased number of variables.
Material and Methods
Animal preparation
The animal research protocol was approved by the Institutional Animal Care and Use Committee of Gachon University. Forty-four male Sprague-Dawley rats (aged 7 weeks) were housed in groups of two to three per cage with free access to lab chow and water on a 12:12-h light/dark schedule. For the induction of NAFLD 29 rats received intraperitoneal injections of carbon tetrachloride (CCl4) mixed with vegetable oil (25 µL CCl4 in a 150 µL volume [1:6]) at the frequency of three times per week (13) for 3, 6, 9, 12, 14, and 16 weeks (n = 4 for 6-week treatment duration; n = 5 for the rest) (14,15). There were 15 control rats, among whom five rats received pure vegetable oil intraperitoneally at the same frequency.
31P-MRS
Rats underwent MRS scan 2 days after the last dose of CCl4. Prior to MRS scan rats were fasted overnight and anesthetized with isofluorane (1% in 100% oxygen).
All MR data were collected at 9.4T (Bruker Biospec 94/20 USR; Bruker Biospin, Ettlingen, Germany). Rats were placed in the prone position. Then, a 1H/31P double-tunable surface coil (2 cm in diameter; Bruker Biospin) used for both RF transmission and signal reception was placed underneath the animal body close to the center of the liver, and tuned to 1H and 31P resonance frequencies (400.31 and 162.05 MHz, respectively). Scout images were acquired using a gradient echo sequence (Fig. 1). The imaging parameters were: field of view (FOV), 30 × 30 mm2; matrix size, 256 × 256; repetition time (TR)/echo time (TE), 796/3 ms; flip angle (FA), 30°; number of slices, 20 (axial), 7 (coronal), and 15 (sagittal); slice thickness (TH), 1 mm; and 1 signal average. For localized 31P-MRS an image selected in vivo spectroscopy sequence (ISIS) (16) was used. Based on the scout images a rectangular voxel was defined in the liver (Fig. 1) followed by local shimming thereof. For each animal the size of the voxel was adjusted as large as possible in consideration of SNR, while avoiding inclusion of adjacent organs. The typical volume of the voxel was approximately 2.5 cm3. For the ISIS spatial localization adiabatic hyper secant inversion pulses (duration [L] = 1.76 ms) were used. For excitation a rectangular hard pulse (L = 0.128 ms) was used. The sequence parameters were: TR, 6000 ms; 1024 data points zero-filled to 4096; spectral bandwidth, 8000 Hz; 512 signal averages. All data were collected by one operator to maintain the voxel location in the liver across all samples.
Representative axial (a), coronal (b), and sagittal (c) MR images of the liver showing the position of the voxel (A, anterior; H, head; R, right), and representative 31P-MRS spectra of a control (d), a NASH (e), and a cirrhotic (f) rat. GPC, glycerophosphorylcholine; GPE, glycerophosphorylethanolamine; NADP, nicotinamide adenine dinucleotide phosphate; PC, phosphocholine; PDE, phosphodiester; PE, phosphoethanolamine; Pi, inorganic phosphate; PME, phosphomonoester; UDPG, uridine diphosphoglucose; α-, β-, γ-NTP, alpha-, beta-, gamma-nucleotide triphosphate.
Histopathology
Following MRS scan, livers were harvested, and liver pieces were stained with hematoxylin and eosin (HE), and Masson’s trichrome (MT) by routine methods. Livers were scored by one pathologist for steatosis, necrosis and inflammation by examining HE-stained slides (0–3 scale), and for fibrosis by MT-stained slides (0–4 scale) (17).
MRS data analysis
MRS data were processed by using MRUI (version 3.0) (18). First, data were Fourier-transformed, line-broadened (approximately 5 Hz) and phase-corrected. Second, the β-NTP resonance was assigned at −16.2 ppm, in which case the phosphocreatine (PCr) resonance that is absent in the liver spectra would have appeared at approximately 0 ppm. Third, the following peaks were assigned: PE (6.8 ppm), PC (6.3 ppm), inorganic phosphate (Pi; 5.2 ppm), GPE (3.5 ppm), GPC (3.0 ppm), γ-NTP (−2.5 ppm), α-NTP (−7.6 ppm), NADP (−8.2 ppm), and uridine diphosphoglucose (UDPG; −9.81 ppm). Finally, the individual peak areas were estimated by using AMARES (19). They were then divided by Ptotal (to be denoted without the denominator specified). They were also normalized to PME + PDE and β-NTP (to be referred to as NTP). In addition, the SNR (the noise estimated in the 10–20 ppm range) and linewidth of γ-NTP were estimated in each spectrum without line-broadening and zero-filling using Matlab (v7.13; Mathworks Inc., Natick, MA, USA).
Statistical analysis
All results were expressed as mean ± standard deviation (SD). For statistical analyses rats were divided into control (C), NASH (N), and cirrhosis (R) groups according to histopathology. The potential effect of age and weight on the 31P-MRS measures was examined using control rats (SPSS (v.20), SPSS Inc., Chicago, IL, USA). For pairwise group comparisons, a two-tailed Student t test was used with unequal variances. For multiple pairwise comparisons, Bonferroni correction was performed by adjusting the P value (20). All pairwise correlations between variables were examined by calculating the Pearson partial correlation coefficient controlling for the effect of age and weight. A P value of less than 0.05 was considered to indicate statistical significance.
Multivariate analyses were performed by using SIMCA (v.13; Umetrics Inc., San Jose, CA, USA). First, data were inspected (e.g. animal grouping and outliers) by performing principal components analysis (PCA). Second, to examine the relationship between the histopathologic parameters and the 31P-MRS measures a partial least-squares regression (PLS) was performed. Then, partial least-squares discriminant analyses (PLS-DA) were performed (14). Briefly, rats were randomly divided into a training set (n = 28; control [n = 10], NASH [n = 10], and cirrhosis [n = 8]) and a test set (n = 16; control [n = 5], NASH [n = 7], and cirrhosis [n = 4]). An initial PLS-DA model was produced using the training set with all 31P-MRS measures. Then, a set of MRS measures were defined that contributed most in the differentiation of those three animal groups, based on the variable influence on projection (VIP) as a measure of the relative discriminatory potential of the MRS measures (12). Using a set of MRS measures with VIP > 1 (14) an optimized model was constructed and evaluated for its predictability on both the training and the test sets.
Results
Histopathology
Comparison of the control, NASH, and cirrhosis animal groups with respect to the histopathological parameters, age, weight, and 31P-MRS measures.

P < 0.05 vs. control.
P < 0.05 vs. NASH.
Severity scores were in the range of 0–3 for steatosis, necrosis, and inflammation, and in the range of 0–4 for fibrosis. All 31P-MRS measures except for PME and PDE were normalized to the total phosphorous signal.
GPC, glycerophosphorylcholine; GPE, glycerophosphorylethanolamine; NADP, nicotinamide adenine dinucleotide phosphate; NTP, (beta-) nucleotide triphosphate; PC, phosphocholine; PDE ( = GPE + GPC), phosphodiester; PE, phosphoethanolamine; Pi, inorganic phosphate; PME ( = PE + PC), phosphomonoester; UDPG, uridine diphosphoglucose.
Steatosis was correlated with necrosis, inflammation, and fibrosis (r = 0.639, 0.479, and 0.610; P < 0.010 for all). Necrosis was also correlated with inflammation and fibrosis (r = 0.705 and 0.911; P < 0.010 for both). Inflammation was also correlated with fibrosis (r = 0.742, P < 0.010).
31P-MRS spectra
The PME and PDE spectral regions were well resolved (Fig. 1). The NADP resonance was observed separately from α-NTP. The SNR and linewidth of γ-NTP were in the ranges of 30.0–51.5 (39.5 ± 8.9) and 48.2–70.0 Hz (55.1 ± 10.0 Hz), respectively. The negligible PCr signal at 0 ppm ensured the excellent volume localization performance of the ISIS.
Comparisons between animal groups
Although not statistically significant, there was a trend towards increasing PE with increasing disease severity (Table 1). PC of both NASH and cirrhosis groups were significantly lower than that of control. Consequently, PME did not differ between the animal groups. For PDE significant differences occurred between all animal groups. NADP was significantly lower in the cirrhosis group relative to the control group.
PDE/PME was significantly reduced in cirrhosis relative to control (P < 0.05) and NASH (P < 0.01) (Fig. 2). NTP/Pi did not differ between the animal groups (P > 0.910).
Comparisons among the control, NASH and cirrhotic groups with respect to PDE/PME (a), GPE/PE (b), GPC/PC (c), PE/PC (d), GPE/GPC (e), and NTP/Pi (f). *P < 0.05 vs. control, and †P < 0.05 vs. NASH; error bar indicates standard deviation.
PME/(PME + PDE) and PDE/(PME + PDE) allowed differentiation only between the NASH and the cirrhosis groups (P = 0.001 for both) (Fig. 3). However, PE/(PME + PDE) allowed discrimination of cirrhosis not only from NASH but also from control. PC/(PME + PDE) was the only MRS measure that differentiated between control and NASH.
Comparisons among the control, NASH, and cirrhotic groups with respect to PE (a), PC (b), PME (c), Pi (d), GPE (e), GPC (f), PDE (g), NADP (h), UDPG (i), and NTP (j), all of which were normalized to PME + PDE. *P < 0.05 vs. control, and †P < 0.05 vs. NASH; error bar indicates standard deviation.
Unlike PME/NTP, PC/NTP of the NASH and the cirrhosis groups were significantly lower than that of control (P < 0.011 for both) (Fig. 4).
Comparisons among the control, NASH, and cirrhotic groups with respect to PE (a), PC (b), PME (c), GPE (d), GPC (e), PDE (f), NADP (g), and UDPG (h), all of which were normalized to (β-)NTP. *P < 0.05 vs. control, and †P < 0.05 vs. NASH; error bar indicates standard deviation.
Correlations between 31P-MRS measures and histopathological parameters
Correlations between the histopathological parameters and MRS measures.

P < 0.05.
P < 0.01.
The Pearson partial correlation analysis was performed controlling for the effect of age and weight. All 31P-MRS measures except for PME and PDE were normalized to the total phosphorous signal.
GPC, glycerophosphorylcholine; GPE, glycerophosphorylethanolamine; NADP, nicotinamide adenine dinucleotide phosphate; NTP, (beta-) nucleotide triphosphate; PC, phosphocholine; PDE ( = GPE + GPC), phosphodiester; PE, phosphoethanolamine; Pi, inorganic phosphate; PME ( = PE + PC), phosphomonoester; UDPG, uridine diphosphoglucose.
In the PLS analysis (Fig. 5) with all of the 35 MRS measures (included in Table 1 and Figs. 2–4), the histopathologic parameters had relatively high, positive correlations with PE/PC, PE/(PME + PDE) and GPC/PC, and negative correlations with PC/(PME + PDE), GPE/PE, and NADP/NTP in addition to PC and NADP.
The relationships between the histopathological parameters and the 31P-MRS measures examined by a partial least-squares regression (PLS) analysis. The plot (a loading column plot) shows the importance of the individual MR measures in explaining the variation among the histopathological scores of the rats. Those MR measures with large values (either positive or negative) of the amplitude (w*c[1]) indicate high correlation with the histopathological parameters.
Separation of animal groups by a PLS-DA model
In the initial PLS-DA model (Fig. 6), all but PDE and PDE/PME of the 14 MRS measures with VIP > 1 were those detectable only in highly resolved spectra. The optimized model allowed good separations of the animal groups (Fig. 6). The control rats tended to have higher PC/(PME + PDE), PC, NADP, PC/NTP, NADP/(PME + PDE), and NADP/NTP, and those rats in the NASH group tended to have higher PDE, PDE/PME, and GPE (Fig. 6). Using this optimized model, 79% (22/28) of the rats in the training set were correctly classified and 69% (11/16) of the rats in the test set were correctly predicted.
Partial least-squares discriminant analyses (PLS-DA) to examine the importance of the individual MRS measures in the differentiation of the animal groups, and to evaluate the predictability of the statistical model constructed therefrom. In an initial PLS-DA model produced on the training set 14 of 35 MRS measures were defined, based on the variable influence on projection (VIP > 1) as shown in (a) as a measure of the relative discriminatory potential. Using these 14 MRS measures an optimized model was constructed, and the resulting score scatter plot (b) and loading scatter plot (c) are shown (control (“C”; green circle), NASH (“N”; blue square), and cirrhosis (“R”; red triangle)). In (b), the scores for the rats were calculated from linear combinations of the 14 MRS measures. In (c), the relative contribution of the MRS measures to the scores in (b) are shown. By matching the positions in the score (b) and loading (c) plots, correlations between the MRS measures and the severity of the disease can be examined. $M2.DA(1)-(3) are dummy variables.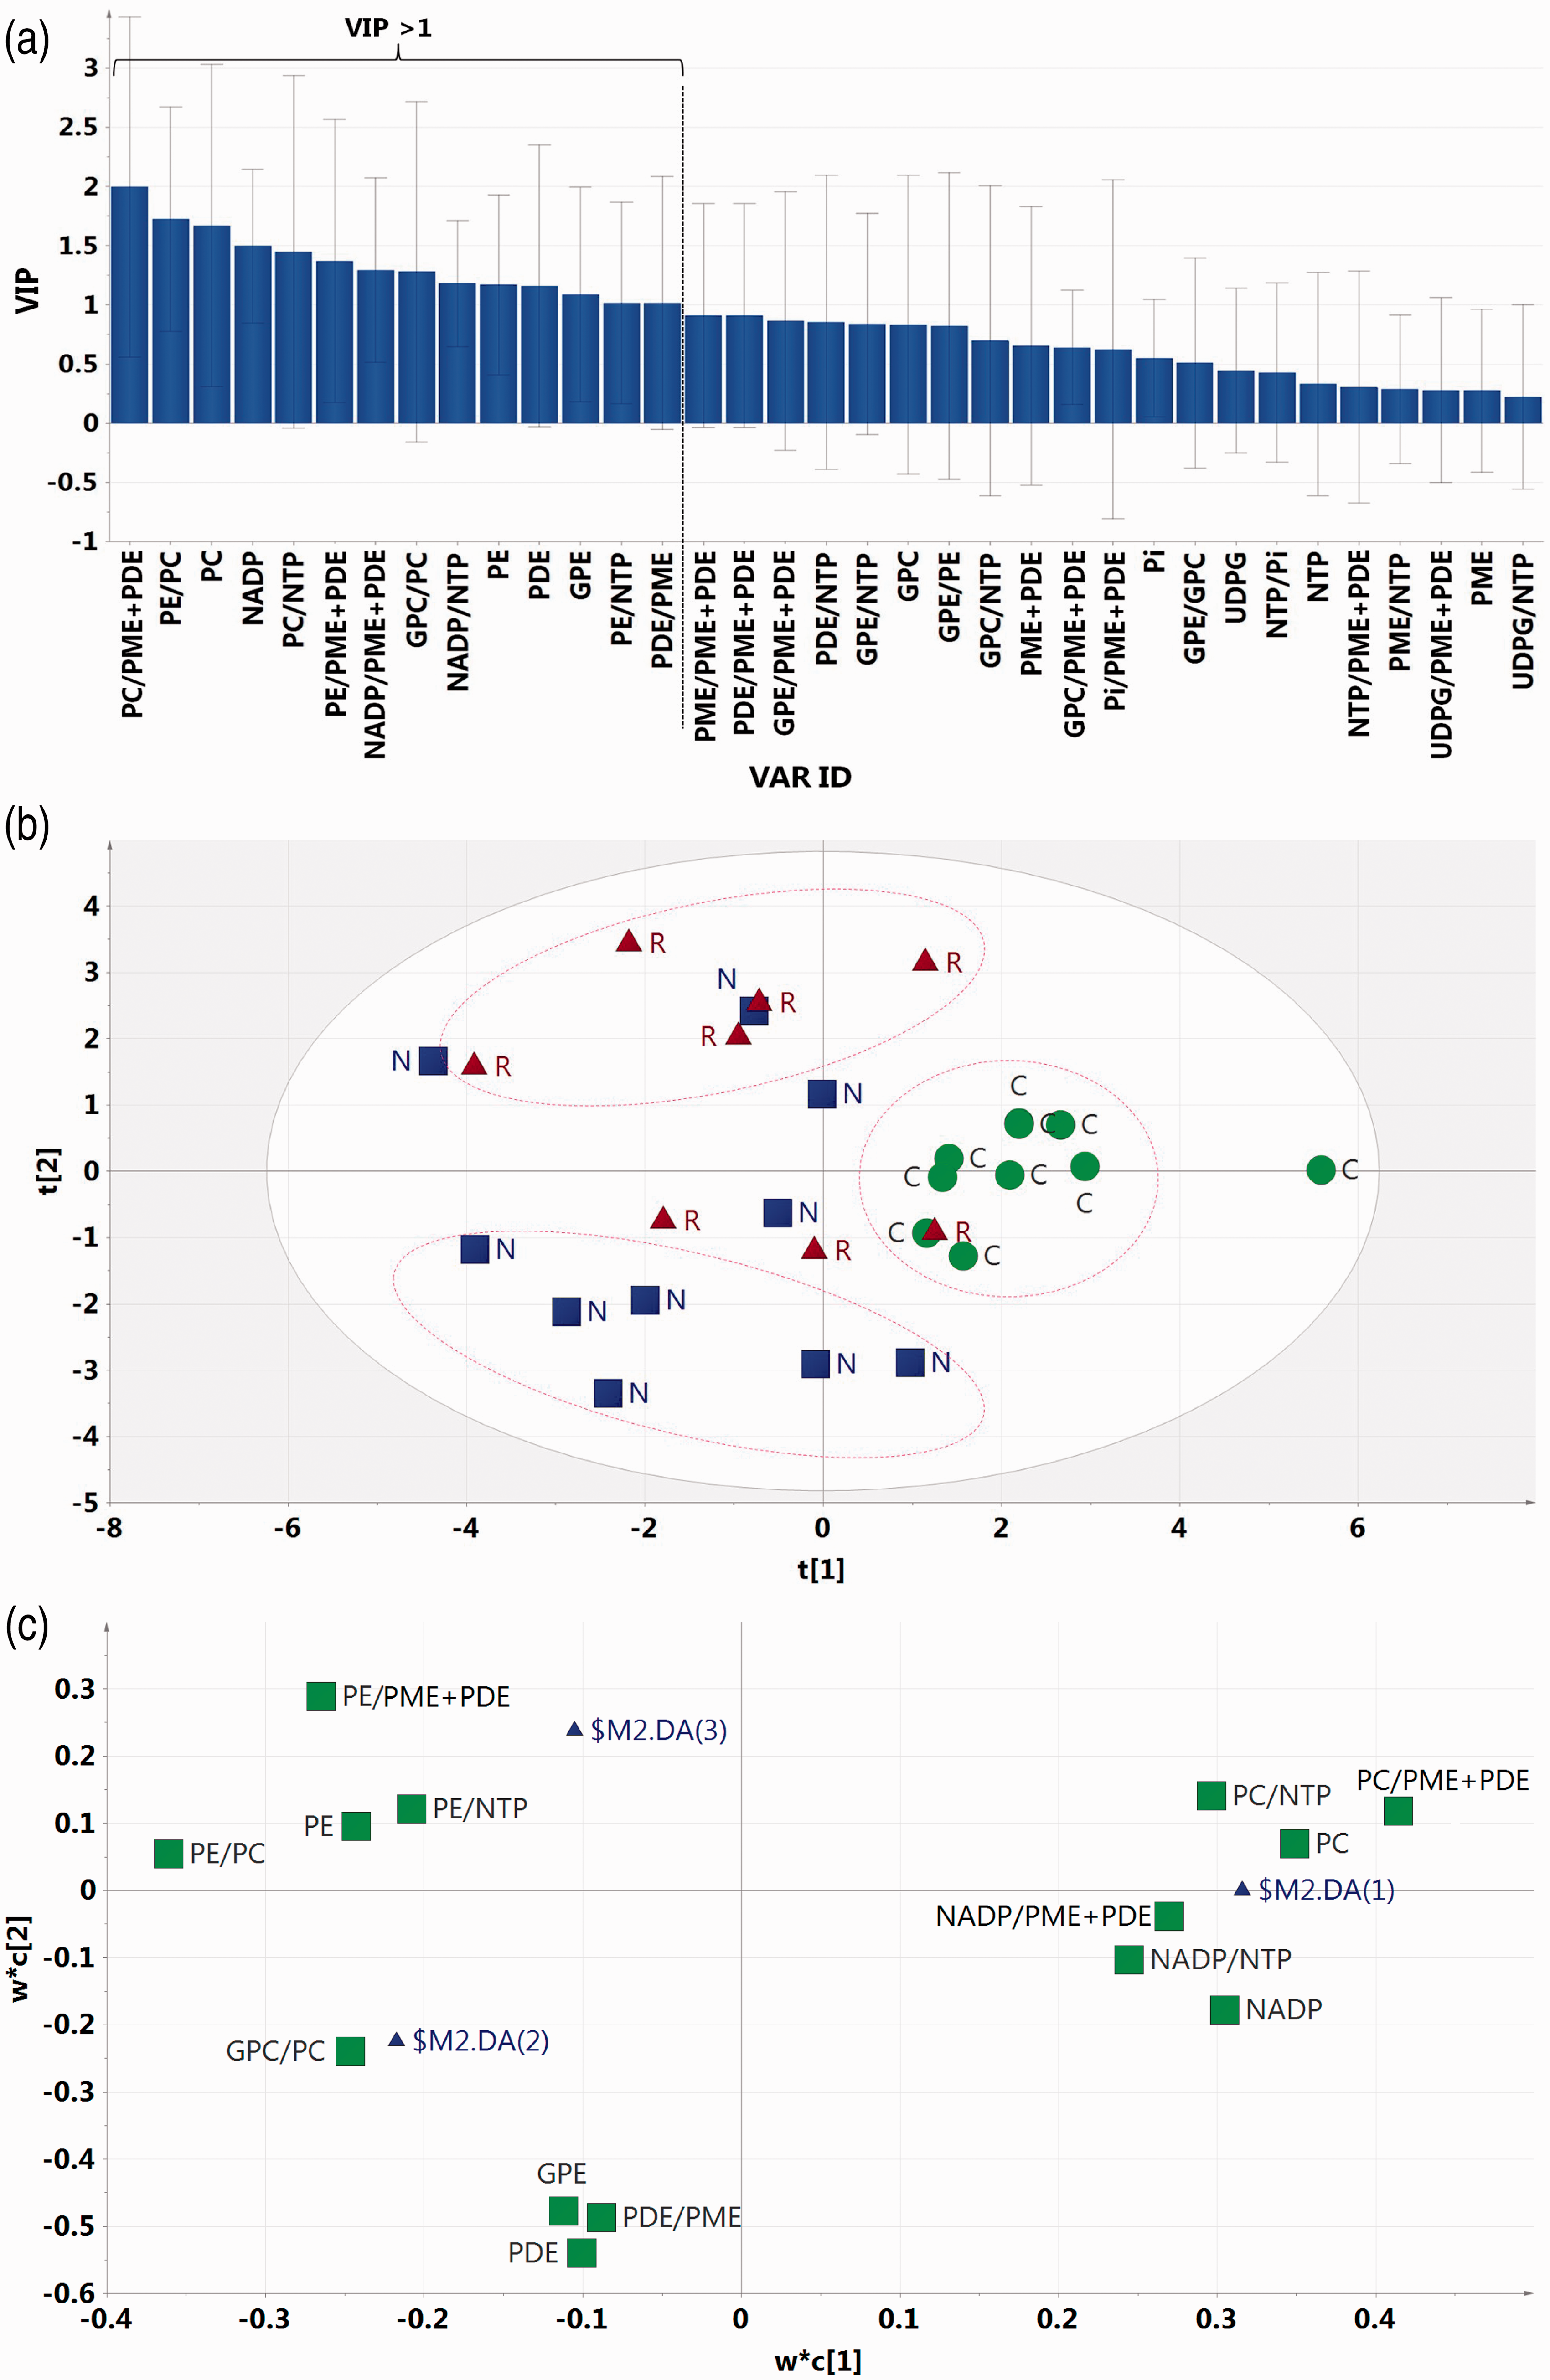
Discussion
Previous 31P-MRS studies of the liver are in support of its diagnostic potential (5–8,21). However, its diagnostic accuracy has not been fully in agreement (7,8). Many factors may be responsible for such rather inconclusive diagnostic value of 31P-MRS in assessing liver diseases, including but not limited to the poor SNR and spectral dispersion at clinical field strength, and heterogeneity in the cohorts of patients. To address the former, human liver studies employing proton decoupling and NOE have been conducted where the separate quantification of PE, PC, GPE, GPC, and even NADP was clearly demonstrated at clinical field strengths (8,10,11). However, given that only two of these pioneering studies were associated with NAFLD (8,11), the investigation of the potential role of those highly resolved additional peaks in assessing the disease is an important issue.
In our study, PME did not differ between the animal groups. However, our highly resolved spectra provided additional information such as a trend towards increasing PE with increasing disease severity and reduced PC in diseased livers relative to control. Such higher PE and lower PC (22), and no changes in PME (23) were also observed in regenerating rat livers in vitro. PDE differed between all animal groups. However, as it was higher in NASH and lower in cirrhosis relative to control, it cannot be used as a single MR measure for assessing NAFLD. The PDE/PME level that was lower in cirrhosis relative to control and NASH in our study reconfirms its role as a 31P-MRS biomarker of liver cirrhosis. However, in our study it could not separate between control and NASH, which can be achieved in combination with GPC/PC or PE/PC.
NADP has been suggested as a potential MR biomarker of liver injury in a human study (8) where it was positively correlated with inflammation and fibrosis. In our study, however, it was negatively correlated with necrosis and fibrosis. The lowered NADP in cirrhosis with respect to control in our study was also reported previously in CCl4-treated rats in vitro (24). While such inconsistent observations need to be addressed in the follow-up studies, the altered NADP metabolism supports its potential role as an additional MR biomarker.
NTP/Pi was suggested as a potential marker of local cellular hypoxia resulting from impaired liver function (24). However, it did not differ between the animal groups in our study. Nonetheless, given that Pi is severely contaminated by PME and PDE at clinical field strength, highly resolved spectra would facilitate the clarification of the role of NTP/Pi in assessing NAFLD.
Among the 31P-MRS measures normalized to Ptotal only PC and NADP were significantly correlated with some of the histopathological parameters. However, as none of the MRS measures was correlated with inflammation, diagnosis of NASH in its early stage using 31P-MRS may not be feasible even with highly resolved spectra. In the PLS analysis, relatively higher correlations with histology were found with those highly resolved additional peaks. The advantage of separately quantifying PE, PC, GPE, GPC, and NADP was further demonstrated in the PLS-DA analysis that allowed the classification and prediction of the animals according to disease severity with approximately 70–80% accuracy.
Our data were acquired at a field strength as high as 9.4T. However, previous human studies with proton decoupling and NOE have demonstrated that PE, PC, GPE, GPC, and NADP can be quantifiable at clinical field strengths (8,10). Therefore, our findings can be informative for future clinical studies in such a hardware setting. As NAFLD encompasses a broad clinical and histopathologic spectrum, it is not likely that 31P-MRS alone can precisely assess the disease. However, the strong link of NAFLD to metabolic syndrome dictates that 31P-MRS can take part in the development of a non-invasive means of assessing the disease in combination with other imaging modalities.
Our study has limitations. The performance of the semi-quantitative scoring system used in our histopathologic analysis can be limited when inter-score differences of the measured parameters are small. For this reason, we have stratified the animals into control, NASH, and cirrhosis groups, rather than by individual severity scores. Several findings in our study were not fully in agreement with previous reports as discussed above. These could have resulted from differences in species (animal vs. human) and/or disease model (NAFLD induced by CCl4 vs. human NAFLD etiology). However, CCl4 intoxication in rodents is known to induce histopathologic feathers mirroring human fibrosis associated with toxic damage (25). It should be noted that except for NADP the majority of our findings are in agreement with those reported in human patients (8). Isofluorane at low concentrations does not significantly influence the total hepatic oxygen delivery and consumption (26). Therefore, a potential confounding effect of isofluorane on our results should be minor. No distinction was made between compensated and decompensated cirrhosis in our study. However, given that the disturbed hepatic energy and phospholipid metabolism were found only in the latter (27), highly resolved 31P-MRS spectra might also be helpful for more refined cirrhosis staging (28). Among the 31P-MRS resonances PDE and its components have longest T1 in the livers of rats (29,30) and humans (11,31), and our TR may not have allowed full relaxation recovery of those peaks. However, the changes in those MRS measures involving PDE or its components in our study are all in good agreement with those previously reported (6,8,22). Therefore, the potential influence of the TR on our statistical outcome should be minimal. ISIS is susceptible to motion artifacts. However, given our animal-coil configuration, excellent SNR and spectral dispersion, and negligible amount of PCr signal, motion-induced spectral contamination should not be substantial. Due to the poor sensitivity of 31P-MRS the size of the voxel was chosen as large as possible. Such a larger voxel can be more prone to voxel inhomogeneity. Given the dimension of the liver tissue used for histopathologic analysis, therefore, this is an additional weakness of our study. The use of a surface coil is prone to B1 inhomogeneity and coil receive sensitivity. In addition, the metabolite ratio presentation employed in this study provides limited quantitative information compared to an external reference calibration method and an absolute quantification method. However, it should be noted that the metabolite ratio presentation is less subject to errors arising from the use of the surface coil and other hardware imperfections.
In conclusion, PE, PC, GPE, GPC, and NADP that can be separately quantifiable in highly resolved spectra may further improve the potential efficacy of 31P-MRS in the diagnosis of NAFLD.
Footnotes
Conflict of interest
None declared.
Funding
This research was supported by Basic Science Research Program through the National Research Foundation of Korea (NRF) funded by the Ministry of Education, Science and Technology (2009-0077642, 2010-0002896, 2013R1A1A2013516), and by a grant from the Next-Generation BioGreen 21 Program (No. PJ00954002), Rural Development Administration, Republic of Korea.