
Abstract
Background
Despite novel software solutions, liver volume segmentation is still a time-consuming procedure and often requires further manual optimization. With the high signal intensity of the liver parenchyma in Gd-EOB enhanced magnetic resonance imaging (MRI), liver volume segmentation may be improved.
Purpose
To evaluate the practicability of threshold-based segmentation of the liver volume using Gd-EOB-enhanced MRI including a customized three-dimensional (3D) sequence.
Material and Methods
A total of 20 patients examined with Gd-EOB MRI (hepatobiliary phase T1-weighted (T1W) 3D sequence [VIBE]; flip angle [FA], 10° and 30°) were enrolled in this retrospective study. The datasets were independently processed by two blinded observers (O1 and O2) in two ways: manual (man) and threshold-based (thresh; study method) segmentation of the liver each followed by an optimization step (man+opt and thresh+opt; man+opt [FA10°] served as reference method). Resulting liver volumes and segmentation times were compared. A liver conversion factor was calculated in percent, describing the non-hepatocellular fraction of the total liver volume, i.e. bile ducts and vessels.
Results
Thresh+opt (FA10°) was significantly faster compared to the reference method leading to a median volume overestimation of 4%/8% (P < 0.001). Using thresh+opt (FA30°), segmentation was even faster (P < 0.001) and even reduced median volume deviation of 0%/2% (O1/O2; both P > 0.2). The liver conversion factor was found to be 10%.
Conclusion
Threshold-based liver segmentation employing Gd-EOB-enhanced hepatobiliary phase standard T1W 3D sequence is accurate and time-saving. The performance of this approach can be further improved by increasing the FA.
Introduction
Determination of liver volumes is of great importance in the preoperative setting of liver surgery such as living donor liver transplantation and liver resection. Furthermore, determination of hepatic tumor load is essential for prognosis, therapeutic response assessment, and planning of liver directed therapies like surgery and transarterial radioembolization. Magnetic resonance imaging (MRI) has been shown to enable accurate volumetric assessment of the liver; the volumetric assessment requires manual or semi-automated segmentation and the application of mathematical algorithms for segmentation (1,2). However, the accuracy of MRI-based volumetric techniques depends on the type and quality of imaging data, as well as the applied segmentation algorithm (3,4). Manual liver segmentation requires manually tracing the liver on each image section and multiplying the section thickness to obtain the total volume of the liver segments, which is tedious and time consuming (5). Therefore, automatic segmentation techniques that involve thresholding, morphologic operations, and model deformations have been proposed. However, all these techniques are complex and require long computation times. Moreover, most of these algorithms were developed for computed tomography (CT) and are typically not directly compatible with MRI (1,2,5–10). During the past 7 years, the T1-weighted (T1W) based positive contrast agent, gadoxetic acid, which shows intracellular uptake in hepatocytes with a hepatic extraction fraction of approximately 50%, has been approved for liver imaging in many countries worldwide (11–14). This prompts the idea to use the selective gain in signal intensity (SI) of the liver parenchyma for primarily threshold-based liver segmentation in a three-dimensional (3D) dataset. However, in our experience, with the conventional T1W fat-saturated (FS) 3D-GRE-sequences (e.g. VIBE, THRIVE, LAVA), the background SI often remains too high in adjacent structures to allow for accurate threshold-based segmentation. By increasing the flip angle (FA) of the T1W 3D-GRE sequence from the conventional setting (10–12°) to 20–35°, the Gd-EOB-related signal inside the liver can be increased while the signal of structures without Gd-EOB uptake is suppressed (15–21). This modification of conventional 3D sequences could be the solution for a practical threshold-based segmentation of the liver with Gd-EOB MRI.
The purpose of our study was to evaluate the practicability and feasibility of threshold-based 3D liver segmentation in comparison to manual segmentation in Gd-EOB MRI, and the potential improvement of this approach when the conventional 3D sequence is modified by an increased FA.
Material and Methods
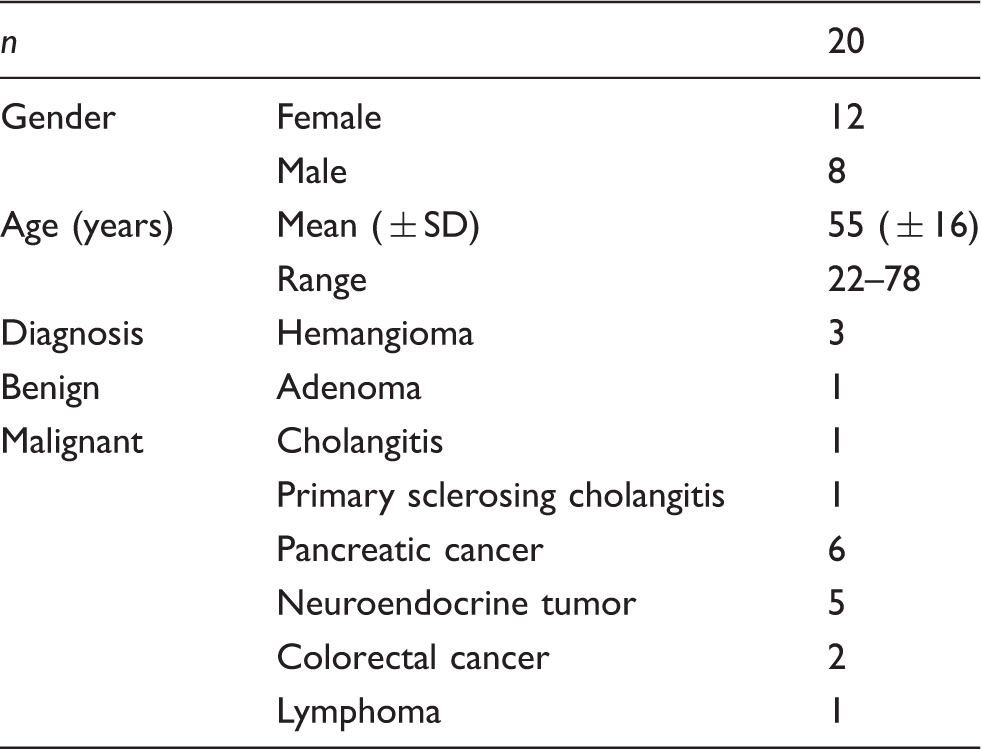
Study patients
Patient data (SD, standard deviation).
Magnetic resonance imaging
MRI was performed at a 1.5 T system (Siemens Magnetom Avanto, Siemens Healthcare, Erlangen, Germany) using an eight-channel body phased-array coil. A standard FS volume interpolated breath-hold examination sequence (VIBE) in axial plane with a TR of 4.26 ms, a TE of 1.87 ms, FA 10°, a slice thickness of 3 mm, and a matrix size of 256 × 127 was acquired covering the entire liver with 60–72 slices and an adjusted field of view (FOV) of 255–300 × 340–400 mm. The sequence was then repeated with FA 30°. A dose of 0.1 mL Gd-EOB-DTPA (0.25 mmol/mL) (Gd-EOB-DTPA, Primovist or Eovist; Bayer Schering Pharma, Berlin, Germany) per kg body weight was then manually injected in an anterior cubital vein, followed by a saline flush of 20 mL. After 20 min in the hepatobiliary phase, the standard VIBE sequences with FA 10° and 30° were repeated. Scanning parameters for the 30° sequence were the same as for the 10° sequences, except a slightly longer TE of 1.93 ms.
Volume analysis
A dedicated 3D viewing tool (Volume Viewer, Centricity PACS RA1000, GE Healthcare, Waukesha, WI, USA) was used for image analysis. All measurements were performed by two independent radiologists (O1 and O2, with 5 and 7 years of experience with gadoxetic acid-enhanced liver MRI, respectively), who were blinded to any other imaging exams or volumetric results of the analyzed subjects. The observers measured the patients’ liver volumes using two different liver segmentation methods – manual and threshold-based segmentation – each followed by an optimization step. These two methods were applied to two different MR sequences, a conventional 3D sequence (FA 10°) and a modified 3D sequence (FA 30°) (Fig. 1).
Flowchart (illustrated with a case example) of segmentation methods for all 20 patients examined with Gd-EOB-DTPA-enhanced hepatobiliary phase MRI VIBE Sequence (FA 10° and 30°, respectively).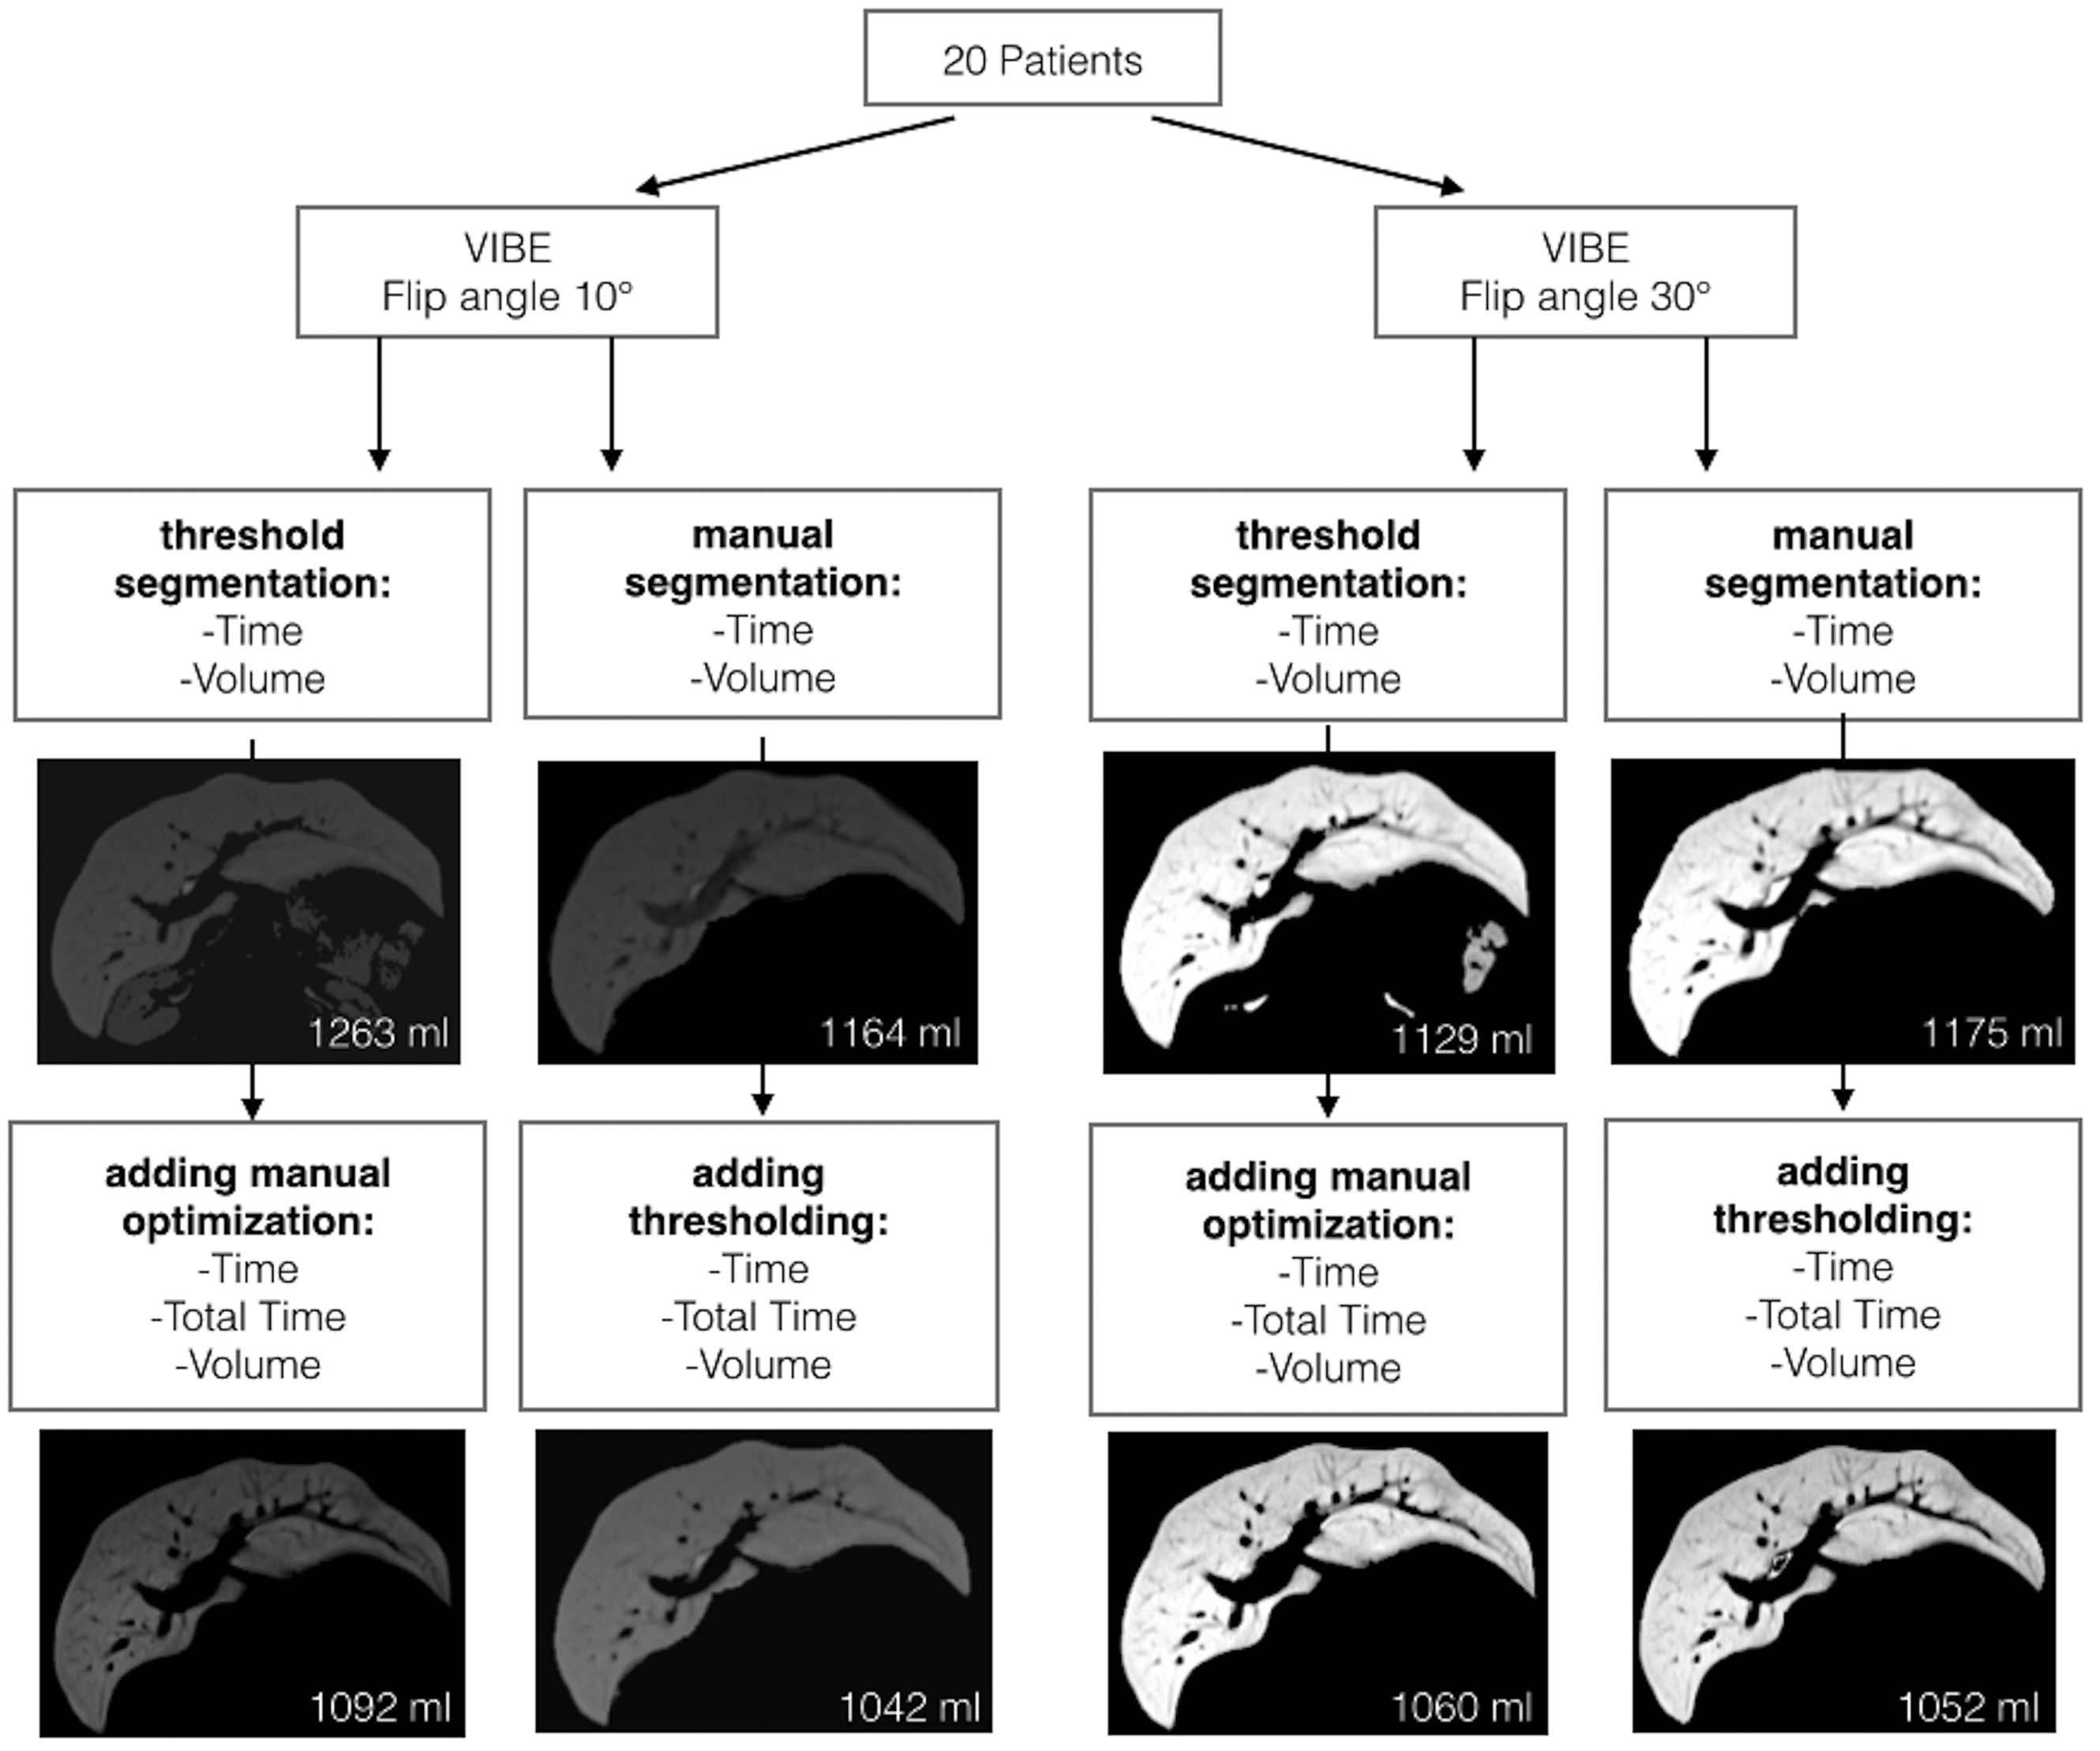
The first method (man; defined as reference method) is the common way to measure liver volume with manual slice-by-slice segmentation by tracking the liver surface in a conventional gapless axial 3D GRE T1W sequence (here: VIBE) with a low FA of approximately 10° covering the entire liver. Approximately every third slice was manually traced, however, this strongly depends on the appearance on the liver silhouette in the neighbouring slices. These slices are only skipped if the liver section is almost the same as in the tracked slices. A dedicated postprocessing tool was used allowing for interpolation of the liver silhouette on slices between two tracked slices to save time. A quality check and manual correction of the segmentation line if needed in order to perfectly fit the segmentation to the liver surface was always done on the interpolated slices.
The resulting volume is the “total liver volume” which includes liver parenchyma and intrahepatic structures like blood vessels. To achieve the actual volume of the hepatic parenchyma without inlaying macro-vessels, the “functional liver volume” (22,23), a secondary threshold optimization step (man + opt) was performed by adjusting the SI threshold individually to exclude large intrahepatic vessels as far as possible while maintaining the contrast accumulating hepatic parenchyma in the segmentation volume.
As test method, the primary threshold-based segmentation (thresh) was performed. This works on the basis of the high hepatic parenchymal SI in the hepatobiliary phase of Gd-EOB and low background signal. Thresh is performed by individually adjusting the SI threshold to keep the hepatic parenchyma in the segmentation volume with the inlaying macro-vessels already excluded. To remove extrahepatic structures of high SI, a manual optimization step (thresh + opt) was done using the “scalpel tool” on a 3D segmentation display showing multiplanar reformatted images as well as volume rendering reconstruction of the segmented objects resulting in the “functional liver volume”.
To improve the ability of differentiation between hepatic parenchyma and background by means of primary SI thresholding, we introduced the modified VIBE sequence with an elevated FA of 30°. The described test method of primary thresholding (thresh) with subsequent manual deletion of extrahepatic structures (thresh + opt) was applied to these datasets resulting in the “functional liver volume”.
To exclude significant differences between volume data derived from the modified FA 30° VIBE and from the conventional FA 10° VIBE, the reference method of manual liver surface tracking (man) to achieve the “total liver volume” and the additional secondary thresholding step (manual + opt) to achieve the “functional liver volume” was also performed using the 30° VIBE sequence.
A liver conversion factor was calculated in percent (%) based on manual liver segmentation: “(total liver volume – functional liver volume) / functional liver volume× 100”, describing the non-hepatocellular fraction of the total liver volume, i.e. bile ducts and vessels.
Statistical analysis
Statistical analyses were performed using the SPSS-software (release 19.0.0.1; SPSS Inc., IBM, Armonk, NY, USA) and the R software (version 2.15.3, R Foundation for Statistical Computing, Vienna, Austria). Due to the small sample size, non-parametric distribution of data was assumed and in consequence descriptive parameters are given as median (interquartile range). The Mann-Whitney U test for unpaired data was used. Univariate comparison of the segmentation method, FA, and observer were performed with the Wilcoxon rank sum test for paired data. Agreement of observer data was analyzed using Bland-Altman plots and corresponding 95% limits of agreement (24). Multivariate general linear model analysis was performed to analyze the effect of method, FA, and observer on measured liver segmentation volumes and times. All tests were performed two-sided at a 0.05 level for significance.
Results
Segmentation volumes
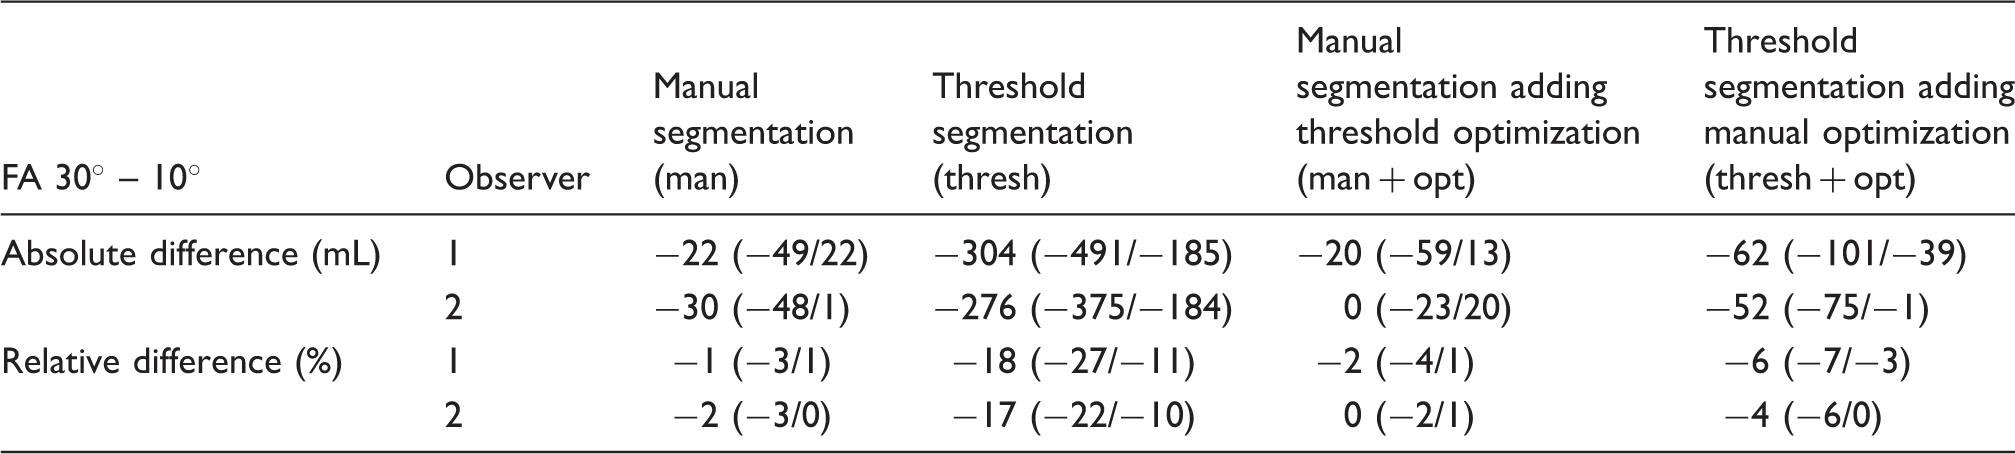
For thresh, using an increased FA (30° vs. 10°) resulted in significantly smaller volumes (Tables 2 and 3; Fig. 2) due to a smaller amount of remaining structures outside the liver. These structures were directly adjacent to the liver (e.g. kidney) in 16 of 20 cases (80%) when thresholding the FA 10° images, while this was the case in 2/20 (10%) cases with the FA 30° images.
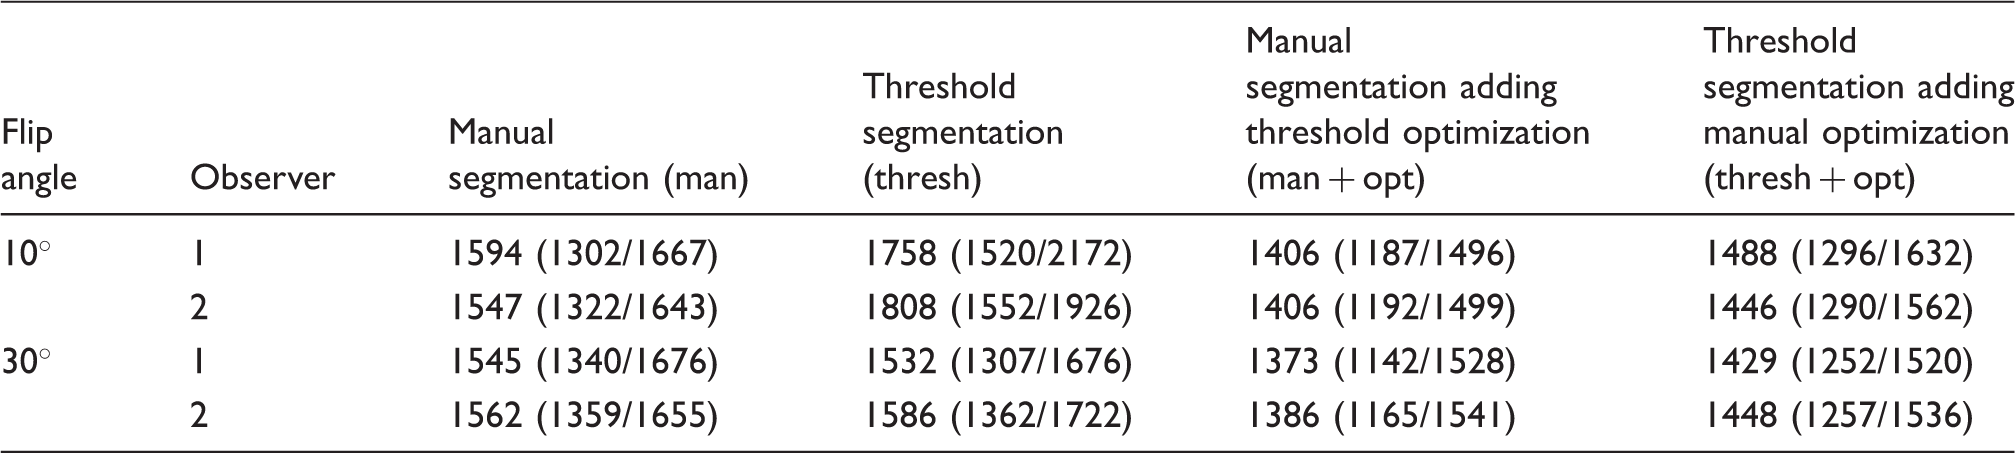
Boxplots of measured liver volumes in association with different segmentation methods (manual [man] and threshold-based [thresh] segmentation both including threshold / manual optimization [man + opt and thresh + opt]), FA, and observer. Volumes (mL) measured with the different segmentation procedures given as median (interquartile range). Absolute and relative differences of volumes (FA 30° – 10°) measured with the different segmentation procedures given as median (interquartile range).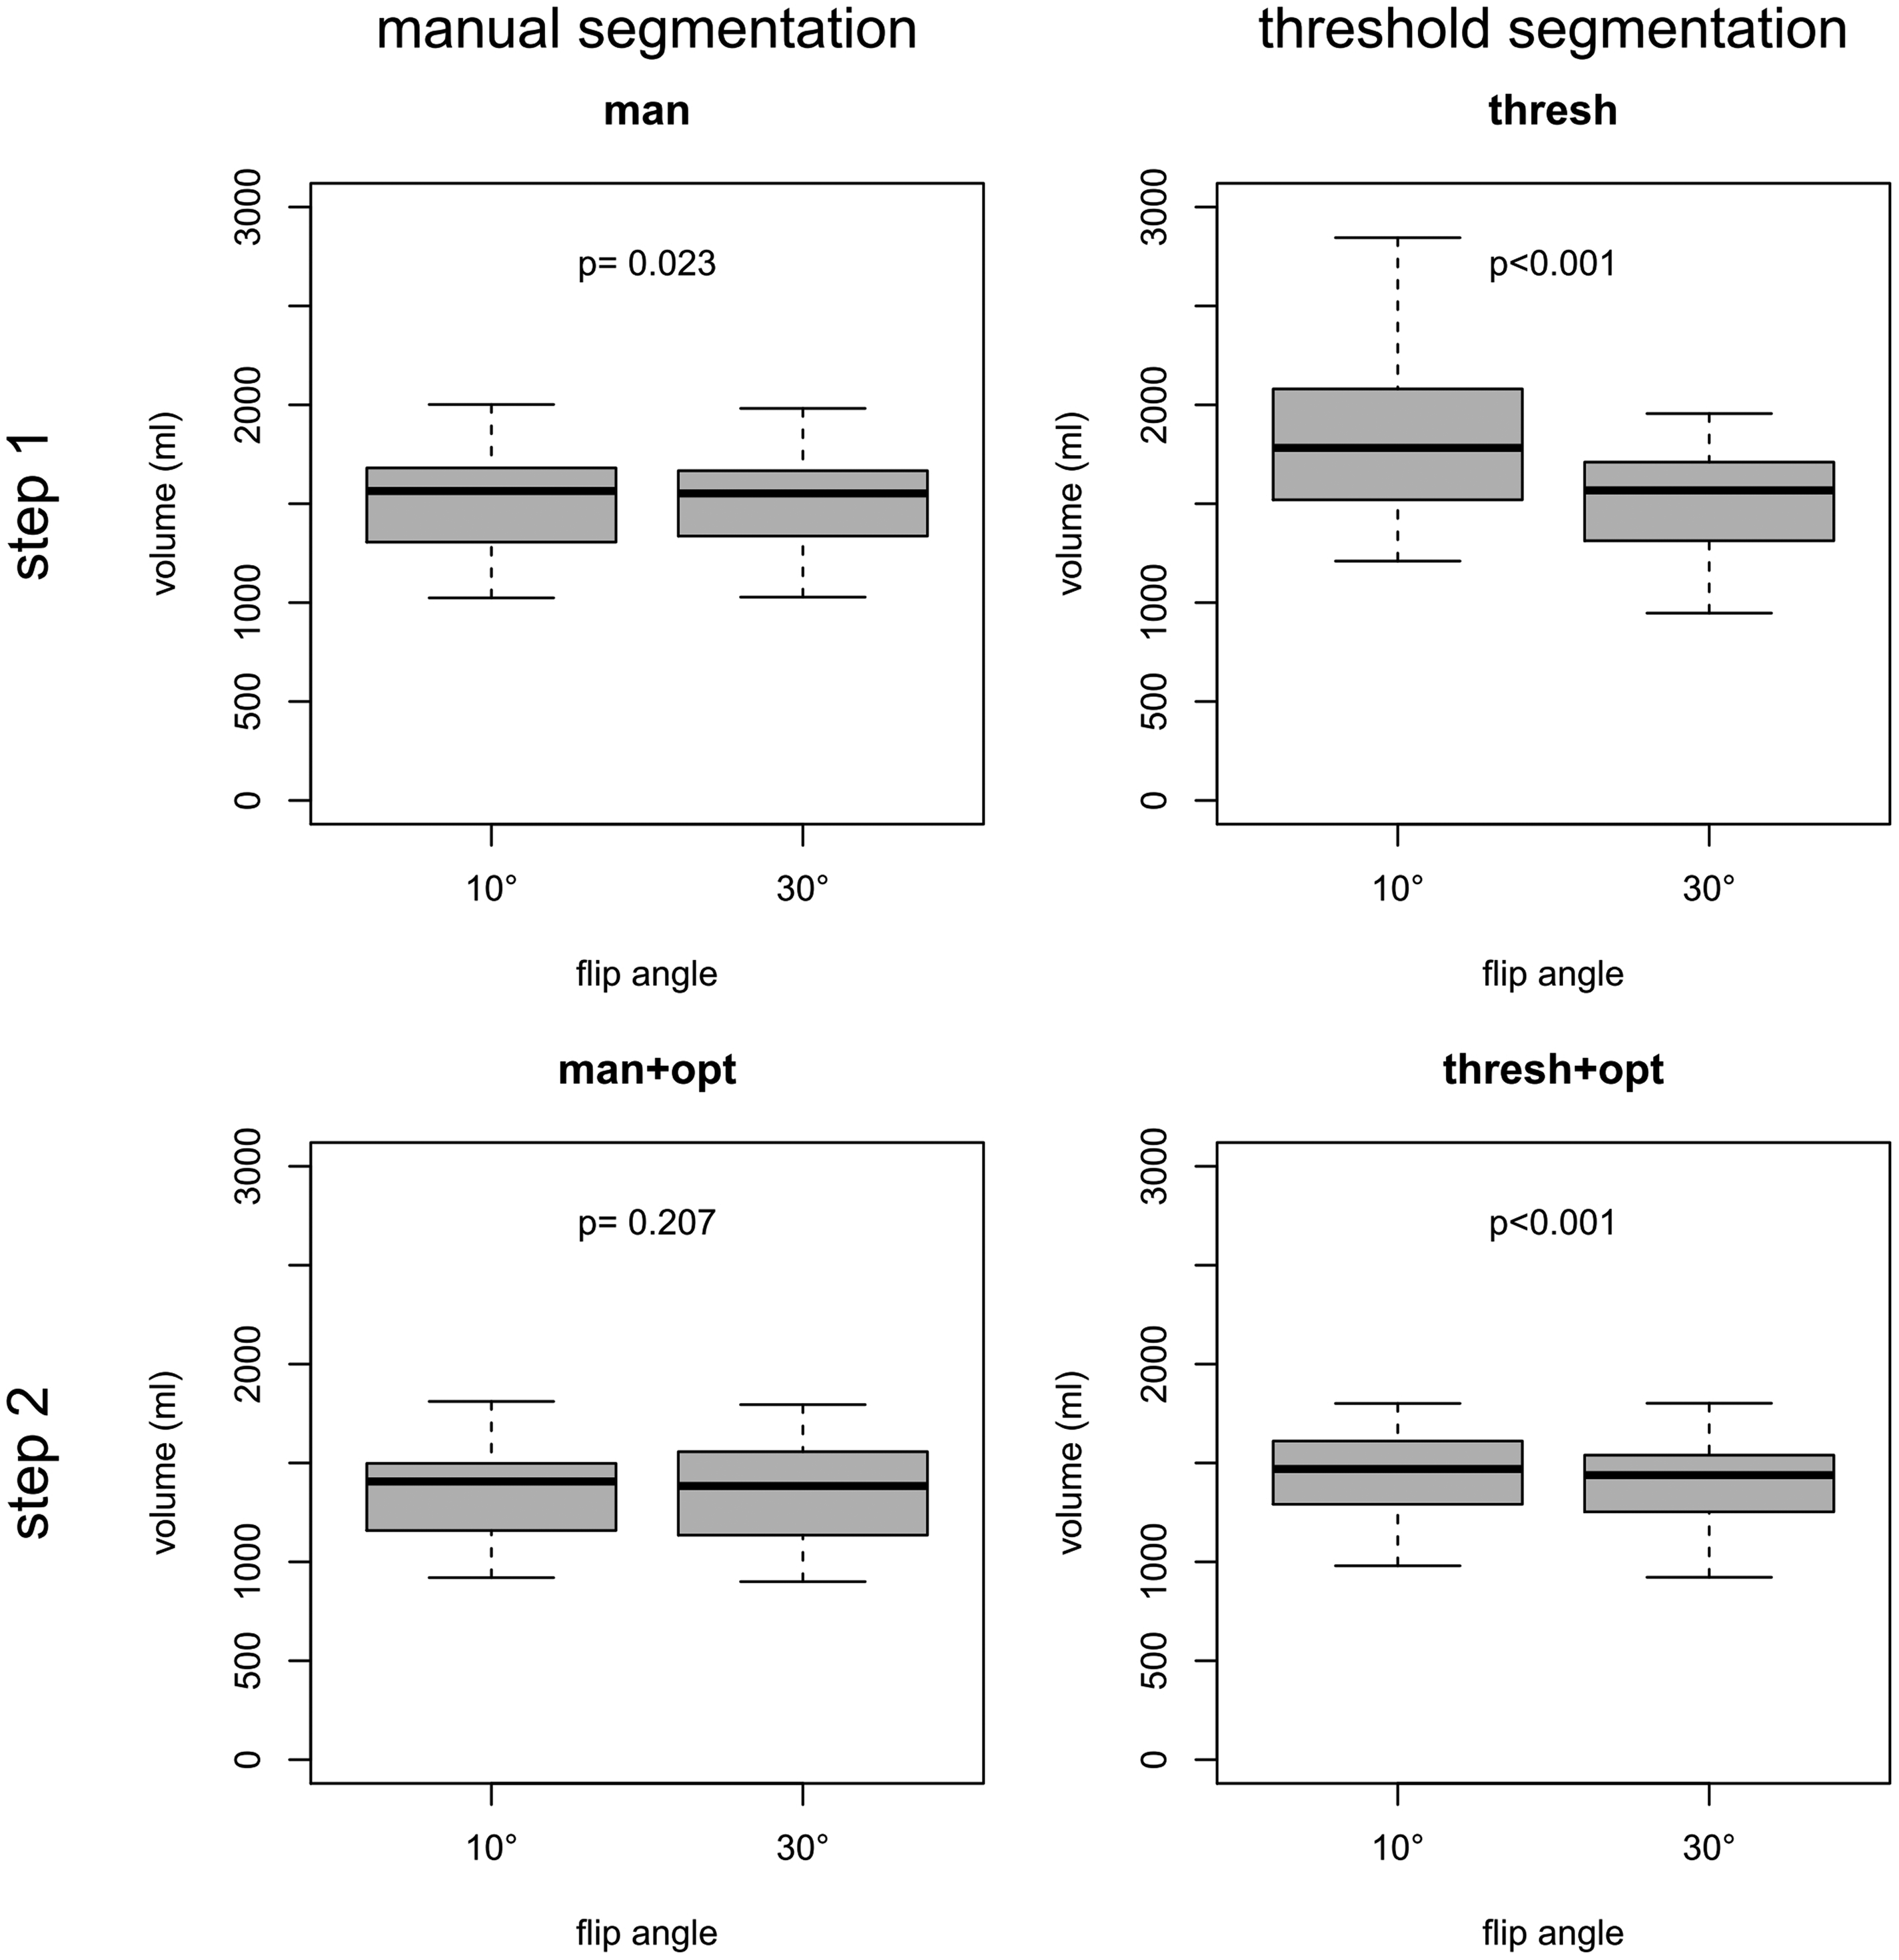
The volume differences for the measured functional liver volumes with thresh + opt (FA 10°) were significantly higher for both observers (median relative difference, 4–8%; P < 0.001) in comparison to the reference method (man + opt [FA 10°]), whereas no significant volume difference was found for the thresh + opt (FA 30°) in comparison to the reference method (median relative difference, 0–2%; P = 0.526/0.277) (Fig. 3).
Bland-Altman plots of differences for measured functional liver volumes (FA 30° versus 10°; manual and threshold-based segmentation both including threshold / manual optimization [man + opt and thresh + opt]).
Regarding the measured functional liver volumes, similar inter-observer differences were found on Bland-Altman plots for man + opt (FA 10°), man + opt (FA 30°), thresh + opt (FA 10°), and thresh + opt (FA 30°). The lowest agreement was found for thresh + opt (FA 10°); best agreement was found for man + opt (FA 30°) (Fig. 4).
Bland-Altman plots of inter-observer differences for measured liver volumes (manual and threshold-based segmentation both including threshold / manual optimization [man + opt and thresh + opt]).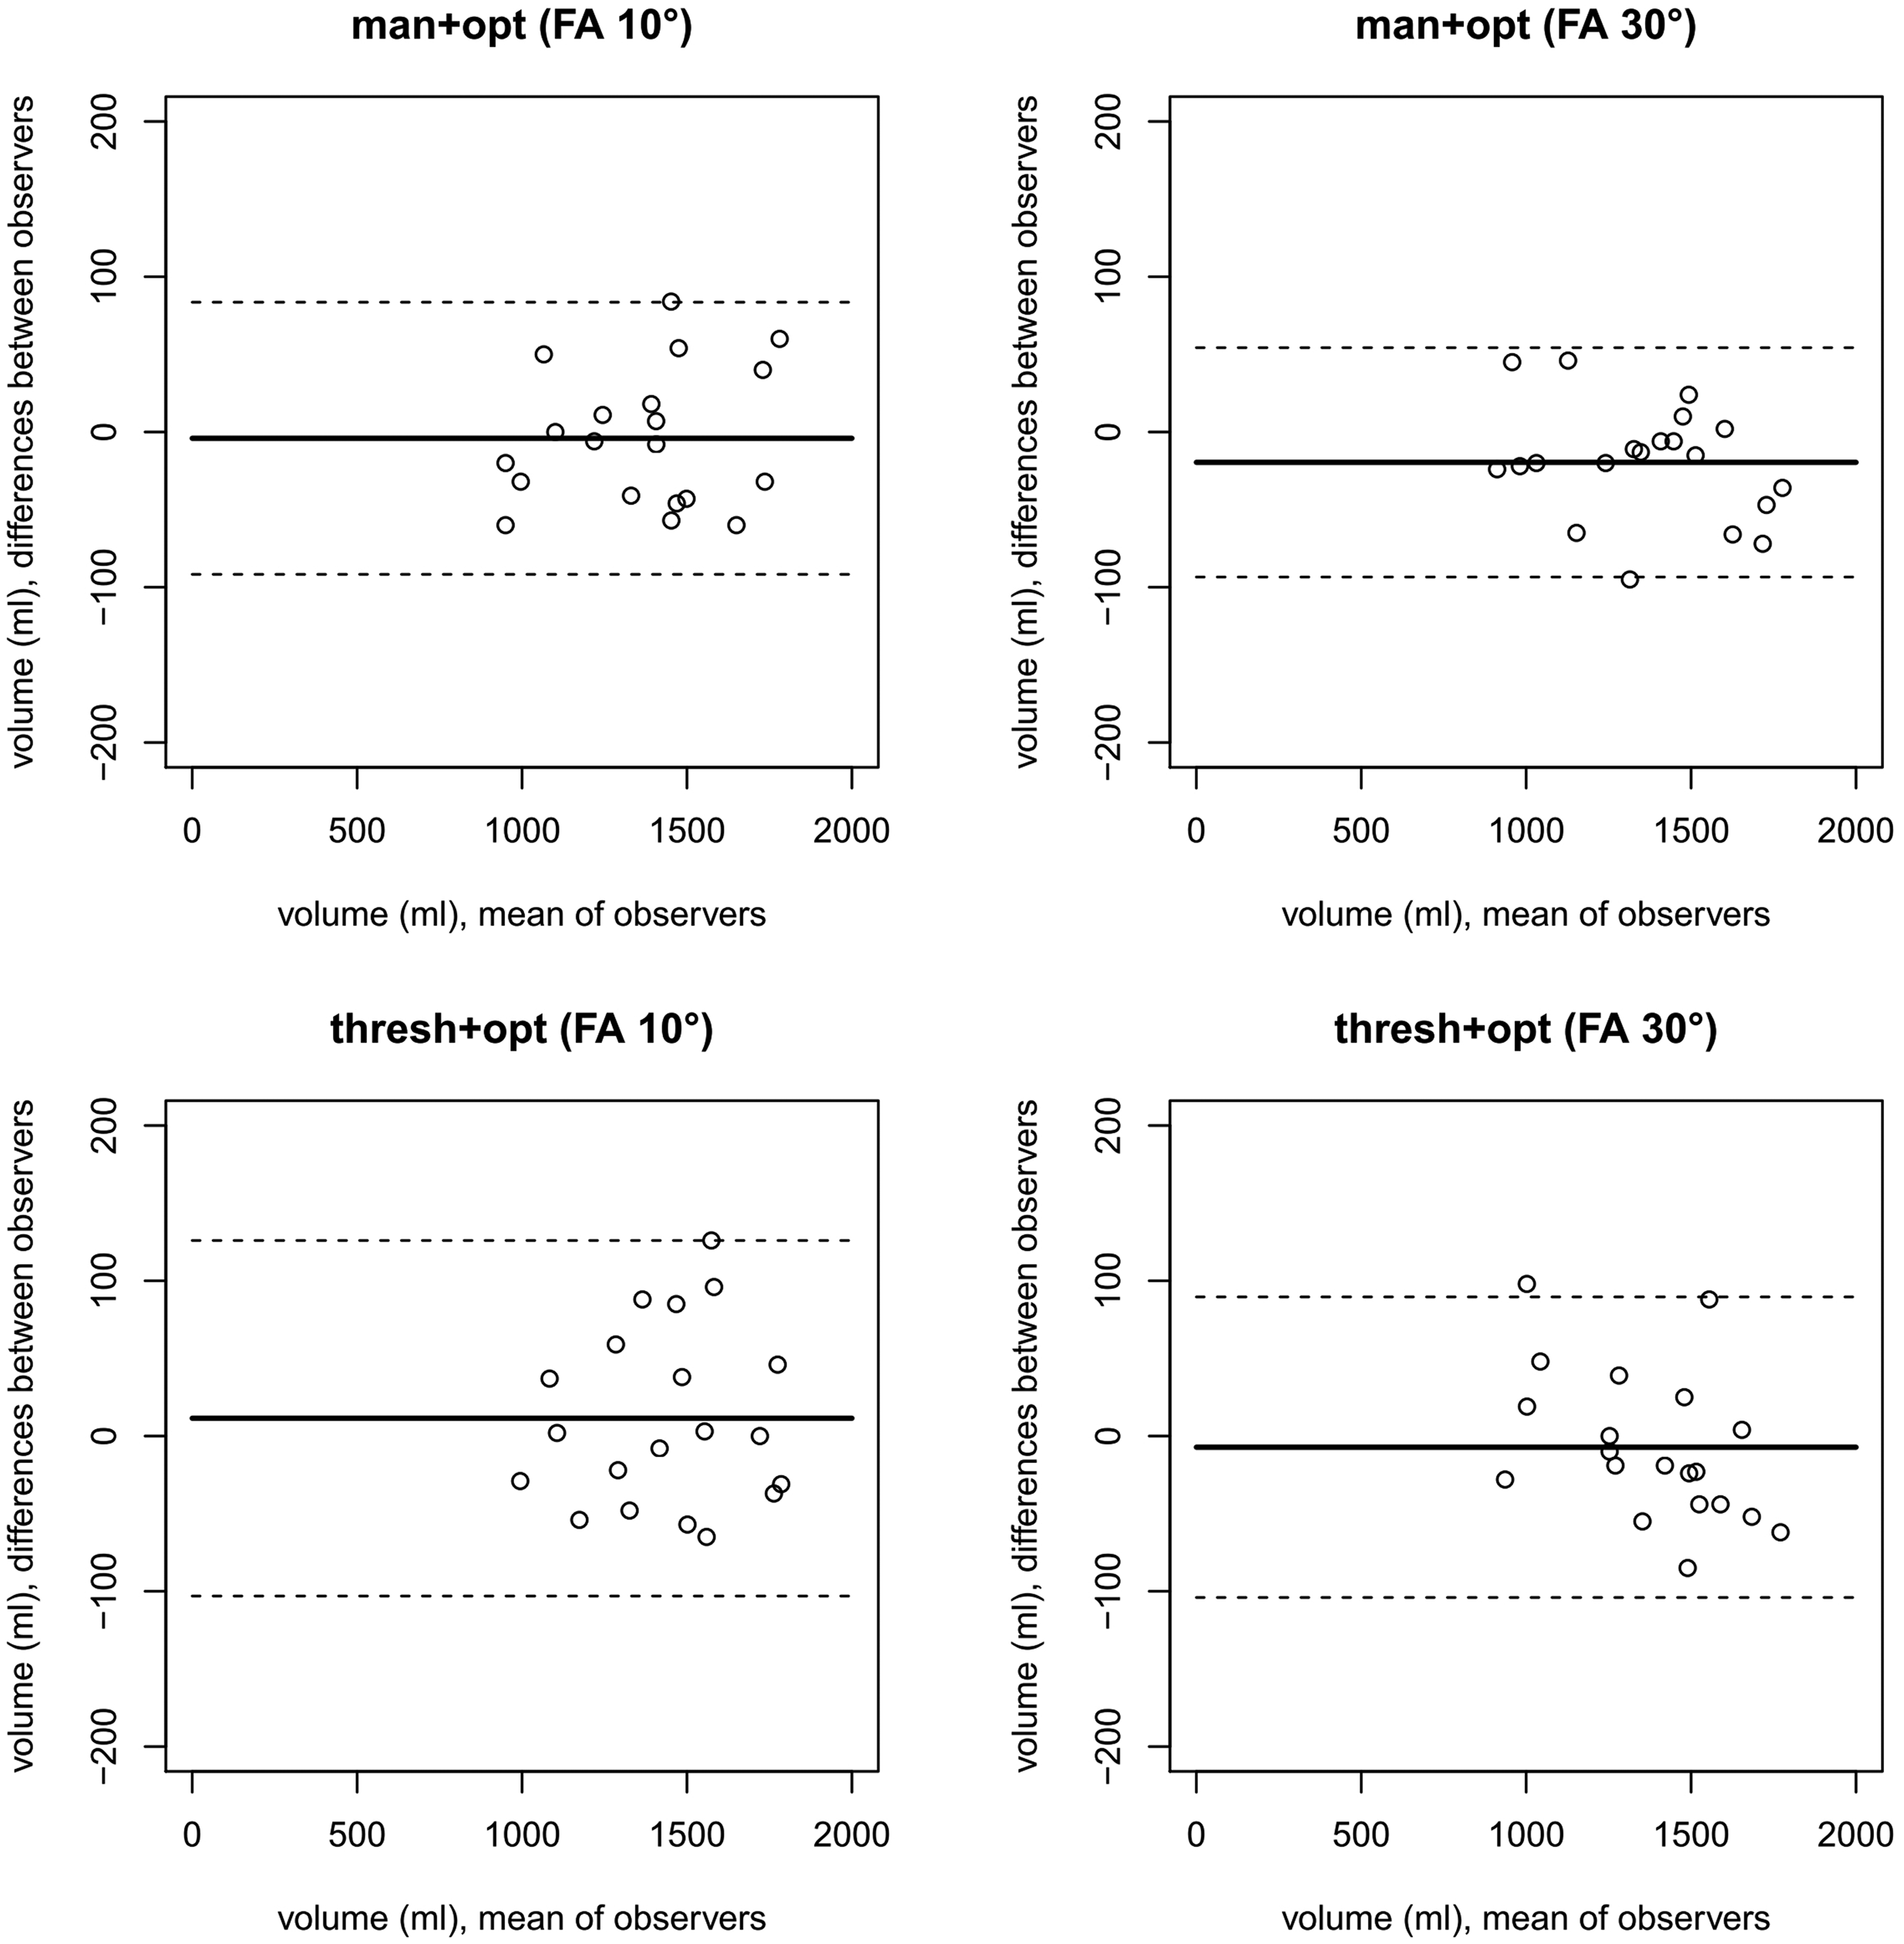
General linear model analysis showed no significant effect of the used segmentation method (P = 0.181), FA (P = 0.908), and observer (P = 0.903) on measured functional liver volumes.
Based on manual liver segmentation, the liver conversion factor to conclude from functional liver volume to total liver volume was calculated to be 10.2 (7.0/12.9)% (FA 10°) and 10.0 (6.4/13.5)% (FA 30°) for O1 and 10.7 (7.5/13.3)% (FA 10°) and 8.9 (6.1/12.6)% (FA 30°) for O2.
Segmentation times
Man (FA 30°) was slightly quicker as compared to man (FA 10°) (P = 0.012) (Table 4; Fig. 5). Thresh (FA 30°) and thresh + opt (FA 30°) were significantly quicker as compared to thresh (FA 10°) and thresh + opt (FA 10°) (P < 0.001) (Table 4; Fig. 5).
Boxplots of measurement times in association with different segmentation methods (manual [man] and threshold-based [thresh] segmentation both including threshold / manual optimization [man + opt and thresh + opt]), FA, and observer. Times (s) required for different segmentation procedures given as median (interquartile range).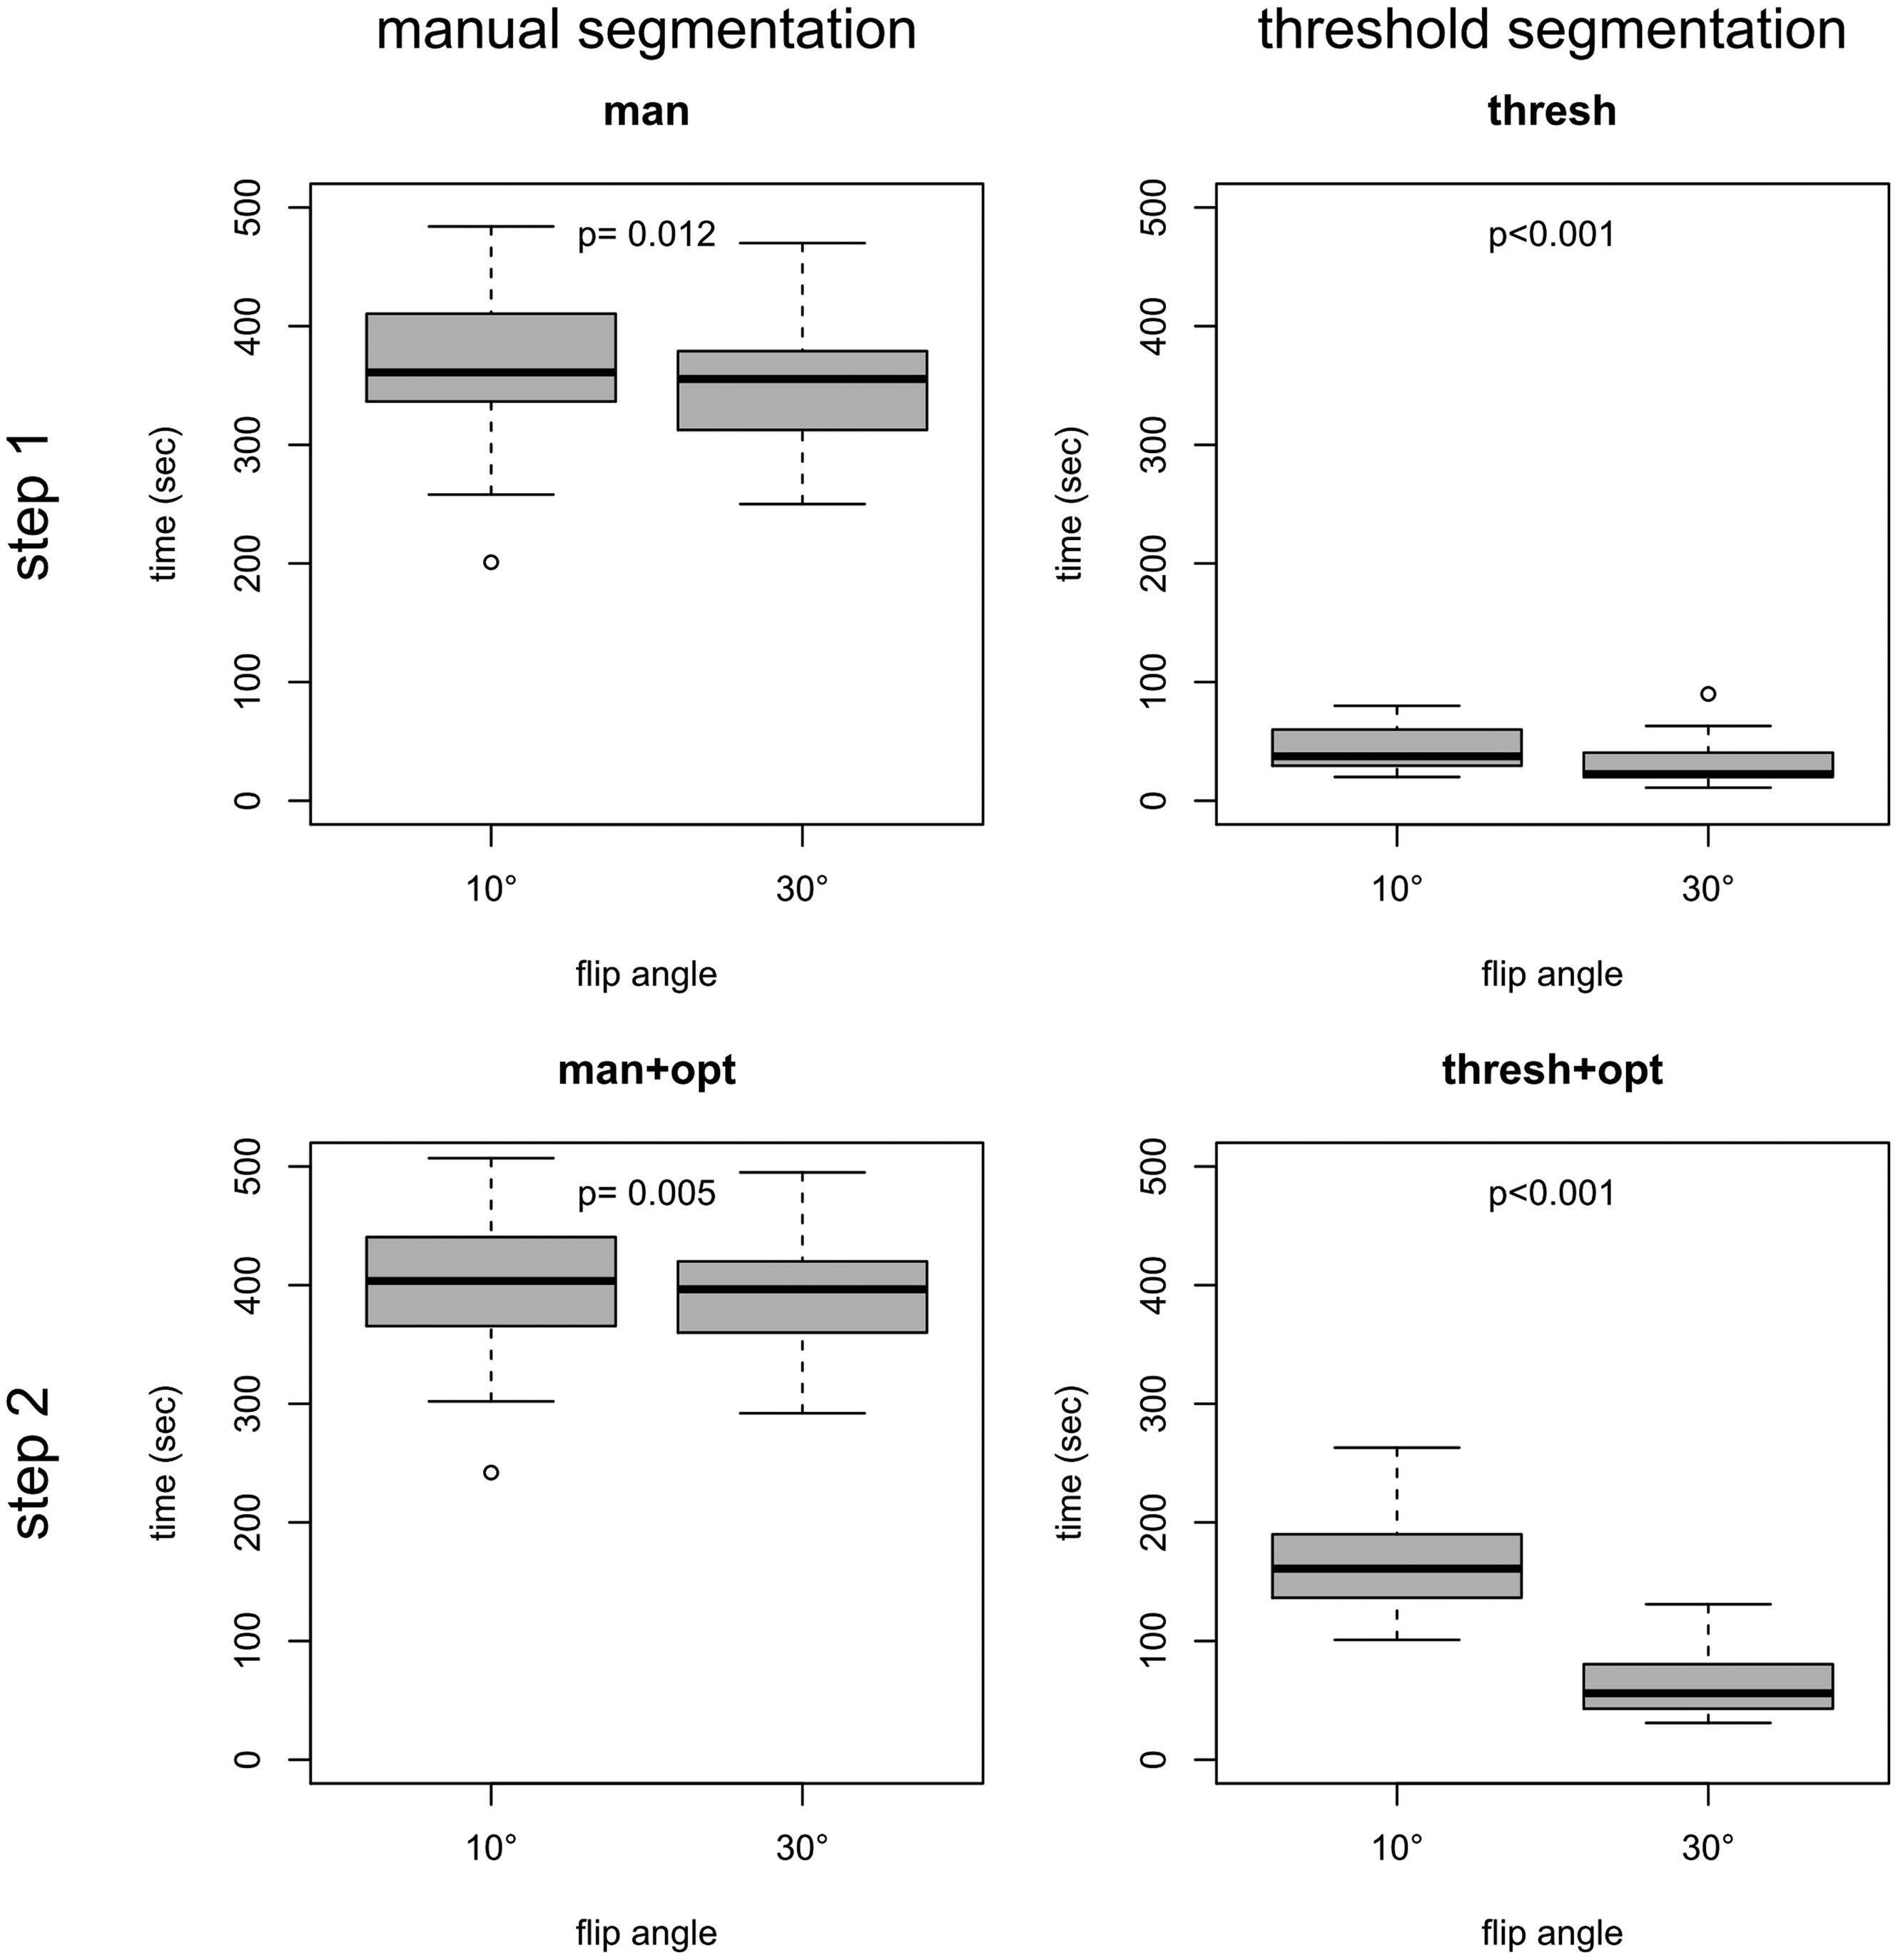

General linear model analysis revealed a significantly reduced processing time for thresh + opt compared to man + opt of the functional liver volume and a significant interaction of the used segmentation method and FA on time (P < 0.001, respectively). An almost significant effect on processing time was observed for the FA (P = 0.067), while there was no effect of the observer (P = 0.882).
Discussion
To determine the total liver volume, both manual CT and MRI volumetry has been proven to be useful and accurate (1,2,4,5,7,8,25–27). However, even with the introduction of different types of automated interpolation algorithms, volumetry is still time-consuming and often requires further manual optimization, e.g. due to the false inclusion adjacent organs in the automatically segmented stacks (1,2,5–10,28,29). Furthermore, to determine functional liver volume (total hepatocellular volume without vessels/bile ducts and eventual tumors) additional time is necessary. In Gd-EOB MRI, SI of the liver is very high in the hepatobiliary phase compared to the blood pool and the non-enhancing surrounding structures on typical 3D T1W GRE breath-hold sequences with FS (e.g. VIBE, THRIVE, LAVA). This high SI could enable threshold-based liver segmentation of the “functional liver volume”, which promises to be much quicker than manual slice-by-slice segmentation. However, for this approach, threshold-based and manual liver segmentation have to render comparable results. CT is currently accepted as the reference standard for liver segmentation, due to geometric accuracy. However, similarly accurate volume results were shown for Gd-EOB MRI (30). With general linear model analysis, we were able to show that the method of segmentation has no significant effect on measured functional liver volumes (P = 0.181). In a specific pairwise comparison of the functional liver volume measured by threshold-based segmentation on FA 10° images, there was a minor but significant difference of 4–8% (median) from the reference method volume. On the other hand, general linear model analysis showed a significantly reduced processing time with threshold-based segmentation compared to the manual approach. However, many extrahepatic structures are initially included in the measured liver volume after threshold-based segmentation, as they have a similar SI as Gd-EOB liver tissue, requiring a second time-consuming processing step with manual refinement. To overcome this problem, we modified the conventional 3D sequence (VIBE). Using a FA of 10–12° like in the conventional setting of this type of sequence, results in a compromise between Gd and background SI. To suppress background SI and to increase Gd-related SI, the FA can be increased similar to MR angiography techniques. Recently, it has been shown that increasing the FA of a T1 3D GRE sequence in the hepatobiliary phase of Gd-EOB MRI can significantly improve liver imaging quality in several aspects (15,17–19,21). In consequence, we applied this technique to the threshold-based liver segmentation in hope to decrease the amount of remaining extrahepatic structures after threshold application due to the higher contrast between the hyperintense hepatocellular tissue and the low background signal of non-Gd-EOB enhancing extrahepatic structures and blood pool. The segmentation volumes of this modified sequence were not significantly different from those measured with the manual reference method with a median relative difference of 0–2% confirming the suitability of the high FA for reliable volumetry. Furthermore, the resulting functional liver volume of FA 30° images was significantly closer to volumes rendered with the reference method than thresholding with FA 10° images. FA 30° images were also superior to FA 10° images with respect to processing time. The manual segmentation time was shorter compared to manual segmentation of the conventional FA 10° images for both observers. This is most likely owed to easy differentiation of the liver borders from adjacent structures. Using these FA 30° images for threshold-based volume segmentation, the processing time was shorter than thresholding of FA 10° images regarding both steps (threshold application and the subsequent manual refinement). This is owed to a simplified adjustment of the threshold differentiating between liver and non-hepatic structures due to the higher contrast and lower SI overlap of hepatic and non-hepatic tissue. In the FA 10° field, inhomogeneity was described as problematic in image thresholding (30). With FA 30° images this was not a relevant effect. Regarding the manual refinement, the objective advantage was a significantly smaller volume remaining to be removed after threshold application and the absence of falsely included structures directly adjacent to the liver. The latter was frequently present in the FA 10° datasets complicating the manual correction step. Furthermore, regarding segmentation times, the smallest inter-observer differences were observed for optimized threshold segmentation using FA 30° compared to all other segmentation approaches.
Determination of hepatic tumor load can be important for patient management such as in the planning of radioembolization (as a relevant parameter for dosimetry) or prognosis and therapy control. To conclude from the functional liver volume measured by thresholding, which naturally excludes non-hepatocellular spaces inside the liver like macrovascular structures, on the total liver volume, an empiric conversion factor would be needed. Comparing the “total liver volume” with the “functional liver volume” measured in this study, a conversion factor of approximately 10% of the functional liver volume describing the missing non-hepatocellular intrahepatic space was calculated. Assuming that vessel and bile duct volumes are not influenced by tumor volume, this conversion factor may also be used to calculate hepatic tumor burden when manual segmentation volumes (total liver volume with macrovascular structures and tumor) with secondary thresholding volumes (functional liver volume without macrovascular structures and tumor) are combined. However, as a future perspective, further studies are necessary to validate and verify this formula.
This study has some limitations. This is a retrospective study with a small number of patients. The actual liver volume of the examined livers is unknown, and no comparison with CT, as the accepted reference standard for liver volume segmentation was performed. However, Lee et al. already showed a good correlation between MR volumetry using hepatobiliary phase images of gadoxetic acid-enhanced MRI and CT volumetry (30). Furthermore, due to the known impact of liver dysfunction on biliary excretion of Gd-EOB, only patients with normal liver function and without liver steatosis were included. Hence, the translation of our results to patients with impaired liver function warrants further studies.
In conclusion, threshold-based liver segmentation using Gd-EOB MRI with a T1W 3D GRE sequence (here, VIBE; modified by increasing the FA from 10° to 30°) is a feasible, robust and time-efficient measurement tool to determine “functional liver volume” (i.e. hepatocellular volume without macrovascular structures). To calculate “total liver volume”, which is typically measured by conventional and time-consuming manual segmentation, from threshold-based “functional liver volume”, a conversion factor of 10% compensates for missing intrahepatic non-hepatocellular/non-tumorous structures.
Footnotes
Conflict of interest
Christian Grieser, Timm Denecke, Dominik Geisel, Lars Stelter, and Thula Cannon Walter received honoraries, fees and travel expenses from Bayer Schering Pharma, Berlin, Germany in the past. All other authors who took part in this study declared that they do not have anything to disclose regarding funding or conflict of interest with respect to this manuscript.
Funding
This research received no specific grant from any funding agency in the public, commercial, or not-for-profit sectors.