
Abstract
Background
Computed tomography angiography (CTA) is the most employed modality in the follow-up after endovascular aneurysm repair (EVAR) of abdominal aorta (AA); repeated standard controls expose patients to a high cumulative radiation dose (RD).
Purpose
To compare image quality and RD between 100 kV and 120 kV protocols in the same group of patients, previously treated with EVAR.
Material and Methods
Thirty patients, who had performed a previous CTA at 120 kV, underwent a low dose CTA with the same 64-detector machine. Images were evaluated qualitatively and quantitatively. The influence of body mass index (BMI), considering three groups of patients (normal weight, overweight, and obese) was also assessed. RD values (volume CT dose index and effective dose) were calculated.
Results
The mean qualitative score at 100 kV was worse than that at 120 kV, but the difference was not statistically significant and in all cases the image quality was satisfactory. At 100 kV the vessels mean attenuation value was significantly higher; signal-to-noise ratio significantly lower; contrast-to-noise ratio lower, but the difference was not significant. Regarding BMI, the difference in the qualitative score was significant in the obese group, but not in the other two groups; of the quantitative parameters only the signal-to-noise ratio presented a significant difference in the obese group. The average CTDIvol was reduced by 22% and the mean effective dose by 36% with the 100 kV protocol compared to the 120 kV protocol. Both differences were significant.
Conclusion
The 100 kV protocol allowed a consistent RD reduction, maintaining a satisfactory image quality in all patients.
Introduction
Various low dose protocols have been employed to contain radiation exposure in computed tomography angiography (CTA) studies. However, it is necessary that CT protocols modified to reduce the radiation dose maintain the same diagnostic accuracy of the standard ones. There are many strategies that can be used to reduce radiation exposure (1–5). Actually, the most employed approach is low tube voltage, that allows an important decrease of patient’s exposure, as dose varies with the square of the voltage (2); another advantage consists in an increased attenuation of iodinated contrast medium (CM) and consequently in an improved vessel conspicuity (2).
As regards CTA of abdominal aorta (AA) and its branches, a kilovoltage decrease from 120 up to 70 kV was proposed (6–16). However, the 70 kV technique was used only in thin patients (16); the 80 kV technique is not appropriate for obese patients, which were excluded from some studies (12,13), while some other studies – implemented on Asian populations, which generally have a lower body weight (60–65 kg) than that of European populations – included only sporadically obese patients (10,14,15). Also, the 90 kV technique was considered suitable mainly for patients with body weight <70 kg (8). Furthermore, regarding CTA examinations after endovascular aneurysm repair (EVAR) of AA, it has been proved experimentally that the 80 kV technique not always identifies small endoleaks (diameter ≤4 mm) not only in obese patients but also in intermediate body weight patients, for which the employment of protocols at 120 kV and 100 kV, respectively, is therefore advisable (17). Lower voltages can be proposed if latest generation CT machines with iterative reconstruction (IR) algorithms are available (1).
Considering on one hand the scant contributions in literature that have compared the 100 kV protocol with that at 120 kV (6,7) and on the other hand the need to contain the radiation dose in patients who undergo serial post-EVAR CTA exams without running the risk of overlooking small endoleaks, we set out to compare a 100 kV protocol to the standard one in the same group of patients, who performed both surveys after EVAR at different times. We used a 64-slice CT machine, equipped with the automatic mA modulation software but lacking of IR algorithms; the influence of patients’ body mass index (BMI) on the images was also evaluated.
Material and Methods
Thirty patients, previously treated with EVAR, underwent CTA investigations at low kilovoltage for the study of AA and iliac arteries between July 2012 and March 2013. The population consisted of 30 patients (27 men, 3 women; age range, 58–86 years; mean age, 73.1 ± 1.4 years).
The following anthropometric parameters were considered: weight, height, and BMI. The average weight was 74.3 ± 1.7 kg (range, 55–110 kg); the average height was 172 ± 2 cm (range, 153–184 cm); BMI mean value was 25.5 ± 0.5 kg/m2 (range, 20.2–32.1 kg/m2). The patients were divided into three groups (18): 14 normal weight patients (18.5 ≤ BMI < 25), 12 overweight patients (25 ≤ BMI < 30), and four obese patients (BMI ≥30).
The patients had performed a previous study with the same machine at 120 kV. The mean time between the two examinations was 11.8 months (range, 6–13 months). Significant differences of BMI values between the first and the second examination were not recorded.
Examination technique
All examinations were performed with a 64-detector CT scan (Aquilon 64, Toshiba Medical Systems, Tokyo, Japan). The voltage was set at 100 kV, with an automatic mA modulation between 80 and 440 mA and a standard deviation (SD) value of 15. The other parameters were: collimation, 64 × 0.5 mm; gantry rotation time, 0.5 s; pitch, 0.828. Patients were positioned feet first and the acquisition was performed in the cranio-caudal direction from about 2 cm above the diaphragm to the greater femoral trochanter. The reference scan had a voltage of 120 kV with mA modulation between 80 and 440 mA and a SD value of 12.5.
An 18-gauge cannula was placed into a superficial vein located in the antecubital fossa or forearm. A non-ionic CM (lobitridolo 350 mg I/mL; XENETIX 350, Guerbet, Aulnay-sous-Bois, France) was used; average injected volume was 106.5 mL (range, 80–125 mL) with a constant flow rate at 3.5 mL/s, followed by administration of 40 mL of saline solution.
CT scan acquisition was initiated either automatically (automatic sure-start) or manually (manual sure-start), once the previously set threshold attenuation value inside the aorta (equal to 150 HU) was achieved.
Image analysis
All images were reviewed in consensus by two radiologists, using a PACS workstation (Synapse version 3.2.1 sr 361, Fujifilm Medical Systems, Tokyo, Japan). In a first session examinations performed with the 120 kV protocol were reviewed and in a second session (2 weeks after the first one) the scans acquired with the 100 kV protocol were analyzed.
Only the axial images in angiographic phase, with a thickness of 1 mm, were assessed for a qualitative and a quantitative analysis.
Image quality assessment
Parameters used for the qualitative evaluation of the images.
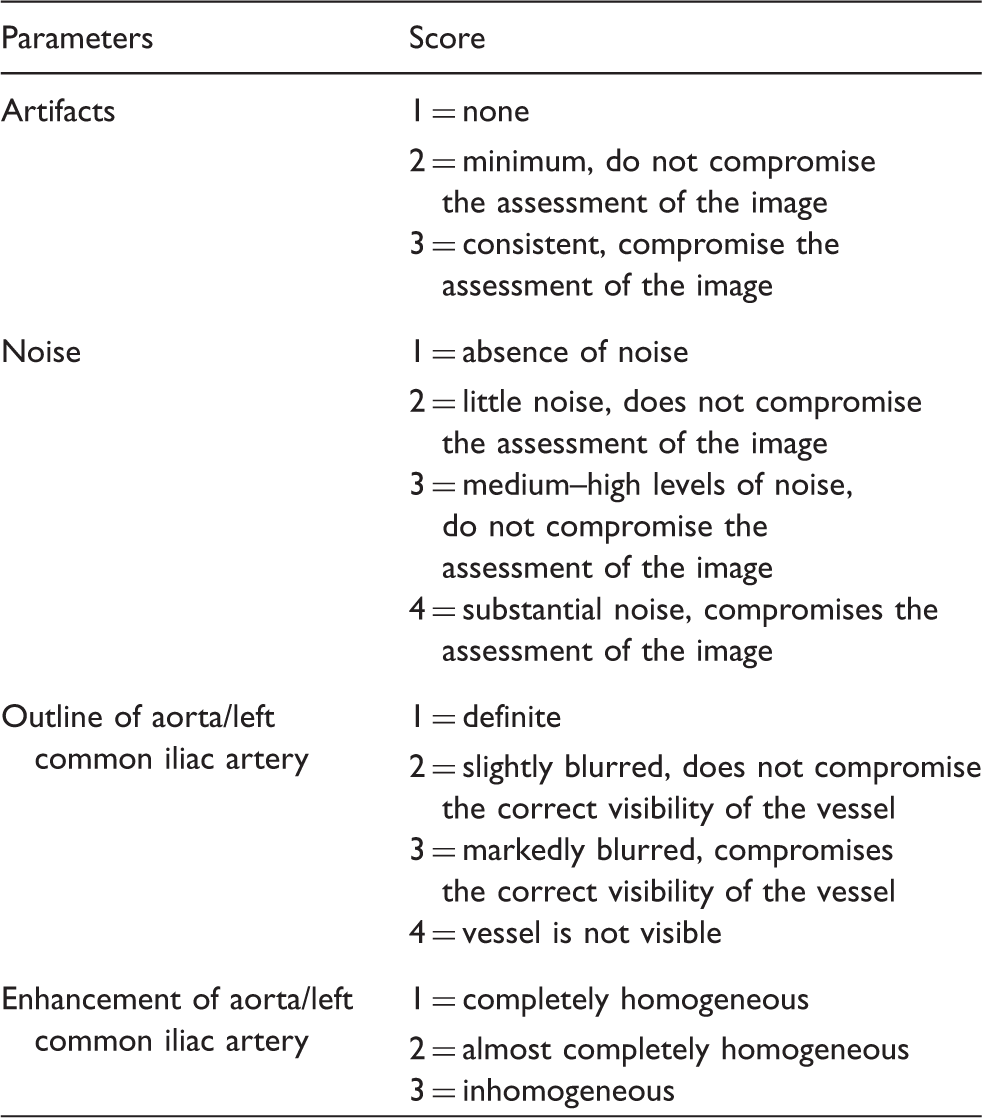
The scores were summed up for each patient, resulting in a total score in the range of 4–14; the cut-off in order to consider an image acceptable was set at 9 (artifacts, ≤2; image noise, ≤3; vessel outline, ≤2; vessel filling, ≤2). The scores obtained with the two protocols were then compared. We also evaluated the influence of BMI on the various parameters and in particular on the overall score.
Moreover, the visibility of small vessels (I, II, and III order branches of the superior mesenteric artery and polar renal arteries) was evaluated.
Quantitative assessment
The mean attenuation value (MAV) in the aorta and iliac arteries was measured in Hounsfield units (HU) within circular regions of interest (ROIs), positioned at the center of the vessels at different levels. All ROIs, having an area of 1.5 cm2, were placed excluding vessel wall calcifications, components of the endograft or metal artifacts related to their presence; for each ROI standard deviation (SD) was also recorded. A first ROI (ROI 1) was positioned in the juxtarenal AA (proximal anchoring zone and renal arteries), a second ROI (ROI 2) into the main body of the stent-graft and a third ROI (ROI 3) into the left branch of the stent-graft at the iliac axis level (11). Finally, three ROIs were located in the right psoas in order to assess the contrast-to-noise ratio (CNR) (Fig. 1).
Comparison of images obtained applying the 100 kV protocol (a–c) and the 120 kV protocol (d–f) in an overweight patient (BMI, 26.2 kg/m2). ROIs positioned into the aorta – at the level of the origin of the renal arteries (a, d) and 1 cm above the carrefour (b, e) – and at the level of the left common iliac artery (c, f) are shown, with the relative attenuation values (HU) and standard deviation (SD). In the low dose protocol the aorto-iliac tract mean attenuation value was significantly major in the images obtained with the 100 kV protocol (395.3 HU at 100 kV vs. 368.2 HU at 120 kV); the value of SNR was significantly lower in the 100 kV protocol (10.7 at 100 kV vs. 16.6 at 120 kV), whereas the reduction in the value of CNR was not significant (8.9 at 100 kV vs. 10.8 at 120 kV). From a qualitative point of view, both images have achieved a score largely <9 (5 in the 100 kV protocol and 4 in the 120 kV protocol: the difference of one point is related to the increase of image noise encountered in the low dose protocol).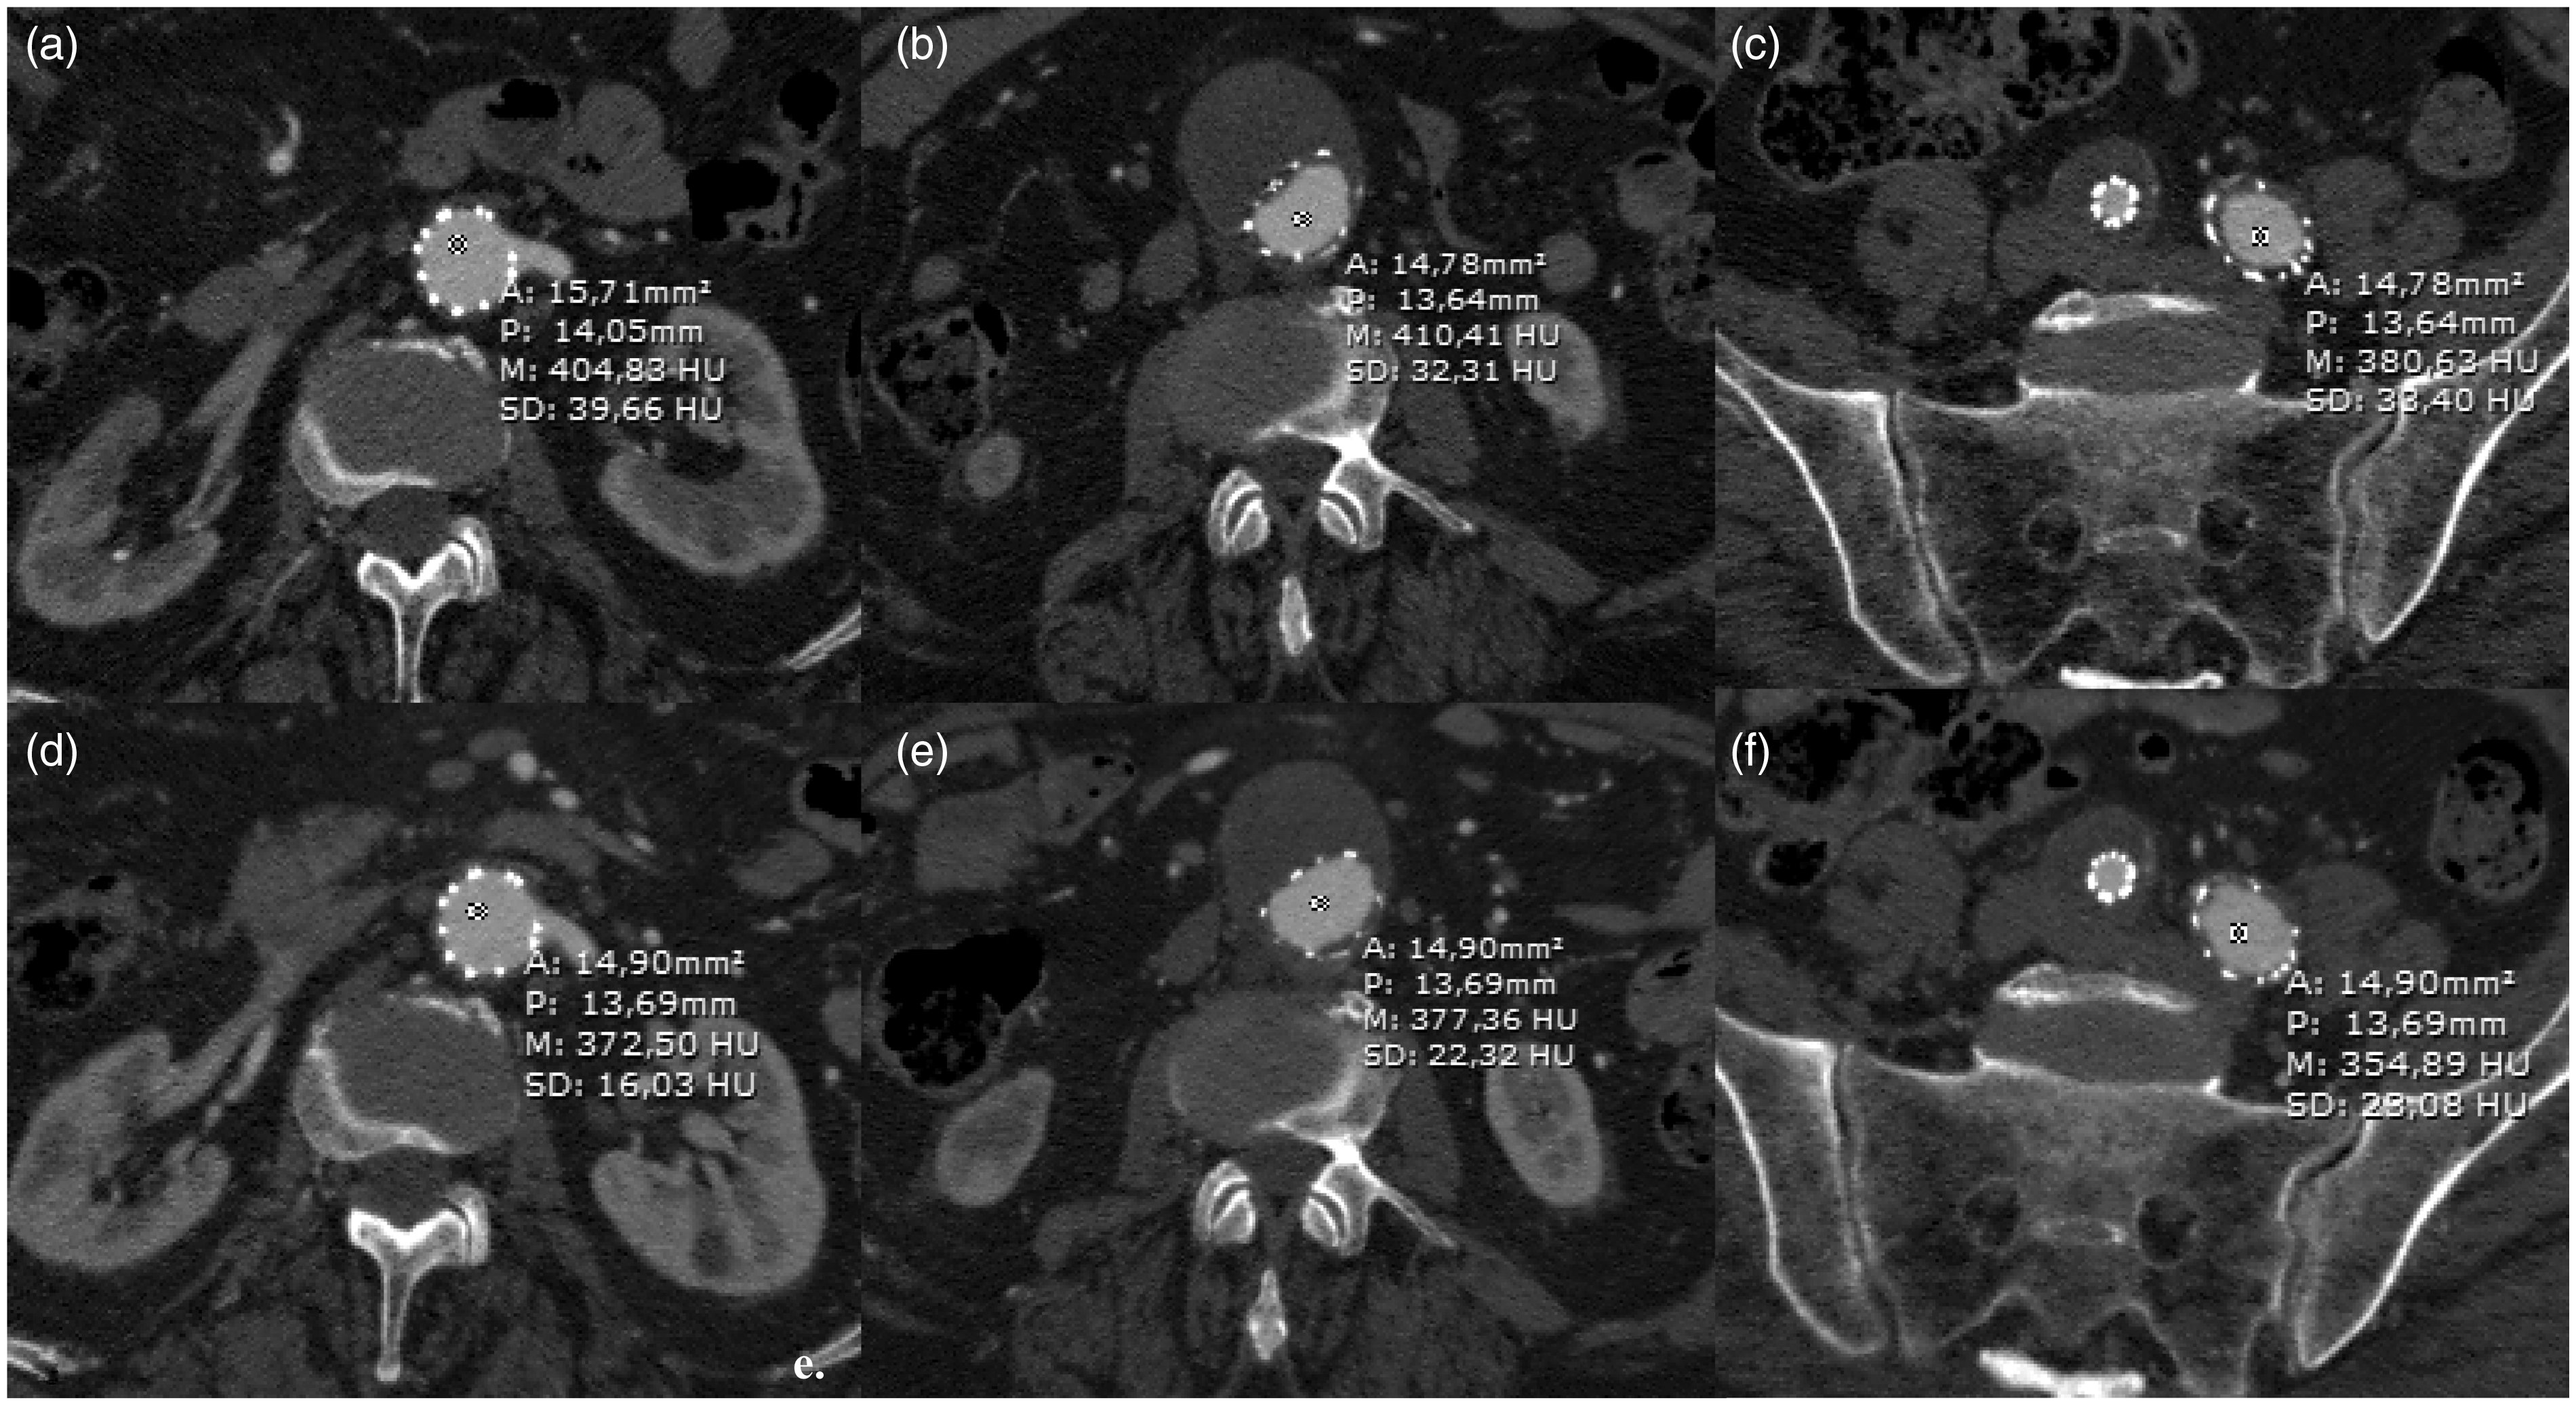
For each patient, the MAV recovered from the three ROIs (ROI 1 + ROI 2 + ROI 3/3) was calculated and the mean SD value (SD 1 + SD 2 + SD 3/3) was also computed.
Moreover, for each patient the signal-to-noise ratio (SNR) was calculated, according to the formula (8): SNR = aorto-iliac MAV/aorto-iliac mean SD.
Thereafter, CNR was calculated according to the formula (9): CNR = (aorto-iliac MAV - psoas muscle MAV)/average SD; average SD was computed from the average between the aorto-iliac mean SD value and the psoas muscle mean SD value.
We then proceeded to compare the values obtained with the two protocols.
Finally, in both protocols we evaluated the influence of BMI on the three parameters.
Radiation dose estimation
We estimated for each patient the volume CT dose index (CTDIvol) values in both protocols; we then calculated the percentage of dose reduction (DR%) according to the formula (19): DR% = 100 × (CTDIvol at 120 kV – CTDIvol at 100 kV)/CTDIvol at 120 kV, and computed an average of the obtained values.
In the same way, we calculated the effective dose values and estimated the percentage of dose reduction in the low dose protocol compared to the standard one. Effective dose was determined using organ-weighting coefficients established by the ICRP 103 (20).
Statistical analysis
For the statistical analysis Student's t-test was used. A P value <0.05 was considered significant.
Results
Image quality assessment
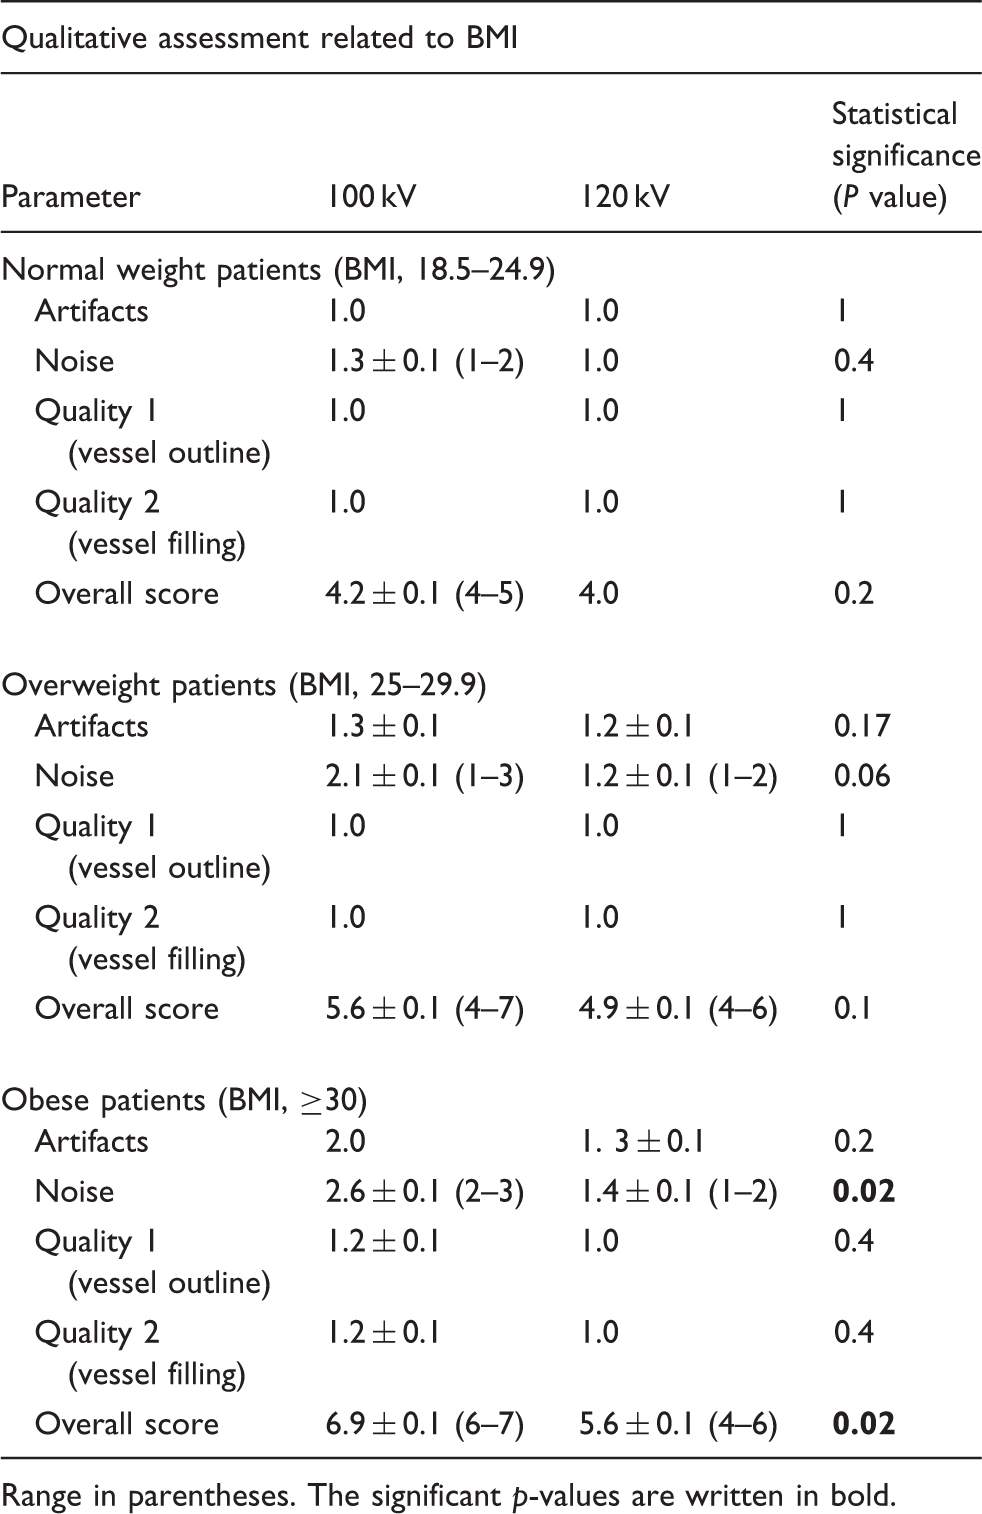
Comparison between 100 kV and 120 kV protocols. Summary table of the values resulting from the qualitative assessment.
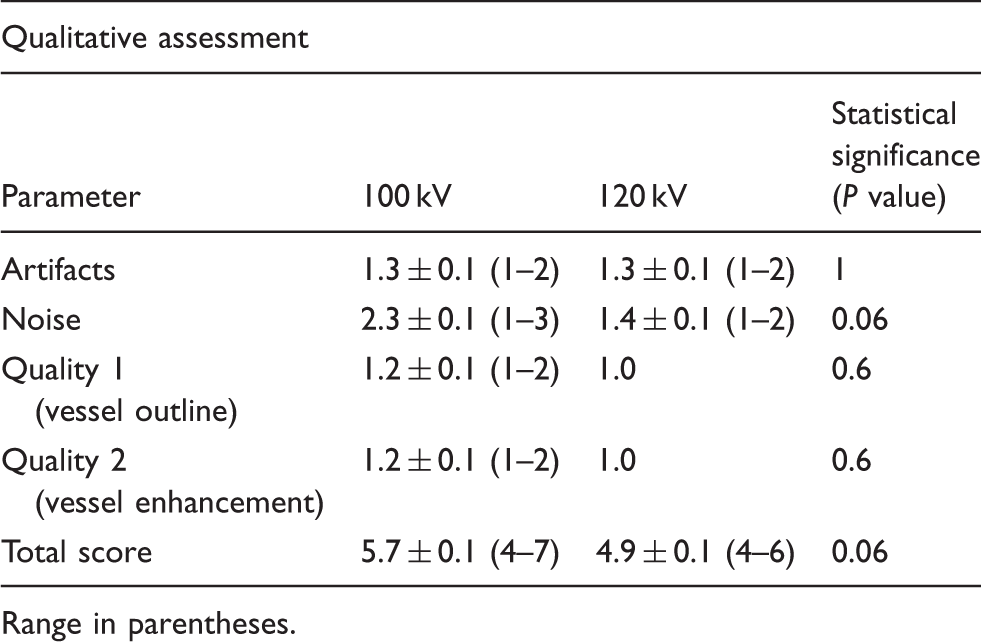
Range in parentheses.
The IN increase was mild in normal weight and overweight patients, greater in obese patients (Table 3). It caused a slight increase of the overall score in normal weight and overweight subjects (Figs. 1 and 2), but only in obese patients the increase was significant (6.9 ± 0.1 vs. 5.6 ± 0.1) (Fig. 3).
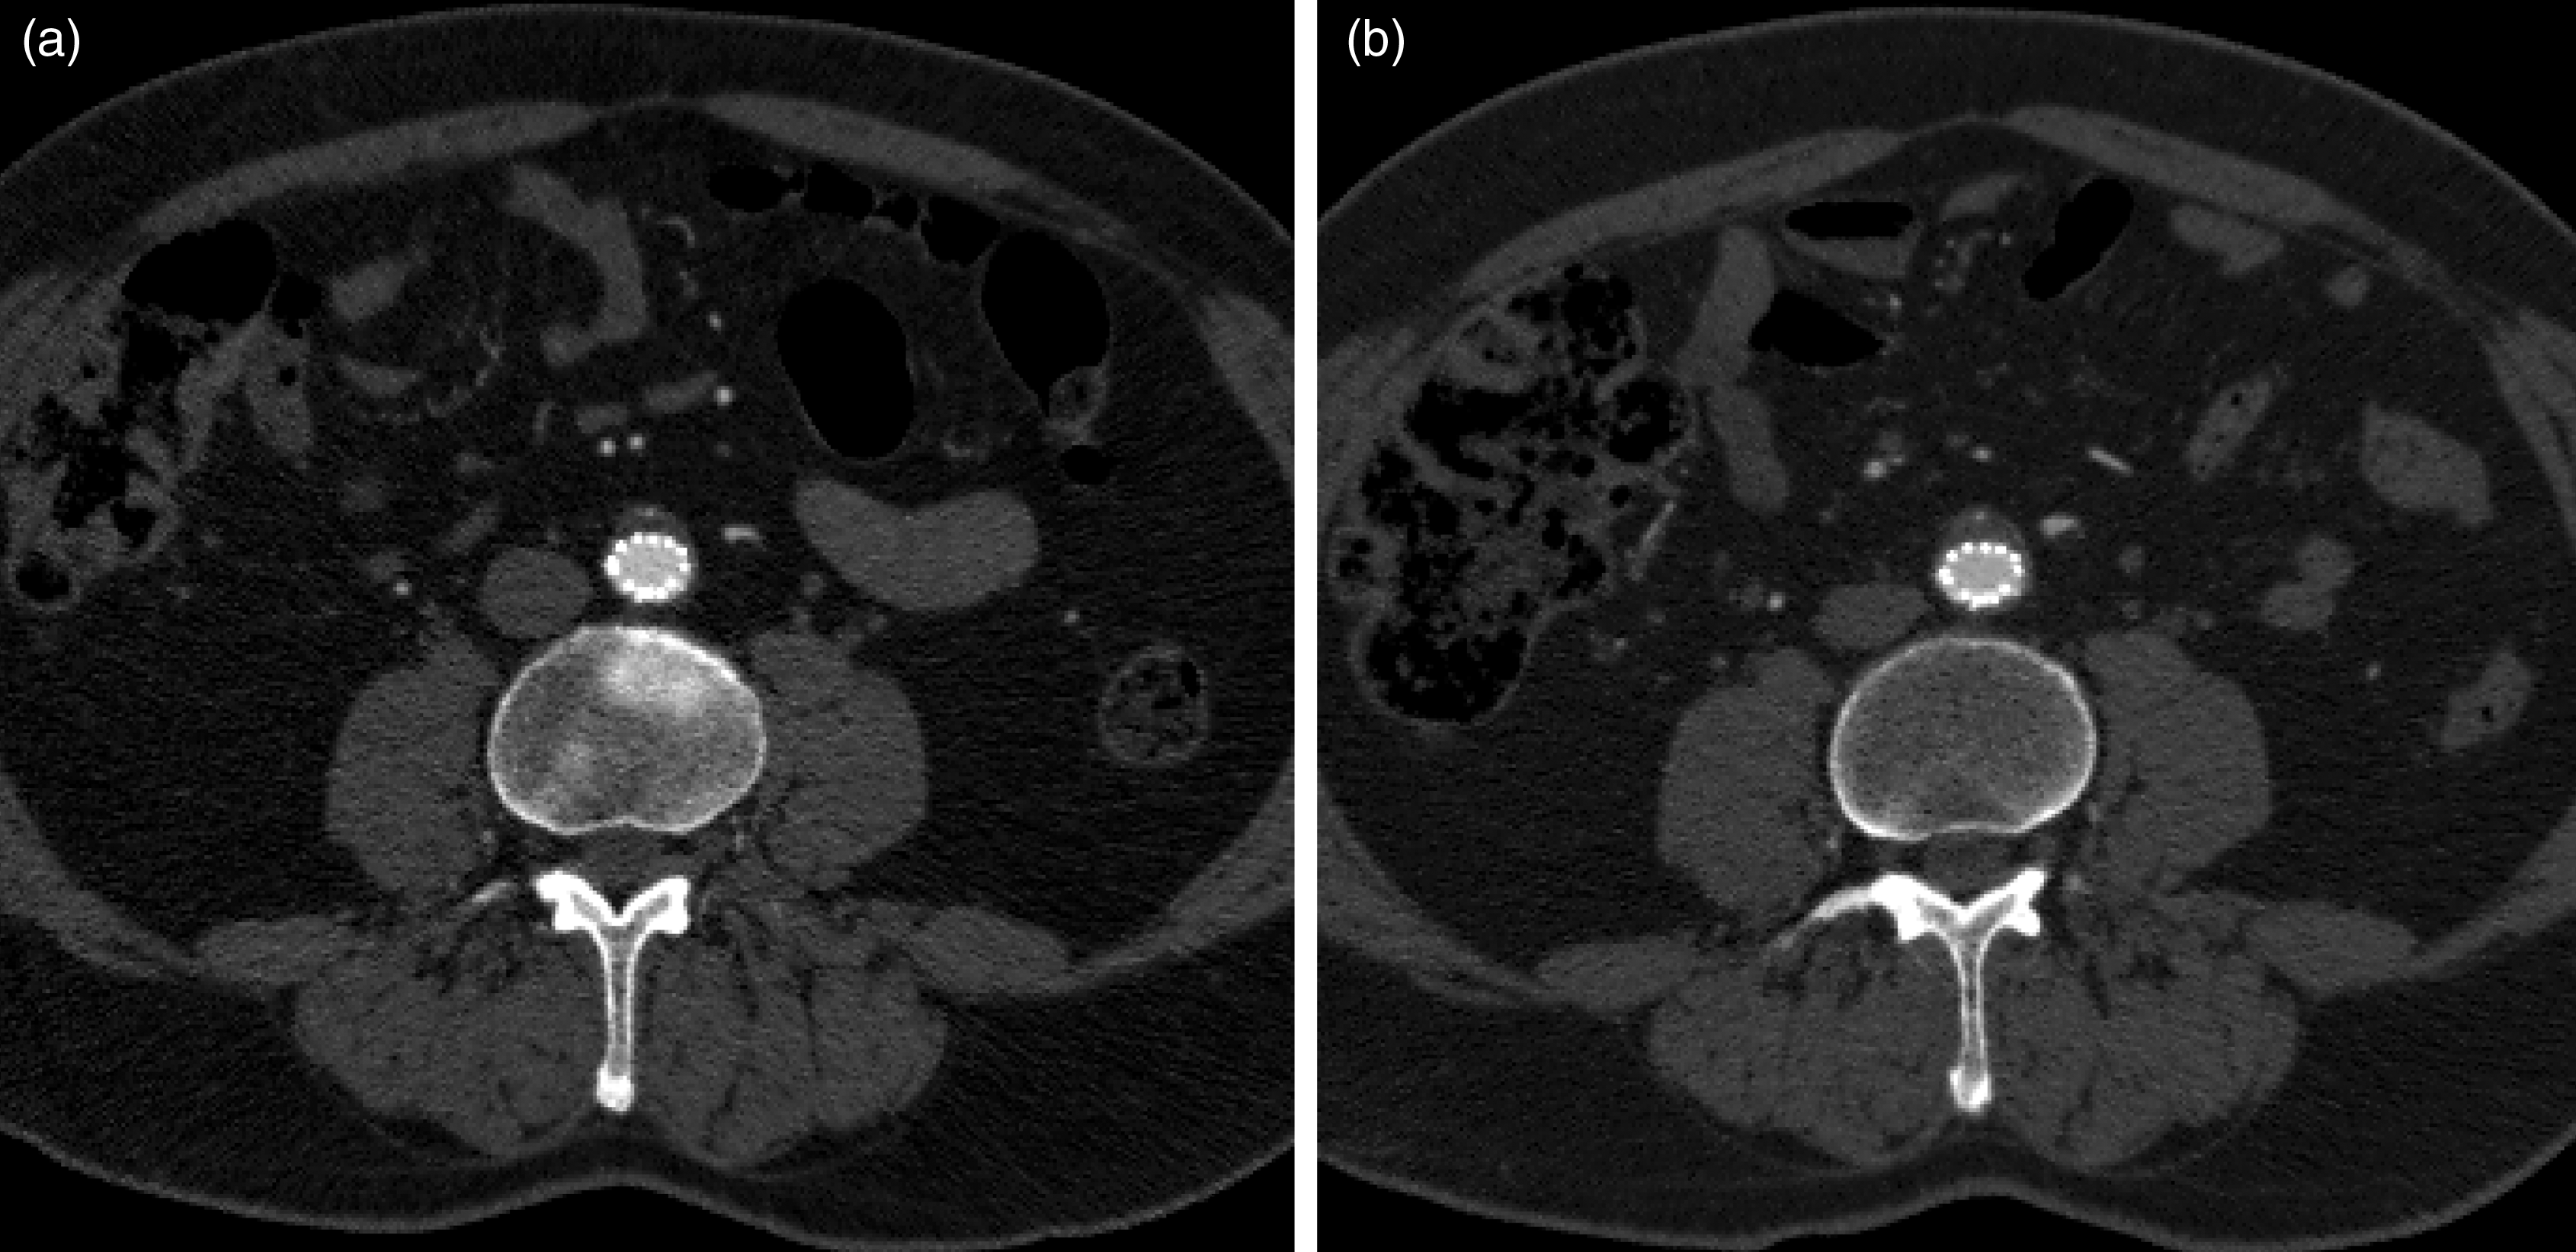
Comparison of images obtained with the 100 kV protocol (a) and with the 120 kV protocol (b) in a thin patient (BMI, 21.2 kg/m2). In the low dose protocol the important increase in the average attenuation value of the vessels (433 HU at 100 kV vs. 351 HU at 120 kV), despite the increase in image noise, allowed to obtain a small reduction in the SNR value (11.1 at 100 kV vs. 12.3 at 120 kV) and a mild increase in the CNR value (10.9 at 100 kV vs. 10.1 at 120 kV). From a qualitative point of view, the images were equal (score 4). Comparison of images obtained with the 100 kV protocol (a) and with the 120 kV protocol (b) in an obese patient (BMI, 31.8 kg/m2). In the low-dose protocol the important increase of image noise, despite an increase in the average attenuation value of the vessels (431 HU at 100 kV vs. 384 HU at 120 kV), allowed a significant reduction of both the SNR (8.5 at 100 kV vs. 14 at 120 kV) and the CNR (8.9 at 100 kV vs. 13.2 at 120 kV) values. From a qualitative point of view, the increase of image noise determines a 2 points higher score in the images obtained applying the low dose protocol (6 at 100 kV vs. 4 at 120 kV). Comparison between 100 kV and 120 kV protocols. Summary table of the values resulting from the qualitative assessment in relation to the different BMI (normal weight, overweight, and obese patients). Range in parentheses. The significant p-values are written in bold.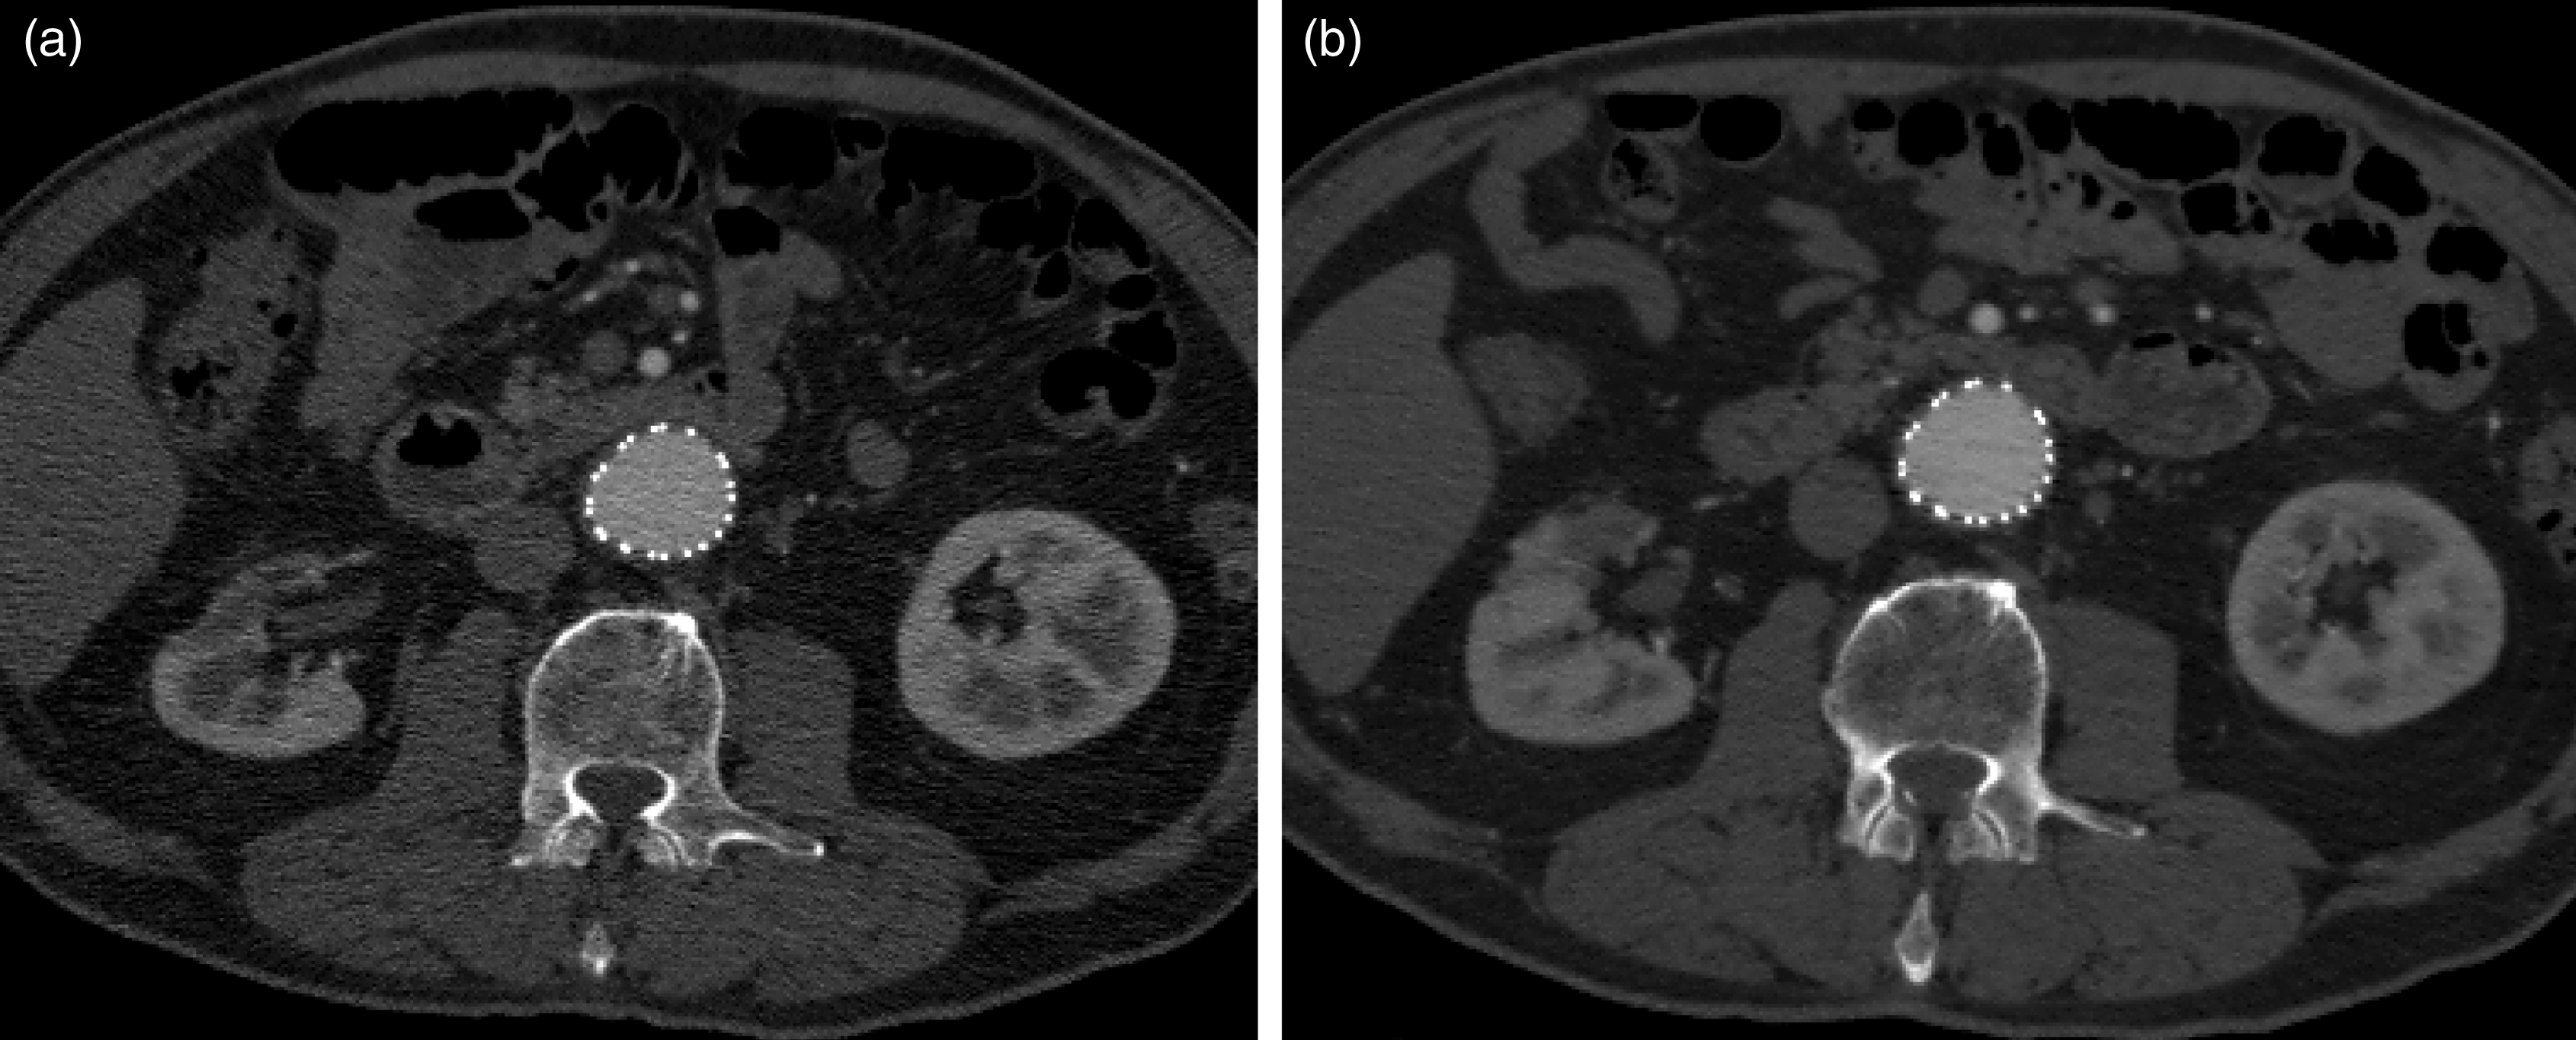
Regarding small vessel visibility, polar renal arteries were found in six patients in both protocols; mesenteric arcades, up to those of third order, were always displayed in the 100 kV protocol, with no significant differences when compared to the standard one.
Quantitative assessment
Comparison between 100 kV and 120 kV protocols. Summary table of the values resulting from the quantitative assessment.
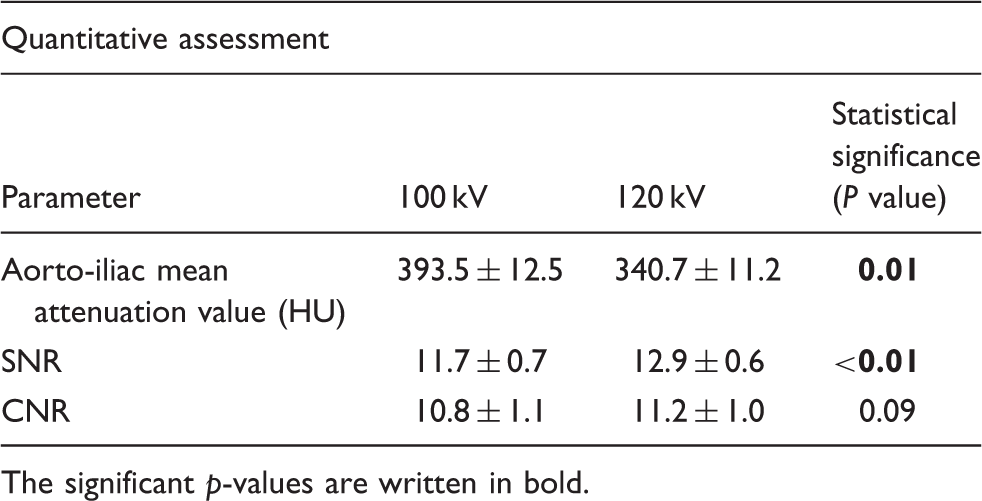
The significant p-values are written in bold.
Comparison between 100 kV and 120 kV protocols. Summary table of the values resulting from the quantitative assessment in relation to the different BMI (normal weight, overweight, and obese patients).
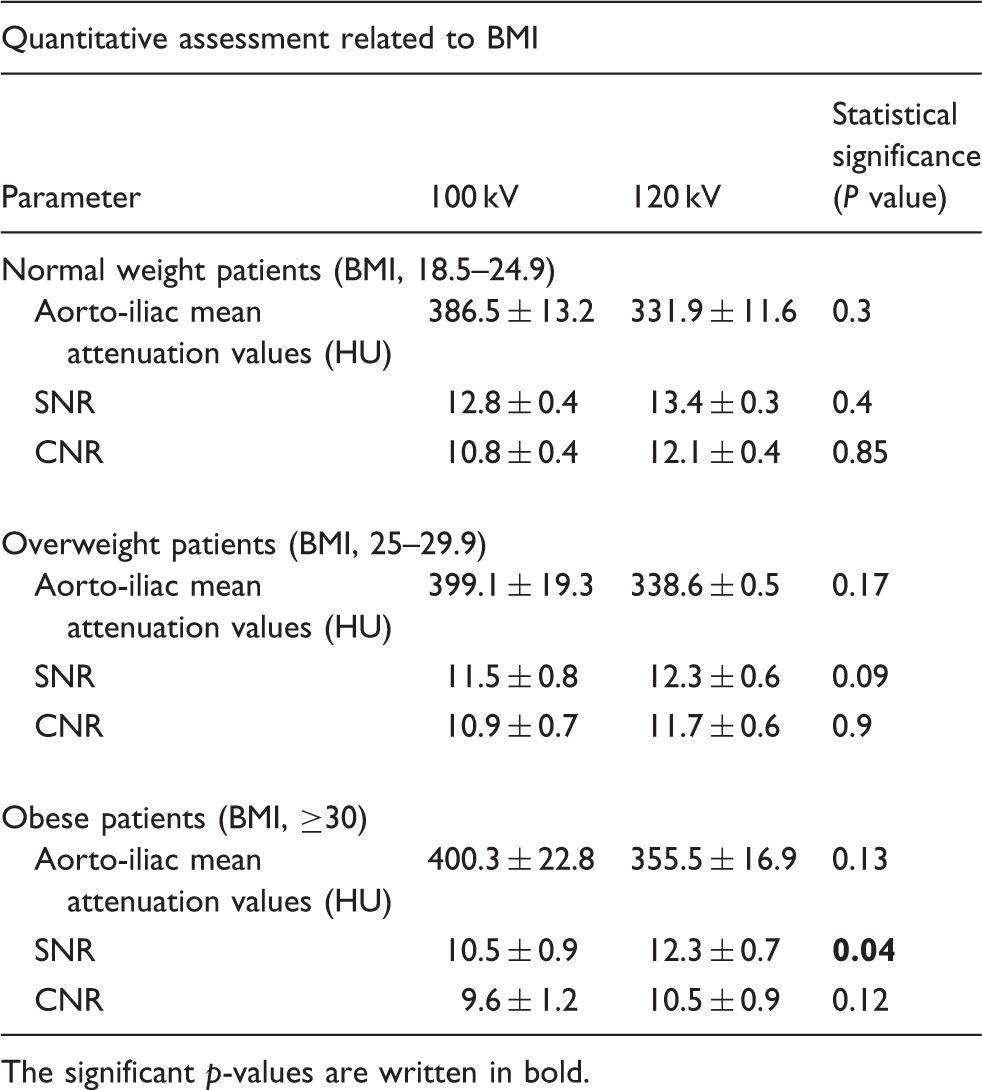
The significant p-values are written in bold.
Radiation dose estimation
The average value of CTDIvol was 20 ± 7 mGy (range, 10–27 mGy) at 120 kV and 15.6 ± 4.3 mGy (range, 9.6–20.3 mGy) at 100 kV, with a dose reduction of 22% (P < 0.01).
The average value of effective dose was 16.4 ± 7.1 mSv in the 120 kV protocol (range, 8.5–23.4 mSv) and 10.5 ± 3.7 mSv in the 100 kV protocol (range, 6.9–14.3 mSv), with a 36% decrease (P < 0.01).
Discussion
The goal of the radiologist is not to get high-quality images, but rather images of adequate quality to make a diagnosis by administering the lowest possible dose to the patient; therefore, a balance must be sought between dose reduction and image quality.
As concerns the qualitative assessment, an increase of 1 point in average IN, as well as in the mean total score, was observed in the 100 kV protocol of our study, but the differences between the two protocols were not statistically significant; furthermore, an acceptable quality of images was registered in all cases (score <9). These findings are consistent with those observed by Wintersperger et al. (6), whereas the qualitative difference resulted significant in the study of Sahani et al. (7).
Regarding BMI impact on image quality, in our experience the overall score worsened especially in obese patients (more than 1 point; P = 0.02), because of a greater increase of image noise in this group. However, the statistical significance of these data should be consolidated by future larger sample studies. Concerning small vessels visibility, we obtained almost identical results with the two different protocols, in agreement with Sahani et al. (7).
As concerns the quantitative assessment, the increase of the aorto-iliac MAV – compared to the value recorded in the 120 kV protocol – was statistically significant, as in the two studies mentioned above (6,7). We also found a significant reduction in SNR, in agreement with Sahani et al. (7), while the reduction of CNR was not significant, in agreement with Wintersperger et al. (6). In our study, in nine cases (belonging to the normal weight group) CNR was higher in the 100 kV protocol, since the increase of endovascular attenuation exceeded the IN growth. It should be emphasized that the results of such mismatches are likely related to the fact that the other studies (6,7) compare different groups of patients; conversely, our study is “intra-individual”, thus compares examinations performed at different times in the same patients, ensuring a greater reliability of the results.
Almost all the studies that used a lower kilovoltage (80–90 kV) compared different cohorts of patients (8,9,12,13,15). Only two papers made an “intra-individual” comparison at different times, using 120 kV and 80 kV: Iezzi et al. (11) employed the two protocols with a 4-detector machine without current modulation in the same patients during EVAR follow-up. In the low-dose protocol the image quality, although significantly lower, was found to be good anyway and the CNR reduction was not statistically significant. Chen et al. (14) performed a comparative study using in the low dose exams IR techniques and reducing the CM amount: image quality was similar in the two protocols, as well as CNR, despite the significant increase of noise in the low dose one. The results of these two studies, in spite of non-negligible differences in methodology, are fairly similar.
As regards BMI impact on the three quantitative parameters, a significant difference in the SNR values was only observed in obese patients because of a greater attenuation of the X-ray beam by abdominal adipose tissue, which is particularly abundant in patients with BMI ≥30 kg/m2 and determines a significant IN increase. This finding, together with the increase of the overall qualitative score, suggests to carefully evaluate case by case the opportunity to use a low dose protocol in frankly obese patients. However, this limit can be overcome today using the IR techniques (15); the latter – compared with filtered back-projection – are able to significantly reduce noise and improve image quality, as it has been also shown in some recent papers on CTA of the chest vessels (21,22).
As concerns CM reduction in the low-dose protocol, Cho et al. (13) and Kanematsu et al. (15), comparing different cohorts of patients studied with a lower iodine concentration in the 80 kV protocol vs. 120 kV, did not observe significant differences in SNR and CNR values or in the image quality. Reducing iodine amount is important, since the majority of patients who undergo serial CTA exams post EVAR suffer from atherosclerotic disease, which often affects also the renal arteries; so the low dose protocol allows to preserve renal function (8,13,15).
Regarding radiation dose, the CTDIvol obtained in the 100 kV protocol was significantly lower than that of the 120 kV protocol: dose reduction of 22% is a bit lower than the value reported in literature (30–36%) (6,7). Also the effective dose was significantly different with a dose abatement of 36%, that is equal to other reported data (6). However, the dose reduction problem is not important in these patients, usually old aged; it becomes relevant in “younger” EVAR patients or in patients that undergo frequent CT exams due to EVAR-related complications.
Our study has some limitations: first of all, the small number of enrolled patients for which the comparison between the two protocols was implemented; second, the comparison was not carried out in the same examination session: thus some variables related to the patients’ conditions may have influenced, at least partially, our results. Third, the two radiologists evaluating the images were not blinded to the CT protocol when they reviewed the examinations. Fourth, we did not evaluate the diagnostic accuracy of CTA, but focused rather on comparing image quality and radiation dose. Fifth, our experience was acquired with a 64-detector CT scanner which is lacking of IR algorithms, but such machines are again standard in many imaging departments.
In conclusion, our ‘‘intra-individual’’ study confirms the possibility of reducing the kilovoltage in CTA scans of AA in all patients that underwent EVAR, with some reservations for those with BMI >30 kg/m2, if IR techniques are not available; in fact, albeit a consistent saving in radiation dose, the image quality was maintained satisfactory in all patients.
Footnotes
Conflict of interest
None declared.
Funding
This research received no specific grant from any funding agency in the public, commercial, or not-for-profit sectors.