
Abstract
Background
Positron emission tomography/computed tomography (PET/CT) using 18 F-fluorodeoxyglucose (FDG) has been used to characterize various malignancies. There are few reports regarding the use of 11 C-methionine (MET)-PET/CT to characterize tumors in the skull base.
Purpose
To compare MET-PET/CT with FDG-PET/CT in cases of tumors of the skull base.
Material and Methods
Both MET-PET/CT and FDG-PET/CT were performed in 27 patients with tumors of the skull base. In all cases, pathology was determined by surgery or biopsy. The images were visually and independently reviewed by two reviewers. For qualitative analysis, the inter-rater agreement between two reviewers was measured. For semi-quantitative evaluation, the tumor-to-normal brain uptake ratios (T/N ratios) were calculated by dividing the maximum of standardized uptake value (SUVmax) for the tumor by the SUVmax of the normal contra-lateral cerebellar hemisphere. Difference in T/N ratios between FDG-PET/CT and MET-PET/CT was analyzed for statistical significance.
Results
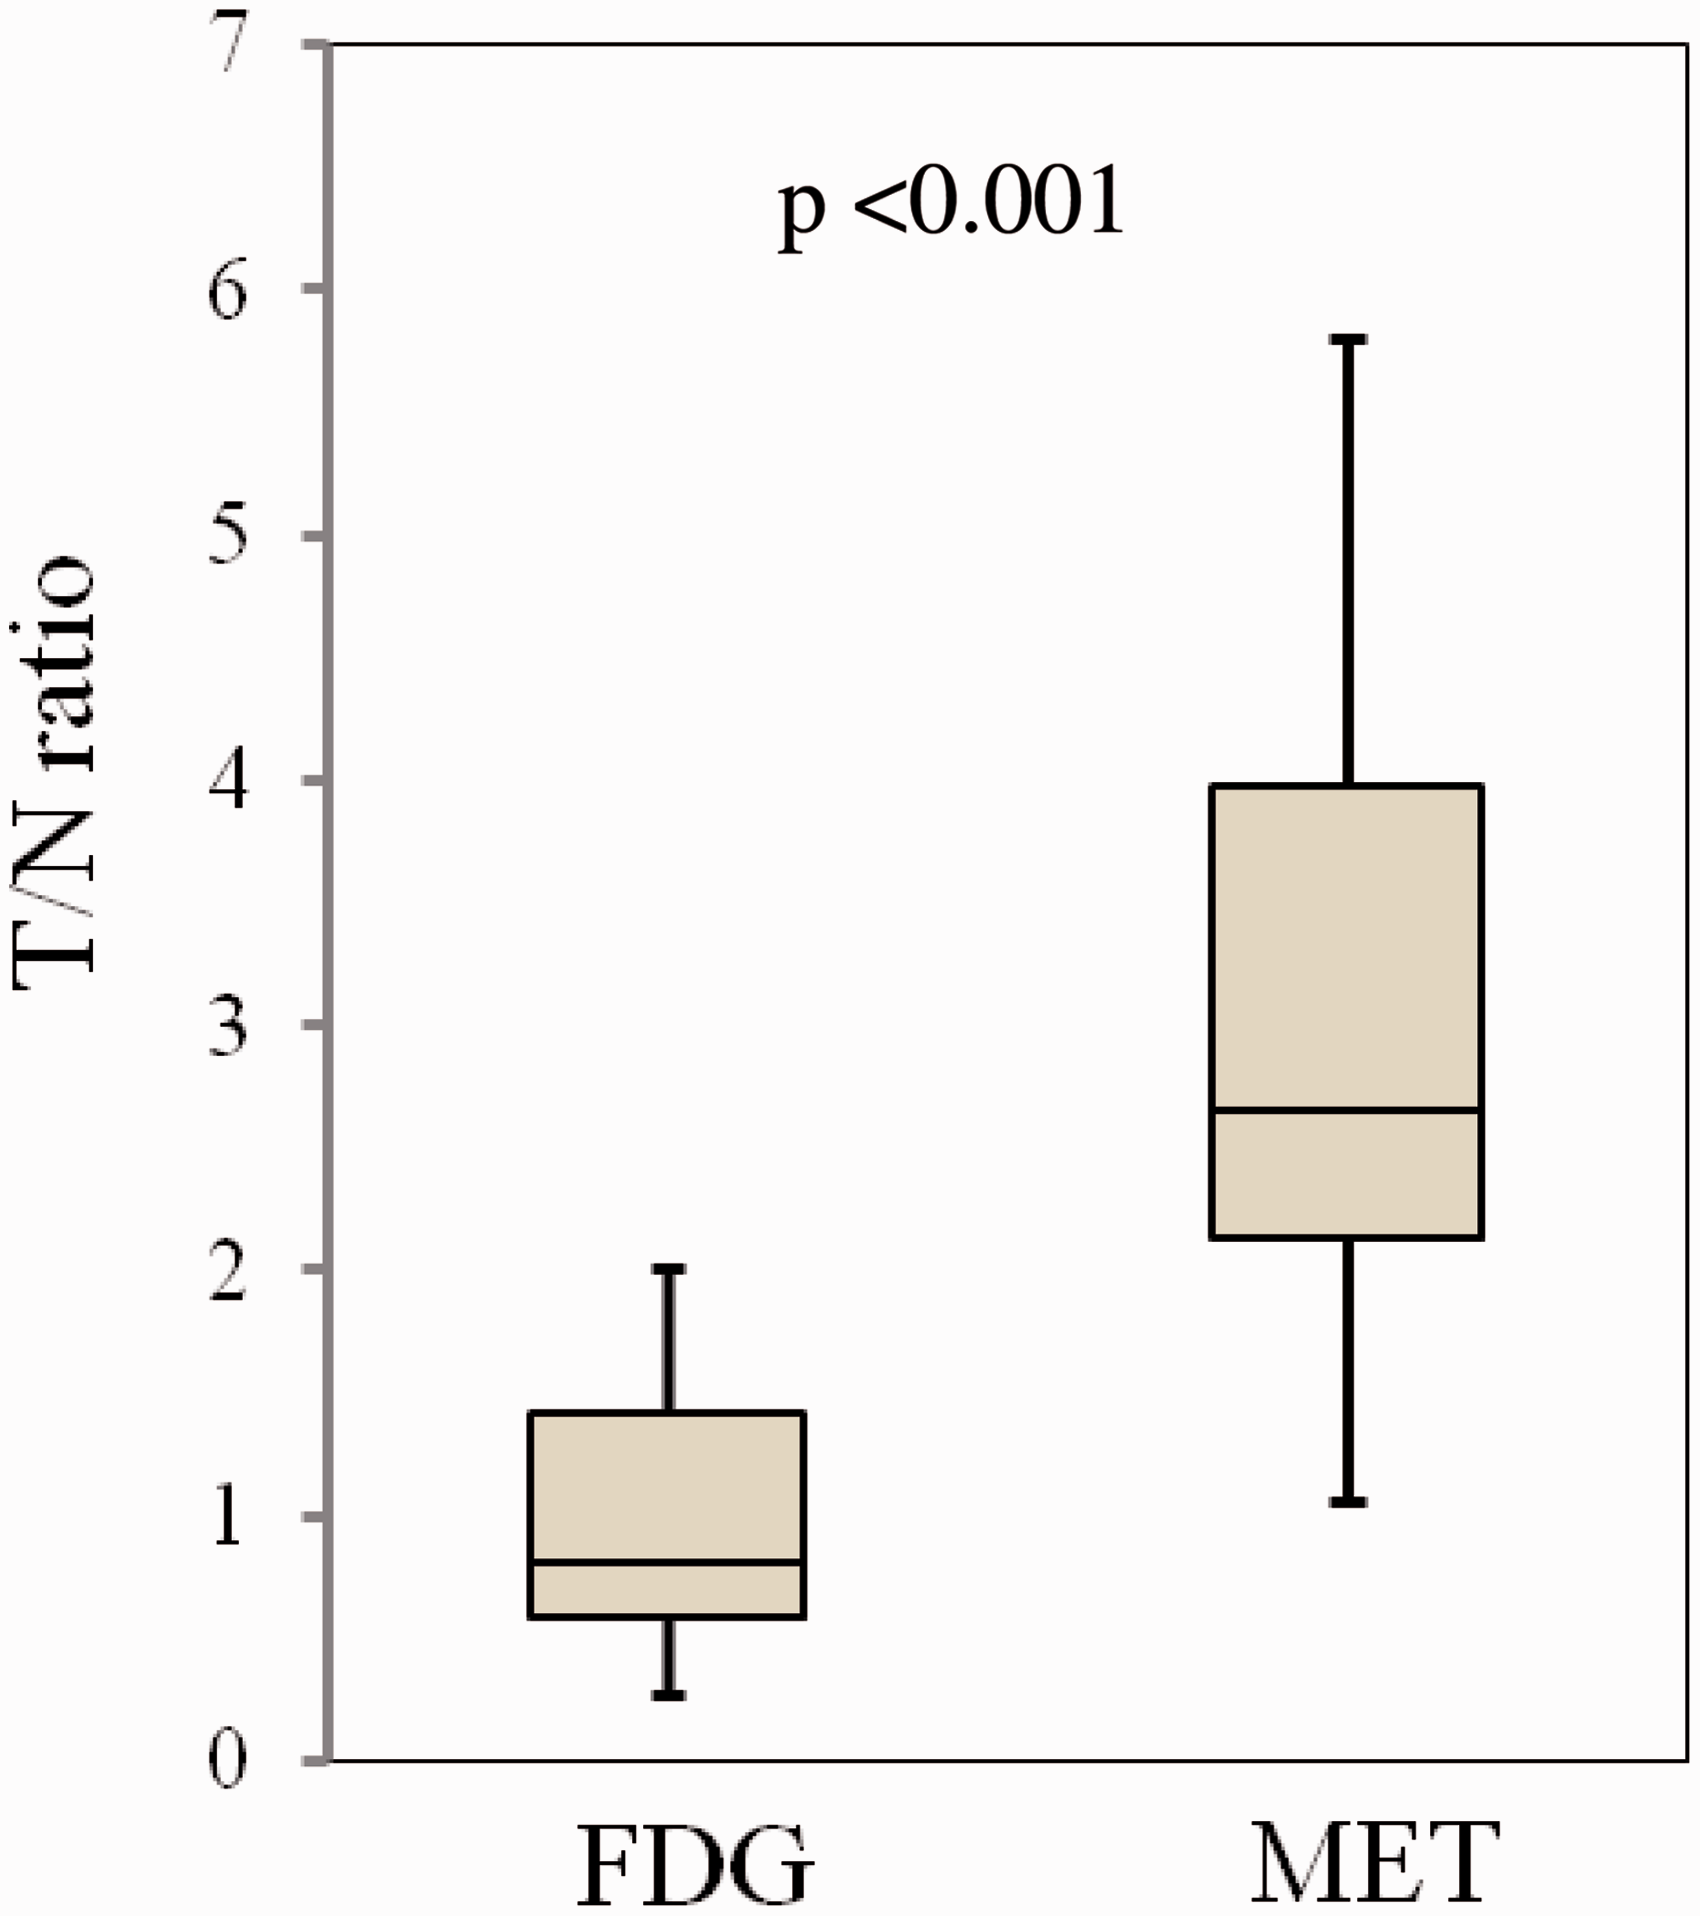
On qualitative evaluation, the inter-rater agreement of MET-PET/CT was superior than that of FDG-PET/CT. MET uptake was interpreted as positive in every tumor by both reviewers. MET-PET/CT had a significantly higher T/N ratio than FDG-PET/CT (2.96 ± 1.25 vs. 1.02 ± 0.54, respectively; P < 0.001).
Conclusion
MET-PET/CT showed superior inter-rater agreement and had higher uptake for tumors at the skull base than FDG-PET/CT. The present study suggests that MET-PET/CT has superior potential for imaging of tumors of the skull base.
Introduction
Imaging using positron emission tomography/computed tomography (PET/CT) with 18 F-fluorodeoxyglucose (FDG-PET/ characterize various malignancies (1,2) but may have insufficient sensitivity and specificity rates for visualization of head and neck malignancies (3,4) and provides relevant information on amino-acid transport. Methionine (MET) is needed for synthesis of S-adenosylmethionine, which participates in polyamine synthesis, and uptake of MET as demonstrated on 11 C MET imaging reflects increased transport, transmethylation rate, and protein synthesis of a lesion (5). PET/CT using MET (MET-PET/CT) has been used to characterize tumors of the brain (6) and to differentiate between recurrent tumors and radiation necrosis following treatment (7,8). However, there are few reports regarding the use of MET-PET/CT to characterize tumors of the skull base (9,10). Tumors invading the skull base are typically inoperable and are treated with radiotherapy. Planning of radiotherapy requires exact delineation of the tumor by CT, magnetic resonance imaging (MRI), PET, and single photon emission computed tomography (SPECT) (9–11). After treatment, PET/CT might be an effective tool to evaluate the response to treatment and to detect recurrent tumors. In the present study, the clinical value of MET-PET/CT was compared with that of FDG-PET/CT for tumors of the skull base.
Material and Methods
This was a retrospective study including consecutive 27 patients (22 men, 5 women; mean age, 58.0 ± 12.7 years) with tumors at or near the skull base who performed both FDG-PET/CT and MET-PET/CT from January 2009 to August 2013. Clinicians, such as radiation oncologists or neurosurgeons, ordered both FDG-PET/CT and MET-PET/CT, because MET-PET/CT may have the superiority in evaluating tumors in the brain, and FDG-PET/CT is effective to detect abnormalities in areas other than the brain. Every patient gave written informed consent before both FDG-PET/CT and MET-PET/CT. Patients with decreased glucose tolerance or diabetes were included. Patients were informed that image quality of FDG-PET/CT could be degraded in hyperglycemic state. This study was approved by our hospital’s Institutional Review Board.
Lesions comprised adenoid cystic carcinomas (n = 5), squamous cell carcinomas (n = 9), chondrosarcoma (n = 1), sarcomatoid carcinoma (n = 1), lymphoepithelial carcinoma (n = 1), osteosarcoma (n = 1), malignant fibrous histiocytoma (n = 1), malignant melanoma (n = 1), neuroendocrine tumor (n = 1), olfactory neuroblastoma (n = 1), malignant meningioma (n = 1), atypical meningioma (n = 1), meningioma (n = 1), chordoma (n = 1), and pituitary adenoma (n = 1). In all cases, pathological diagnosis was established using tissue from surgery or biopsy more than 3 months before PET/CT. Eleven of 27 patients had recurrent tumors 1–20 years after treatment.
All patients underwent both PET/CT studies on the same day. PET/CT examinations were performed using two different PET/CT units; GE Discovery LS (GE Healthcare, Milwaukee, WI, USA) (PET: FWHM, 4.8 mm; reconstruction, OSEM; crystal, BGO; sensitivity, 6.5 cps/kBq, CT: 4 row, auto-mA (max: 300 mA), 120 kVp, 0.8 s tube rotation speed, 7.5 mm/s table speed) and a GE Discovery 600 Motion (GE Healthcare, Milwaukee, WI, USA) (PET: FWHM, 5.1 mm; reconstruction, VUE Point HD; crystal, BGO; sensitivity, 9.1 cps/kBq, CT: 16 row, auto-mA (max: 300 mA), 120 kVp, 0.8 s tube rotation speed, 11.25 mm/s table speed). No intravenous contrast material was used. After the CT, PET using MET was performed 20 min after injection of MET (425.7–542.8 MBq, 11.5–14.7 mCi). For FDG-PET, FDG (189.2–234.9 MBq, 5.1–6.3 mCi) was injected 60 min after MET-PET. FDG-PET was performed 60 min after injection of FDG. The acquisition time was 5 or 10 min per table position. The protocol of both PET/CT examinations has already been published (12) and is presented in Fig. 1. PET images were reconstructed using CT data for attenuation correction and image fusion. Co-registered images were displayed on a workstation.
Protocol for F-18 fluorodeoxy glucose (FDG)-PET/CT and C-11 methionine (MET)-PET/CT.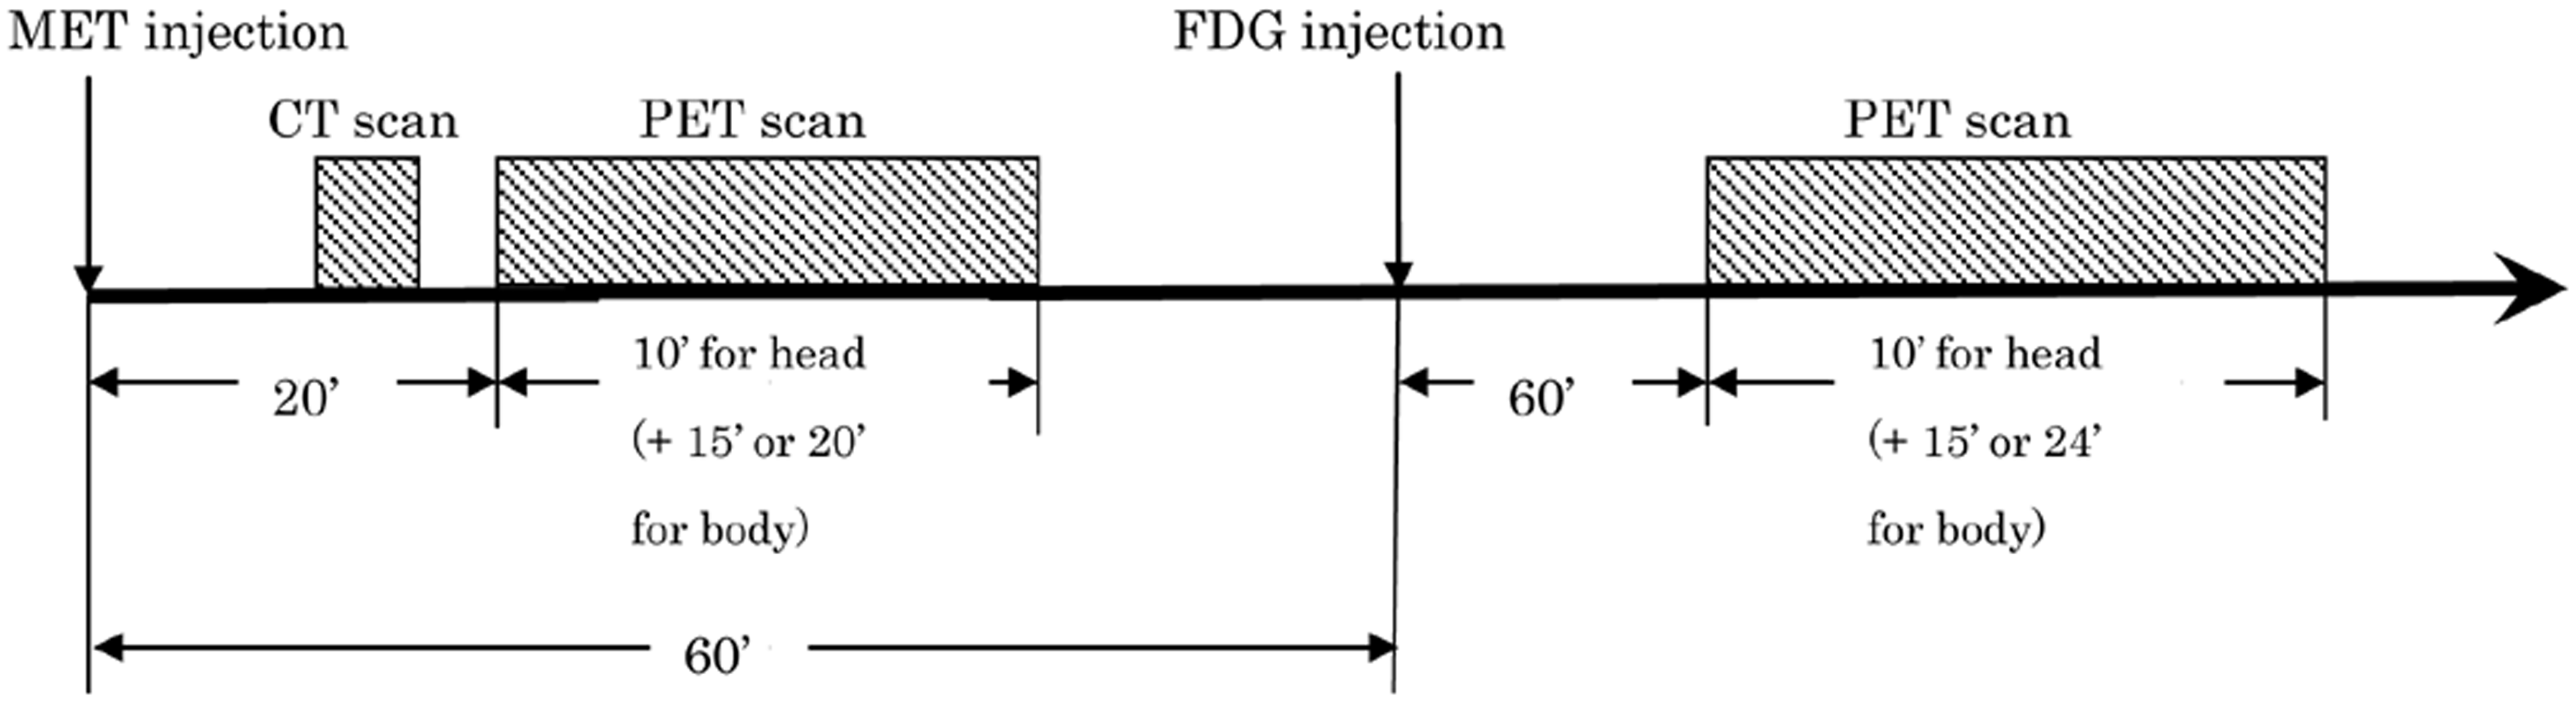
The images were visually and independently reviewed by two neuroradiologists who were aware of the pathological diagnoses. The reviewers had access to the both PET/CT images, including multiplanar reconstructions, on a color-coded monitor. Every patient also underwent MRI, but both reviewers did not have access to the MR images. For qualitative analysis, positive uptake was defined as obvious or marked uptake in comparison to the surrounding tissues. The negative uptake was defined as no or negligible uptake. The inter-rater agreement (kappa coefficient) between two reviewers was measured using Excel Statistics 2010 version 1.13 (Microsoft Corp., Redmond, WA, USA).
For semi-quantitative evaluation, the tumor-to-normal brain uptake ratios (T/N ratios) were calculated by dividing the maximum of standardized uptake value (SUVmax) for the tumor by the SUVmax of the normal contralateral cerebellar hemisphere. Difference in SUVmax between FDG-PET/CT and MET-PET/CT was analyzed for statistical significance by the two-tailed paired Student’s t test. Differences of SUVmax of the tumor on FDG-PET/CT and MET-PET/CT between recurrent tumors after therapy including radiation and other tumors before therapy were also studied using the Student’s t test. Two-tailed paired Student’s t test values were calculated using Excel Statistics 2010 version 1.13 (Microsoft).
Results
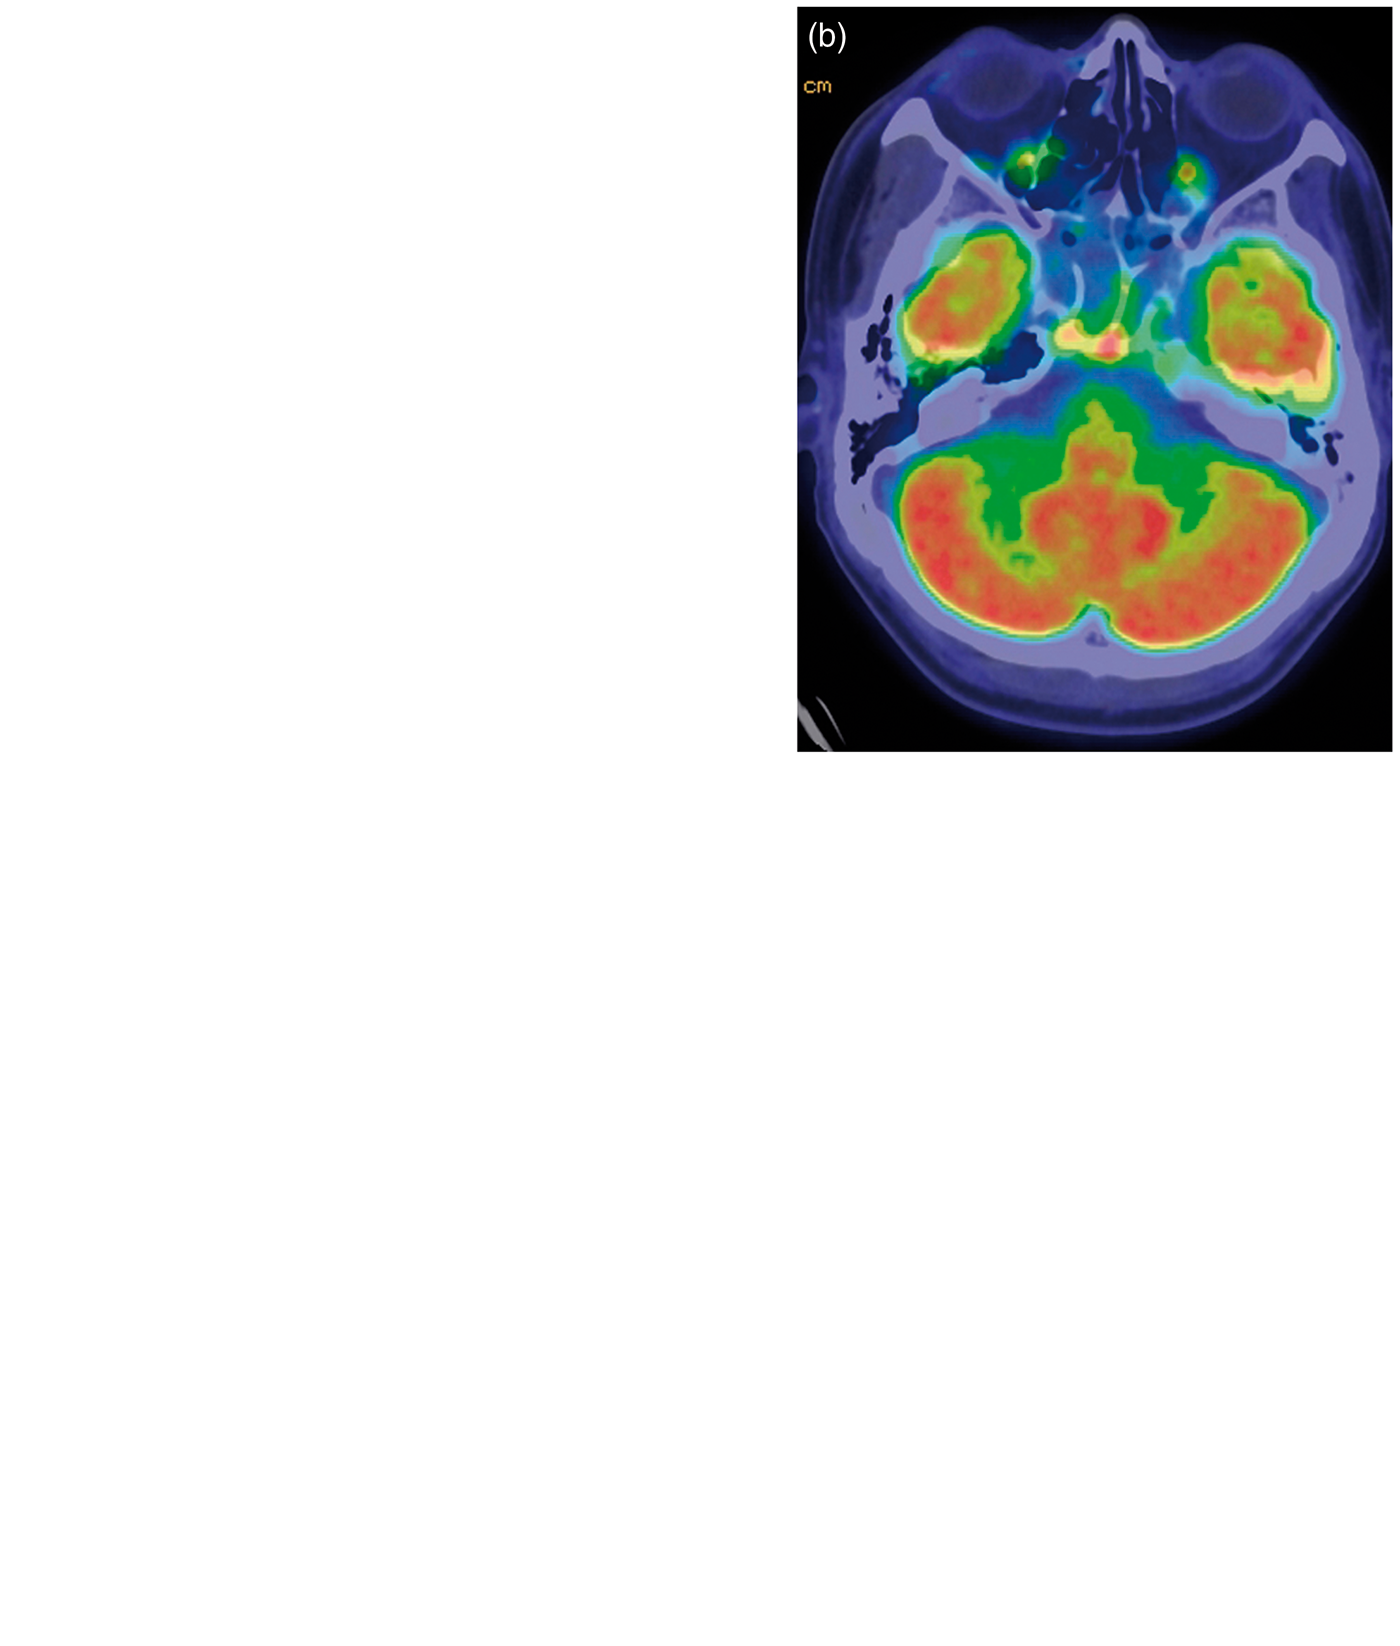
On MET-PET/CT, MET uptake was interpreted as positive in every tumor by both reviewers (kappa coefficient=1.0). On FDG-PET/CT, two tumors (a chondrosarcoma and a malignant fibrous histiocytoma) were interpreted as negative uptake in one reviewer but as positive uptake in another reviewer (Fig. 2). The kappa coefficient was 0.47 for FDG-PET/CT. A case of adenoid cystic carcinoma (Fig. 3) showing positive uptake on MET-PET/CT was interpreted as negative uptake on FDG-PET/CT by both reviewers. MET-PET/CT had a significantly higher T/N ratio when compared with FDG-PET/CT (2.96 ± 1.25 vs. 1.02 ± 0.54; t = 9.13; P < 0.001) (Figs. 4 and 5). No significant difference was observed in T/N ratio on either FDG-PET/CT (T/N ratio of recurrent tumors and other tumors=0.82 ± 0.50 and 1.16 ± 0.53, respectively) or MET-PET/CT (T/N ratio of recurrent tumors and other tumors=2.67 ± 1.42 and 3.31 ± 1.19, respectively) when comparing recurrent tumors after therapy and tumors before therapy. Inflammatory changes near the tumor were seen in nine cases. One of those nine cases consisted of moderate uptake of MET in the region of inflammatory changes near the tumor (Fig. 6). MET-PET/CT showed higher uptake in the mucosa of the nasal cavity and nasopharynx when compared with FDG-PET/CT. On FDG-PET/CT, high uptake of the normal brain tissue interfered with identification of tumors near the brain (Fig. 3).
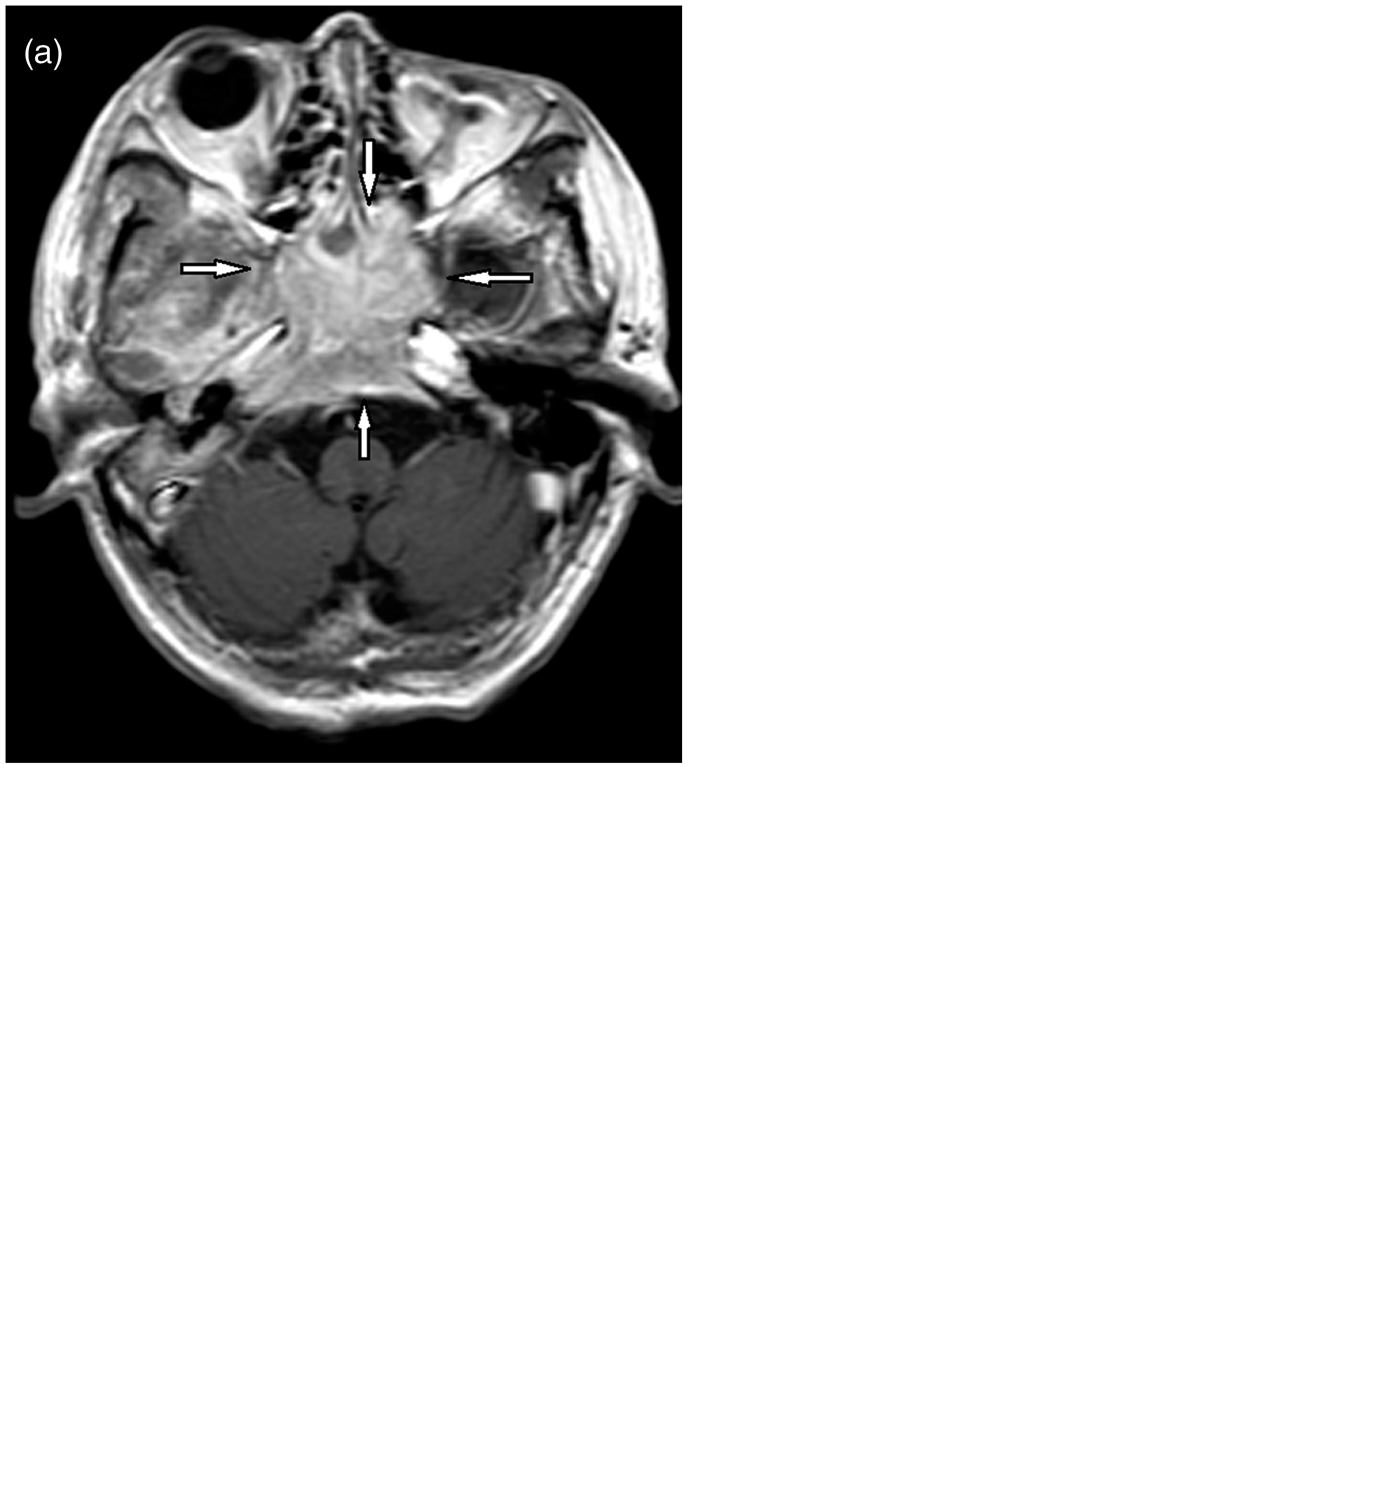
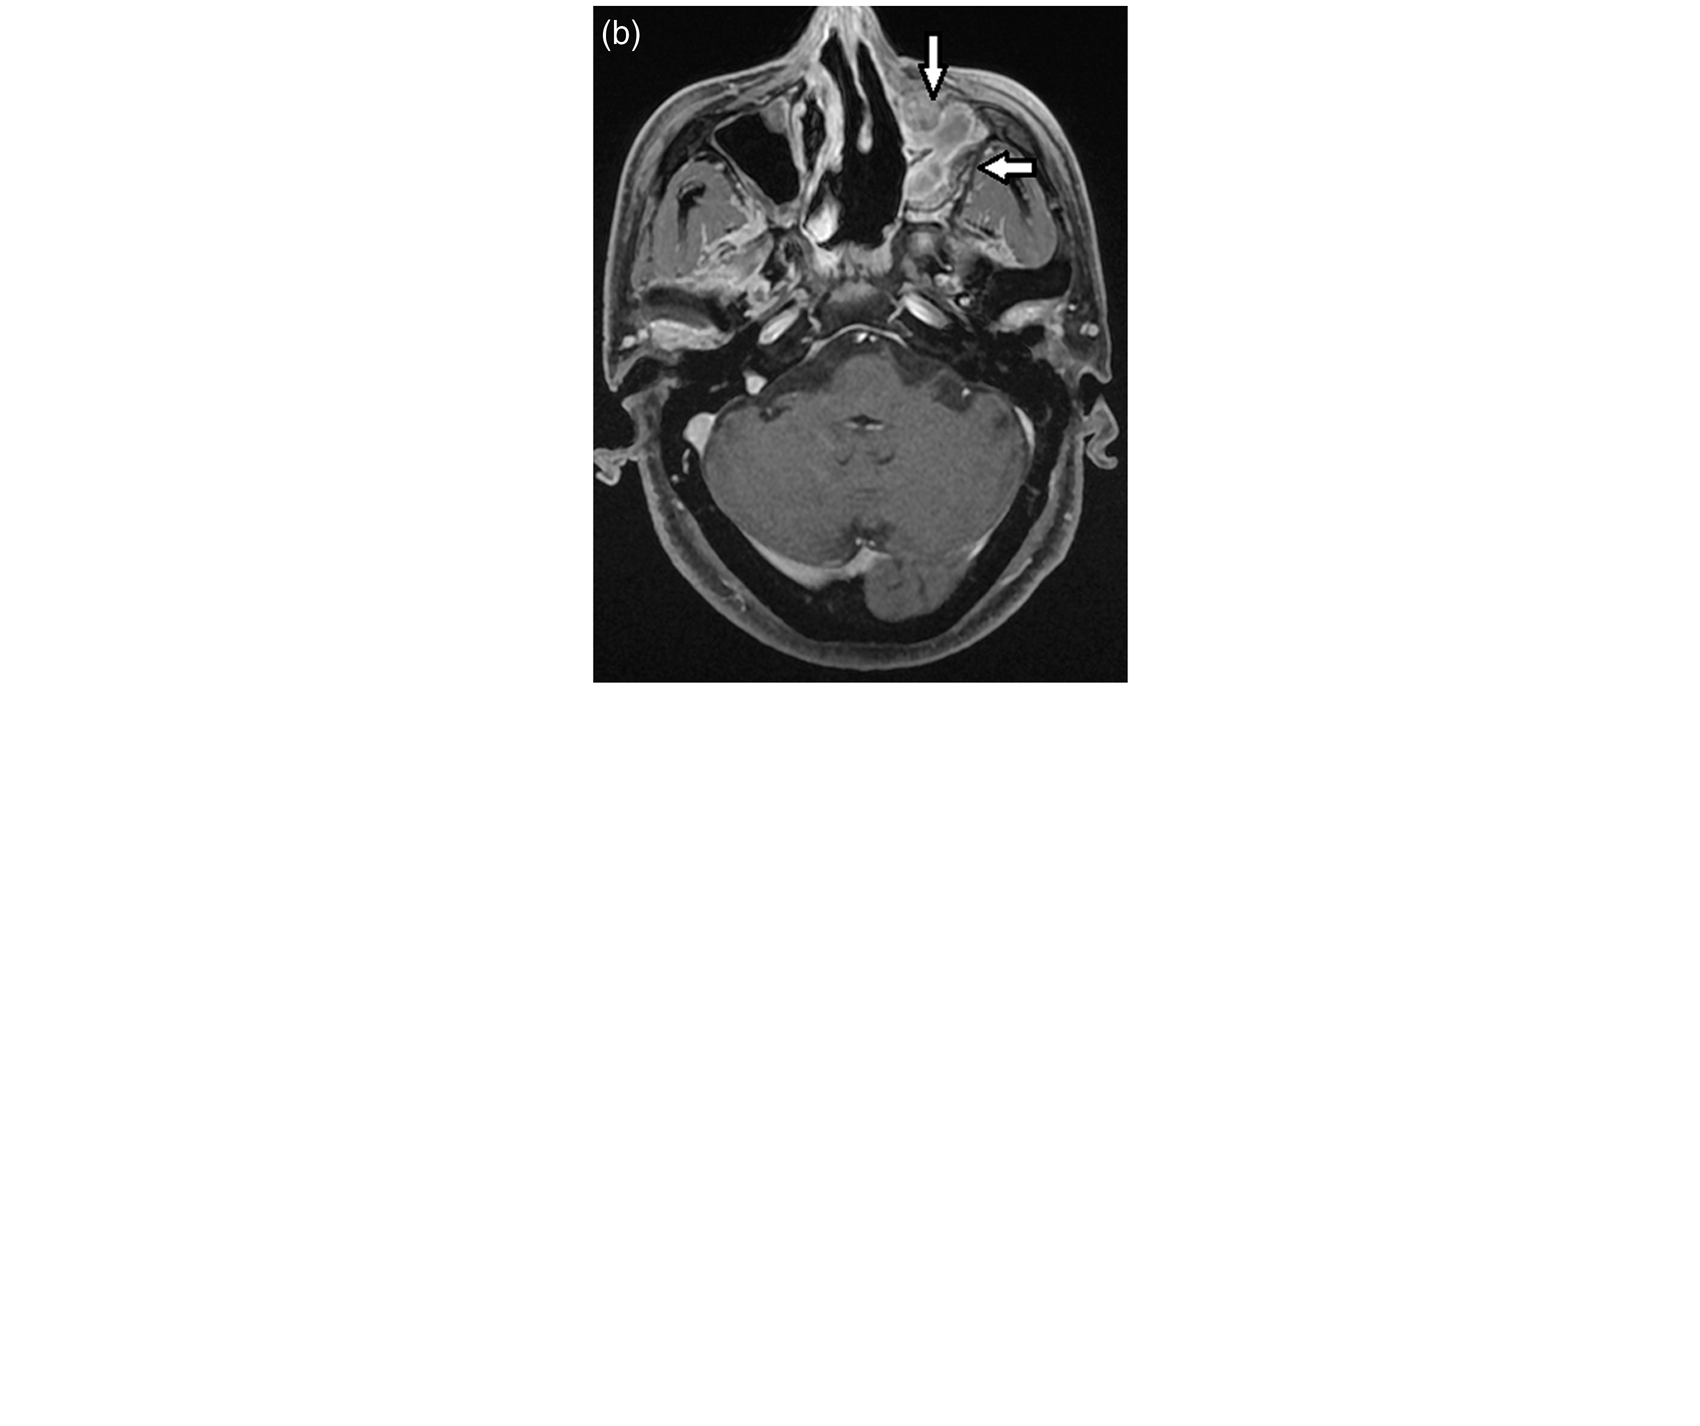
A case of malignant fibrous histiocytoma mainly invading the sphenoid sinus and the posterior ethmoid sinus (arrows). T2-weighted MR image (a) shows a tumor in the body of the sphenoid bone extending into the posterior ethmoid sinus (arrows). One reviewer judged as slight uptake of FDG), but another reviewer judged as no uptake of FDG. Both reviewers judged as definite uptake of MET on MET-PET/CT (d, e). A case of epipharyngeal carcinoma (adenoid cystic carcinoma) extending to the left parasellar region. Contrast-enhanced tumor (arrowheads) is seen in the left cavernous sinus around the internal carotid artery on contrast-enhanced T1-weighted MRI with fat saturation (a). A definite uptake of FDG is not seen on FDG-PET/CT (b). Increased accumulation of MET (arrow) to the tumor is clearly seen on MET-PET/CT (c). Tumor-to-normal brain uptake ratio (T/N ratio) for FDG-PET/CT and MET-PET/CT T/N ratio is calculated by dividing the maximum of standardized uptake value (SUVmax) for the tumor by the SUVmax of the normal contralateral cerebellar hemisphere. MET-PET/CT has a significantly higher T/N ratio when compared with FDG-PET/CT (2.96 ± 1.25 vs. 1.02 ± 0.54, P < 0.001). A case of atypical meningioma. (a) Contrast-enhanced T1-weighted MRI shows a large tumor in the sphenoid sinus, clivus, and around the right carotid canal (arrows). FDG-PET/CT (b) shows moderate uptake of FDG by the tumor (arrows). MET-PET/CT depicts marked uptake of MET by the tumor (arrows). A case of melanoma in the ethmoid sinus with inflammatory change in the left maxillary sinus. Contrast-enhanced T1-weighted MRI shows a contrast-enhanced tumor in the ethmoid sinus (a, arrow) and inflammatory change in the left maxillary sinus (b, arrows). FDG-PET/CT shows moderate uptake of FDG by the tumor (c, arrow) and faint uptake of FDG into the region of inflammatory change (d, arrow). MET-PET/CT showed increased accumulation of MET in the tumor (e, arrow) as well as in the region of inflammatory change (f, arrow).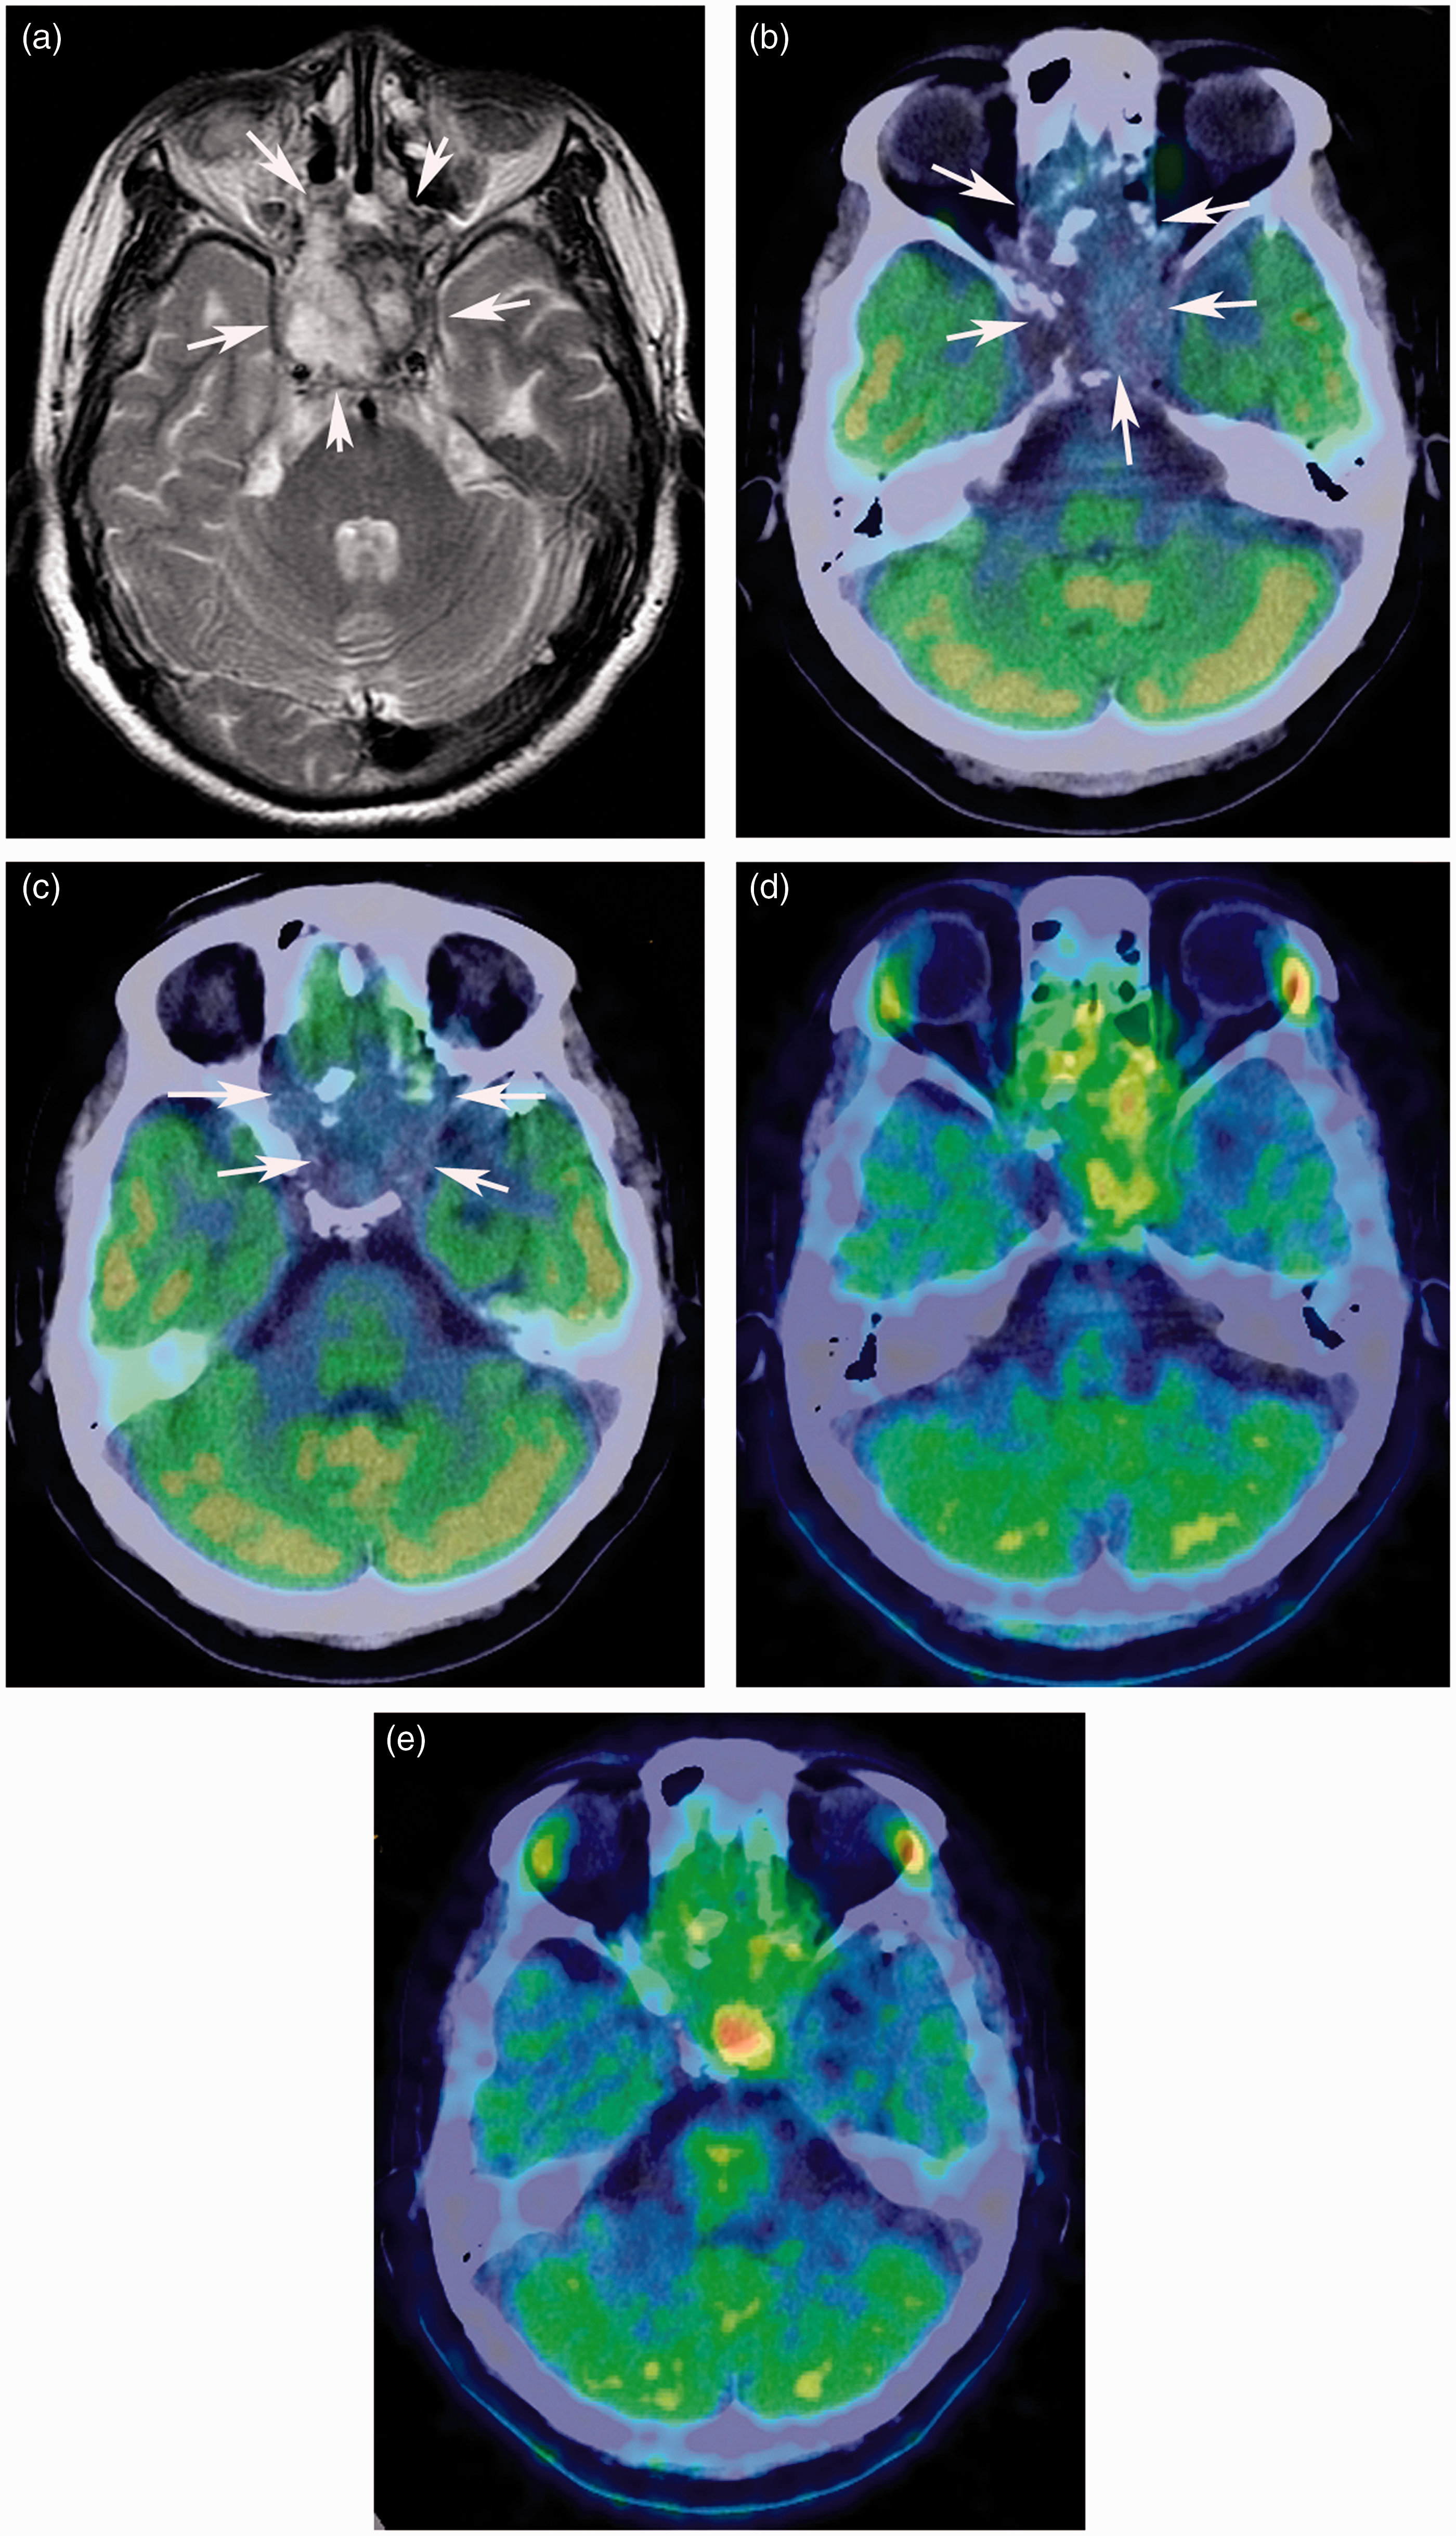
Discussion
MET-PET is widely used to visualize tumors of the brain (2,6–8,13). In the literature, the use of MET to characterize head and neck tumors has been described in only in a few reports (14,15), and no study has used MET-PET to characterize tumors at the base of the skull (9,10). Although MET-PET/CT in the present study showed positive uptake in every tumor by both reviewers, FDG-PET/CT in two tumors was interpreted as negative by one reviewer. The inter-rater agreement was better for MET-PET/CT than for FDG-PET/CT. In tumors showing positive uptake on both PET/CT examinations, positive uptake areas on MET-PET/CT were larger than those on FDG-PET/CT. The mechanism of uptake of MET is quite different from that of FDG (5). In the present study, 23 of 27 tumors were pathologically malignant. MET uptake is likely influenced by amino-acid transport and protein synthesis (5). Compared with FDG-PET/CT, MET-PET/CT has already proved to be useful for the delineation of brain tumors (16). Indeed, MET uptake is a better reflection of tumor proliferative activity in squamous head and neck cancer cell lines when compared with FDG uptake (14). While it is generally difficult to determine the exact margin of tumors in the skull base using non-invasive imaging, larger areas visualized by accumulated MET-PET/CT may be a better reflection of the margin of the tumor when compared with the imaging results of FDG-PET/CT. However, larger areas with increased accumulation of MET may possibly involve the inflammatory changes.
MRI is mainly used to image pathologies near the skull base. MRI can often depict abnormalities of the bone at the skull base which cannot be detected by CT (17). In particular, MRI is superior to image abnormalities in the bone marrow as well as perineural extension through the foramina at the skull base. In diagnosing and evaluating tumors near the skull base, PET/CT findings are actually used together with MRI. Fusion images of PET with MRI can be relatively easily reconstructed in new generation workstations, but newly developed PET/MR would be much more feasible. The present study did not include comparison of PET/CT with MRI in evaluating the lesions, because the main aim was comparison of FDG-PET/CT with MET-PET/CT.
In the present study, increased uptake of FDG in the brain interfered with PET visualization of tumors at the skull base. In comparison, MET accumulates in the bone marrow of the skull base, but it did not disturb the visualization of uptake of the tumor. The high T/N ratio for MET-PET/CT is mainly due to hypometabolism of MET in the normal brain tissue. In 21 of 27 cases, the SUVmax of the tumor in FDG-PET/CT was higher than that in MET-PET/CT. The other six cases had a higher tumor SUVmax on MET-PET/CT than on FDG-PET/CT. These latter cases included a squamous cell carcinoma, a malignant melanoma (Fig. 5), an olfactory neuroblastoma, a malignant meningioma, a pituitary adenoma, and a meningioma. In inflammatory lesion seen in a patient with malignant melanoma in the nasal cavity, uptake of MET was higher than that of FDG. FDG accumulation and MET accumulation in the inflammatory lesions has been previously described (18,19), and inflammatory changes in the paranasal sinuses are often seen in the context of tumors at the skull base. Thus, clinicians should be aware that uptake of MET can increase in regions of inflammation. The phenomenon of accumulation of MET or FDG in the inflammatory lesions needs further studies in more subjects.
Although the effect of hyperglycemia was not investigated in this study, FDG-PET/CT studies are unreliable in diabetic patients. By contrast, hyperglycemia does not influence the results of MET-PET/CT.
In the present study, three tumors (a chondrosarcoma, an adenoid cystic carcinoma, and a malignant fibrous histiocytoma) had barely any accumulation of FDG. The tumor FDG SUVmax was 4.5 for the chondrosarcoma, 3.7 for the adenoid cystic carcinoma, and 4.3 for the malignant fibrous histiocytoma. It was difficult to identify its adenoid cystic carcinoma, because the tumor was located in the parasellar region close to the temporal lobe. In four tumors originating from bony structures of the skull base (a chondrosarcoma, an osteosarcoma, a malignant fibrous histiocytoma and a chordoma), the tumor FDG SUVmax was relatively low (from 4.3 to 6.3). There was previously reported that MET-PET was more sensitive than FDG-PET in detecting metastatic tumors of bone in patients with prostate cancer (20). In their series, initial uptake of MET in dominant sites was followed by increased uptake of FDG during progression of disease. However, time-dependent metabolic changes were not investigated in the present study.
Patients with recurrent tumors after therapy with radiation were included in the present study. No significant difference was observed in the accumulation of either FDG or MET when comparing recurrent tumors and tumors before therapy. Those recurrent tumors were comprised of highly malignant tumors, such as sarcomas, sarcomatous carcinoma, malignant fibrous histiocytoma, and malignant meningioma.
In tumors of the skull base, radiotherapy and/or chemotherapy is typically used, because total removal of the tumor is usually impossible. In our institution, proton beam therapy has been utilized for tumors at the skull base. Other recent advanced radiotherapy modalities, such as intensity modulated radiation therapy (IMRT), gamma knife therapy, and particle beam therapy also requires exact margin of the tumors (9,10). The present study showed that MET-PET/CT was a promising imaging modality when compared with FDG-PET/CT for the evaluation of tumors at the skull base, however, tumors included in the present study consisted of heterogeneous nature.
The present study has several limitations. Major limitation is lack of the gold standard for the exact tumor extension of the skull base. Pathological diagnosis was established in every tumor; however, an exact extension of the tumor in the skull base could not be pathologically proved. In general, total removal cannot be performed in large tumors in the skull base, and multiple biopsies cannot be performed either. MRI is not applicable for the gold standard in the present study. Indeed, there were previous reports demonstrating the superiority of MET-PET to MRI for delineating the true extent of the tumor in the brain (21,22). The number of cases included in the present study was relatively small, and the present study was performed retrospectively. Many cases other than subjects in the present study underwent only FDG-PET/CT within the past 4 years in our hospital. Clinicians, such as radiation oncologists or neurosurgeons, will be critical in deciding which patients would benefit from PET/CT with FDG versus PET/CTs with FDG and MET. Prospective study of the utility of these modalities in consecutive patients would be of benefit.
In conclusion, MET-PET/CT showed superior inter-rater agreement and had higher uptake for tumors at the skull base than FDG-PET/CT. These data suggest that MET-PET/CT has superior potential for imaging of tumors of the skull base.
Footnotes
Conflict of interest
None
Funding
This research received no specific grant from any funding agency in the public, commercial, or not- commercial.