
Abstract
Background
The Bosniak classification was originally based on computed tomographic (CT) findings. Magnetic resonance (MR) and contrast-enhanced ultrasonography (CEUS) imaging may demonstrate findings that are not depicted at CT, and there may not always be a clear correlation between the findings at MR and CEUS imaging and those at CT.
Purpose
To compare diagnostic accuracy of MR, CEUS, and CT when categorizing complex renal cystic masses according to the Bosniak classification.
Material and Methods
From February 2011 to June 2012, 46 complex renal cysts were prospectively evaluated by three readers. Each mass was categorized according to the Bosniak classification and CT was chosen as gold standard. Kappa was calculated for diagnostic accuracy and data was compared with pathological results.
Results
CT images found 27 BII, six BIIF, seven BIII, and six BIV. Forty-three cysts could be characterized by CEUS, 79% were in agreement with CT (κ = 0.86). Five BII lesions were upgraded to BIIF and four lesions were categorized lower with CEUS. Forty-one lesions were examined with MR; 78% were in agreement with CT (κ = 0.91). Three BII lesions were upgraded to BIIF and six lesions were categorized one category lower. Pathologic correlation in six lesions revealed four malignant and two benign lesions.
Conclusion
CEUS and MR both up- and downgraded renal cysts compared to CT, and until these non-radiation modalities have been refined and adjusted, CT should remain the gold standard of the Bosniak classification.
Keywords
Introduction
The Bosniak classification system has been used for categorizing complex cystic masses in the kidney for more than 25 years (1). The classification system was originally based on computed tomography (CT). The Bosniak classification divides renal cysts into five categories based on their contrast CT findings. The classification is proposed in the literature as a method to separate malignant from benign cystic lesions in the kidney (1–5). Bosniak category I and II lesions are predicted to be benign, category IIF is suspicious for malignancy and needs follow-up, category III is potentially malignant and category IV is predominantly malignant. Patients with BIIF lesions often need multiple examinations and are therefore exposed to high doses of ionized radiation with potential harmful effects. Therefore, many institutions nowadays tend to use non-radiation modalities such as magnetic resonance imaging (MRI) and contrast-enhanced ultrasonography (CEUS) for categorizing complex renal cysts, despite the fact that comparative data between these imaging modalities and the original CT classification are very sparse in the literature and predominantly based on retrospective series (6–15).
The aim of this prospectively study was to compare diagnostic accuracy of MR, CEUS, and CT when categorizing complex renal cystic masses according to the Bosniak classification.
Material and Methods
Recruitment of patients
To evaluate the diagnostic accuracy for other diagnostic modalities than CT, when categorizing complex renal cystic masses, we have included MRI and CEUS in the study period. From February 2011 to June 2012 images of 46 renal cystic masses in 44 consecutive patients recruited from the Urology clinic, Fredericia Hospital, Fredericia, Denmark, were prospectively evaluated with MRI and CEUS with the initial CT as the referring gold standard. Recruitment of patients were made in consensus by the radiologist and urologist in charge at the given daily uroradiological conference. The patients were recruited on the basis of the initial three-phase CT scan in which renal cysts were classified according to the Bosniak classification. Subsequently, they all underwent MRI and CEUS. The local ethical committee approved the study, project ID: S-20090137. All patients gave their oral and written informed consent before inclusion. MRI and CEUS were performed within 14 days after the initial CT scan. Inclusion criteria were: age ≥18 years; informed consent; complex renal cyst; Bosniak category ≥II; prior triple phase CT; normal kidney function (estimated creatinine clearance >60 mL/min/1.74 m2). Exclusion criteria were: contrast allergy and contraindications to MRI and CEUS; previous renal surgery or biopsy; pregnancy or breastfeeding.
Image analysis
After the recruiting period all CT images were evaluated in consensus by three radiologists with 25 years (AH), 20 years (SSO), and 5 years (OG) of experience, and this reading represented the gold standard. None of the reviewers were involved in the process of including patients. Each lesion was categorized according to the Bosniak classification (1) with the following characteristics. The complexity of each lesion was assessed on the basis of the number and appearance of septa, wall thickness, interface with the kidney parenchyma, presence and amount of calcification, and contrast enhancement characteristic. Lesion size on the CT examination was measured in two dimensions on the axial images: transverse and anteroposterior. Only the largest diameter was included in the dataset. One senior radiologist (SSO) evaluated the MR images and another radiologist (OG) performed and evaluated the CEUS images. Both radiologists who performed the MRI and CEUS evaluations were blinded from the CT results. Data were evaluated prospectively in the study period. Each mass was categorized according to the Bosniak classification and weighted kappa (κ) statistics were calculated to assess agreement between CT vs. MRI and CT vs. CEUS.
Imaging techniques
All patients were examined with the same type of CT scanner, MR scanner, and ultrasound system and transducer. All data were stored in the local picture archive communication system (PACS).
CT
The CT protocol used in this study was obtained on a 64 channel CT (GE LightSpeed VCT scanner, GE Healthcare, Milwaukee, WI, USA). Patients were orally given 500 mL water, 30 min prior to the examination. Scan range including only the kidneys and adrenal glands, field of view (FoV) was at skin level. Before contrast media injection an unenhanced CT was performed. A bolus of 90 mL iodine contrast media (Visipaque® 320 mg/mL, Iodixanol, GE Healthcare, Princeton, NJ, USA) was machine injected intravenously followed by a 20 mL saline solution (0.9% NaCl) flush with injection rate at 4 mL/s for both contrast media and saline. To obtain correct and reproducible contrast phases, the arterial contrast concentration was monitored with region of interest (ROI) (Smart Prep, GE Healthcare) in the abdominal aorta at diaphragm level with a trigger level at 100 Hounsfield Units (HU). Corticomedullary and nephrographic phase images were performed 10 and 80 s after the trigger. The scan parameters for all three phases were kept the same with; tube voltage at 120 kV, variable mA (Smart mA and auto mA modulation, GE Healthcare), noise index at 36∼ and with postprocessing software modulation level at 30 % (Adaptive Statistical Iterative Reconstruction - ASIR, GE Healthcare). Slice thickness was 0.625 mm with rotation speed at 0.5 s/rotation. All images were reconstructed with a soft algorithm and WW/WL at 400/40 in transversal, coronal and sagittal orientation in 3 mm slice thickness with an overlap of 2 mm.
Ultrasonography
The US examinations were all performed with Esaote Mylab 70 XVG® (Esaote, Genova, Italy) and with the CA631, 8-1 MHz transducer. The US machine was equipped with contrast agent tuned imaging real-time contrast agent specific software (CnTI; Esaote) that produce images on the basis of maintenance of microbubbles at low acoustic pressure and subtraction imaging techniques. For contrast media we used a second-generation contrast agent, an aqueous suspension of stabilized sulfur hexaflouride microbubbles with a phospholipidic shall (SonoView®, Bracco, Milan, Italy). Examinations were initiated with 1.5 mL dose of contrast media except in patients with BMI ≥30, in which 2.4 mL of contrast media was used. Contrast media was injected rapidly through an antecubital vein and immediately followed by a flush of 5 mL saline solution (0.9% NaCl). The examination was performed twice in B-mode and CEUS, both perpendicular and angled at the longitudinal axis of the kidney. Between each contrast media injection we performed Doppler 1 min transversal over the abdominal aorta to clear excess contrast media. Before the second contrast media injection, US was performed over the kidney to ensure that no excess contrast media was present. The examinations were evaluated in real time during the corticomedullary and nephrographic phases 2–3 min after contrast media injection. Data were stored in PACS and on an external hard disk.
MR
The MRI examinations were performed using a 1.5-T system (Achieva; Philips Medical Systems, Best, The Netherlands) and a 16-channel Sense XL torso phased-array coil. Respiration trigger was placed under the coil at diaphragm level. All patients underwent survey in three plans with respiration trigger and three plans with breath-hold, respiration triggered T2 turbo spin-echo sequence in transversal and coronal plan, and a three-dimensional fat-suppressed T1-weighted interpolated spoiled gradient-echo sequence (T1 resolution isotropic volume examination or THRIVE, Philips Medical Systems) was performed both prior to contrast media administration, 25 s after contrast media administration for corticomedullary phase and 55 s after contrast media administration for nephrographic phase. Contrast agent was injected rapidly through an antecubital vein and immediately followed by a flush of 10 mL saline solution (0.9% NaCl). Dotarem (Guerbet; Roissy, France) was used as contrast agent. Dotarem is a gadoteric acid with paramagnetic properties, which increase contrast media enhancement in magnetic resonance imaging providing a shortening of T1 relaxation time. MR contrast media was administered as 0.2 mL/kg and a maximum of 20 mL was injected. For all sequences we used sensitivity encoding (SENSE).
Imaging parameters for the T2-weighted (T2W) turbo spin-echo sequence were as follows for transversal sequence: Acquisition, multi single slice; field of view (FOV), 375 × 299; TR, 588; TE, 165; turbo spin factor, 74; matrix, 256 × 143; section thickness, 4 mm; intersection gap, 1 mm; number of excitations (NSA), 3; flip angle, 90°; and approximate scan time, 4–5 min. The T2W coronal turbo spin-echo coronal sequences were performed with the following parameters: Acquisition, multi single slice; FOV, 375 × 375; TR, 429; TE, 80; turbo spin factor, 70; matrix, 256 × 206; section thickness, 4 mm; intersection gap, 0.4 mm; and NSA, 2; flip angle, 90°; and approximate scan time, 1–2 min. The THRIVE sequences were performed with the following parameters: Acquisition, 3D volume imaging; TR, 3.8; TE, 1.85; time to inverse (TI), 90 ms; matrix, 120 × 180; voxel size, 2.5 × 2.5; section thickness, 5 mm; and NSA, 2; flip angle, 10°; and approximate scan time, 18 s.
Outcome and follow-up
Available pathological data and follow up imaging were obtained. Histologic diagnosis was obtained for each surgical specimen. All follow-up CT examinations were performed with the same scanner, technique and contrast agents. Images at follow-up imaging were reviewed in consensus by the same three radiologists.
Statistical analysis
The Cohen weighted κ statistic was used to analyse agreement between CEUS vs. CT and MR vs. CT. Value of weighted κ strength of agreement were chosen as follows: poor (<0.20), fair (0.21–0.40), moderate (0.41–0.60), good (0.61–0.80), and very good (0.81–1.00). Sample size was determined with the assumption of an estimated accuracy of 80% and a 95% confidence interval of +/–10% (6). All statistical analyses were performed with STATA, version 11.2, software (STATA, StataCorp, College Station, TX, USA). A P value of less than 0.05 was considered to indicate a statistically significant difference.
Results
Bosniak category and agreement
All lesions (n = 46) were categorized with triple phase CT according to the Bosniak classification: Category II (n = 27), IIF (n = 6), III (n = 7), and IV (n = 6).
CEUS
Forty-three lesions were examined in 44 patients: 34 lesions (79%) were correctly categorized by CEUS using CT as gold standard with a weighted κ value of 0.86 (CI: 0.83–0.92, P ≤ 0.0001). Five BII lesions were upgraded to BIIF. Four lesions (two BIV, one BIII, and one BIIF) were categorized lower with CEUS.
MRI
Forty-one lesions were examined in 39 patients: 32 lesions (78%) were correctly categorized by MRI using CT as gold standard with a weighted κ value: 0.91 (CI: 0.85–0.93, P ≤ 0.0001). Three BII lesions were upgraded to BIIF and six lesions (one BIV, four BIII, and one BIIF) were categorized one category lower by MRI.
Patient and lesion characteristics
A total of 44 patients with 46 complex cystic renal masses were included in the study: 25 men (mean age, 64.8 years; age range, 42–80 years) and 19 women (mean age, 62.5 years; age range 42–83 years). The maximum diameter of the 46 complex cysts was in the range of 8–130 mm (mean, 33 mm). The mean BMI of the patients was 28.5 (range, 20–50).
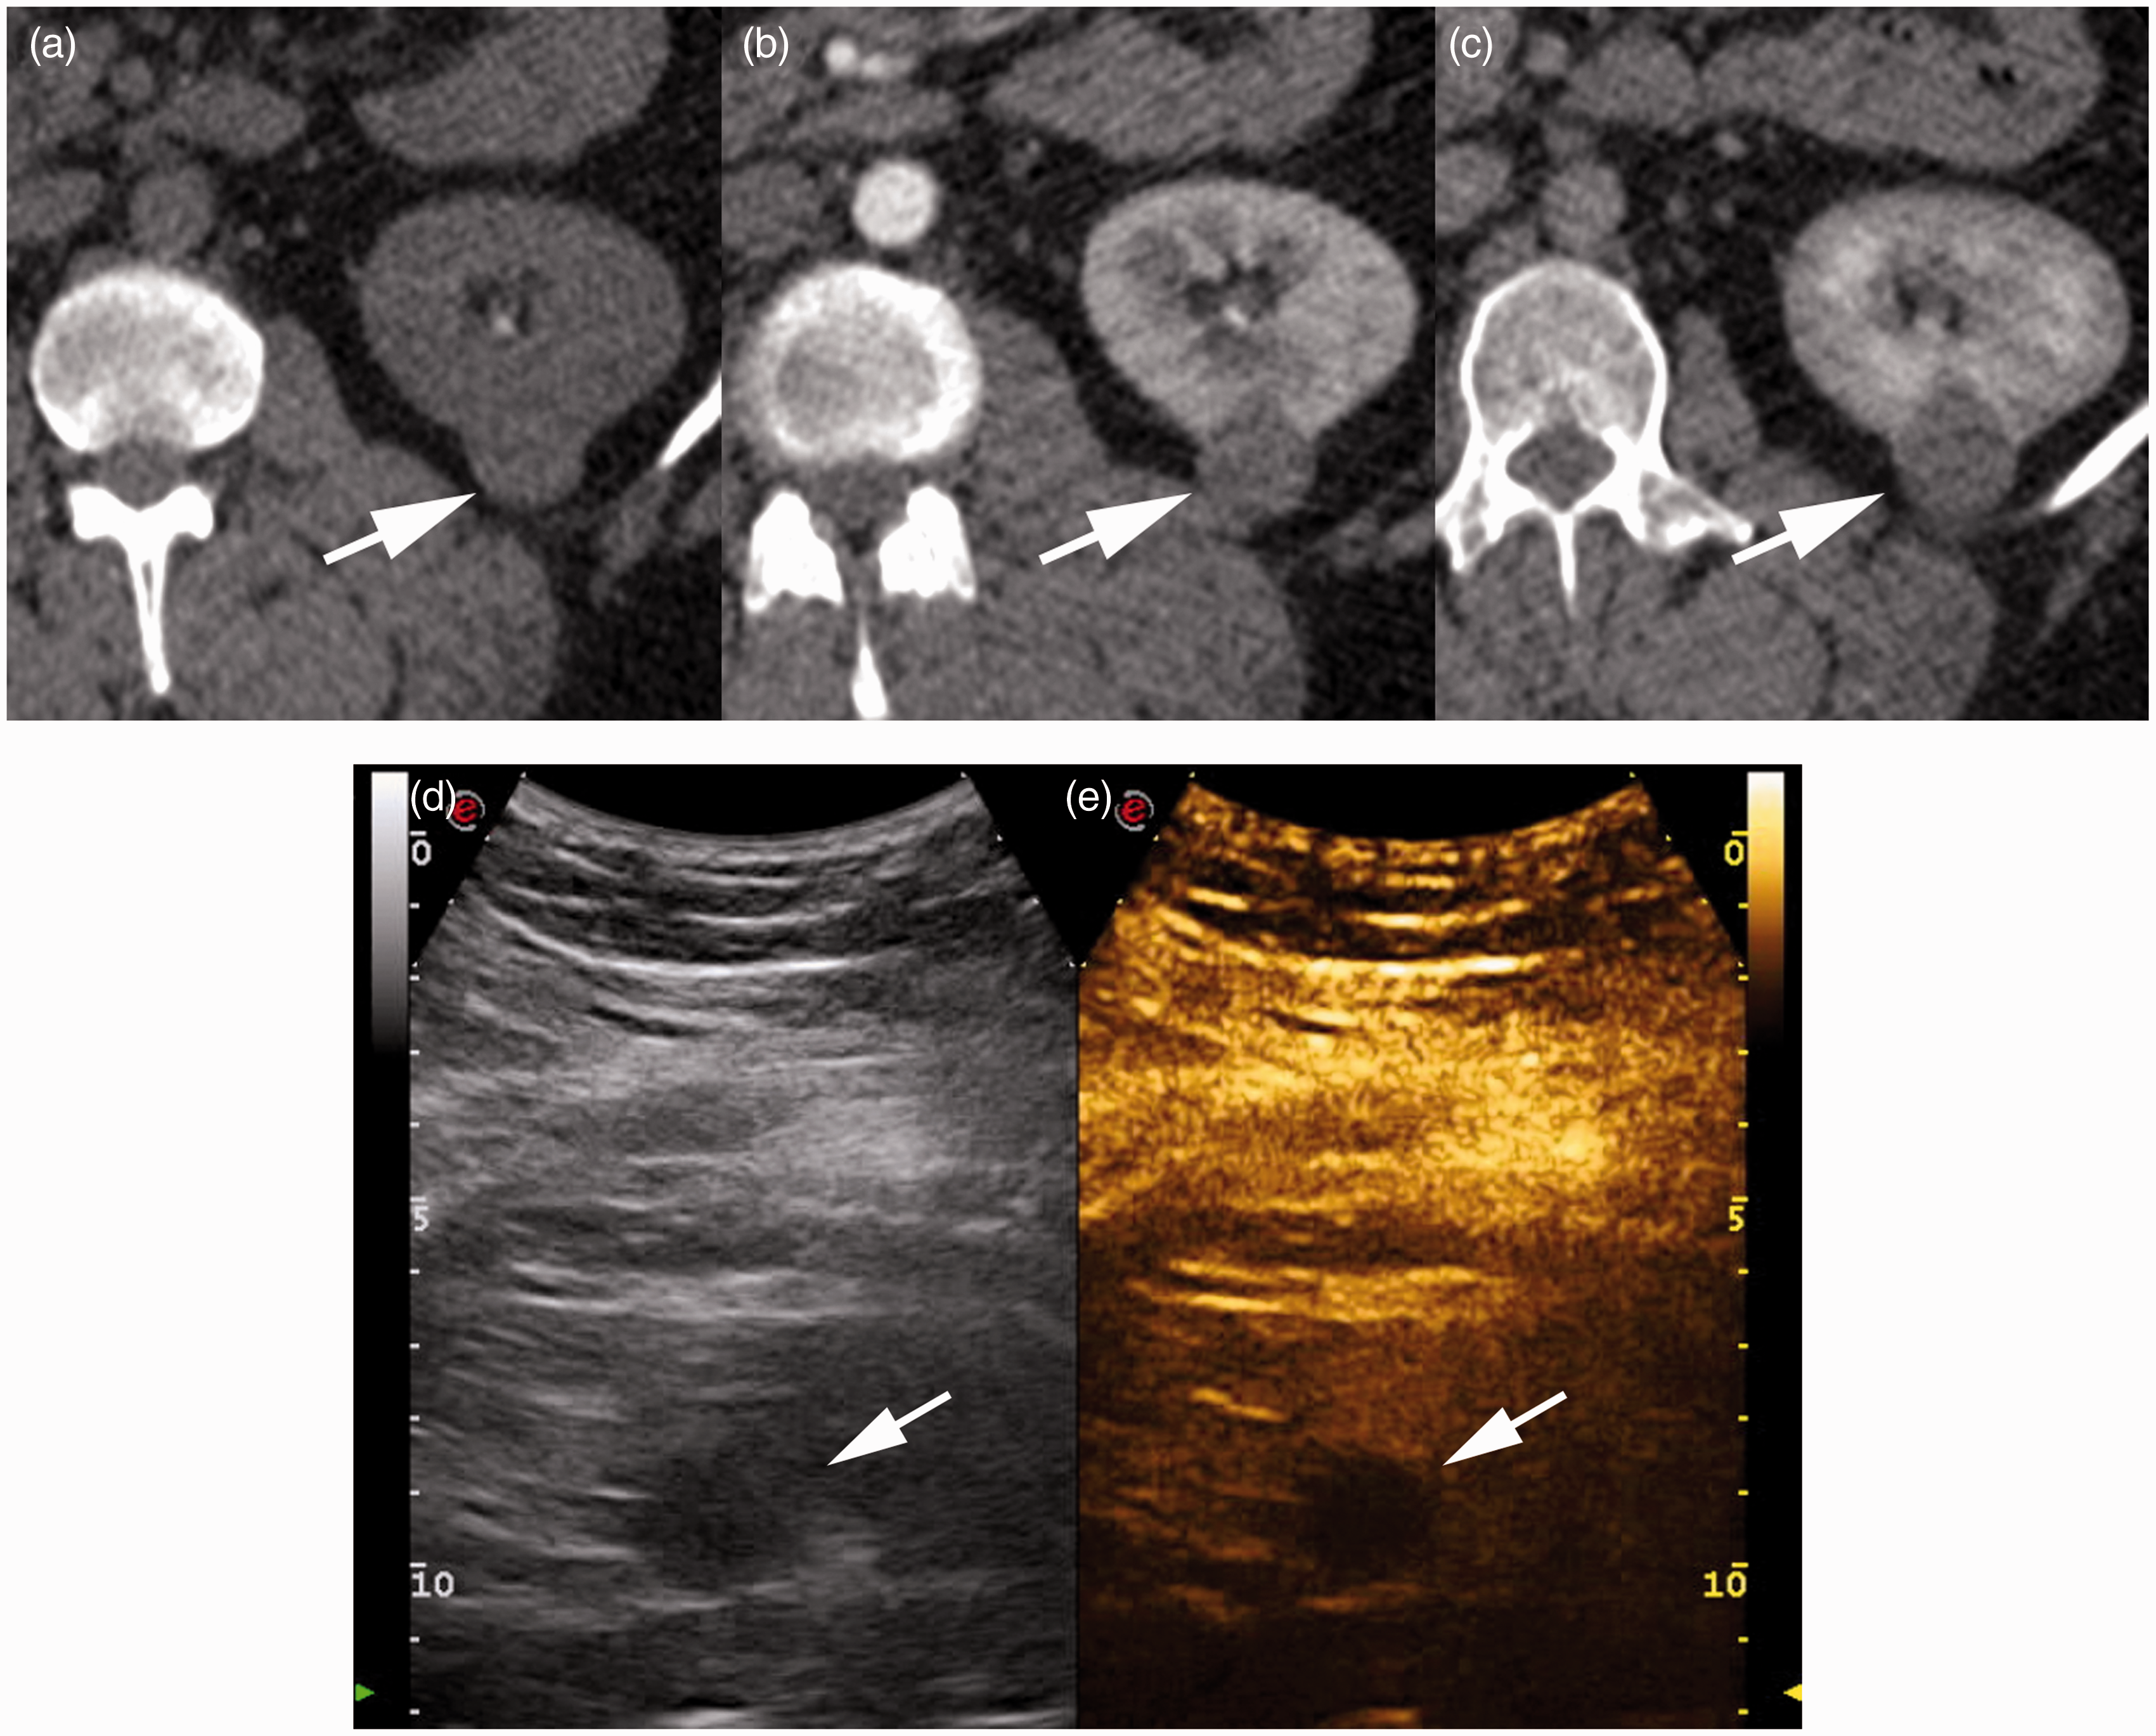
Three lesions were too small to categorize with ultrasonography (BII: 11 mm; BIIF: 12 mm; and BIII: 13 mm) (Fig. 1). Five patients were not evaluated by MRI: one patient had claustrophobia and three bariatric patients could not fit into the body coil (BMI: 36, 41, and 50) (Fig. 2), and one case was excluded because of poor image quality due to severe respiration-induced artifacts. Detailed data outcome are presented in Table 1 (online only).
A 67-year-old woman (patient 25) with a 13 mm. intrarenal complex renal cystic mass localized medially in the right kidney. The cystic mass (white arrow) showed minimal thickening of the wall and septa with 30 HU (not shown) enhancement on transversal triple phase CT. (a) Unenhanced, (b) corticomedullary phase, and (c) nephrographic phase, suggesting BIII. The septa were not clearly shown on transversal THRIVE-weighted MR images. (d) Unenhanced, (e) corticomedullary phase, and (f) nephrographic phase, suggesting BIIF. On ultrasonography the lesion was too small to categorize. No progression was seen after 12 months follow up with CT. A 42-year-old bariatric woman (patient 34), BMI 50, with a 25 mm. mostly exophytic complex renal mass posteriorly in the left kidney. The cystic mass (white arrow) was hyperdense without enhancement shown on transversal triple phase CT. (a) Unenhanced, (b) corticomedullary phase, (c) nephrographic phase, ultrasonography (d) B-mode, and (e) CEUS. The bariatric patient could not fit the MR body coil. CT and ultrasonography both suggested BII.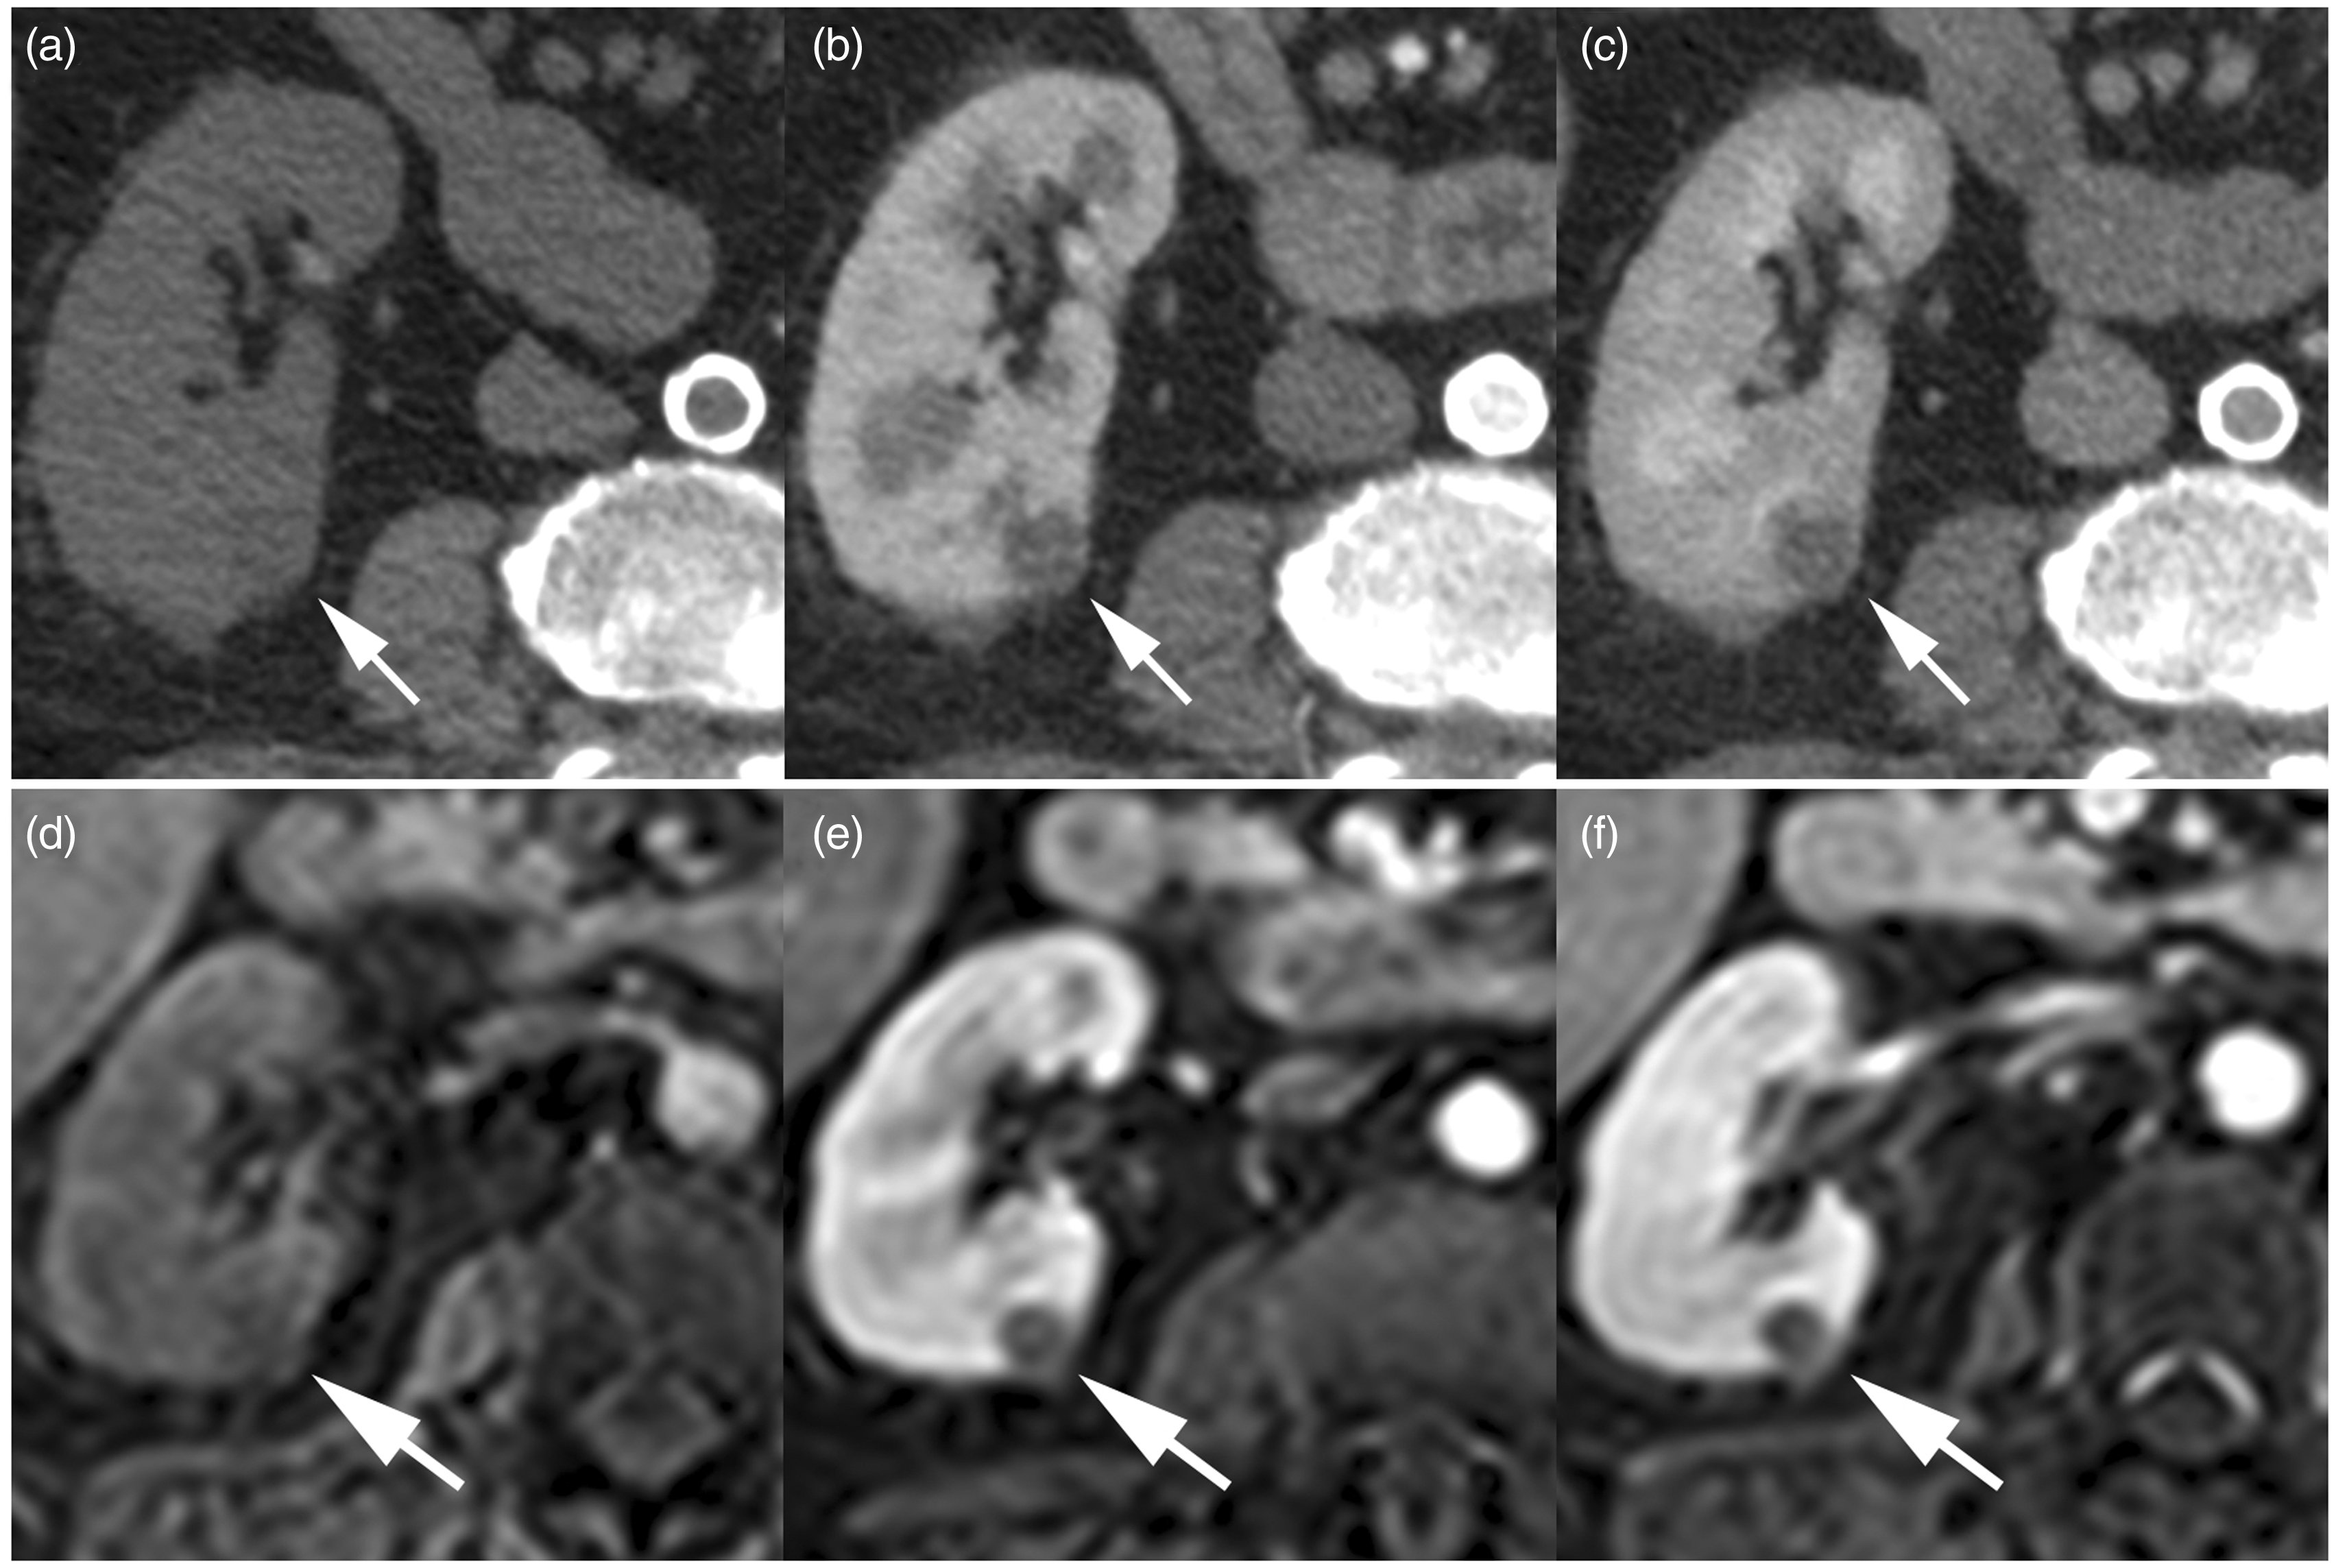
Pathological correlation and follow-up imaging
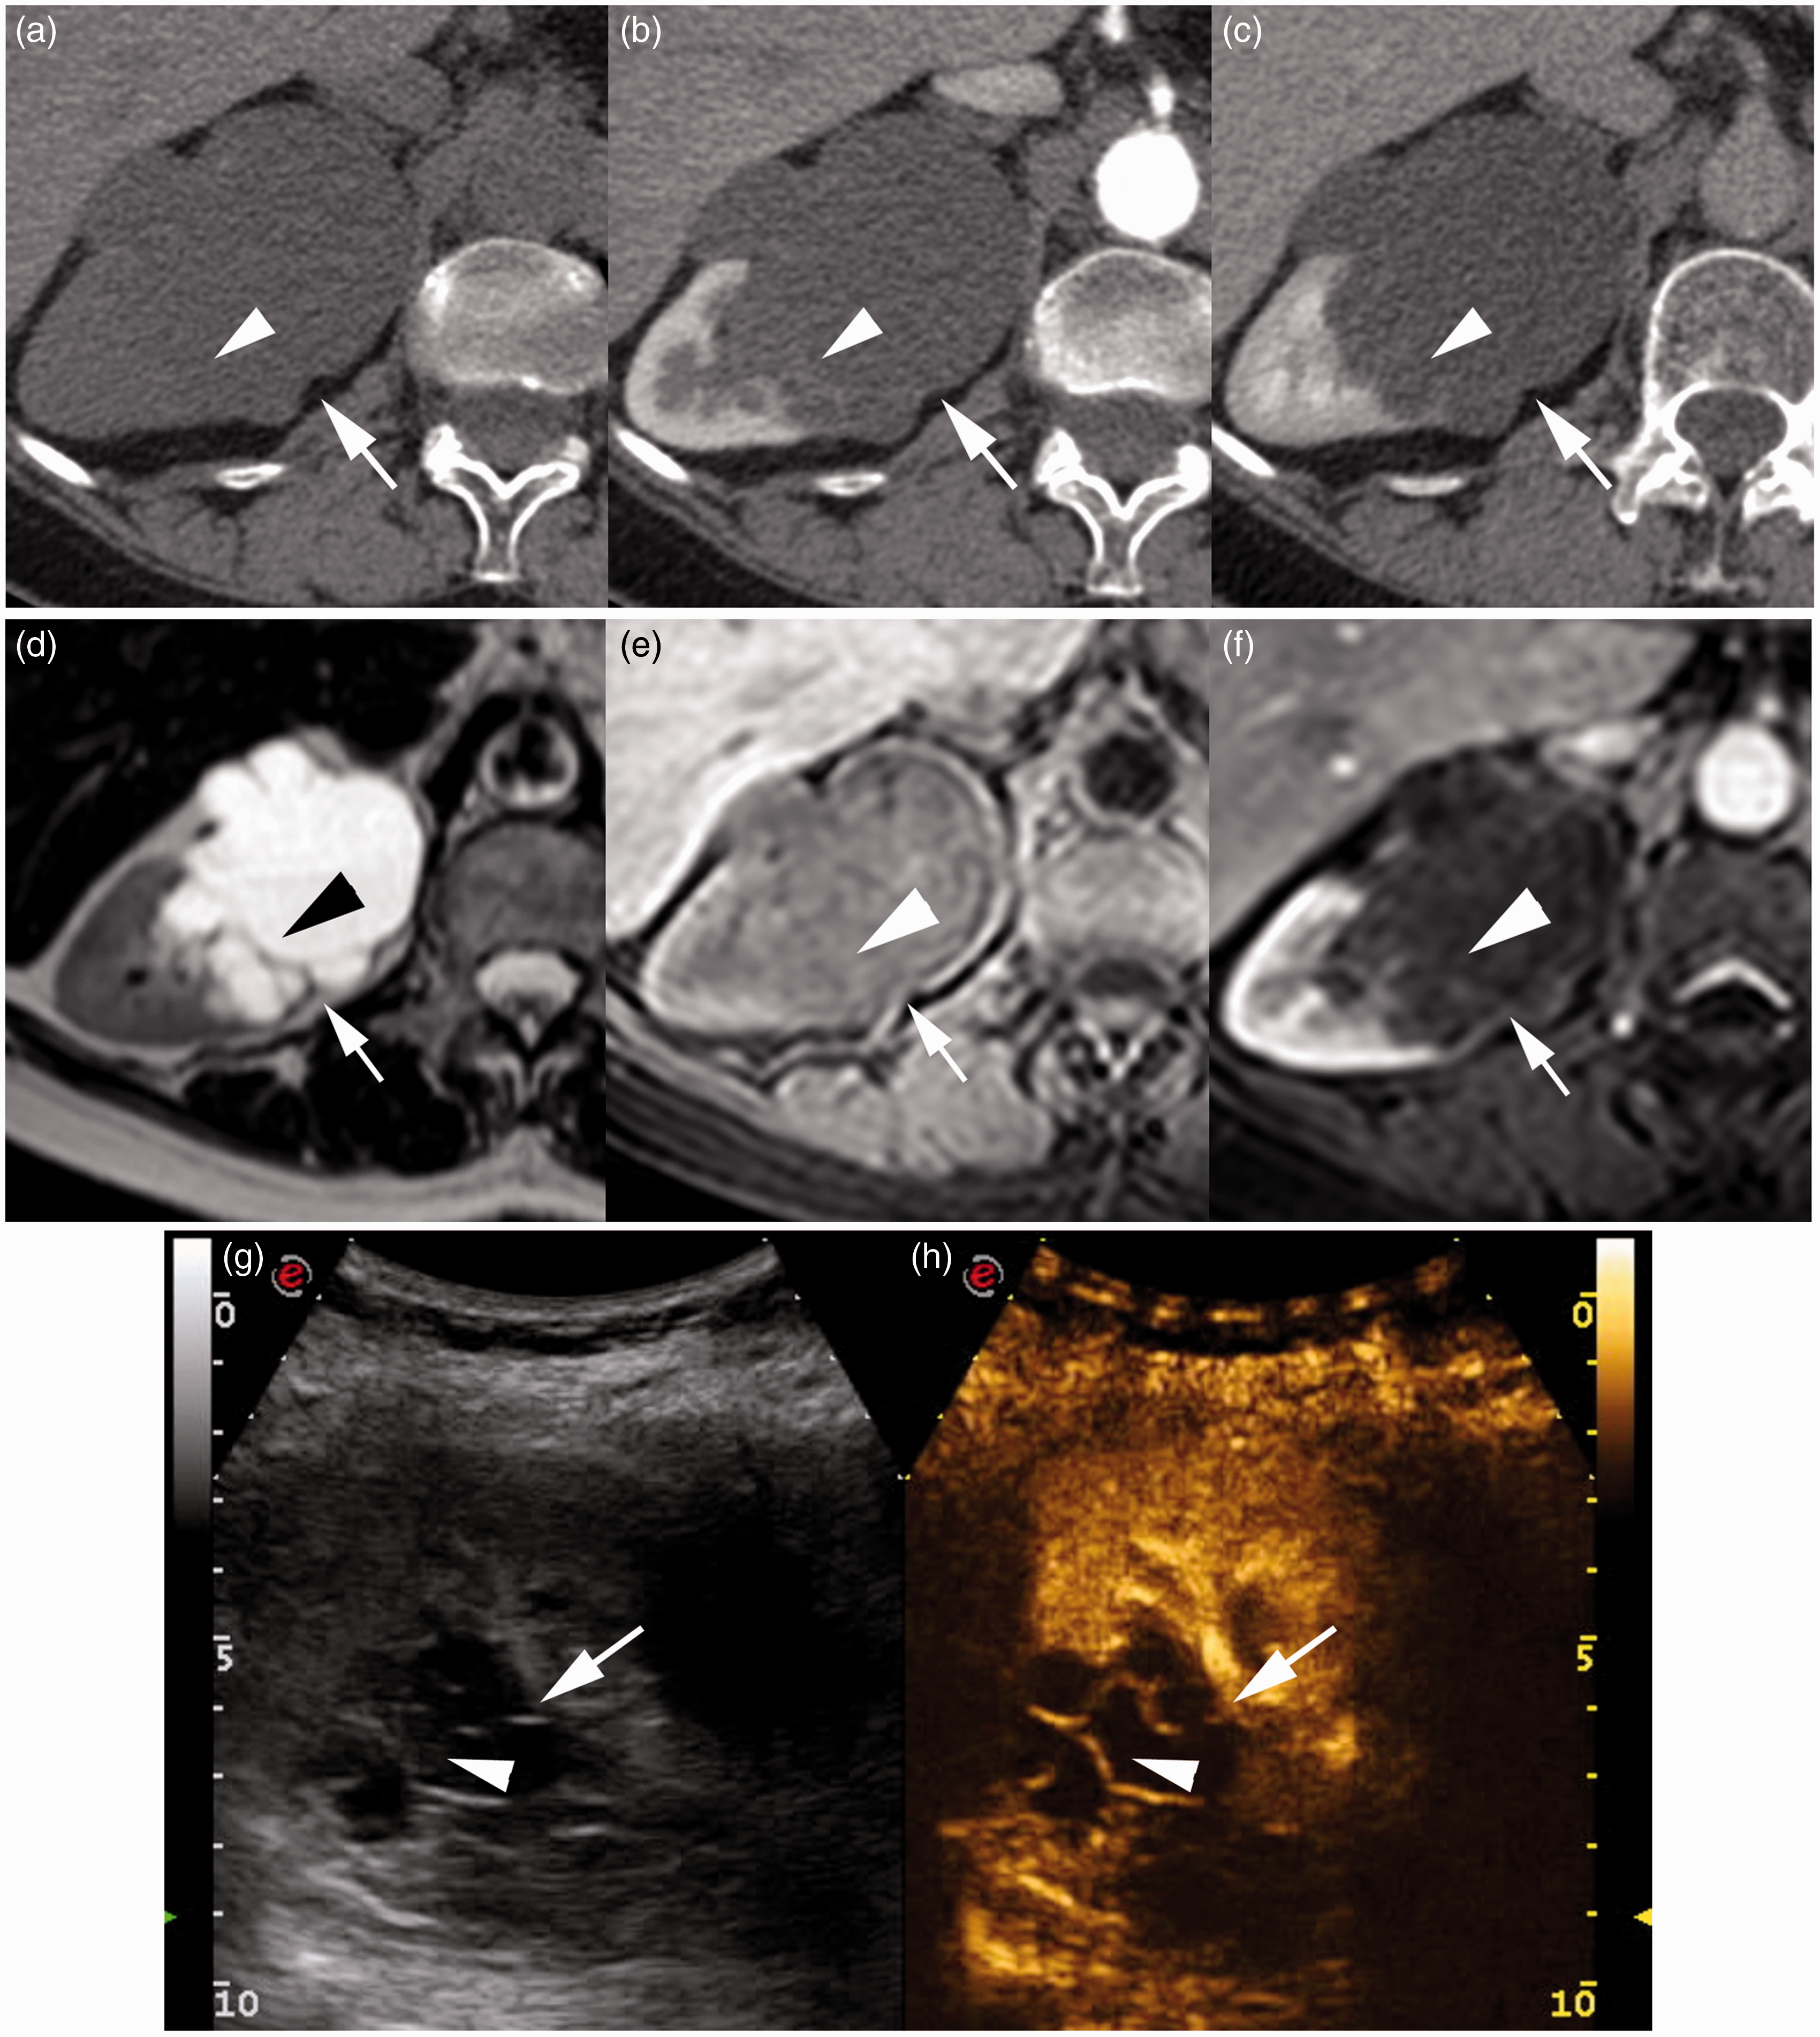
The final pathological diagnoses of six renal masses (two category III lesions and four category IV lesions) after surgery were as follows: four BIV masses were cystic renal cell carcinomas: all clear cell carcinoma with Fuhrman grade II, pT3 (n = 1) and pTla (n = 3) (patient 7; Fig. 3). Two surgically removed BIII cysts were chronic inflammatory cysts (patient 26; Fig. 4). One patient with a BIV lesion refused surgery. No progression was seen after the first 3 months of follow-up. Five patients with BIII complex cystic masses were in a poor general condition, and a conservative regime was chosen for these patients with a mean follow up of 27 months (range, 0–72 months) (patient 16, Fig. 5). Follow-up imaging for Bosniak category IIF lesions (n = 6) were available in four cases with a mean follow-up period of 3.5 years (range, 2.5–4.5 years). The remaining patients (n = 27) with 28 Bosniak category II lesions were discharged with no further follow-up examinations. Pathological outcome and follow-up imaging data correlated to CT, MRI, and CEUS are presented in Table 1 (online only).
A 67-year-old man (patient 7) with a 12 mm partly exophytic complex renal cystic mass localized laterally in the left kidney. The cystic mass (white arrow) had a nodular contrast enhancing component (white arrowhead) shown on transversal triple phase CT. (a) Unenhanced, (b) corticomedullary phase, and (c) nephrographic phase; transversal THRIVE-weighted MR image (d) unenhanced, (e) corticomedullary phase, and (f) nephrographic phase; and coronal ultrasonography (g) B-mode and (h) CEUS. All modalities indicative of BIV. Pathological diagnosis was clear-cell RCC grade II, pT1a. A 65-year-old woman (patient 26) with a 75 mm mostly exophytic complex renal mass in the right kidney. The cystic mass (white arrow) had minimal thickening of wall and multiple septa. On CT the septa close to the normal renal parenchyma (white arrow) shows minimal enhancement (25 HU, not shown) on transversal triple phase CT. (a) Unenhanced, (b) corticomedullary phase, and (c) nephrographic phase, all suggesting BIII. Transversal MR images (d) T2W, (e) unenhanced THRIVE-weighted MR image, (f) THRIVE-weighted MR image in nephrographic phase, and transversal ultrasonography (g) B-mode and (h) CEUS showed pseudoenhancement in septa and cyst wall, suggesting BIIF. Pathological diagnosis was a benign multilocular chronic inflammatory cyst. A 59-year-old man (patient 16) with a 75 mm intrarenal complex renal cystic mass in the right kidney. The cystic mass (white arrow) has minimal thickening of the wall and multiple septa with enhancement (white arrow) shown on transversal triple phase CT (a) unenhanced, (b) corticomedullary phase, and (c) nephrographic phase; transversal MR (d) T2W, (e) unenhanced THRIVE-weighted MR image, and (f) THRIVE-weighted MR image in nephrographic phase; and transversal ultrasonography (g) B-mode and (h) CEUS. All modalities suggestive of BIII. Patient refused surgery and no progression was seen after 4 years of follow-up with MRI.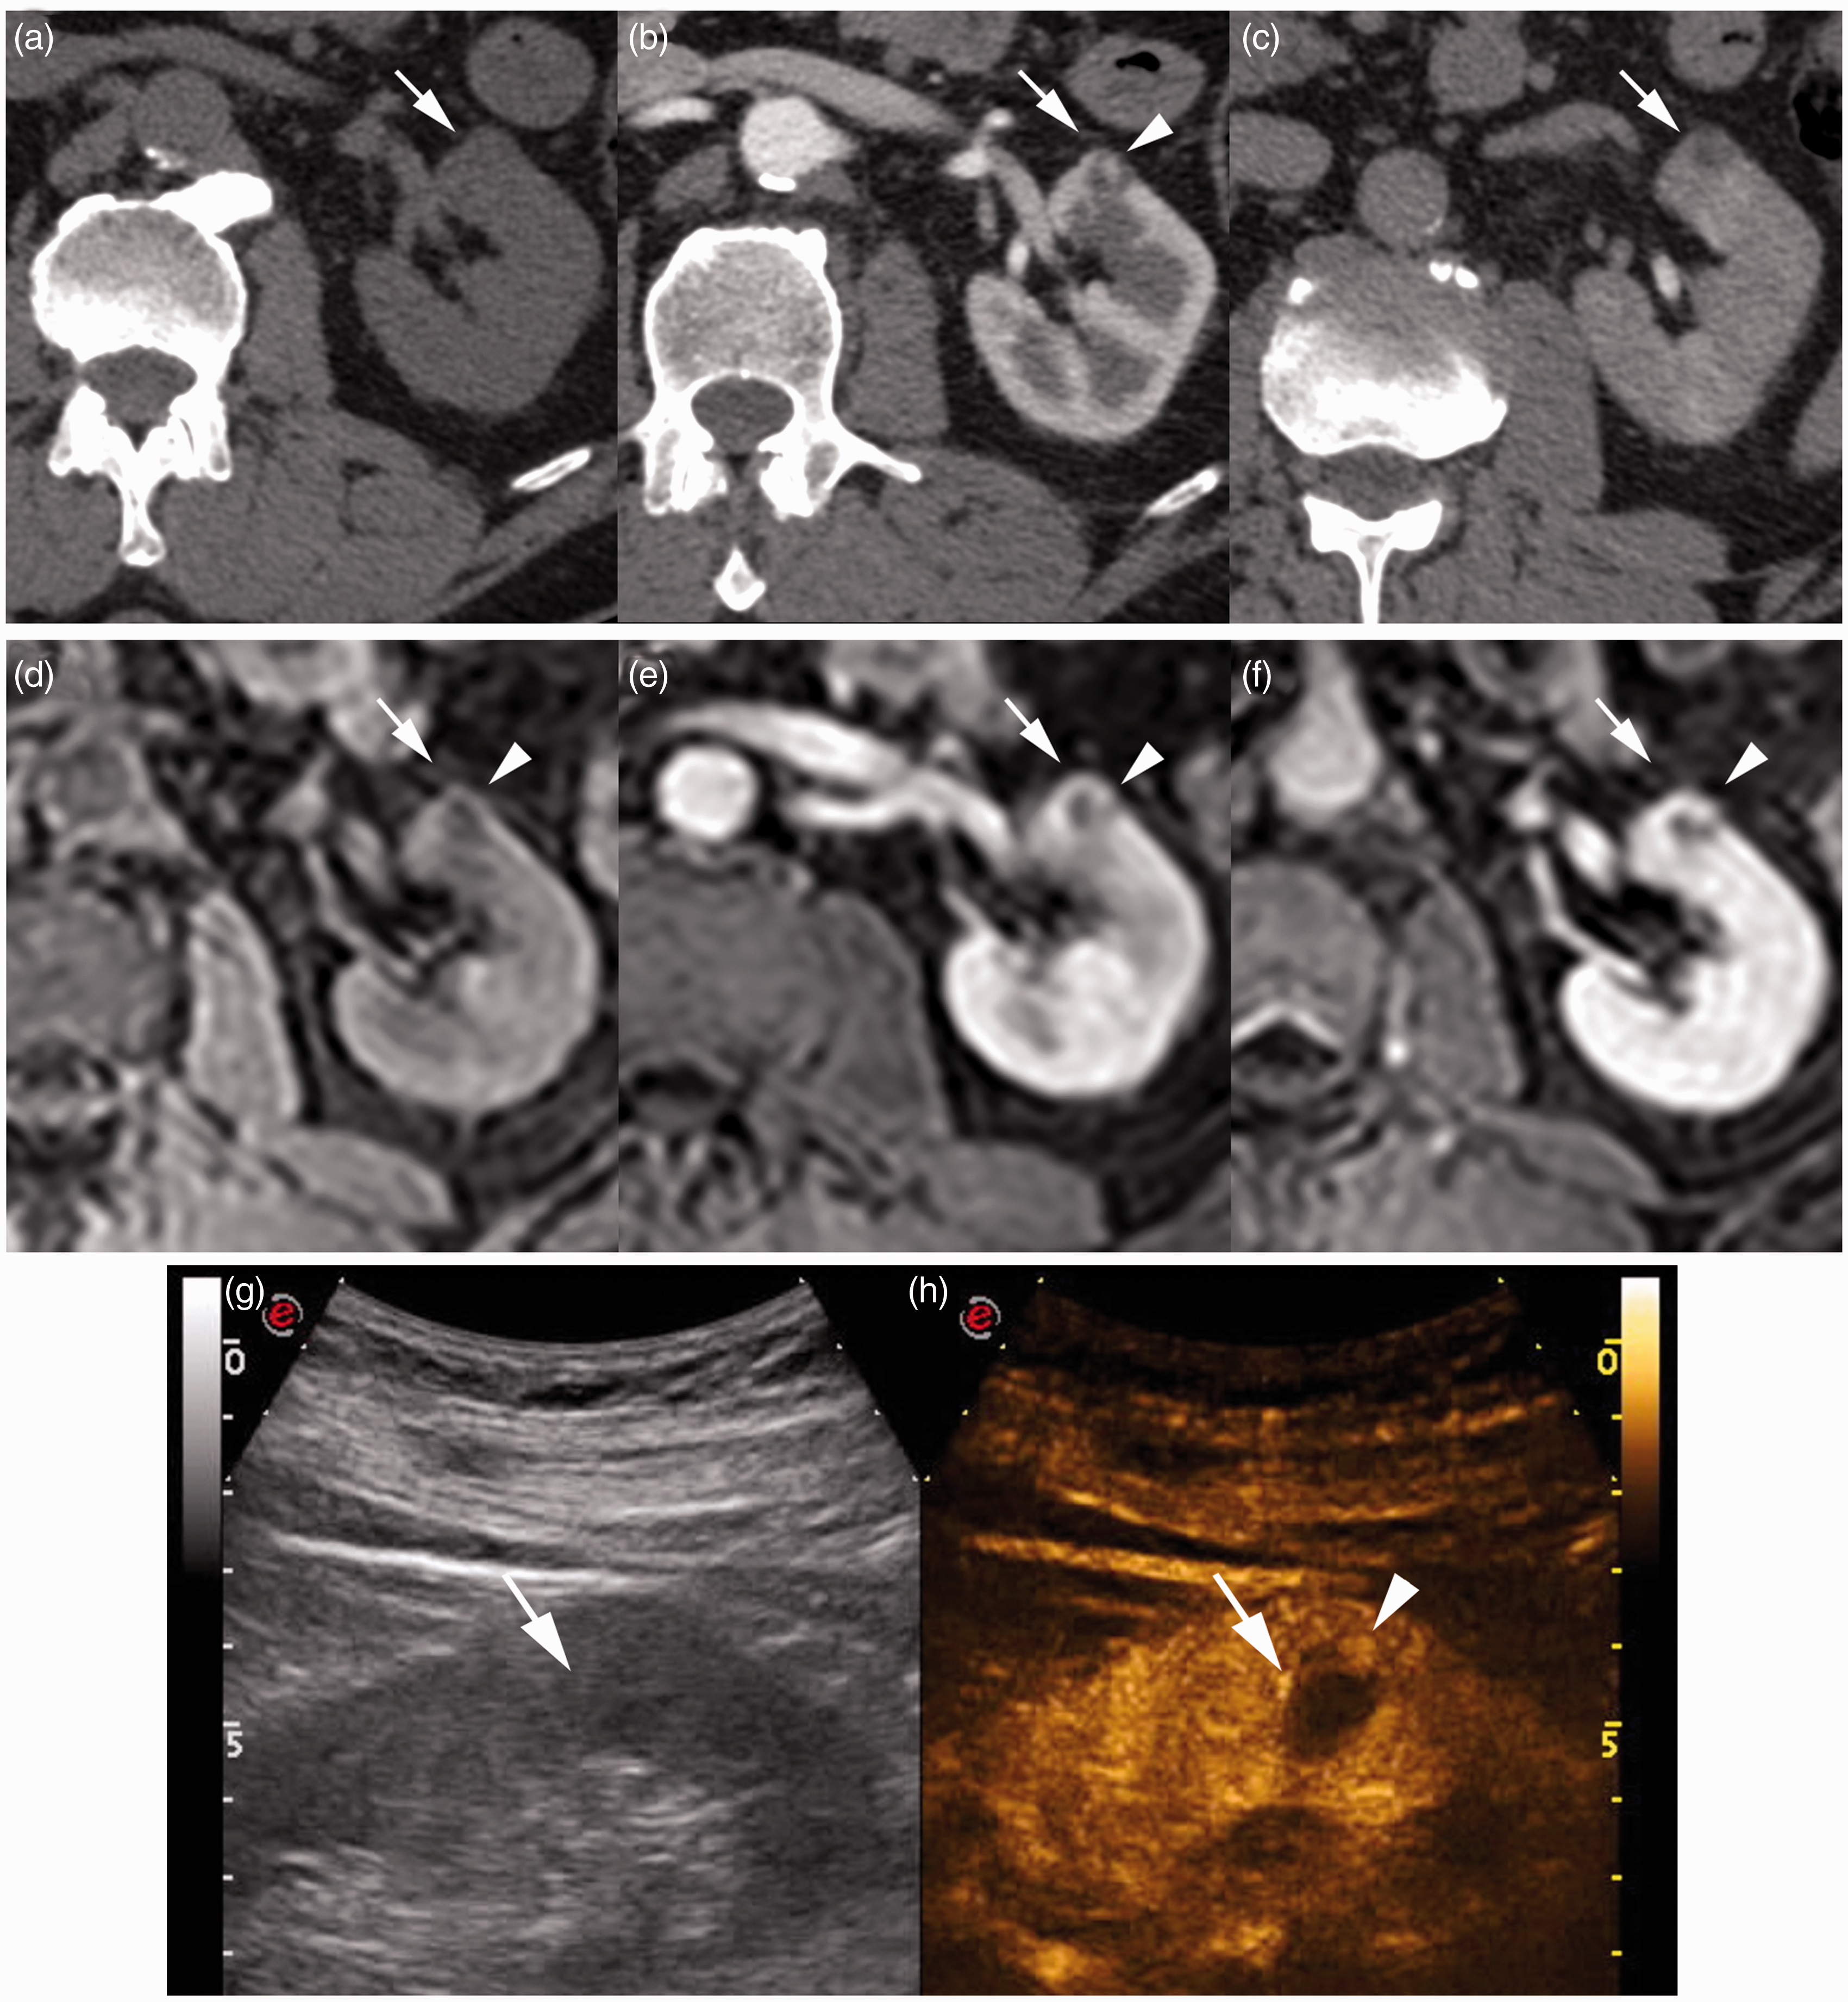

Discussion
The Bosniak classification was initially developed solely on the basis of CT findings (1–4). Subsequently, a few studies have suggested that MRI (7,8) and CEUS (9–16) may be equally useful for characterization of complex renal cystic masses. These studies are predominantly based on retrospective series. To our knowledge this is the first prospective study comparing CT, MRI, and CEUS.
MRI has the advantage of higher contrast resolution, which often makes septa look thicker, and enhancement of the cystic wall and septa becomes more apparent. This may cause lesions to be classified in a higher category compared with CT (1,7,8). MRI also has a better contrast enhancement, which better discriminate cystic content from solid tissue as in one of our case primarily categorized as a BIII lesion by CT, downgraded by MRI and histologically verified as an inflammatory cyst. In a related retrospective study with 69 renal cystic masses 13 (19%) lesions were graded different by MR (8). This corresponds well with our findings, where MR resulted in both Bosniak up- and downgrading in 22% of the cases. Our study was carried out without subtraction technique and diffusion-weighted imaging. Newly published studies suggest that subtraction technique and diffusion-weighted imaging may have additional value for the characterization of complex cystic renal masses (17,18).
CEUS may MRI provide more detailed information about septa, cystic walls, and enhancement of structures not depicted at CT because of CEUS’s higher contrast resolution. Furthermore, CEUS provides a real-time dynamic evaluation during the corticomedullary and nephrographic phases of the kidneys. Furthermore CEUS may be performed bedside, and it can be used in patients with impaired renal function and in patients with ureteral obstruction (9,11,13–16,19,20). In a recent study CT and CEUS images of 31 pathologically confirmed cystic renal masses were retrospectively analysed using the characteristics of the Bosniak classification (15). Agreement between CEUS and CT images were seen in 23 (74%, κ = 0.77)) lesions, which corresponds well with our prospective data in which CEUS-CT concordance rate was 79% (κ = 0.89). In their study eight lesions (26%) were upgraded by CEUS compared to CT. In the present study CEUS both up- and downgraded 21% of the lesions, suggesting that CEUS may be superior to CT and similar to MRI with regard to differentiating cystic content from solid tissue due to better contrast enhancement. A recently published study even suggest that CEUS might be useful in histologic subtype prediction and clinical management of cystic renal mass (19).
In this study and similar studies, CT, MRI, and CEUS findings are very similar in the majority of complex cystic renal masses with a high κ values. The non-radiation nature of MRI and CEUS justify clinical implication of these modalities. The higher contrast resolution of MRI and CEUS could result in earlier detection of potential malignant lesions and therefore give a better therapeutic approach, but it may also result in higher false-positive rates. Therefore further prospective studies including histological correspondence data is warranted.
Our study has several limitations. First, CT was chosen as gold standard. It would have been preferred to use pathological outcome as gold standard but obviously it would be impossible to surgery remove all renal cystic masses. Second, patients included in this study are limited. Third, a relatively small number of pathologically proved cases were included. Thus, further investigation in surgical cases is needed to support our results. Fourth, regarding modality include difficulties in characterizing smaller lesions and problems with diagnosing lesions in severely obese patients. Especially, smaller lesions within the renal parenchyma may be difficult to characterize with CEUS, since such lesions often disappear (“drown”), when contrast is administrated due to the rich vascularity of the kidneys. Fifth, lack of MRI subtraction technique and diffusion-weighted imaging.
In conclusion, CT, MRI, and CEUS findings were similar in the majority complex cystic renal masses. Concordance rates were approximately 80% with weighted good to very good κ values. Both CEUS and MRI up- and downgraded renal cystic masses compared to CT.
Footnotes
Declaration of conflicting interests
The author(s) declared no potential conflicts of interest with respect to the research, authorship, and/or publication of this article.
Funding
The author(s) received no financial support for the research, authorship, and/or publication of this article.
References
Supplementary Material
Please find the following supplemental material available below.
For Open Access articles published under a Creative Commons License, all supplemental material carries the same license as the article it is associated with.
For non-Open Access articles published, all supplemental material carries a non-exclusive license, and permission requests for re-use of supplemental material or any part of supplemental material shall be sent directly to the copyright owner as specified in the copyright notice associated with the article.