
Abstract
Background
Thymoma exhibits a range of histological and biological features and their imaging findings varies.
Purpose
To evaluate the associations between CT findings of thymomas and their classification according to the Masaoka staging system and World Health Organization (WHO) classification.
Material and Methods
Eighty-four patients with thymoma were evaluated. Comparisons between the CT findings of Masaoka stage I/II and III/IV lesions, and the WHO type A-B1 (low risk) and B2/B3 (high risk) lesions were performed.
Results
Stage III/IV thymomas (mean size, 60 mm) were significantly larger than stage I/II (45 mm) lesions and had more irregular shape and contour. Necrosis and calcification were observed in 16 (59%) and nine (33%) stage III/IV thymomas, and 16 (28%) and seven (12%) stage I/II lesions, respectively. Regarding the WHO classification, the high-risk thymomas displayed irregular shape and contour more often than low-risk lesions. There were significant differences between the patterns of mediastinal invasion seen in high- and low-risk groups; 21 (68%) vs. six (12%) lesions demonstrated mediastinal fat invasion, seven (23%) vs. two (4%) lesions exhibited great vessel invasion, five (16%) vs. 0 (0%) lesions displayed pericardial invasion, and 18 (58%) vs. 10 (20%) lesions invaded the lungs, respectively.
Conclusion
Masaoka stage III/IV thymomas were larger in size, had more irregular shape and contour, and exhibited necrosis and calcification more often than the stage I/II lesions. In the WHO classification, high-risk thymomas demonstrated more irregular shape and contour than low-risk thymomas.
Introduction
Thymoma is the most common primary neoplasm of the anterior mediastinum. Thymomas usually develop between the fourth and sixth decades of life and exhibit a range of histological and biological features so their prognosis varies (1,2). Thymomas are often divided into invasive and non-invasive lesions and are classified according to Masaoka staging system (3). Traditionally, Masaoka stage II/III/IV thymomas have been considered as invasive thymomas versus stage I. However, a simpler classification of early (stage I/II) and advanced (stage III/IV) stage thymomas based on the Masaoka staging system might be useful because it could help to identify patients who are more likely to benefit from neoadjuvant therapy (preoperative chemotherapy) (4–6). The preoperative diagnosis of advanced stage thymomas would allow neoadjuvant therapy to be selected. Therefore, computed tomography (CT)-based evaluation could aid treatment planning in patients with thymomas. On the other hand, as a type of thymic epithelial tumor, thymomas have also been categorized into types A, AB, B1, B2, and B3 in the World Health Organization (WHO) histological classification published in 1999 (7) (and revised in 2004 (8)). There have been several reports about the association between the various types of thymoma according to the World Health Organization (WHO) system classification and CT or magnetic resonance imaging (MRI) features (9–13). In some of the latter reports, the investigators classified thymomas into low-risk and high-risk lesions, which are equivalent to type A-B1 and B2 or B3 lesions, respectively (11,12). However, only a few studies about CT characteristics of low- and high-risk thymomas have been reported so far (11–13). So, the purpose of this study was to evaluate the associations between CT findings of thymomas and their classification according to the Masaoka staging system and the WHO classification, i.e. Masaoka stage I/II versus III/IV, and low-risk versus high-risk thymomas.
Material and Methods
Patients
Eighty-four pathologically proven thymomas that were encountered between 1986 and 2007 were included in this study. The institutional review board approved this retrospective study, and no individual patient consent was required. The material included 41 men and 43 women, with a mean age of 52 years (age range, 20–81 years). In total, 32, 25, 12, and 15 tumors were classified as Masaoka stage I, II, III, and IV, respectively (stage IVa, n = 12; stage IVb, n = 3). Each Masaoka stage was defined as follows (3): Stage I, an encapsulated tumor is observed during macroscopic examinations, and no capsular invasion is detected during microscopic examinations; stage II, (i) invasion into the surrounding fatty tissue of the mediastinal pleura is observed during macroscopic examinations, or (ii) invasion into the capsule is seen during microscopic examinations; stage III, invasion into a neighboring organ is detected during macroscopic examinations; stage IVa, pleural or pericardial dissemination is observed; and stage IVb, lymphogenous or hematogenous metastasis is detected. In this study, the term “invasive thymoma” refers to Masaoka stage II, III, and IV disease. According to the WHO histological classification published in 1999 (and revised in 2004), five, 34, 12, 21, two, eight, and two tumors were classified as type A, AB, B1, B2, B2 + B3, B3, and others, respectively.
CT imaging
All of the patients underwent preoperative CT examinations. The CT images were obtained with a variety of scanners including a 4-row multidetector CT (MDCT) (Somatom Plus 4; Siemens, Erlangen, Germany) and a 16-row MDCT (IDT 16; Philips Medical Systems, Cleveland, OH, USA). The slice thickness was 3 mm in 54 cases, 5 mm in 10 cases, 7 mm in five cases, and 10 mm in 15 cases. Contrast-enhanced CT images were obtained in 80 of 84 cases.
Image interpretation
Two thoracic radiologists blinded to the patients’ pathological findings evaluated the following CT features: location, size, shape, and contours of the tumor; contrast enhancement pattern; and presence/absence of compression of the mediastinum, necrosis, calcification, mediastinal or hilar lymphadenopathy, pleural effusion, and pericardial effusion. Tumors in the anterior mediastinum were classified into centrally located, right-sided, and left-sided lesions. Any tumors that were located around or on the line running through the sternum were considered to be located centrally. Tumor size was measured based on the length of each tumor’s major and minor axes on the largest transaxial image. The shape of the tumors was classified into round or oval, lobulated, and irregular, and the contours were classified into smooth, slightly irregular, and irregular. On CT, necrosis was defined as areas of low signal intensity that demonstrated similar signal intensity to water and/or areas that displayed weak contrast enhancement. The tumors’ contrast enhancement patterns were classified into homogenous or heterogeneous. Lymphadenopathy was defined as a minor axis of > 1 cm. We also assessed the presence/absence of pleural dissemination and the extent to which the tumor had invaded the surrounding organs (the mediastinal fat, superior vena cava, brachiocephalic veins, pericardium, and lungs) on CT. We basically diagnosed invasion according to the following criteria: (i) invasion into the surrounding mediastinal fat: the contours of the mediastinal tumor were irregular, and the tumor protruded into the mediastinal fat tissue; (ii) pericardial invasion: the border between the tumor and the pericardium was irregular. The presence/absence of pericardial effusion was also taken into consideration; (iii) blood vessel invasion: the border between the tumor and the relevant blood vessel was irregular or the tumor protruded into the blood vessel; (iv) lung invasion: the border between the tumor and the relevant lung was irregular. For all CT findings, the final diagnoses were made on a consensus basis.
We also compared the CT findings of the Masaoka stage I/II lesions with those of the stage III/IV lesions, and the CT findings of the WHO type A-B1 (low-risk thymoma) lesions with those of the B2 or B3 (high-risk thymoma) lesions.
Statistical analysis
During comparisons between the low-risk and high-risk thymomas, or between the Masaoka stage I/II and III/IV lesions, the Mann–Whitney U test was used for comparisons of tumor size, tumor shape, tumor contours, and the degree of mediastinal compression, and Fisher’s exact test was used for comparisons of the presence/absence of necrosis, calcification, the contrast enhancement pattern, mediastinal or hilar lymphadenopathy, and pleural or pericardial effusion. P values of less than 0.05 were considered to indicate a significant difference.
Results
Of the 84 thymomas, 57 were categorized as stage I or II lesions and 27 were categorized as stage III or IV. Of the 82 thymomas that were classified using the WHO classification, 51 thymomas were categorized as low-risk, and 31 were categorized as high-risk. Invasive thymomas (Masaoka stage II, III, and IV) accounted for 24 (47%) of the 51 low-risk thymomas and 26 (84%) of the 31 high-risk thymomas. The numbers of invasive thymomas in each WHO type were as follows: type A, n = 3 (60%); type AB, n = 17 (50%); type B1, n = 4 (33%); type B2, n = 18 (86%); and types B2 + B3 and B3, n = 8 (80%). The numbers of Masaoka stage III/IV lesions in each WHO type were as follows: type A, n = 1 (20%); type AB, n = 3 (8.8%); type B1, n = 2 (17%); type B2, n = 13 (62%); and types B2 + B3 and B3, n = 8 (80%).
CT findings of 84 thymomas.
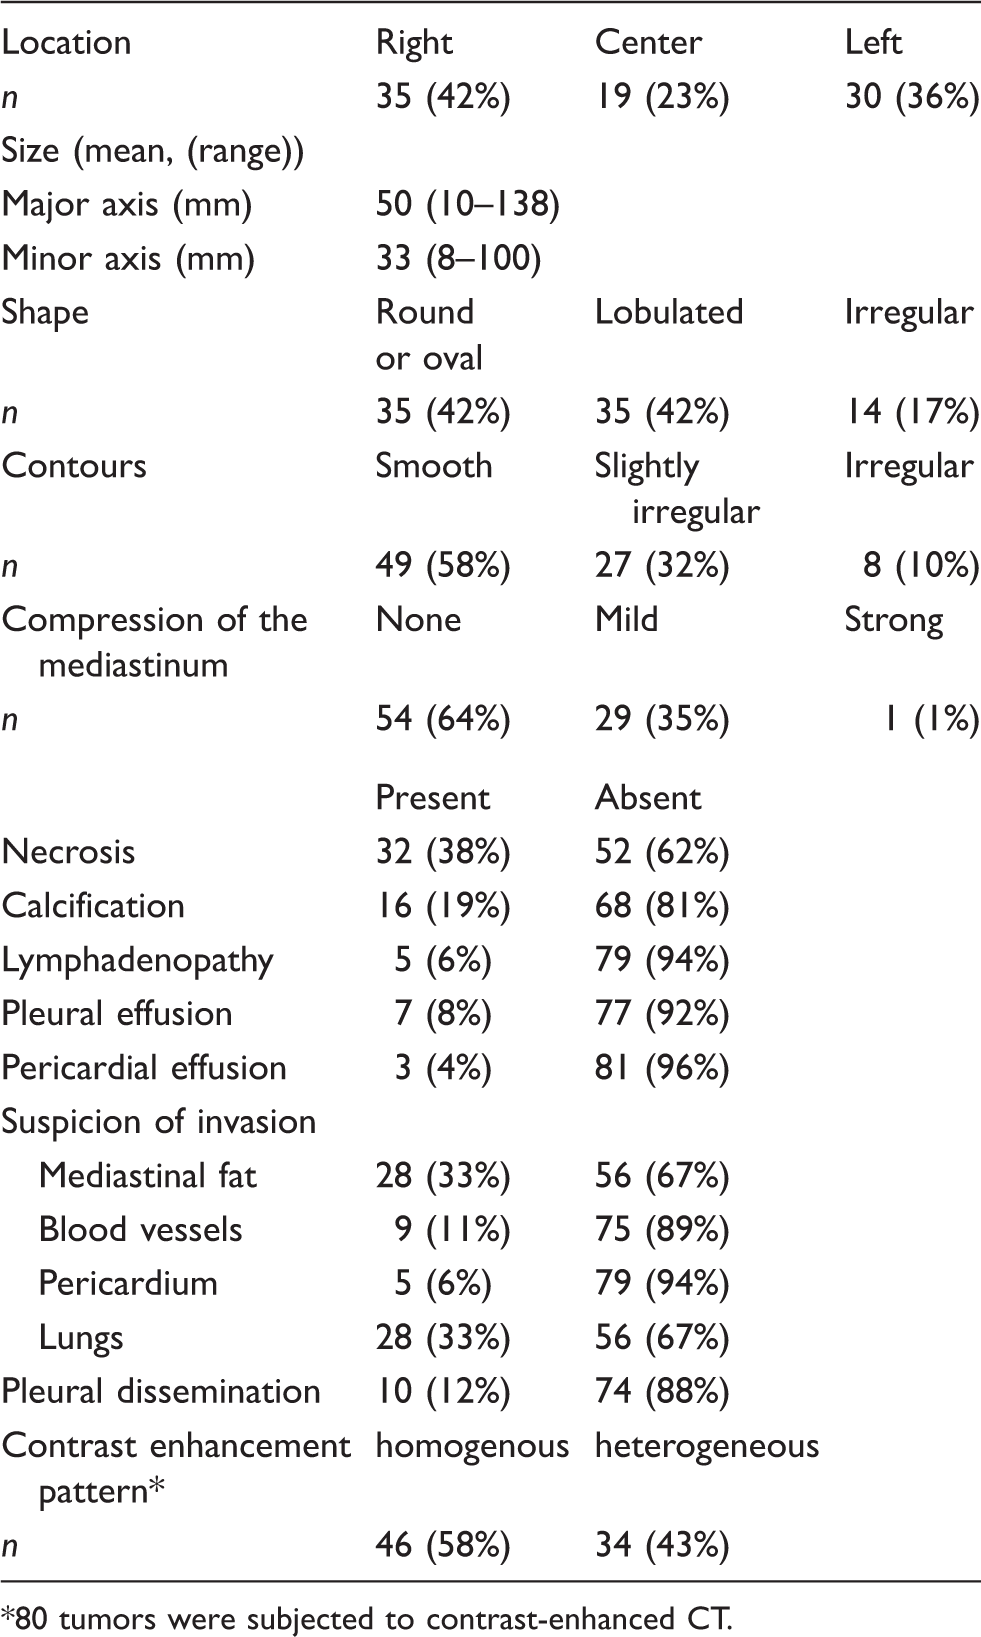
80 tumors were subjected to contrast-enhanced CT.
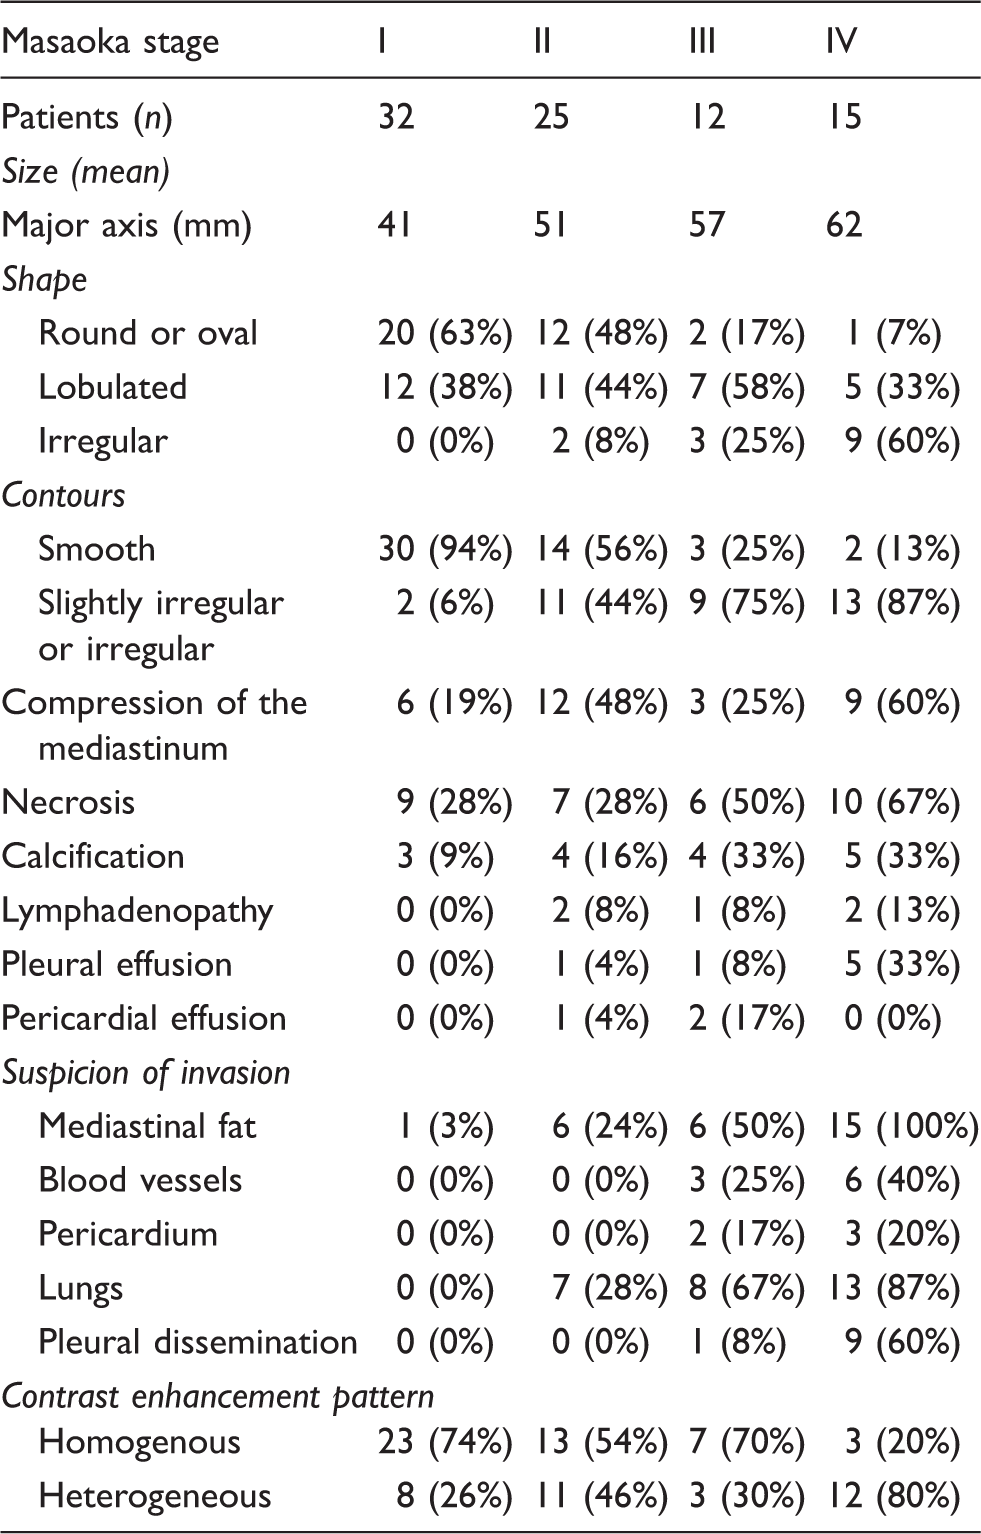
CT findings of Masaoka stage I–IV thymomas.
CT findings of WHO histologic subtypes of thymomas.
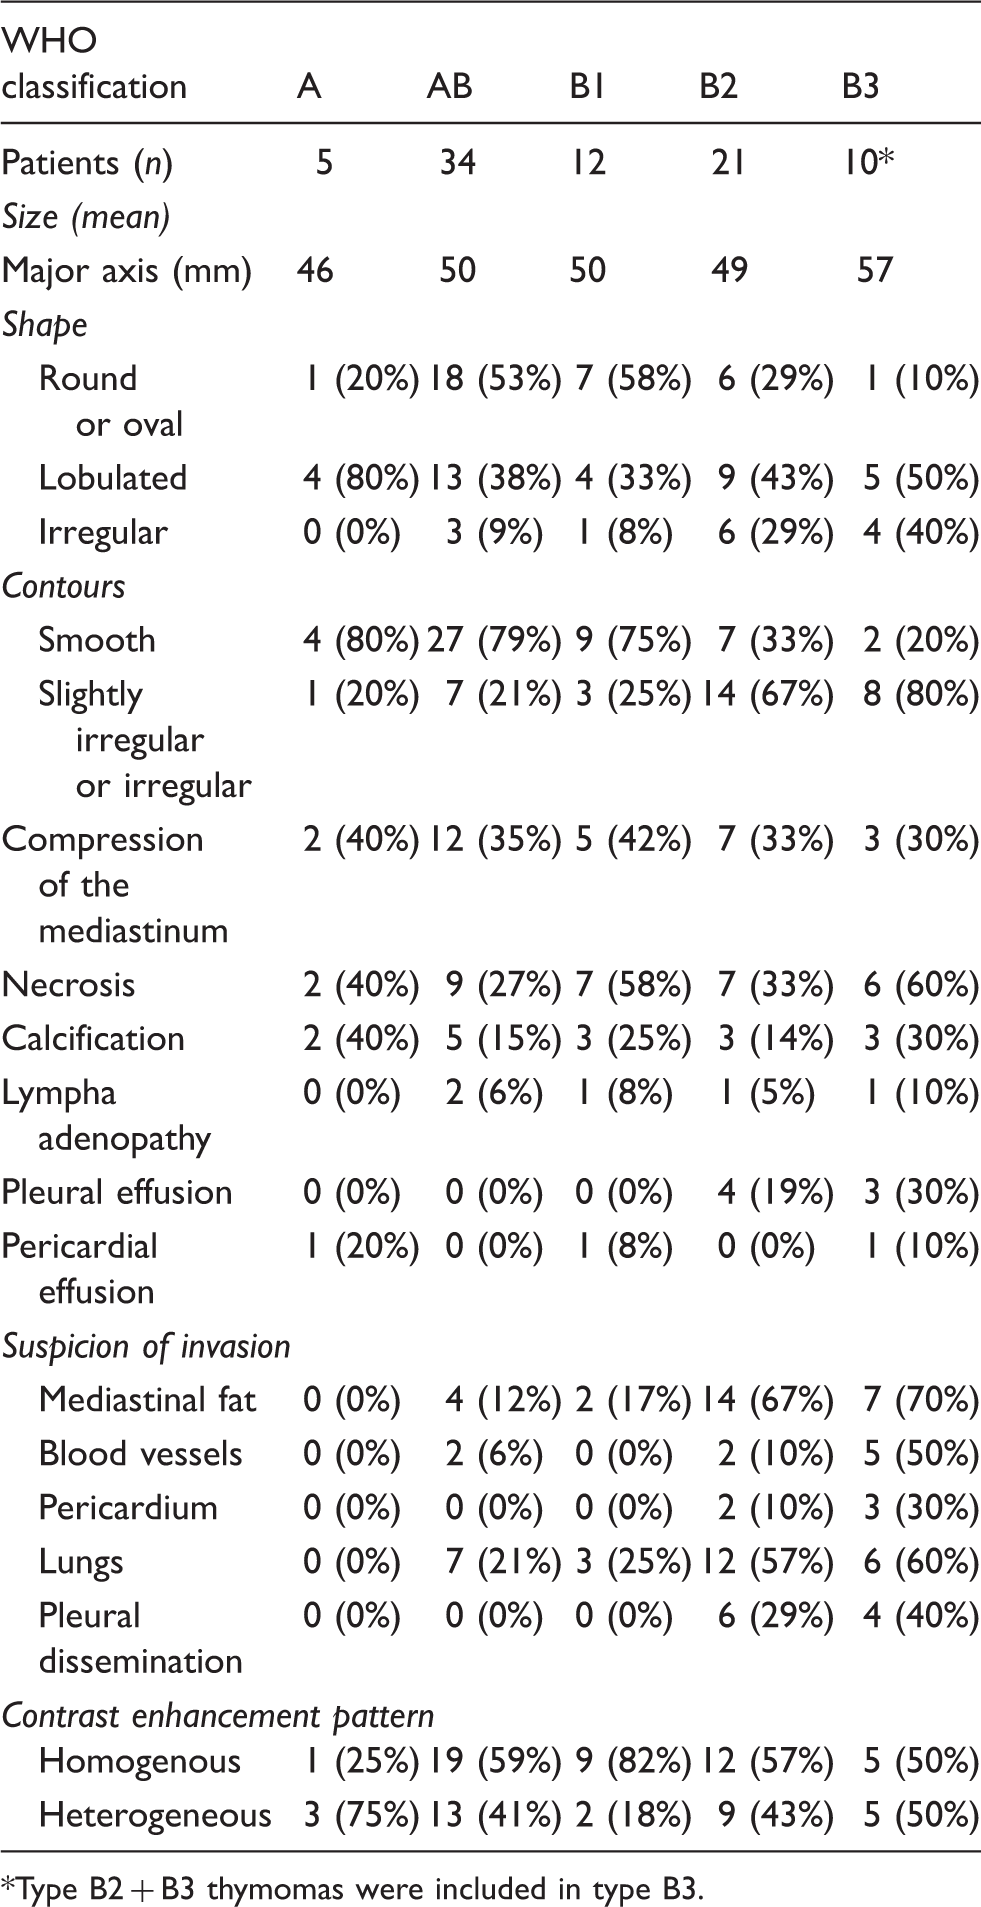
Type B2 + B3 thymomas were included in type B3.
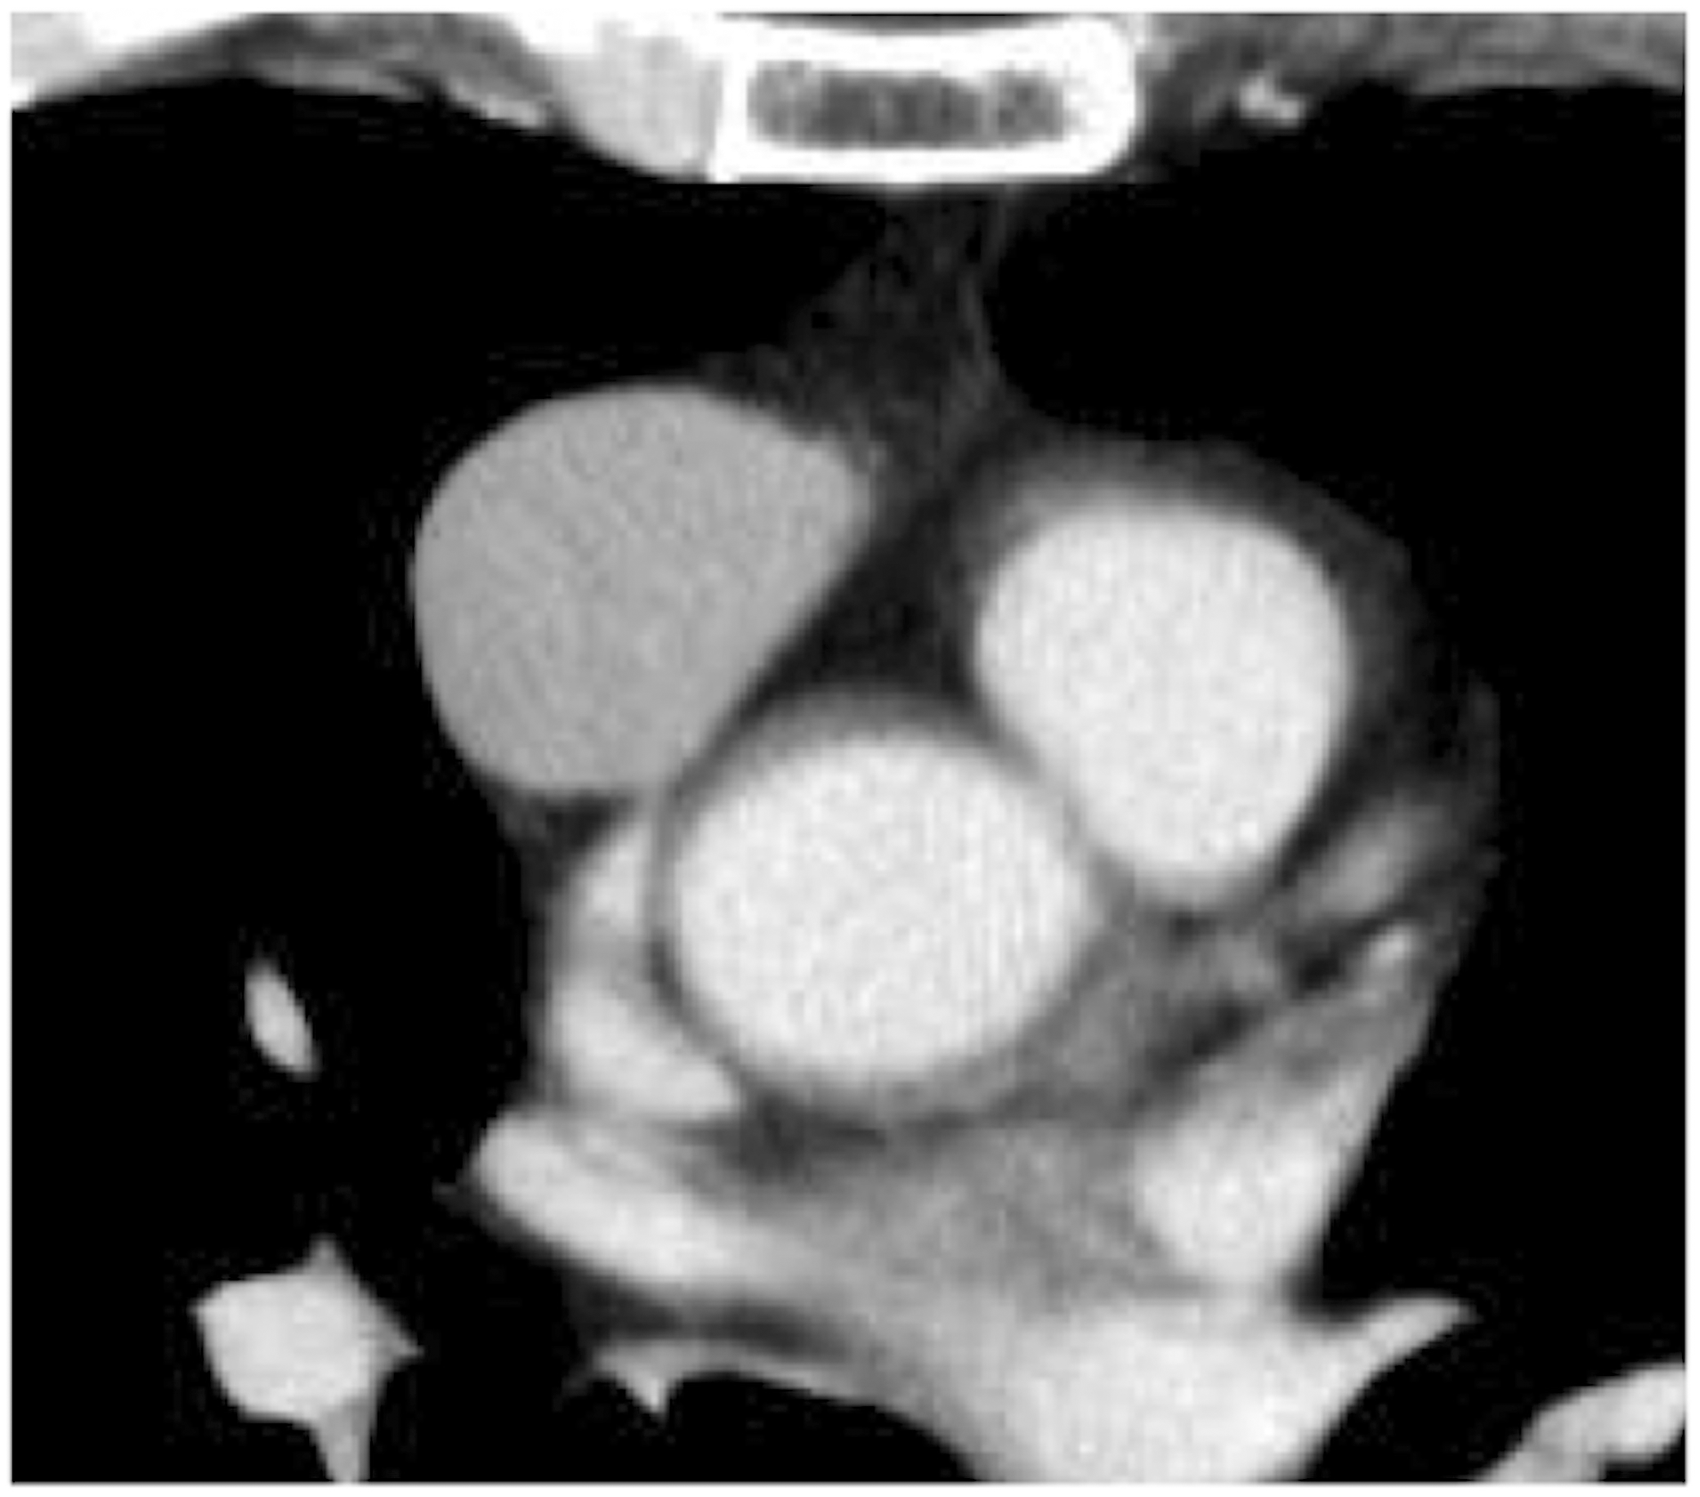
A 57-year-old man with a type AB thymoma. Axial contrast-enhanced CT image showing a lobular mass in the anterior mediastinum. The contours of the mass were smooth. Surgical resection and a pathological examination resulted in a diagnosis of Masaoka stage I thymoma.
A 56-year-old man with a type B1 thymoma. Axial contrast-enhanced CT image showing an oval-shaped homogenous mass in the anterior mediastinum. The contours of the mass were smooth, and invasion into the adjacent structures was not detected on CT. However, the tumor was pathologically diagnosed as Masaoka stage II.
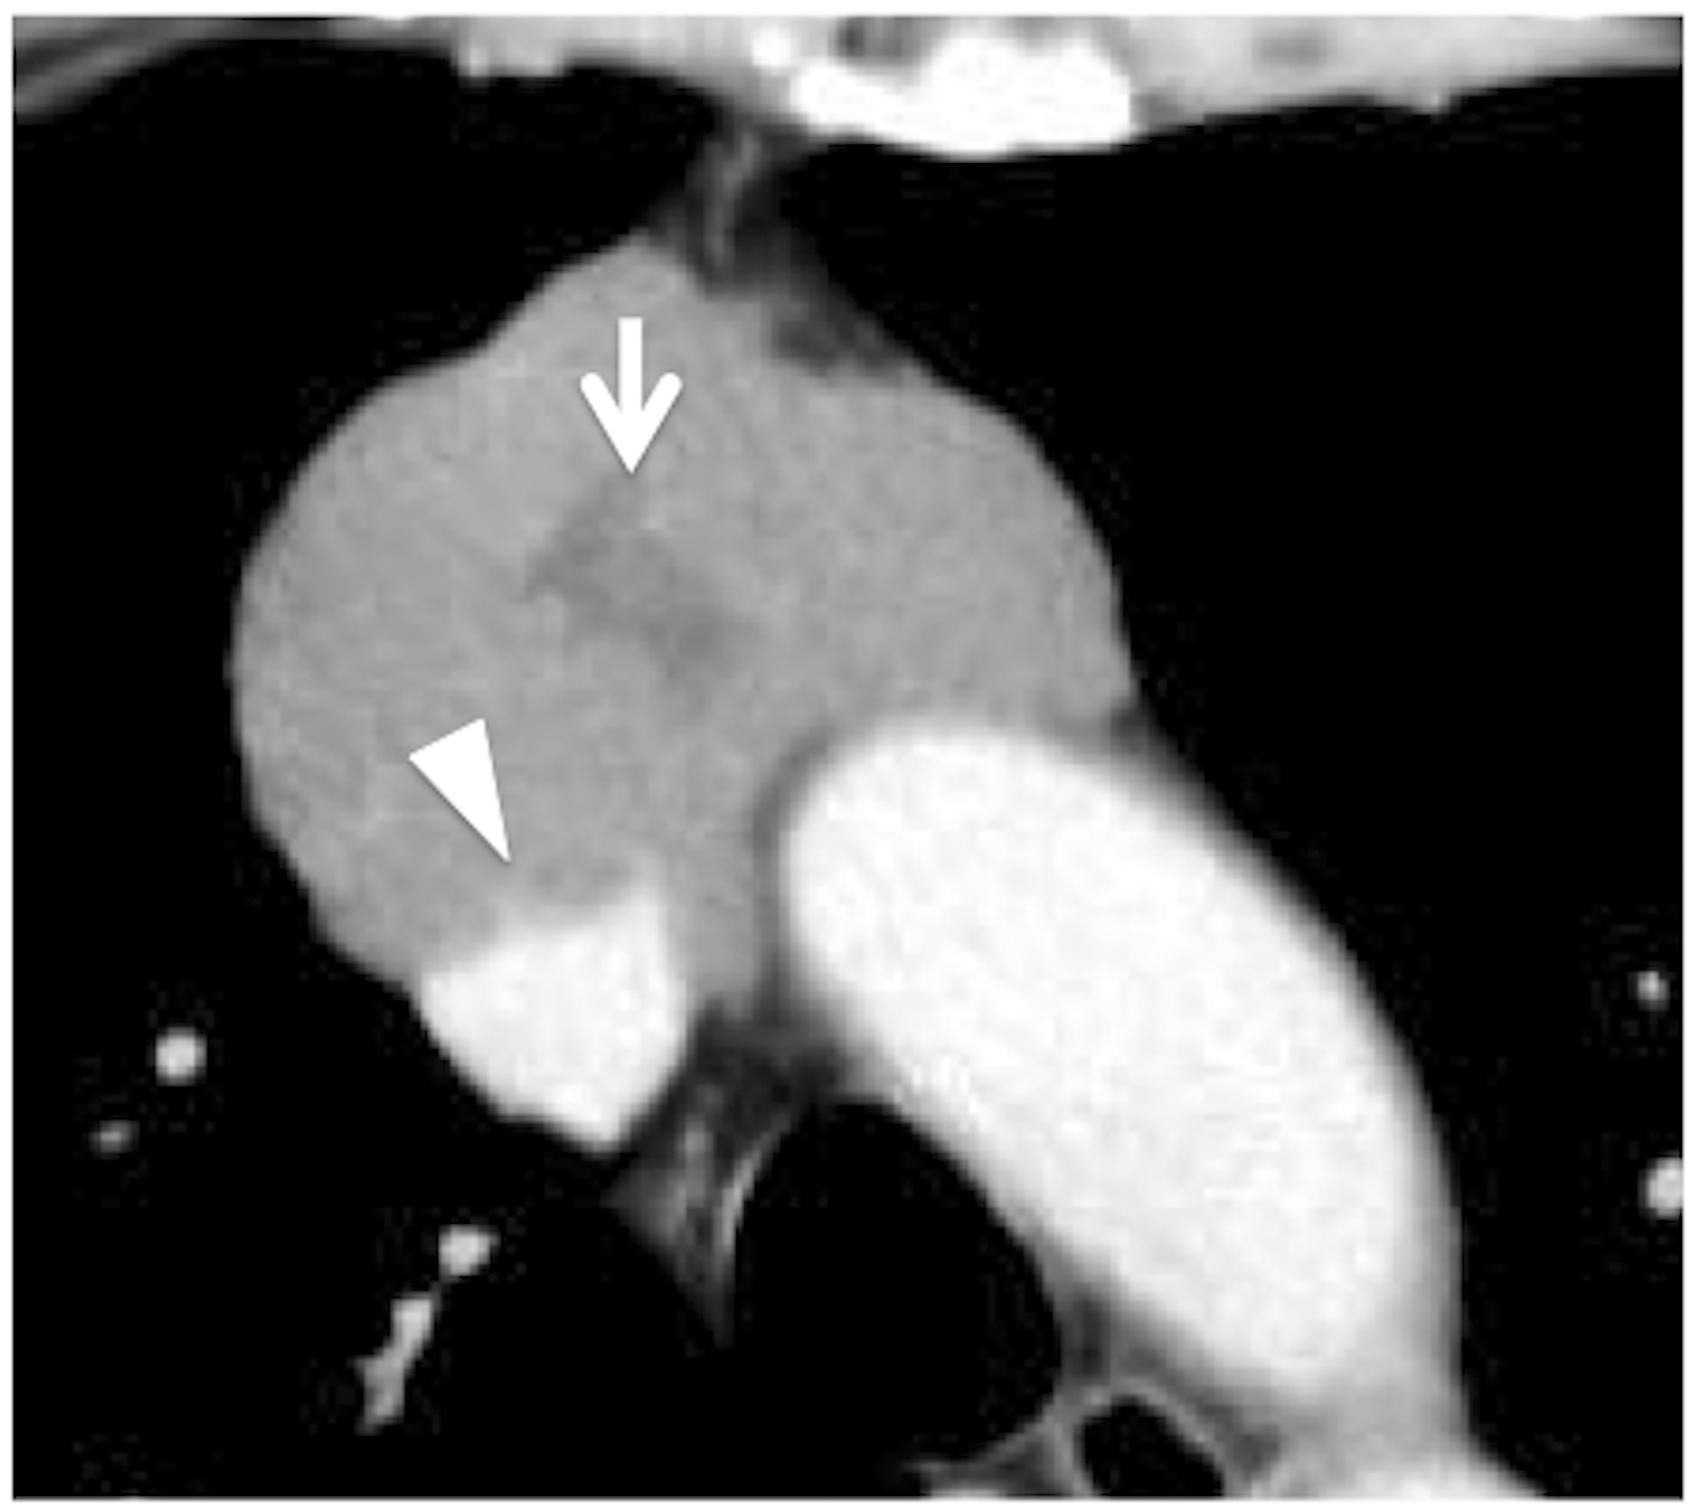
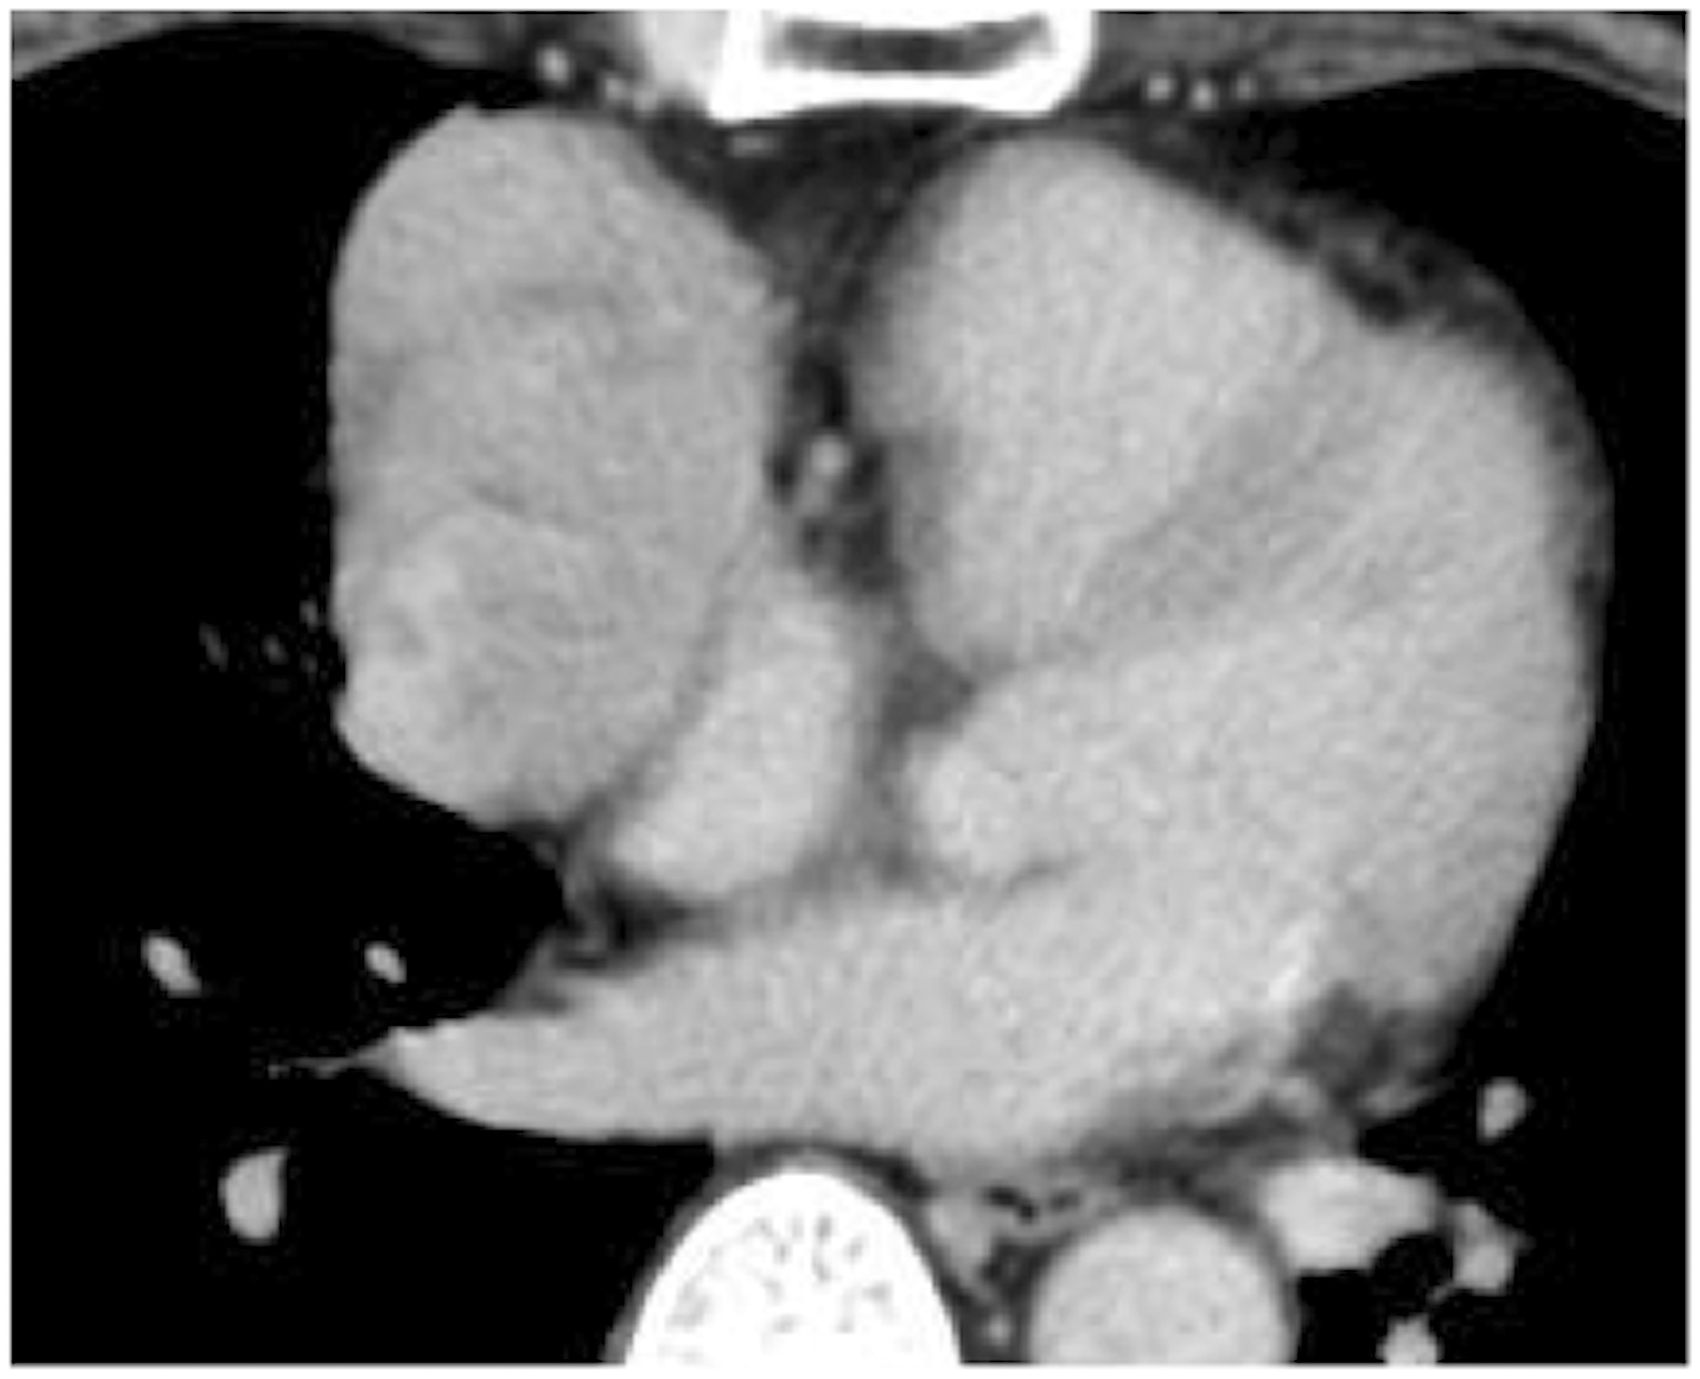
A 51-year-old man with type B2 and B3 thymomas. Axial contrast-enhanced CT image showing a lobular-shaped mass with irregular contours in the anterior mediastinum. CT detected an unenhanced region (arrow) in the mass and invasion into the superior vena cava (arrowhead). The tumor was diagnosed as a Masaoka stage III lesion.
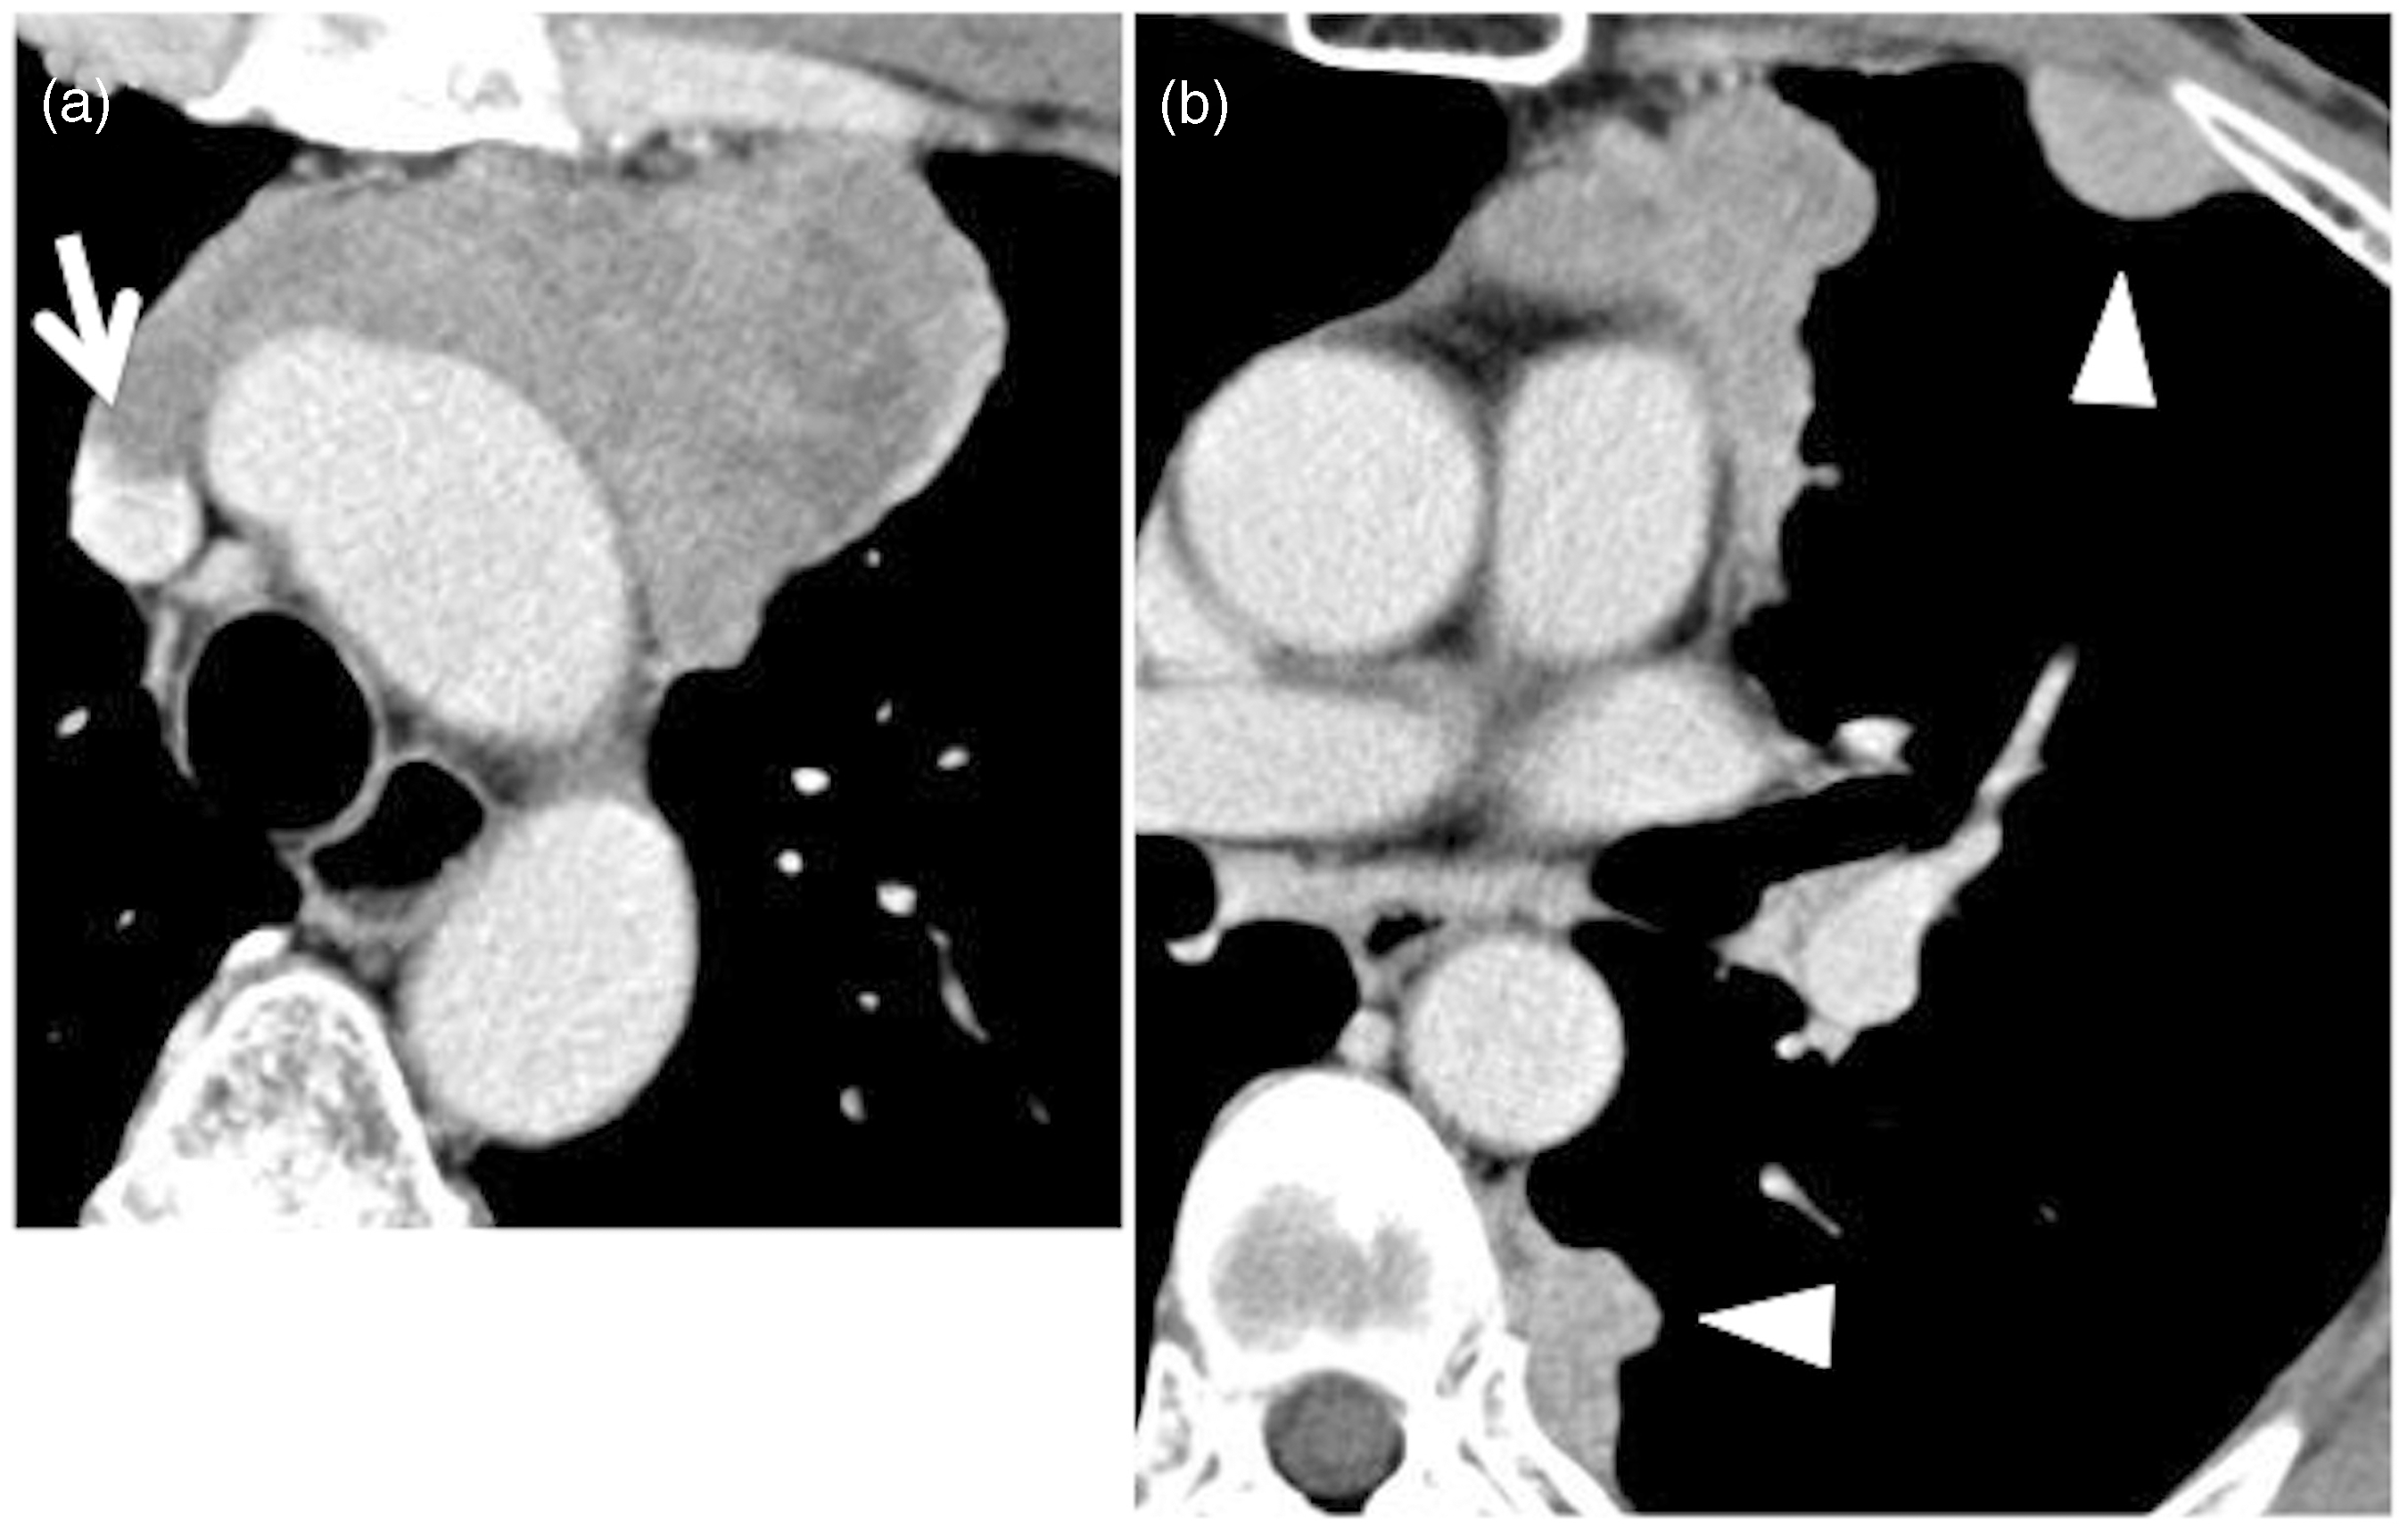
A 61-year-old man with a type B3 thymoma. Axial contrast-enhanced CT images of (a) the upper level and (b) the middle level of the mediastinum showing a mass with an irregular shape and contours in the anterior mediastinum. The internal structure of the tumor was heterogeneous. CT detected invasion into a great vessel (arrow) and pleural dissemination (arrowhead). The tumor was classified as Masaoka stage IVa.
Comparison of CT findings between Masaoka stage I/II and stage III/IV.

Differences between the Masaoka stage I/II and III/IV lesions were statistically significant (P < 0.05).
NS, not statistically significant.
Comparison between the CT findings of low-risk and high-risk thymomas.
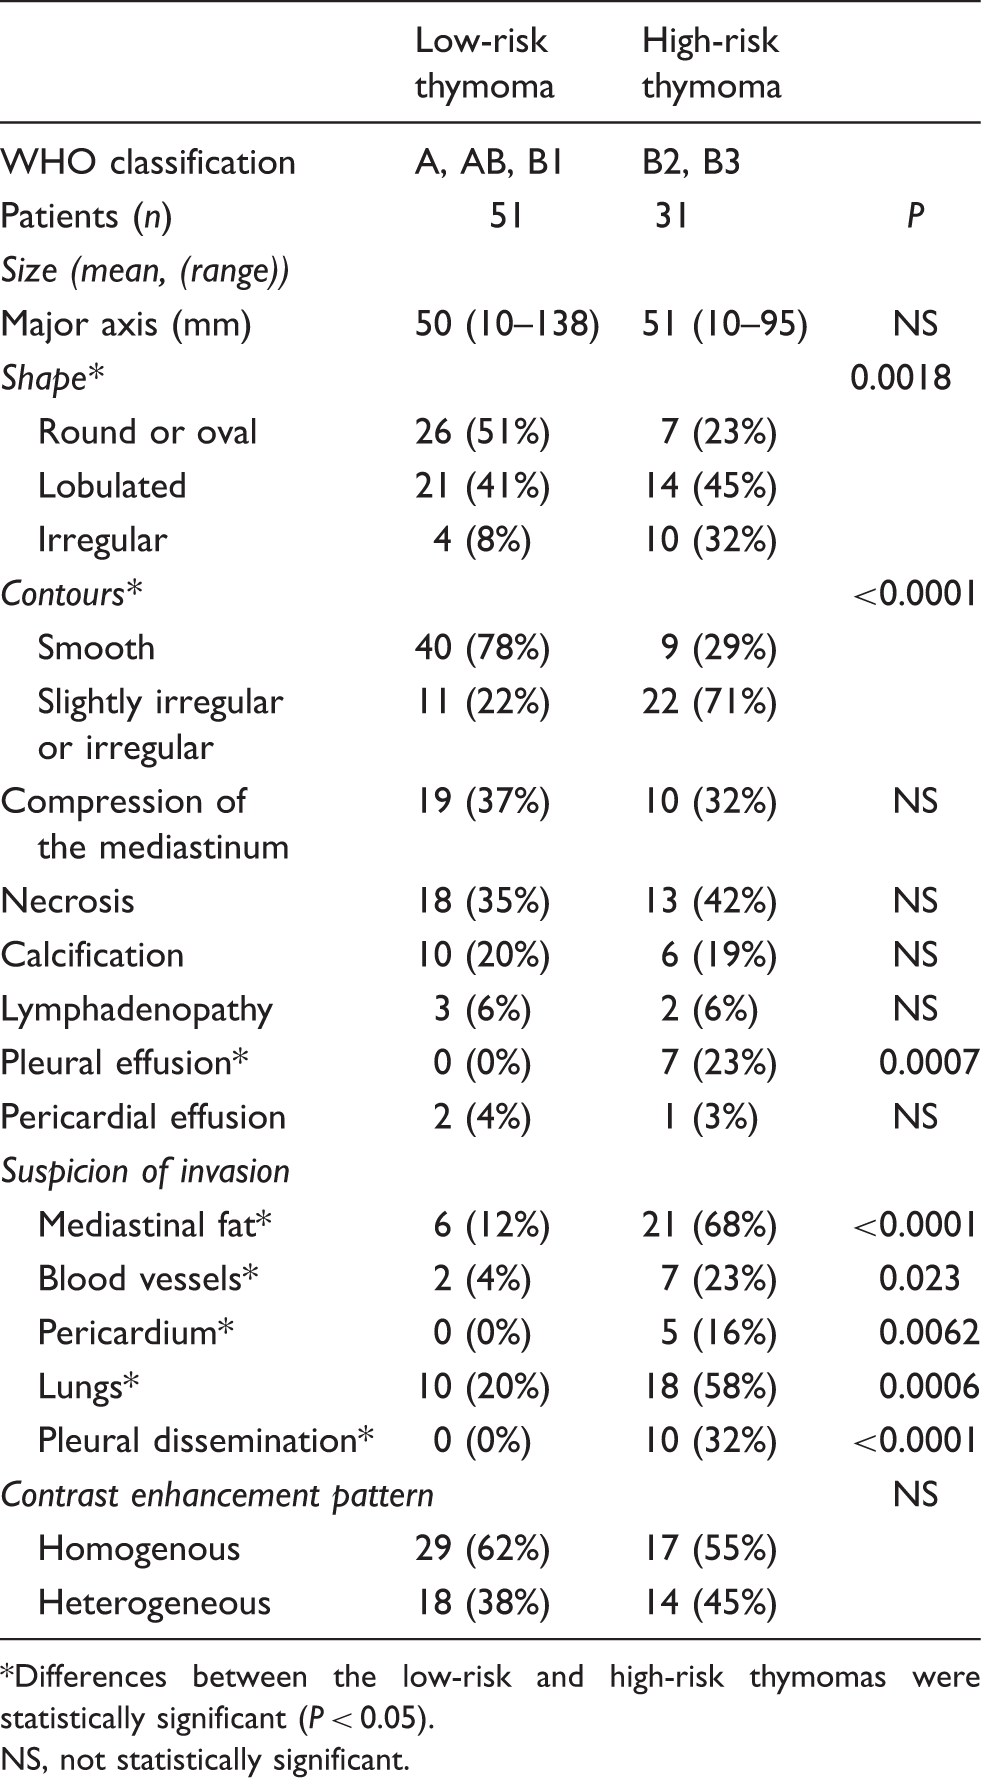
Differences between the low-risk and high-risk thymomas were statistically significant (P < 0.05).
NS, not statistically significant.
Discussion
Our study obtained two main findings. First, the CT findings of the Masaoka stage I/II and III/IV thymomas were different. Compared with the stage I/II thymomas, the stage III/IV thymomas were larger in size; had more irregular shapes and contours; and also tended to exhibit increased frequencies of necrosis, calcification, and pleural dissemination. In addition, the stage III/IV lesions were suspected of invading into the adjacent organs on CT images more often than the stage I/II lesions. Second, the CT findings of the low-risk and high-risk thymomas were also different. The high-risk thymomas had more irregular shapes and contours than the low-risk thymomas, and pleural dissemination was only seen in the high-risk thymomas. The high-risk thymomas also exhibited greater invasion into the surrounding organs on CT. Our results could make it easier to predict the prognosis of thymomas based on their CT imaging findings.
The Masaoka staging system and the WHO histological classification have been recognized as independent prognostic factors for thymomas (3,4,14,15). The 5-year survival rate of thymoma was reported to be 92.6%, 85.7%, 69.6%, and 50% in Masaoka stage I, II, III, and IV disease, respectively (3). According to data from several institutions, the mean 10-year survival rate of thymoma is 90%, 75%, 56%, and 38% in stage I, II, III, and IVa disease, respectively, whereas the 10-year survival rate of thymoma according to the WHO histological classification was reported to be 97%, 95%, 92%, 81%, and 62% in type A, AB, B1, B2, and B3 disease, respectively (4,16). Furthermore, type B2 and B3 thymomas display more aggressive behavior than type A, AB, and B1 thymomas in terms of invasiveness, survival, and recurrence. So, the WHO classification could aid the assessment and treatment of thymoma patients in clinical practice (14). These characteristics of thymomas might be reflected by their imaging findings, as was shown in this study.
A few studies have investigated the associations between the CT findings of thymomas and their classification according to the Masaoka staging system (5,6,17–19). A previous study reported that stage II-IV invasive thymomas are more likely to exhibit lobulated or irregular contours, areas of low attenuation, and calcification than stage I thymomas (18). Approximately half of the tumors in each stage were in the size range 5–10 cm, but the more advanced stage tumors were larger than the early stage tumors. Stage II–IV thymomas were also found to exhibit irregular shapes, heterogeneous contrast enhancement, and incomplete capsules (17). A few recent studies have investigated the differences between the CT findings of Masaoka stage I/II (early stage disease) and III/IV (advanced disease) thymomas (6,17). The classification of thymomas into early and advanced stage disease based on the Masaoka staging system might be useful because it could help to identify patients that are more likely to benefit from neoadjuvant therapy (preoperative chemotherapy), which has been suggested to provide a survival advantage compared with adjuvant therapy in patients with stage III thymomas (6). Compared with stage III/IV thymomas, stage I/II thymomas are more likely to exhibit oval or round shapes, smooth contours, and homogenous attenuation on CT (17). In a previous study, multivariate logistic regression analysis suggested that thymomas that measure more than 7 cm in diameter, exhibit lobulated contours, and have invaded the surrounding fat tissue are more likely to be classified as stage III or IV disease (6). Our results regarding the differences between the CT findings of stage I/II and III/IV thymomas were similar to the abovementioned findings about the size, shape, and contours of the thymomas. The preoperative diagnosis of advanced stage thymomas would allow neoadjuvant therapy to be selected; therefore, CT-based prognostic predictors could aid treatment planning in patients with thymomas.
To identify other prognostic factors for thymoma, the associations between the CT findings of thymomas and their histological stages according to the WHO classification have been examined by several investigators (6,9–13). One of the latter studies reported that smooth contours and a round shape were most suggestive of type A thymoma, whereas calcifications were indicative of type B thymoma. In addition, they concluded that CT was of limited value for differentiating among type AB, B1, B2, and B3 thymomas (9). Others have reported that only tumor size was correlated with the WHO classification and that tumors more than 7 cm in diameter are significantly more likely to be type B3 thymomas (6). The CT findings of thymic epithelial tumors have also been compared between low-risk and high-risk lesions (11,12). However, both of the latter studies included cases of thymic carcinoma and tended to focus on the CT findings of thymic carcinoma. One of the latter studies concluded that the detection of irregular contours, necrotic or cystic components, heterogeneous contrast enhancement, lymphadenopathy, and great vessel invasion on CT were strongly suggestive of thymic carcinoma, rather than low-risk or high-risk thymoma, although they also mentioned that the likelihood of invasion was low in low-risk thymomas and moderate in high-risk thymomas (12). The other study reported that lobulated contours were more common in high-risk thymomas than in low-risk thymomas. In addition, calcification and necrosis were seen more frequently in high-risk thymomas than low-risk thymomas, although the differences were not significant (11). In our study, the high-risk thymomas displayed more irregular shapes and contours and greater invasion into the adjacent structures than the low-risk thymomas on CT images, and all of the patients that exhibited pleural dissemination had high-risk thymomas. The CT findings of thymomas seem to demonstrate stronger associations with the stages described in the Masaoka staging system than the histological subtypes outlined in the WHO classification; however, in our study the high-risk thymomas tended to demonstrate more aggressive findings than the low-risk thymomas.
Our study has one main limitation. Namely, the CT images were obtained using a variety of scanners with different slice thickness, because thymomas are relatively rare tumors and it took a long time to collect these cases. In particular, CT images were obtained with a slice thickness of 7–10 mm in 20 of the 84 patients. However, we consider that the variation in these parameters did not affect our evaluation of the tumors’ CT findings much.
In conclusion, the Masaoka stage III/IV thymomas tended to be larger in size, display more irregular shape and contours, and exhibit necrosis and calcification more often than the stage I/II tumors. In addition, high-risk thymomas demonstrated more irregular shape and contours than the low-risk thymomas. All of the patients displaying pleural dissemination had high-risk thymomas. The high-risk thymomas exhibited a higher incidence of invasion into the surrounding organs on CT. Our results could lead to CT-based prognosis prediction in cases of thymoma and might also facilitate the development of more effective strategies for treating thymomas, especially in the preoperative setting.
Footnotes
Declaration of conflicting interests
The author(s) declared no potential conflicts of interest with respect to the research, authorship, and/or publication of this article.
Funding
The author(s) received no financial support for the research, authorship, and/or publication of this article.