
Abstract
Background
Magnetic resonance imaging (MRI) is increasingly being used to examine patients with suspected breast cancer.
Purpose
To determine the diagnostic performance of combined dynamic contrast-enhanced magnetic resonance imaging (DCE-MRI) and diffusion-weighted imaging (DWI) for breast cancer detection.
Material and Methods
A comprehensive search of the PUBMED, EMBASE, Web of Science, and Cochrane Library databases was performed up to September 2014. Statistical analysis included pooling of sensitivity and specificity, positive likelihood ratio (PLR), negative likelihood ratio (NLR), diagnostic odds ratio (DOR), and diagnostic accuracy using the summary receiver operating characteristic (SROC). All analyses were conducted using STATA (version 12.0), RevMan (version 5.2), and Meta-Disc 1.4 software programs.
Results
Fourteen studies were analyzed, which included a total of 1140 patients with 1276 breast lesions. The pooled sensitivity and specificity of combined DCE-MRI and DWI were 91.6% and 85.5%, respectively. The pooled sensitivity and specificity of DWI-MRI were 86.0% and 75.6%, respectively. The pooled sensitivity and specificity of DCE-MRI were 93.2% and 71.1%. The area under the SROC curve (AUC-SROC) of combined DCE-MRI and DWI was 0.94, the DCE-MRI of 0.85. Deeks testing confirmed no significant publication bias in all studies.
Conclusion
Combined DCE-MRI and DWI had superior diagnostic accuracy than either DCE-MRI or DWI alone for the diagnosis of breast cancer.
Keywords
Introduction
Breast cancer is the most frequently diagnosed cancer, and is the main reason for cancer deaths among women, accounting for 23% of the total of cancer cases and 14% of cancer deaths in women (1). Early detection and systemic therapy are likely the key elements that explain the observed reduction in breast cancer mortality (2). Today, ultrasound and mammography are the most common diagnostic imaging tools for breast cancer. However, the diagnostic sensitivity and specificity of both of these tools are poor, and especially for breasts with dense fibroglandular tissue (3), so that additional biopsy procedures are often required to confirm the diagnosis, conferring extra cost and needless anxiety upon the patient.
Magnetic resonance imaging (MRI) is increasingly being used to examine patients with suspected breast cancer. Dynamic contrast-enhanced (DCE) MRI (DCE-MRI) of the breast has been the mainstay of breast MRI, and has excellent sensitivity. However, the moderate specificity of this procedure can present additional challenges by detecting many benign lesions (4,5). Nowadays, diffusion-weighted imaging (DWI) can be used to help to differentiate between benign and malignant breast lesions (6–8). Compared with DCE-MRI, DWI has a higher specificity but lower sensitivity (9), but numerous studies have shown that together with apparent diffusion coefficient (ADC) maps, DWI may provide additional specificity and potential value, improving the positive predictive value from 37% to 47% (10–14).
The American College of Radiology Breast Imaging-Reporting and Data System MRI and the European Society of Mastologists (EUSOMA; European Society of Breast Cancer Specialists) working groups recommend the use of morphological and kinetic features for the detection of breast lesions, since the true value of adjunctive techniques such as DWI have yet to be properly evaluated (15,16). Increasing numbers of studies are evaluating the utility of combined DCE-MRI with DWI and its clinical application (17–20). Both of these tools have advanced to the point where they provide quantitative measurements of tissue properties that are highly related to the assessment of tumor progression. However, the clinical value of combined DWI with DCE-MRI of breast lesions remains unclear and is controversial. The aims of this systematic review were therefore to determine: (i) the predictive accuracy of combined DCE-MRI and DWI for the detection of breast cancer; and (ii) the diagnostic performance of DCE-MRI alone versus combined DCE-MRI and DWI, and DWI alone versus combined DCE-MRI with DWI for detecting breast cancer.
Material and Methods
Search strategy
Electronic searches of the PUBMED, EMBASE, Web of Science, and Cochrane Library databases were performed by two researchers (ZL, TM), including articles listed up to September 2014, using the following search terms: (breast neoplasms OR breast lesions OR breast cancer OR breast tumor OR mammary neoplasms OR mammary cancer OR mammary tumor) and (magnetic resonance OR MR) and (dynamic contrast enhanced OR DCE OR diffusion-weighted MR OR DWI OR multiparametric). The same researchers also performed a manual search of the bibliographies of the retrieved articles for additional potentially relevant references. No language restrictions were applied. All of the citations identified by the database searches were imported into a bibliographic database (Endnote, version X4).
Eligibility criteria for study selection
The following inclusion criteria for studies were applied:
Human subjects who submitted to a combined DWI and DCE-MRI examination of breast lesions; A reference standard that included either histopathologic analysis (performed at surgery and biopsy sampling) or imaging follow-up of at least 1 year; Reporting of sufficient information to extract or calculate true-negative (TN), false-negative (FN), true-positive (TP), and false-positive (FP) values for statistical analysis.
When the data for a particular cohort were published in more than one article, the more detailed description was chosen for analysis. Studies were excluded if the breast cancer diagnosis was not achieved using combined DWI and DCE-MRI.
One reviewer (ZL with 3 years of experience in breast imaging) performed the first screening to select eligible studies according the inclusion and exclusion criteria. Two other reviewers (TM and MZQ, with 6 and 8 years of experience in breast imaging, respectively) independently checked the eligibility of these selected studies by reading the full texts. Any disagreements were discussed and resolved by consensus.
Data collection and quality assessment
The following data were extracted from the included studies: the first author, study nation, publication year, study design (retrospective or prospective), patient age, cancer status (suspected or detected), imaging parameters (DWI and DCE-MRI), study population, number of lesions, breast cancer prevalence, reference standard used (histopathologic by surgery or biopsy), number of readers, and TP, FP, TN, and FN values for the detected breast lesions.
The methodological quality of the included studies was assessed independently by two of the reviewers (ZL, TM) using the version 2 of the Quality Assessment of Diagnostic Accuracy Studies (QUADAS-2) instrument, which is commonly used to assess the quality of diagnostic accuracy studies for systematic reviews, as its name suggests (21). Each item was assigned “yes,” “no,” or “unclear” (if there was insufficient information to make an accurate judgment) according to its QUADAS-2 score. Disagreements were resolved by consensus. All assessment results were imported into RevMan (version 5.2).
Data synthesis and statistical analysis
Overall analysis
Pooling of data was performed within the bivariate mixed-effects regression modeling framework (22). All analyses were conducted using STATA (version 12.0), RevMan (version 5.2), and Meta-Disc 1.4 software programs. A forest plot was generated containing the individual study sensitivity (SEN) and specificity (SPE) values, the 95% confidence intervals (CIs), and the pooled SEN and SPE estimates. The PLR, NLR, and DOR were calculated using the model summary. The accuracy data were pooled using a SROC plot, and by summarizing that curve using AUC-SROC.
Subgroup analysis
Due to the substantial heterogeneity of the included studies, the pooled weighted SEN and SPE were calculated for subgroups dichotomized according to: field strength (1.5 T vs. 3.0 T); diffusion gradient factor (b) values (1000 s/mm2 vs. <1000 s/mm2); mass model (mass vs. non-mass lesions); quality differences (high vs. suboptimal).
Threshold effect
The heterogeneity between the included studies may in part be attributed to the threshold effect. This possibility was investigated by performing the spearman correlation between logit of sensitivity and logit of (1-spesificity) a strong correlation indicate a strong effect (23).
Analysis of publication bias
According to the Cochrane Diagnostic Test Accuracy (DTA) Handbook, Deeks’ test was developed for DTA meta-analyses in STATA (version 12.0). The potential publication bias was thus formally assessed using Deeks’ test via linear regression of lnDOR with 1/effective sample size (ESS)1/2 weighted by the ESS (24,25).
Sensitivity analysis
We would eliminate the included studies one by one to assess the sensitivity.
Results
Literature search
A flow diagram of the search strategy is shown in Fig. 1. The systematic electronic literature search of the four aforementioned databases yielded 689 potentially relevant articles. Of these, 386 duplicate studies were excluded and 108 were excluded after reading the titles and abstracts. After reading the full texts, a further 49 studies were excluded for the following reasons: the diagnosis was not achieved using combined DCE-MRI and DWI (n = 43), the researchers did not provide sufficient data to enable the construction of a 2 × 2 table (n = 4), the same data were presented in two articles (n = 2). Therefore, 14 studies in which breast cancer was detected using combined DCE-MRI and DWI was used to detect breast cancer were ultimately included in this meta-analysis (13,14,17–20,26–33). Manual searching of the references of these 14 articles did not yield any additional relevant studies. There was no disagreement between the two reviewers regarding the inclusion/exclusion of the articles (Fig. 1).
Flowchart shows process used to select studies for meta-analysis.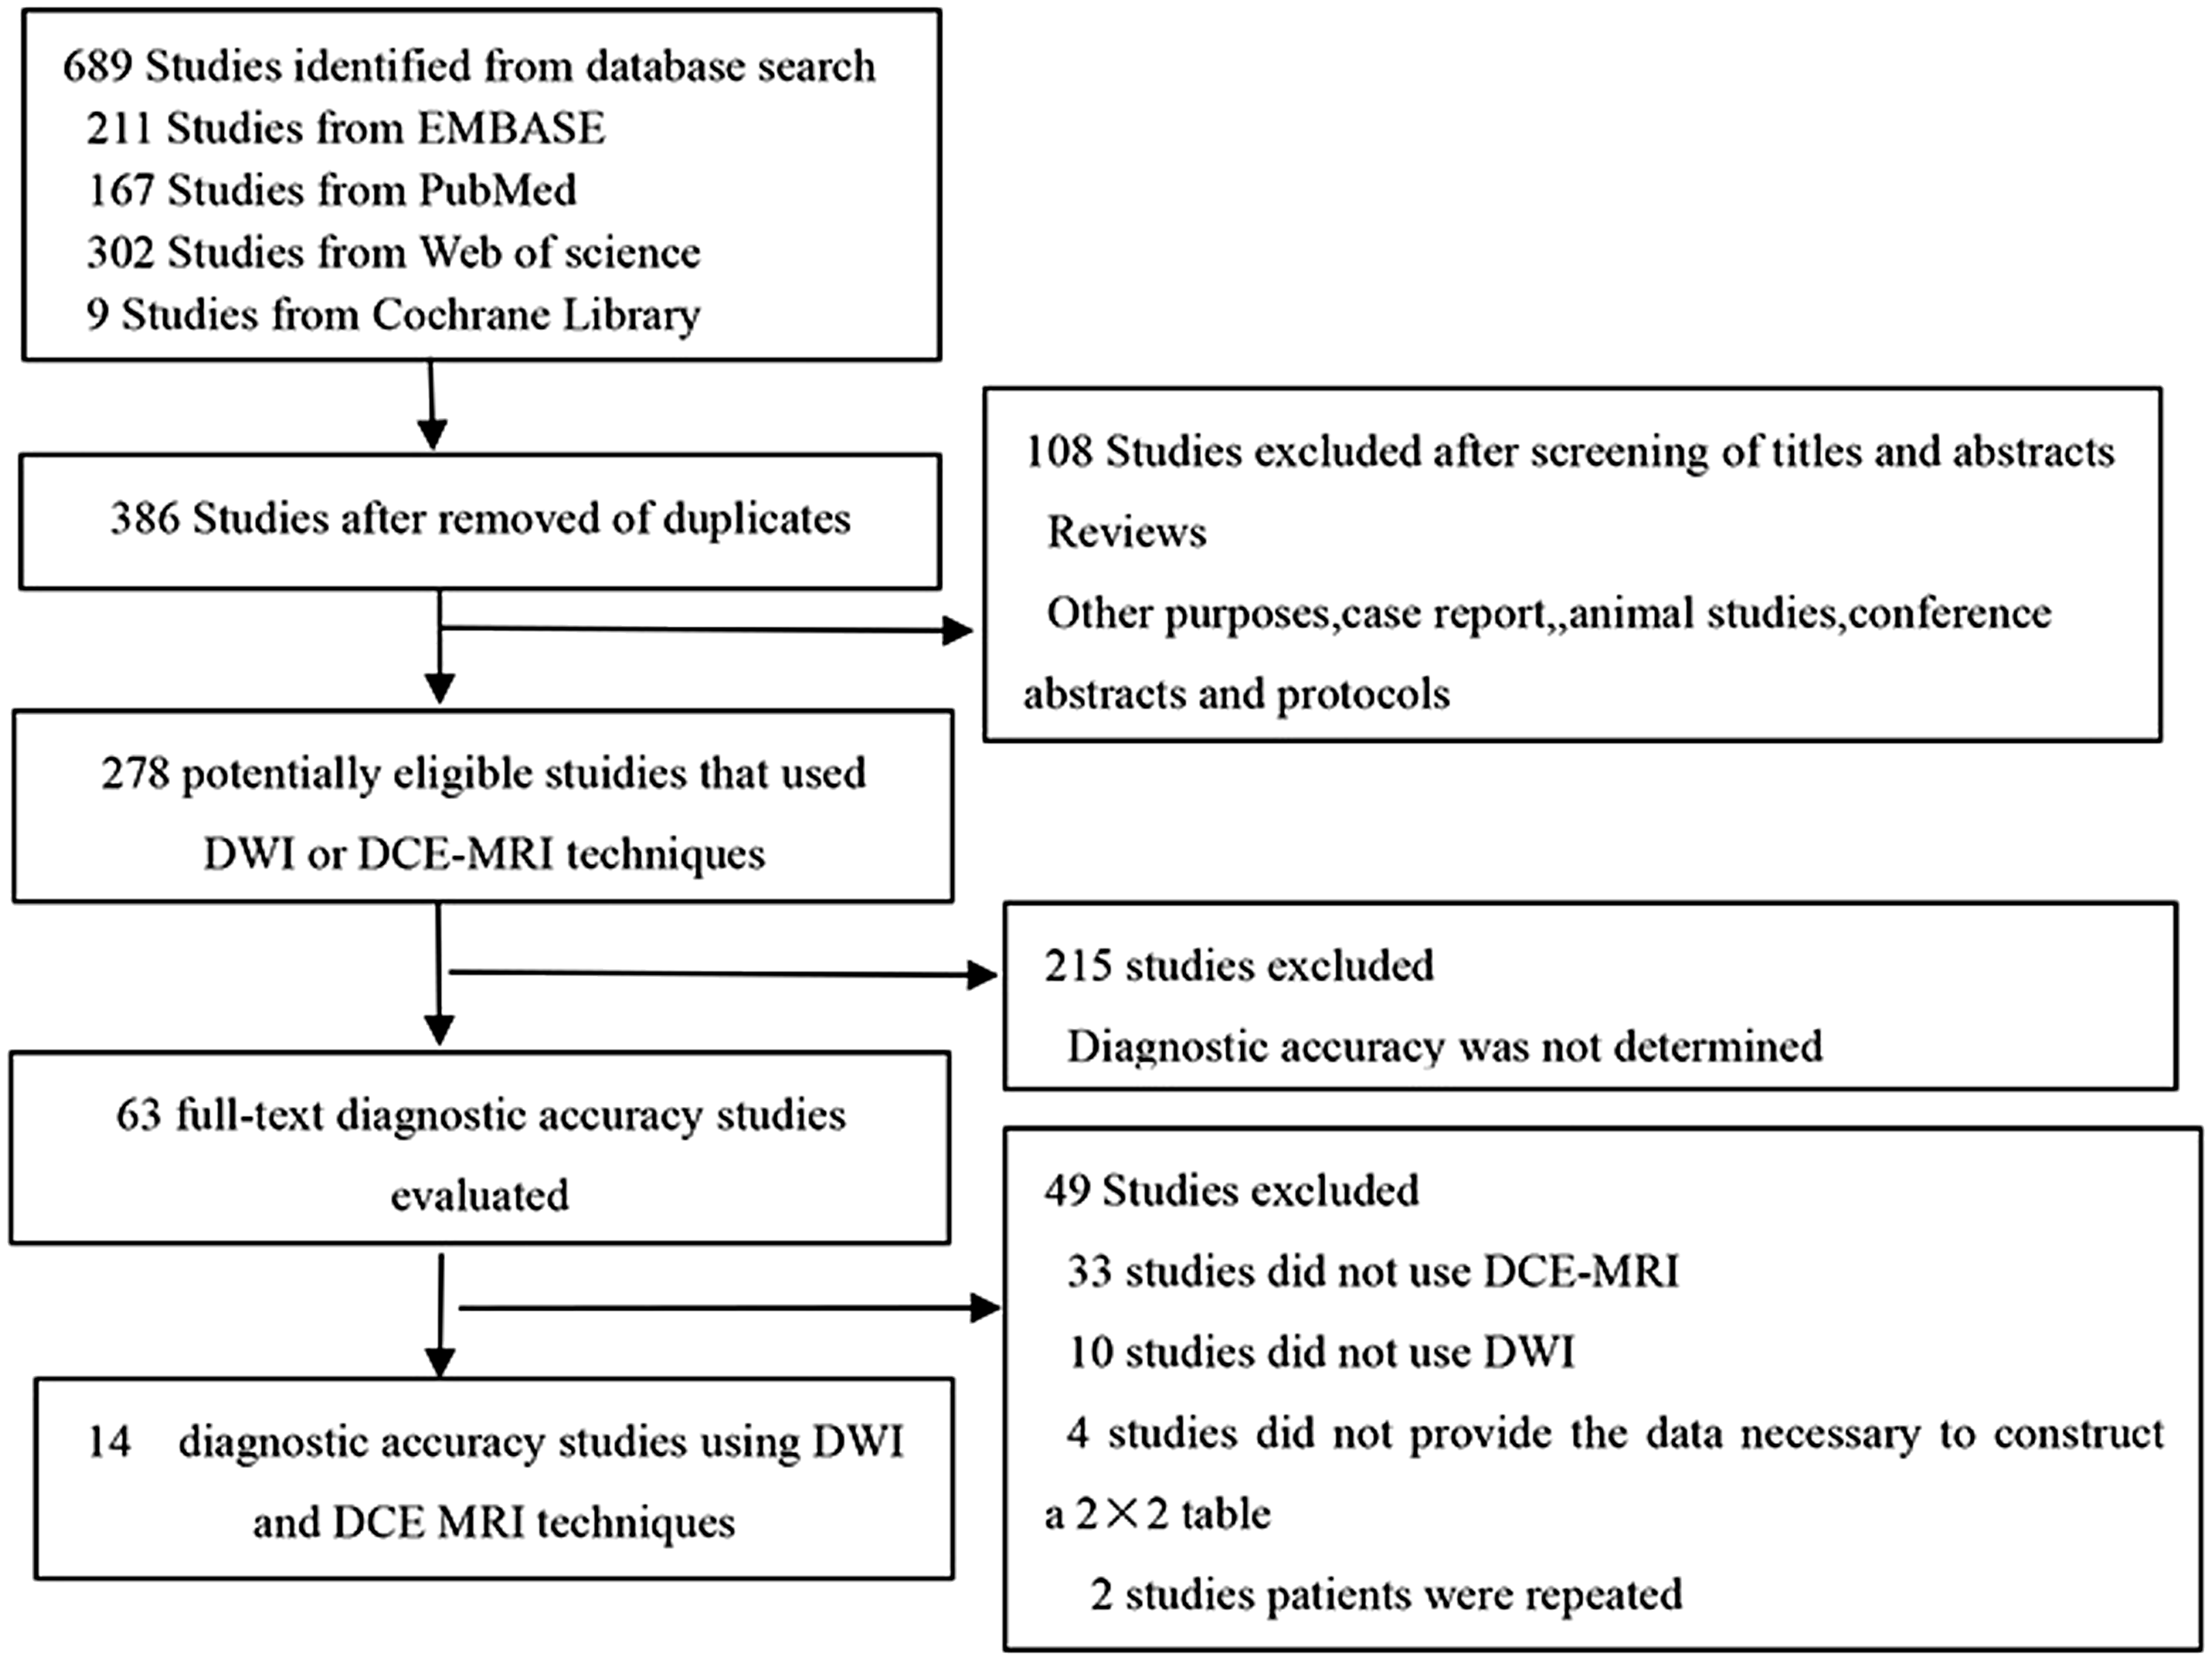
Study description
Characteristic of primary diagnostic studies on diagnosing breast lesions.
Assessment of study quality and risk of bias
The two reviewers independently assessed all studies included in this meta-analysis according to the QUADAS-2 items. The quality assessment results are presented in Fig. 2. The risk of bias regarding patient selection was unclear for seven studies in which there was no indication as to whether the patients were selected consecutively (14,17,20,27,29–31). The risk of bias regarding the index test was high for six studies because the threshold was not prespecified (13,14,20,27,29,31), and the risk of reporting bias was unclear for six studies in which blinding was not mentioned (18,19,26,28,30,32). A low risk of bias was found in the 14 studies regarding the reference standard. However, the risk of bias regarding flow and timing was high in seven studies in which either different reference standards were used or else some of the patients were not included in the final analysis (13,17,26,28,30,31,33).
The results of the QUADAS quality assessment. +, yes; –, no; ?, unclear.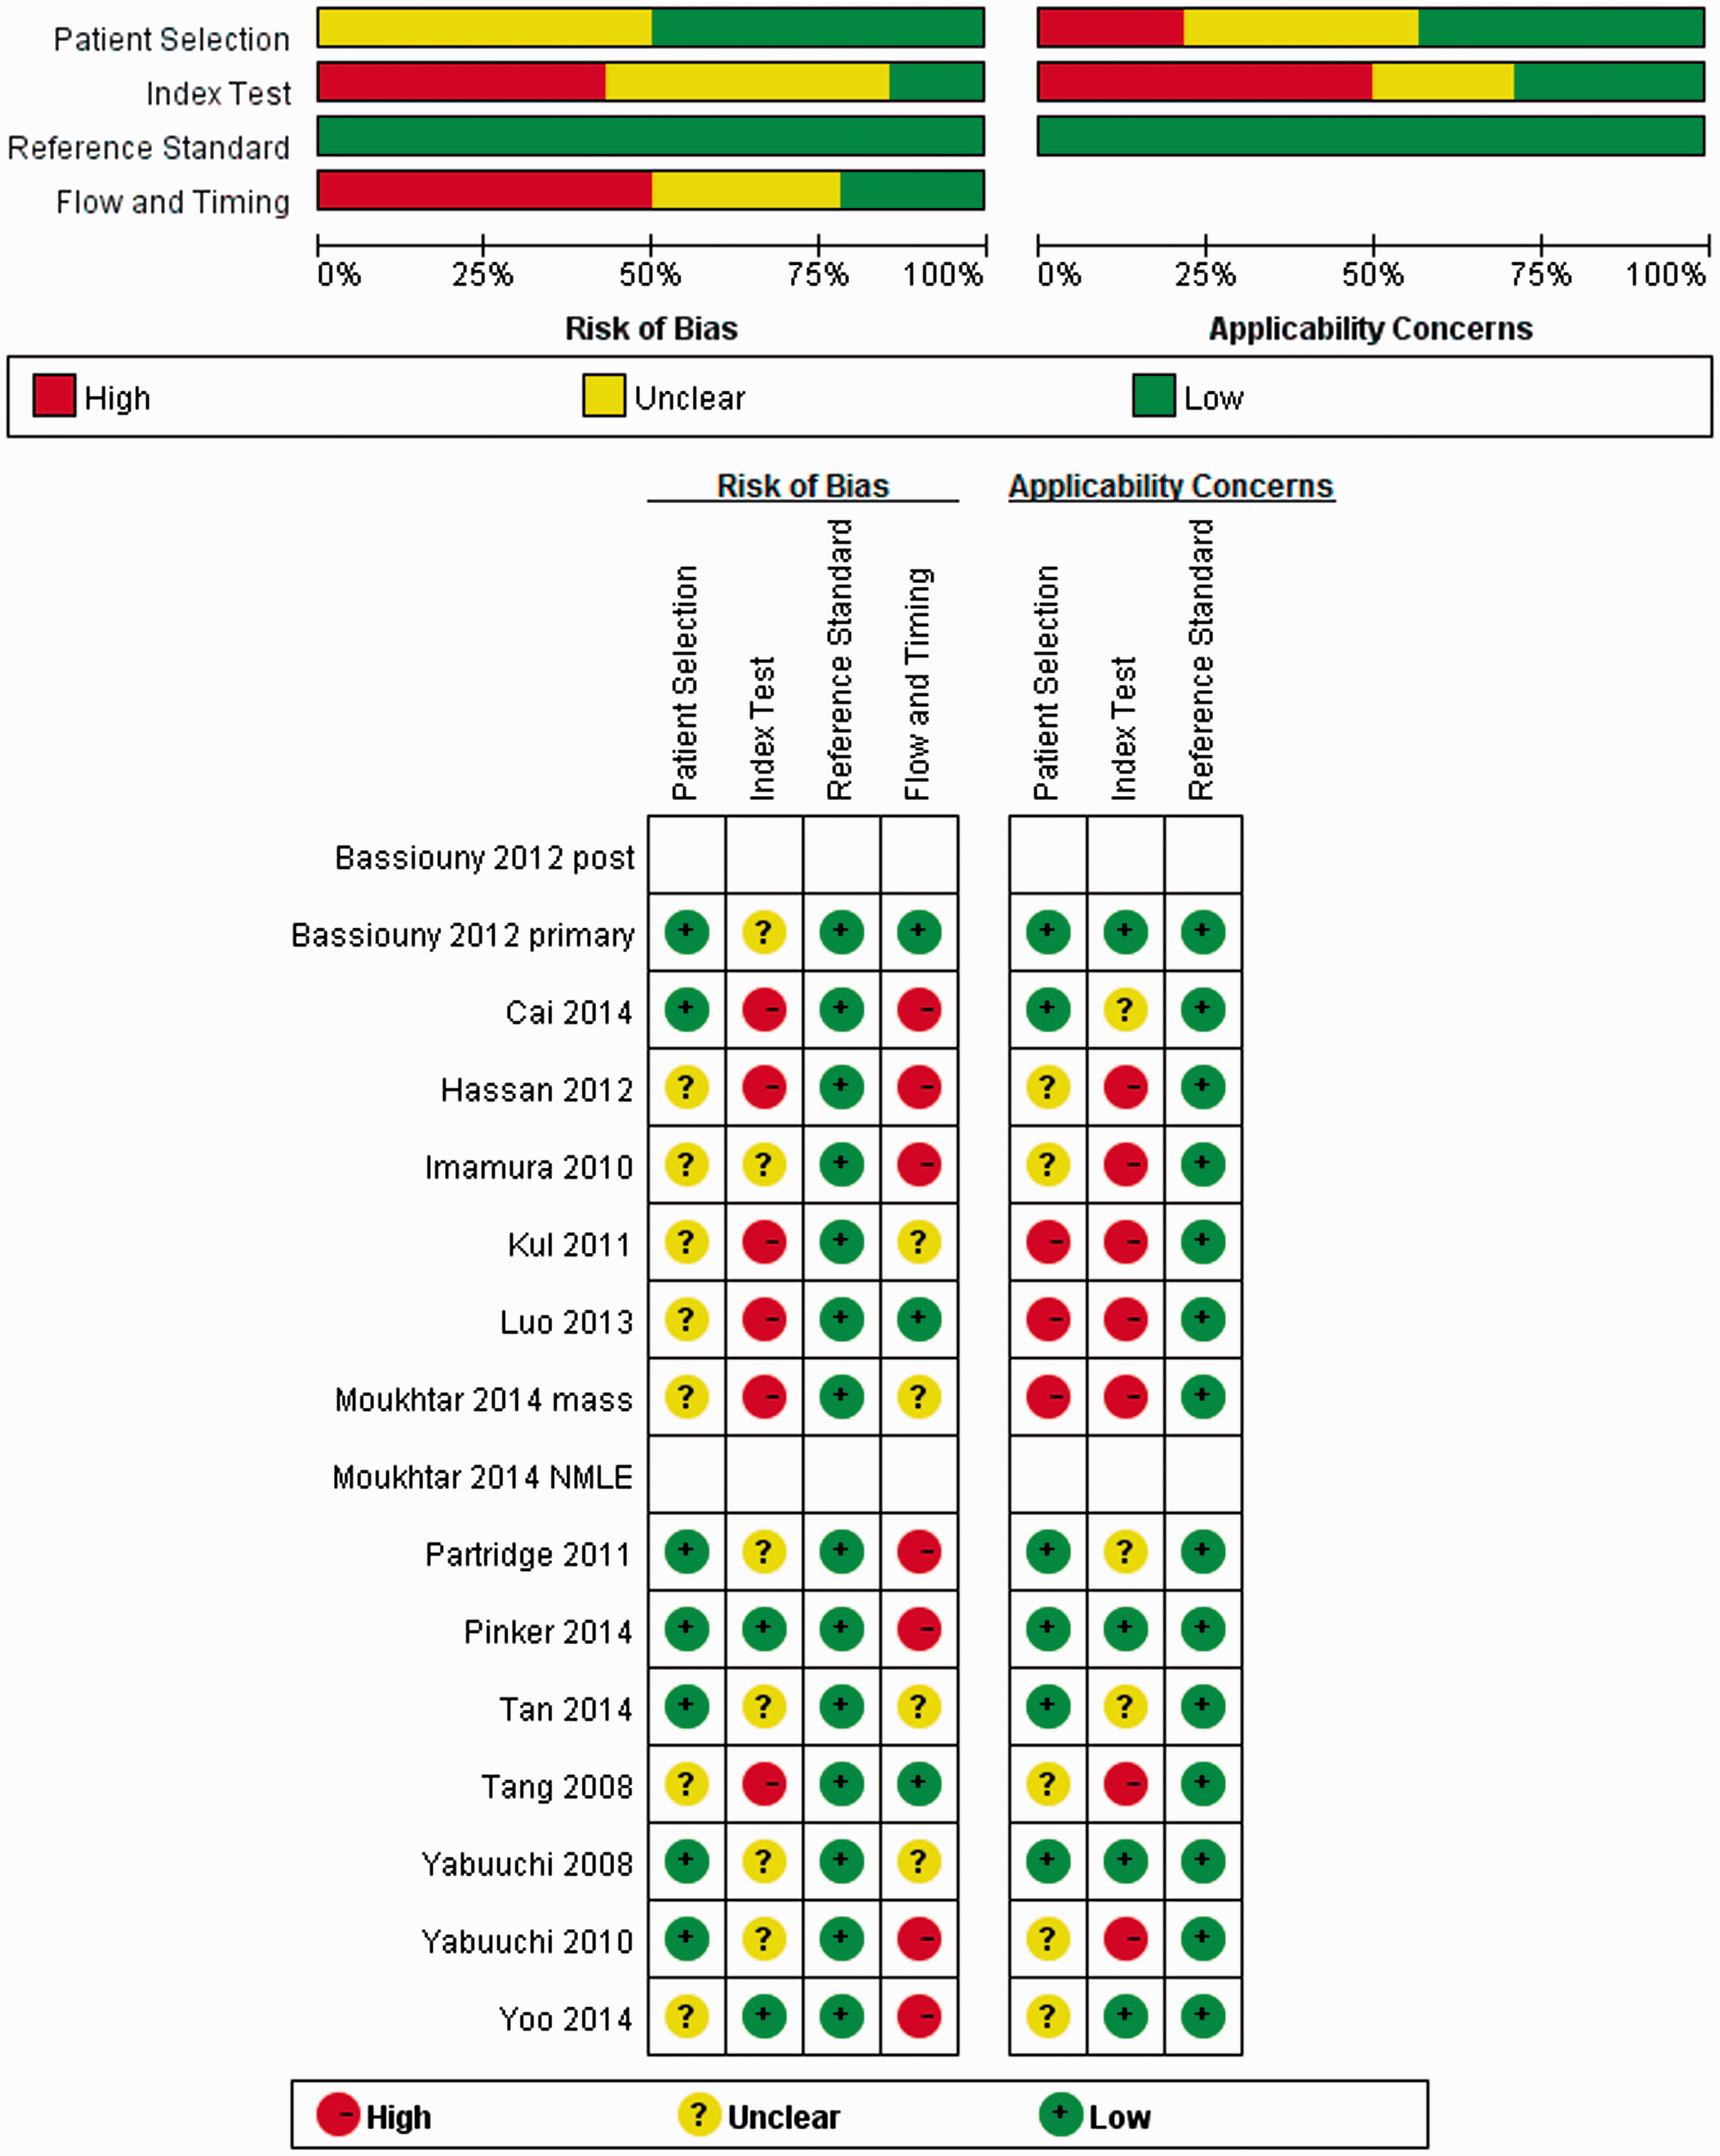
Results of the meta-analysis
Diagnostic accuracy of a combined DWI and DCE-MRI analysis
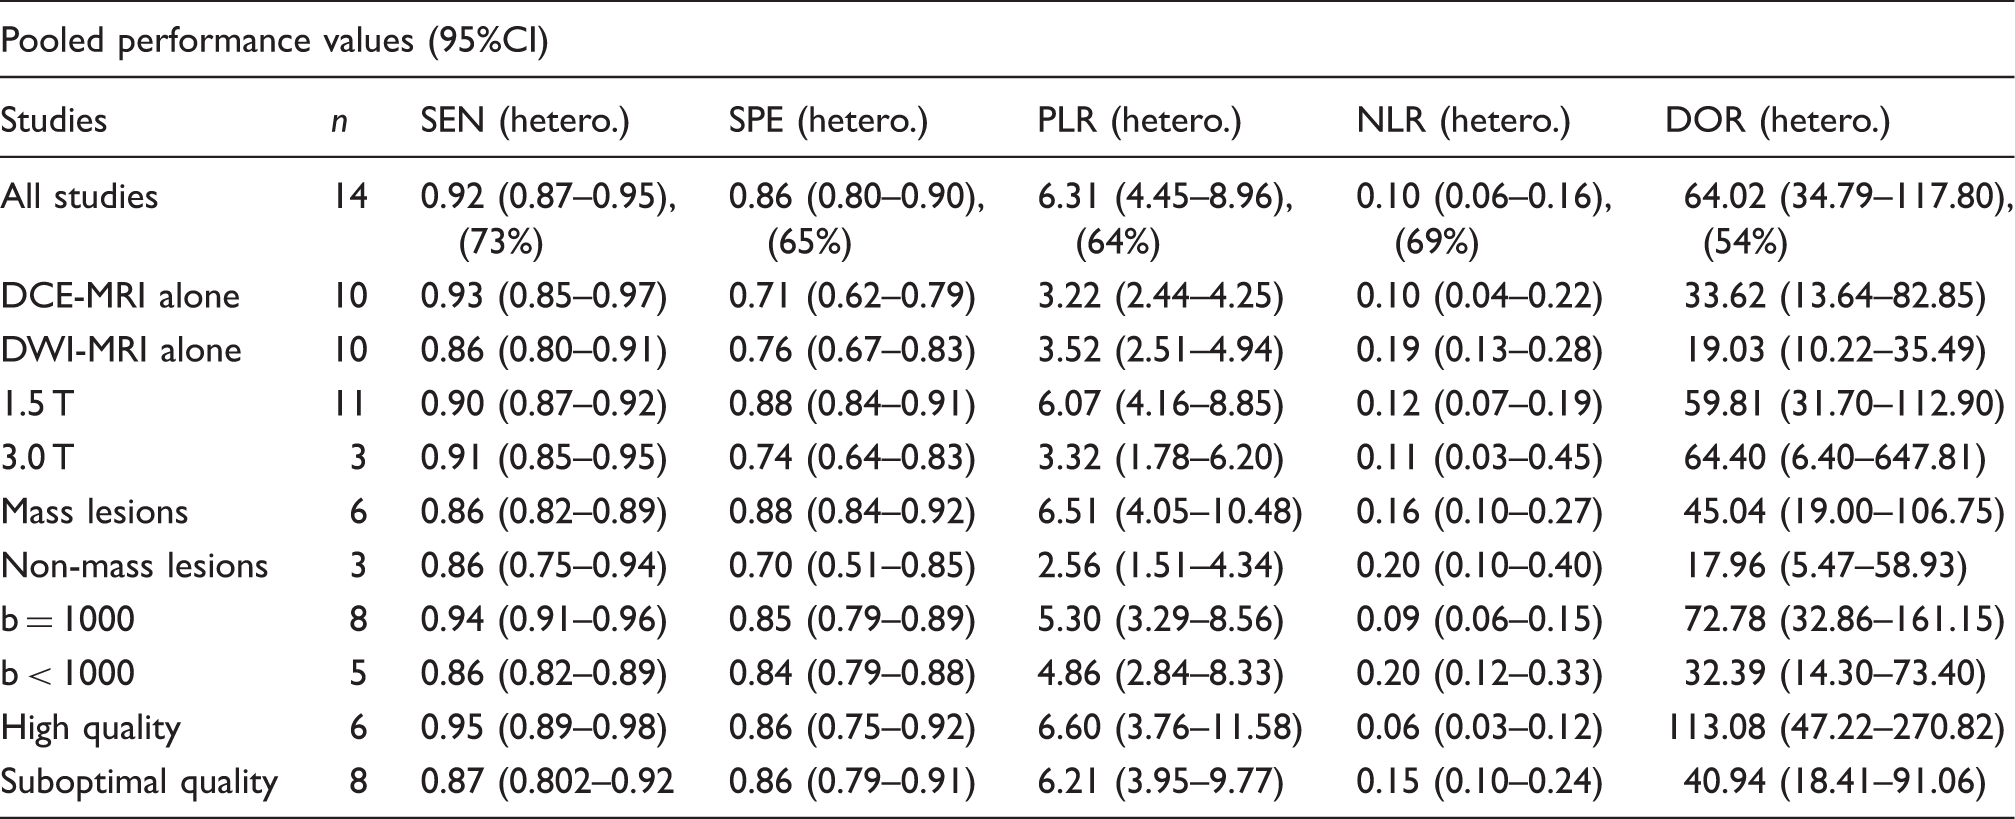
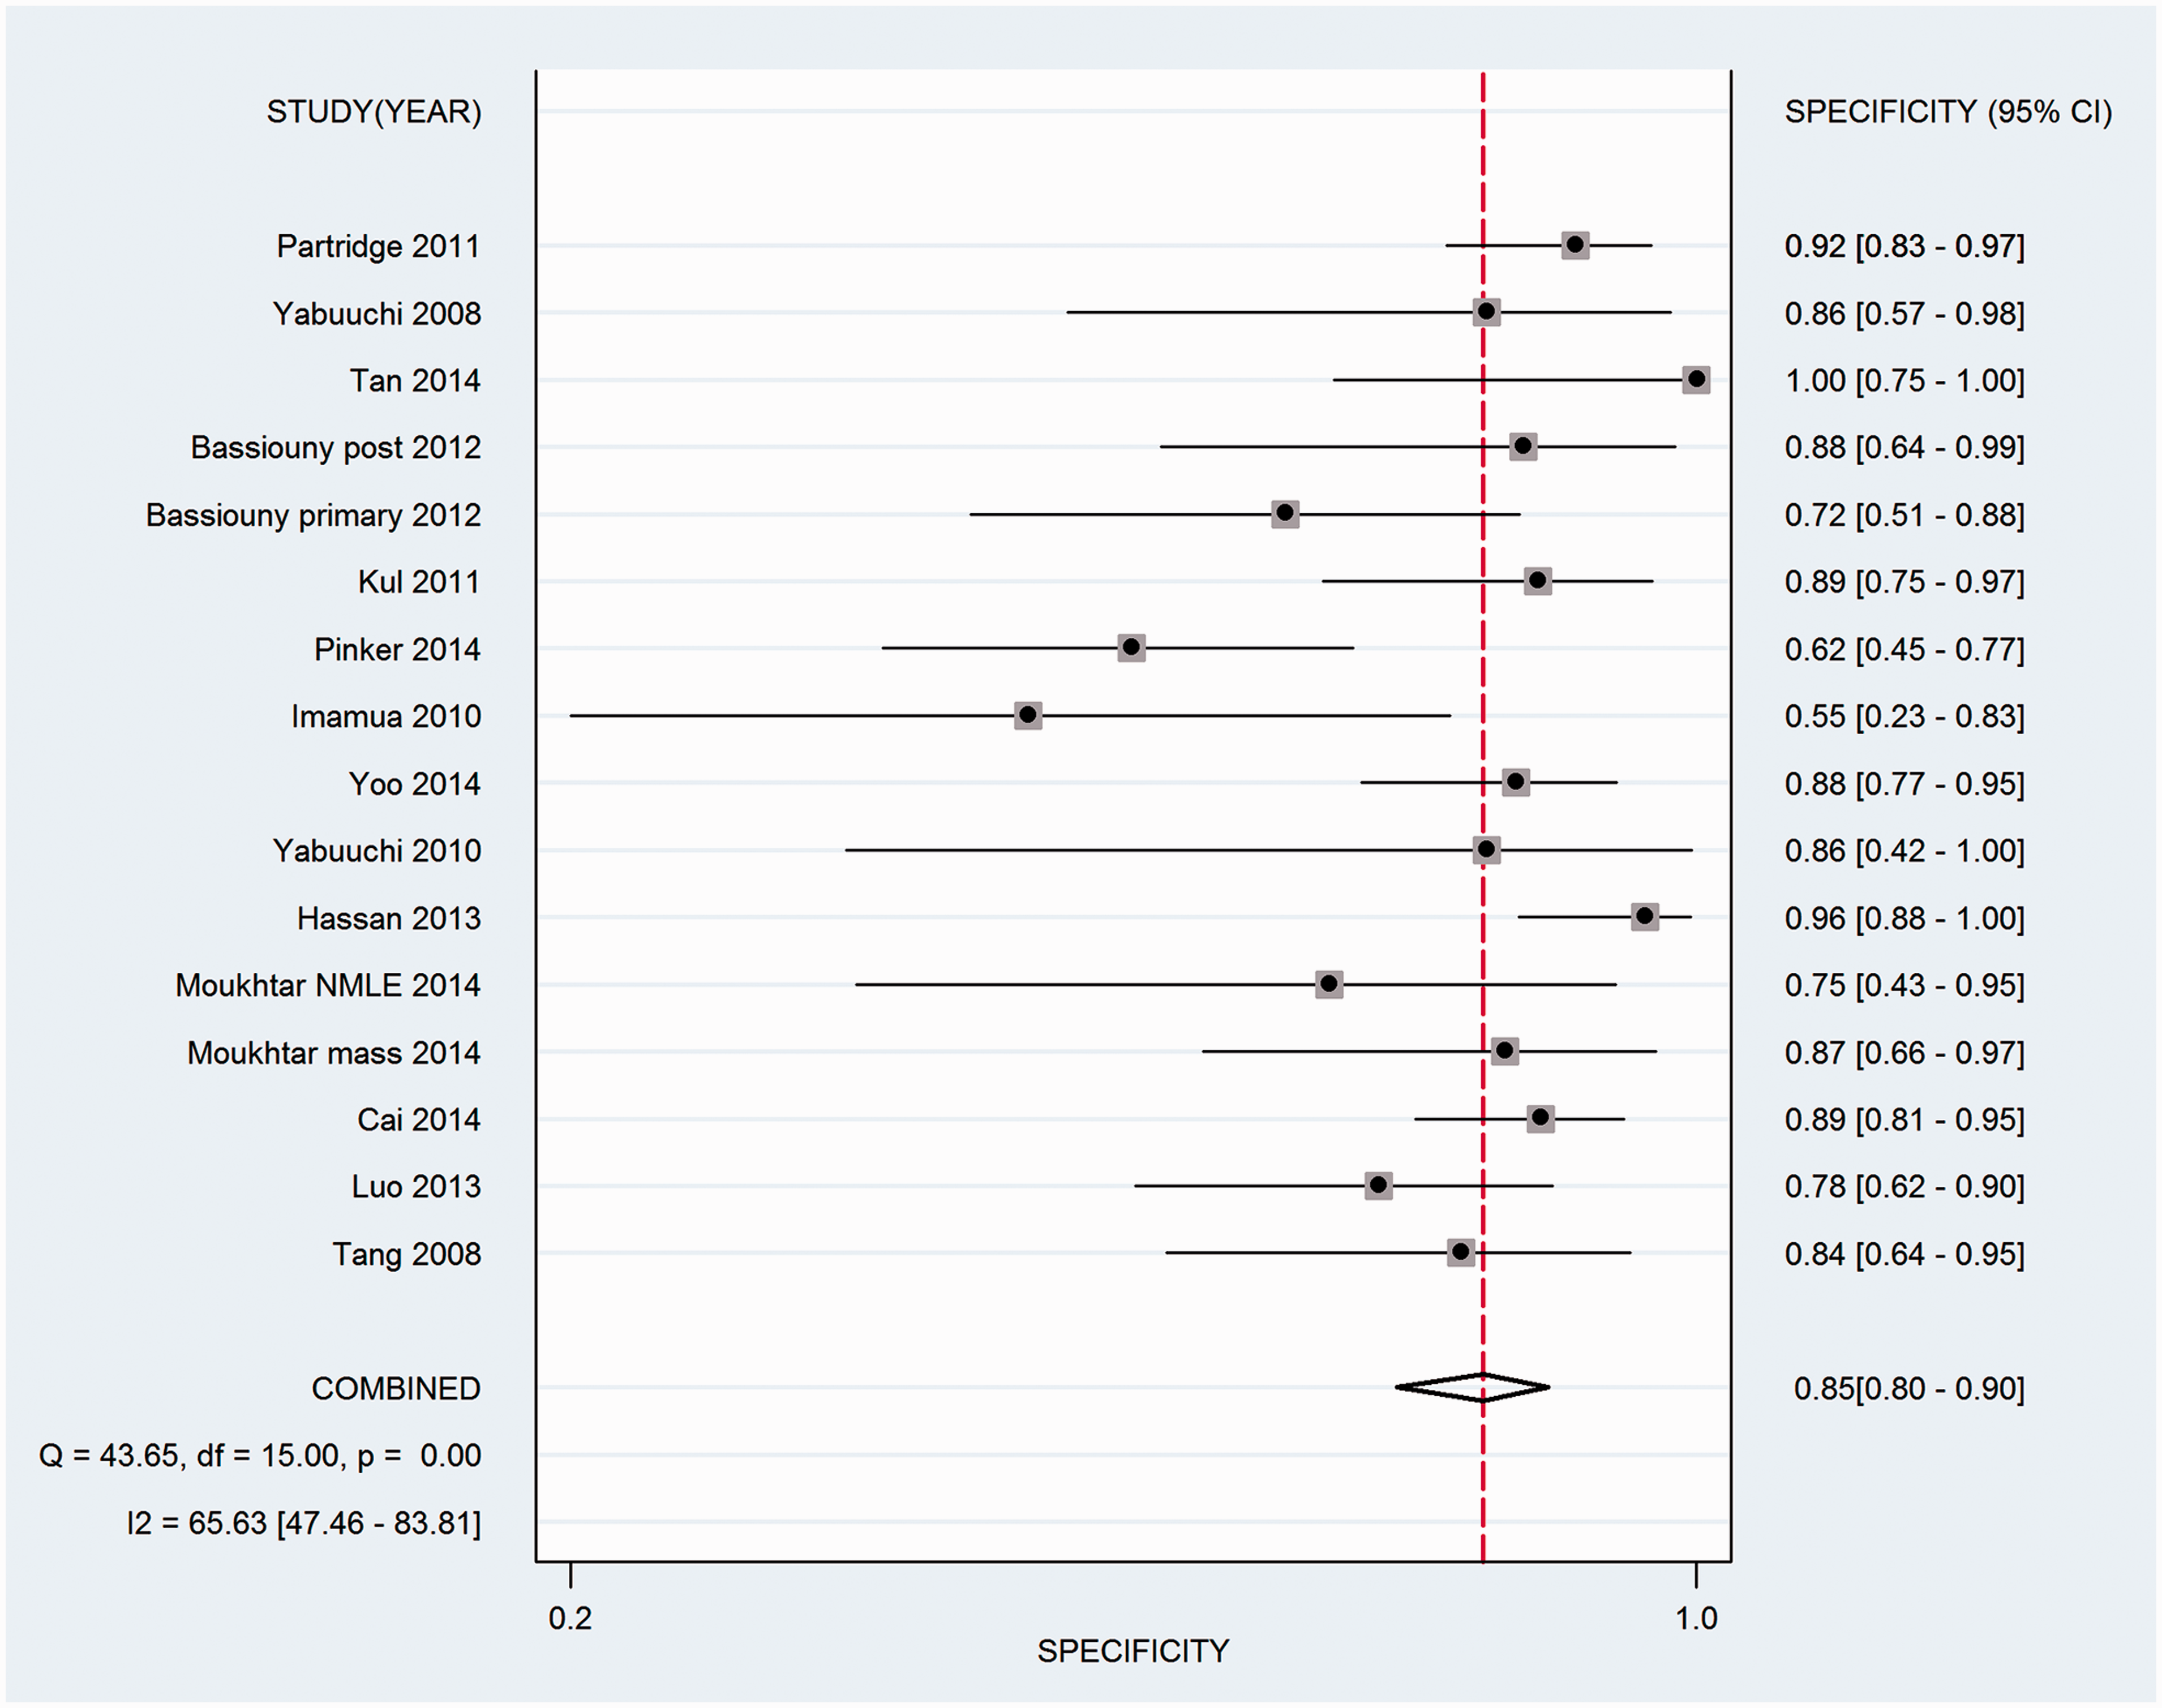
The forest plots of SEN and SPE from 16 subsets of data from all 14 studies are shown in Figs. 3 and 4. The pooled SEN, SPE, PLR, NLR, and DOR values are shown in Table 1. The AUC-SROC was 0.94.
Sensitivity of combined DCE-MRI and DWI for 14 studies. Specificity of combined DCE-MRI and DWI for 14 studies.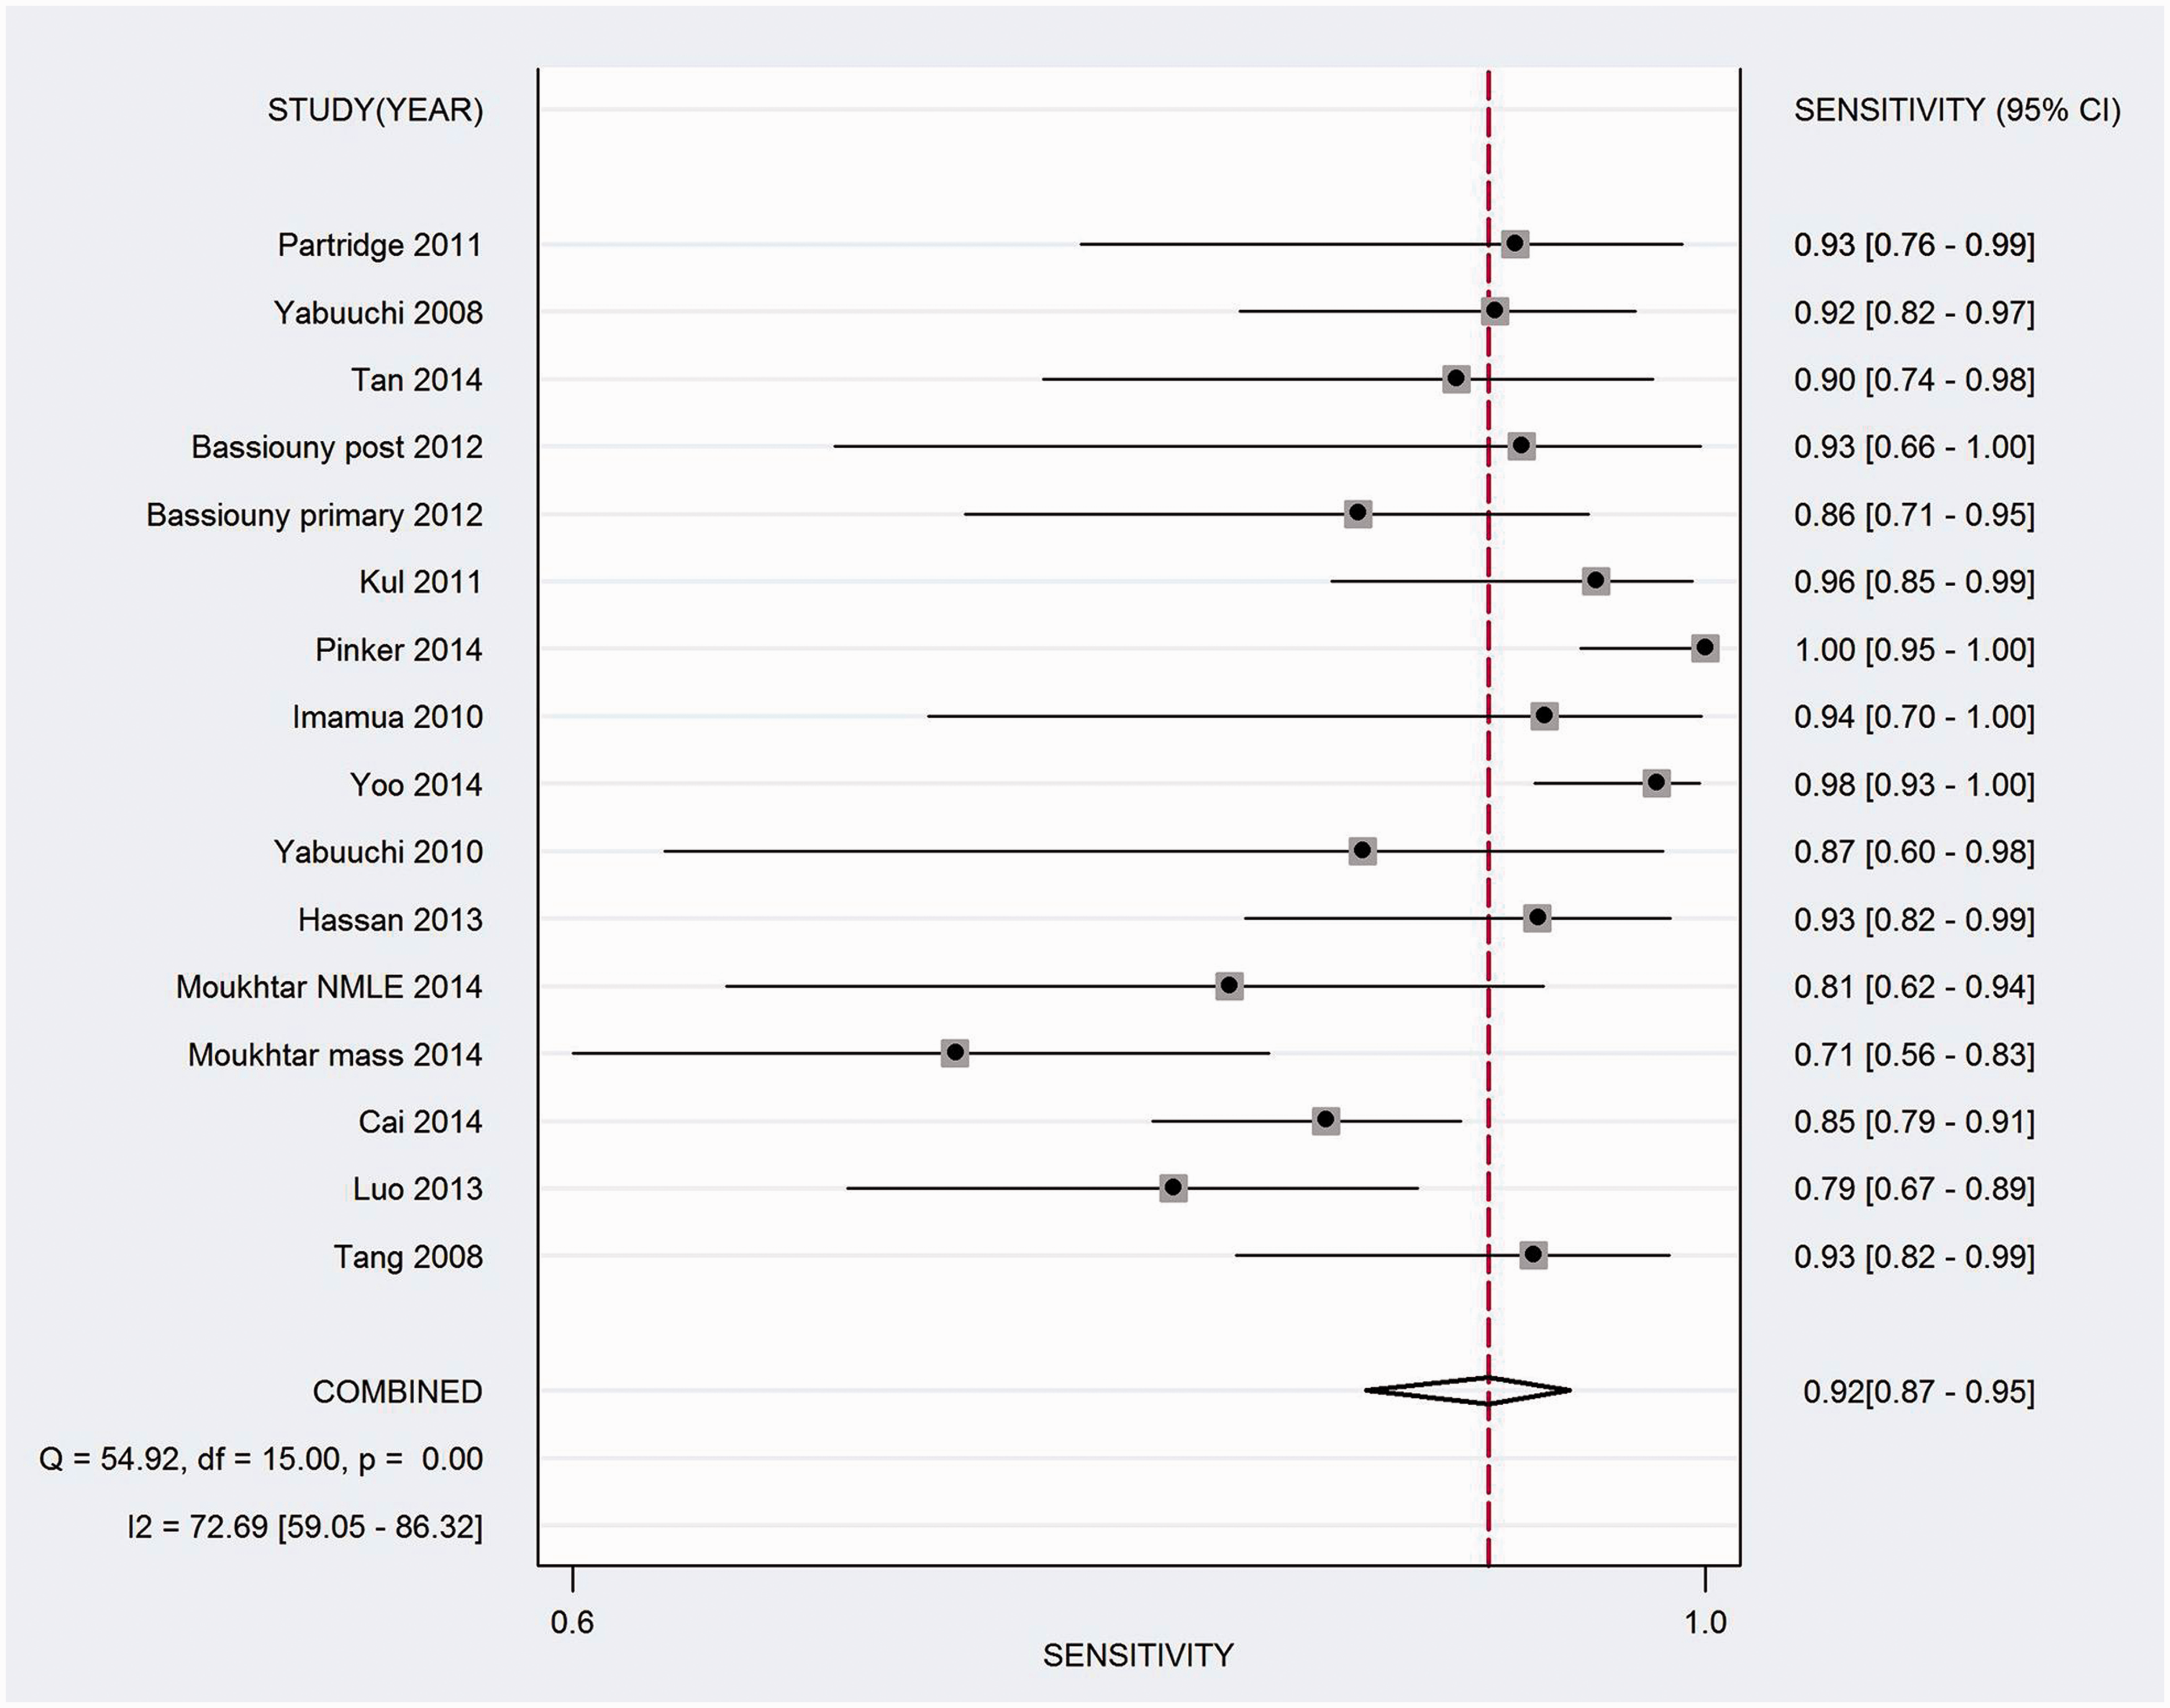
Diagnostic accuracy of DWI analysis
In the DWI group, the pooled SEN, SPE, PLR, NLR, and DOR values are shown in Table 1. The AUC-SROC was 0.88.
Diagnostic accuracy of DCE-MRI analysis
In the DCE-MRI group, the pooled SEN, SPE, PLR, NLR, and DOR values are shown in Table 1. The AUC-SROC was 0.85.
Subgroup analyses
The pooled weighted SEN, SPE, PLR, NLR, DOR, and AUC values were calculated for each subgroup. In total, nine datasets (eight studies) included contingency table data on b = 1000 mm/s2. The pooled SEN, SPE, PLR, NLR, and DOR values are shown in Table 1. AUC-SROC was 0.96. There were six datasets (five studies) using b < 1000 mm/s2. The pooled SEN, SPE, PLR, NLR, and DOR values are shown in Table 1. AUC-SROC was 0.92.
The 1.5-T field-strength subgroup included 13 datasets (11 studies). The pooled SEN, SPE, PLR, NLR, and DOR values are shown in Table 1. AUC-SROC was 0.94. Three studies used a field strength of 3.0 T. The pooled SEN, SPE, PLR, NLR, and DOR values are shown in Table 1. AUC-SROC was 0.94. The pooled SEN, SPE, PLR, NLR, and DOR values of the six studies on mass lesions are shown in Table 1. AUC-SROC was 0.94. The pooled SEN, SPE, PLR, NLR, and DOR values of the three studies with no mass-like are shown in Table 1. AUC-SROC was 0.88.
The high quality subgroup included seven datasets (six studies). The AUC-SROC was 0.96. In suboptimal quality studies (eight studies, 10 datasets), the AUC-SROC was 0.93. The pooled SEN, SPE, PLR, NLR, and DOR values are shown in Table 1.
Threshold effect
The result was r = –0.011, P = 0.970.
Assessment of publication bias
Analysis with using Deeks’ test (P = 0.248) and a funnel plot did not reveal any publication bias (Fig. 5).
Funnel plot for assessment of publication bias plots of Deeks’ test.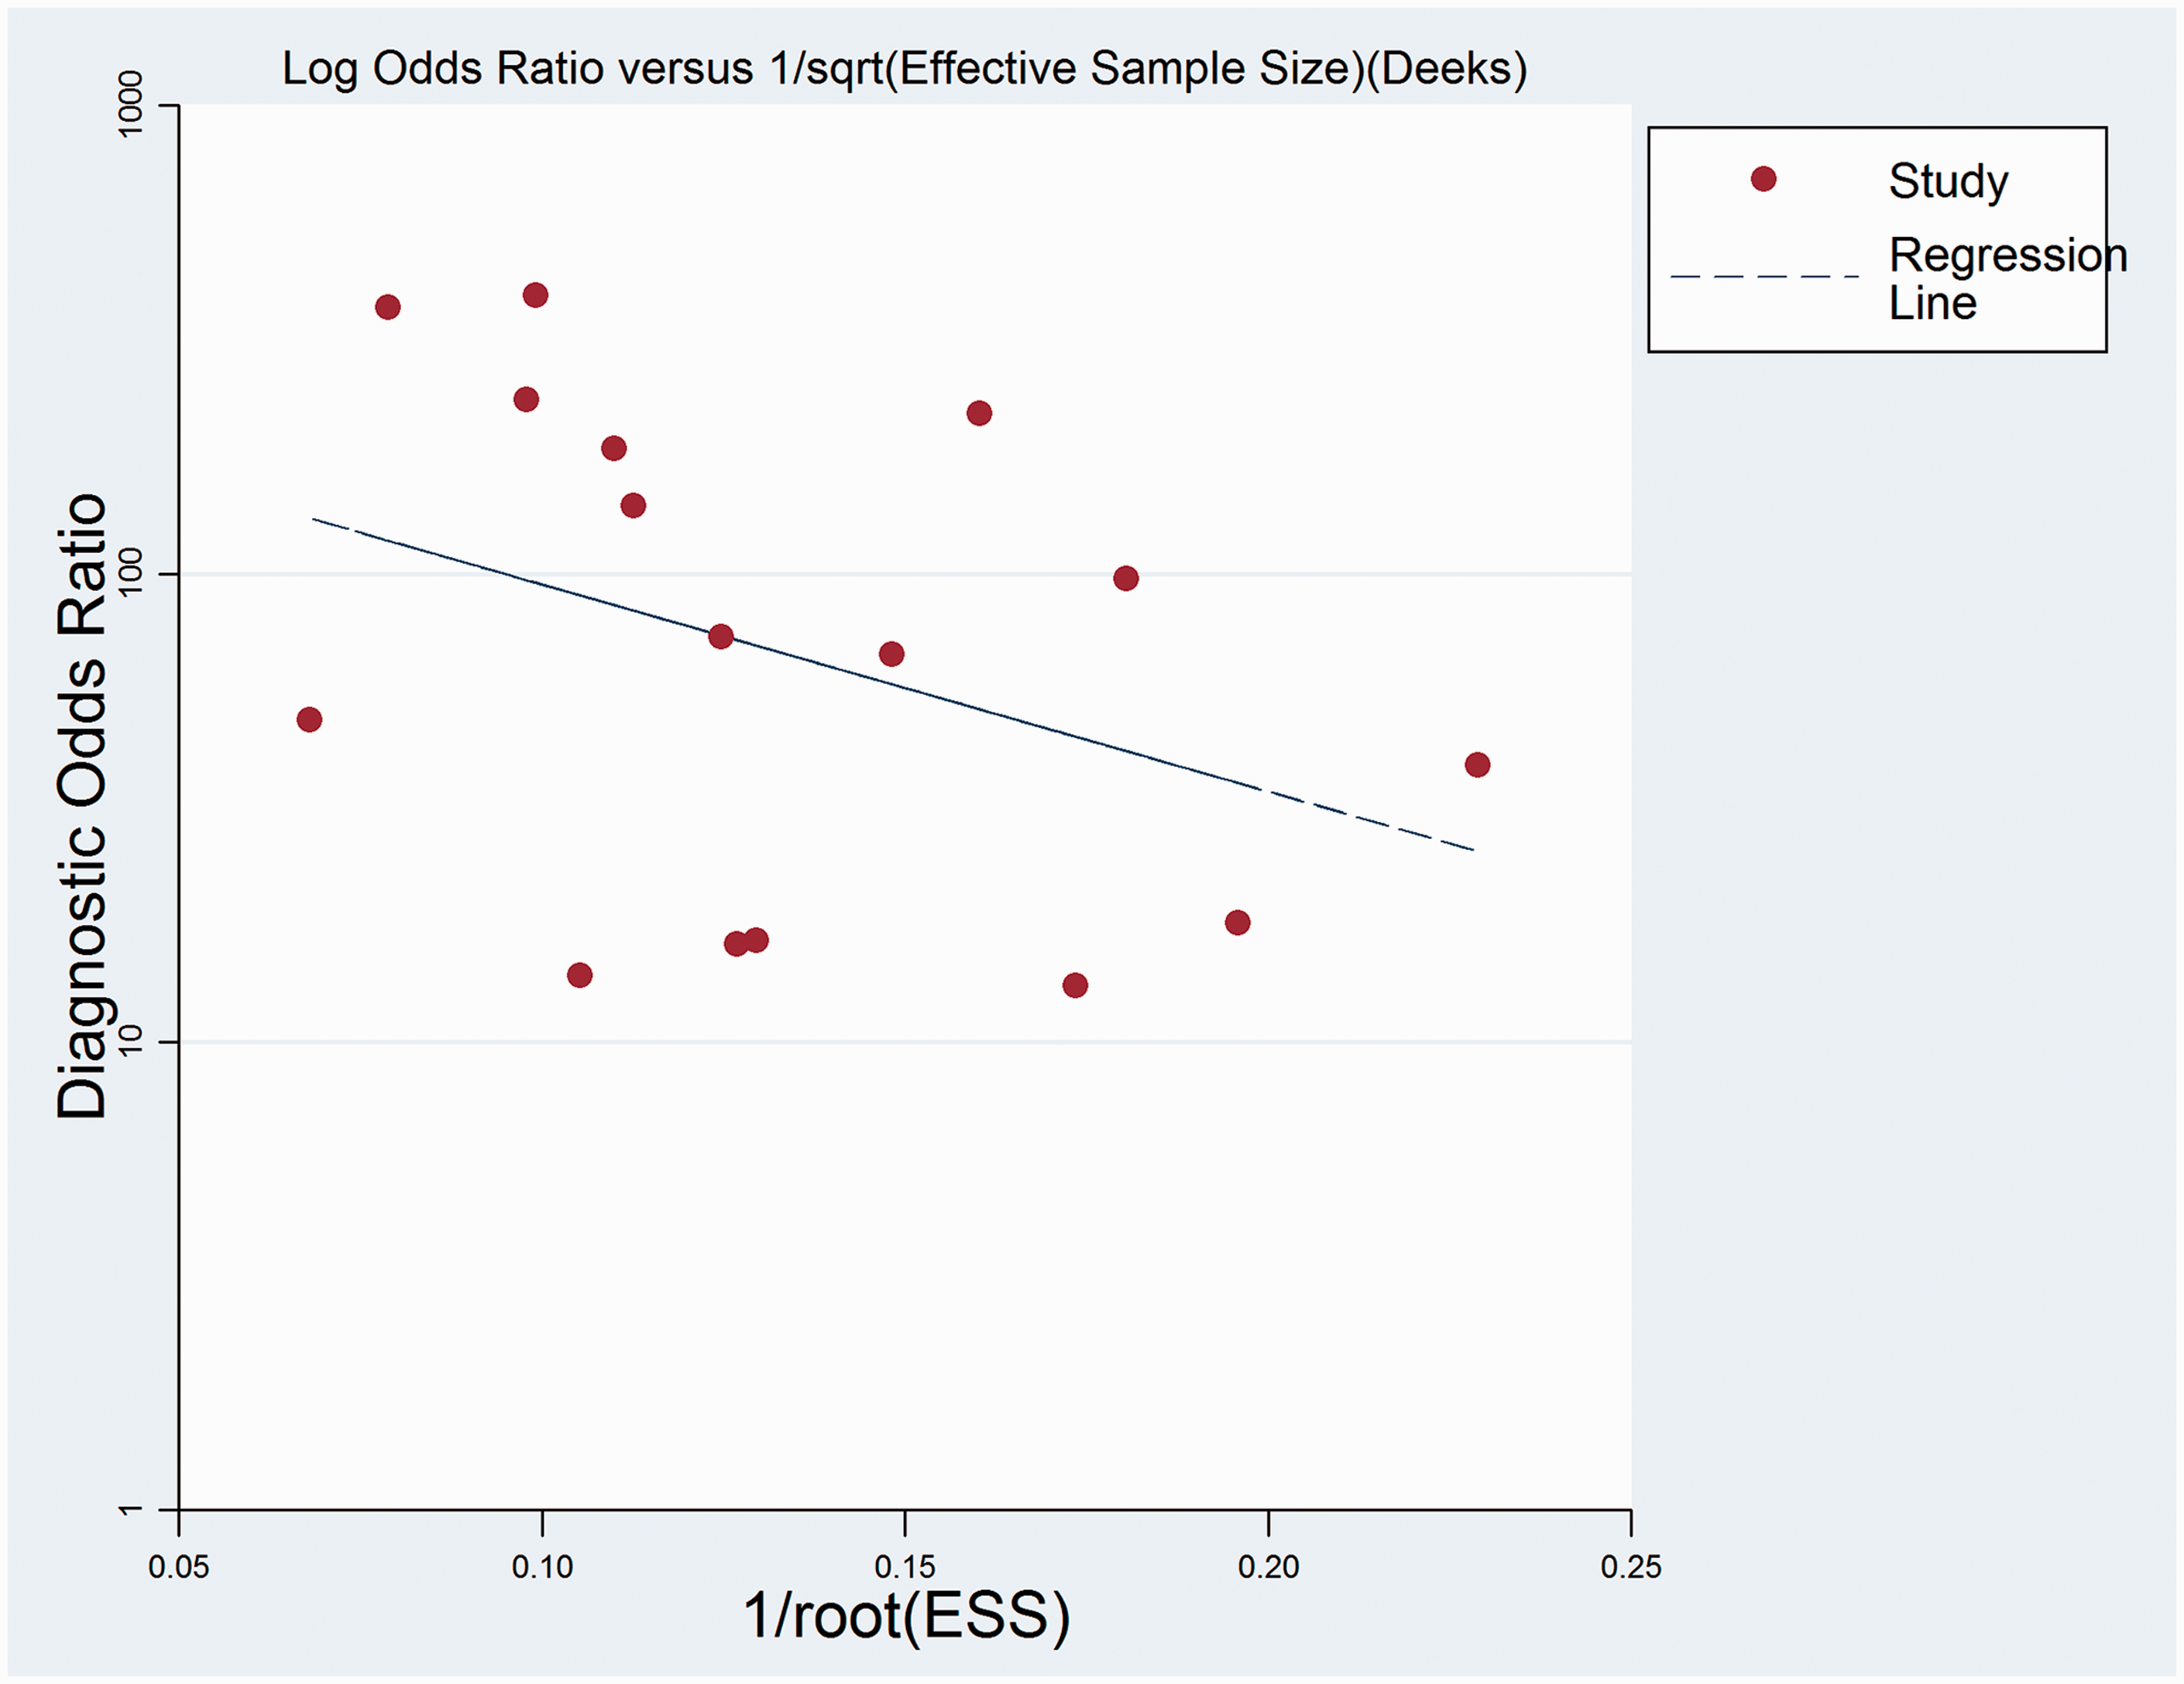
Sensitivity analysis
We eliminated the included studies one by one. The results did not reveal significant changes.
Discussion
This is the first meta-analysis to examine the accuracy of combined DWI and DCE-MRI for the detection of breast cancer. The findings demonstrate that this combination of protocols provides an accurate and non-invasive test for breast cancer detection for both mass and non-mass lesions, with the AUC-SROC of 0.94. Adding DWI to DCE-MRI has the potential to improve the specificity of breast cancer detection, with the two protocols providing complementary information. Each MRI parameter has an incremental value. Combining the dynamic features of pharmacokinetic DCE-MRI and DWI with ADC maps yields important functional data and other information on the cellular status of the target tissue. DCE-MR can provide quantifying tumor blood flow, microvasculature, and capillary permeability. The ADC map reflects these changes and potentially serves as a radiologic biomarker of the tissue response. Therefore, multiparametric (i.e. combined DWI and DCE-MRI) could play a vital role in the detection of breast lesions (34,35).
The quality of the assessment methodology was fair for the included studies. However, there were marked heterogeneity in the sensitivity and specificity, at 0.73 and 0.65. The heterogeneity could be attributable to the following factors: a threshold effect (there appeared to be no strict consensus regarding the thresholds for defining malignancy), and variability in MRI parameters, number of total non-mass-like lesions, cancer prevalence, and reference standards used between the studies. In this meta-analysis, the Spearman correlation indicates that the heterogeneity is unlikely to be attributable to the threshold effect. Therefore, subgroup analysis was conducted to explore the source of the heterogeneity. The diffusion gradient factor b value is one potentially important parameter. To explore whether the b value was the source of the heterogeneity in sensitivity in this meta-analysis, the data were pooled for b = 1000 mm/s2 on both mass and non-mass lesions. This resulted in overall SEN and SPE values of 0.935 and 0.846, respectively, demonstrating a higher sensitivity and specificity than for studies with b < 1000 mm/s2 (SEN and SPE = 0.856 and 0.836, respectively).
The MRI field strengths used varied between the 14 included studies; higher field strengths provide better image quality and higher specificity (36). Stratifying and pooling the data according to field strengths of 1.5 T and 3.0 T, resulted in pooled SEN values 0.895 and 0.908, respectively. Furthermore, the studies evaluating mass lesions had a higher SPE (0.884) than those evaluating non-mass-like breast lesions (0.70). A recent meta-analysis found higher SPE and lower SEN values for DCE-MRI of 0.80 (95% CI = 0.77–0.83) and 0.50 (95% CI = 0.46–0.53), respectively (37), than in the present meta-analysis. With the combination of DCE-MRI and DWI, it might be possible to avoid unnecessary surgery or biopsy procedures for benign lesions or inadequate observation of malignancy when non-mass-like lesions are encountered on breast MRI. However, only three of the studies included in the present meta-analysis reported on non-mass lesions. Larger studies will enable the evaluation of specific lesion subgroups, such as mass versus non-mass lesions, and with respect to the detection of malignancy using combined DWI with DCE-MRI.
Another recent meta-analysis of the effect of the value of b for DWI demonstrated that a b value of 1000 s/mm2 was best for differentiating between benign and malignant lesions, but also suggested that higher b values may further improve the discrimination of breast lesions (38). In a previous meta-analysis using a maximum b value of 1000 s/mm2, the pooled SEN and SPE values were both 0.84 (9). In the present meta-analysis, almost all of the included studies used b values of >600 s/mm2.
This study was subject to several limitations. First, the quality of the included studies was suboptimal with regard to the reporting of patient selection, the reference standards used, and the study flow and timing. Furthermore, the cancer prevalence differed between most of the included studies. Thus, a lesion visible on MRI is more likely to be malignant. Other problems were non-reporting of the blinding status for the reference text, and the fact that not all patients in individual studies received the same reference standard. Therefore, improvements in the quality of reporting test accuracy are required, by using the Standards for Reporting of Diagnostic Accuracy statement (39). However, the potential confounding effects of that particular limitation should have been reduced by the application of strict inclusion and exclusion criteria, such that only those studies that were of sufficient quality to allow estimates of SEN and SPE were included. Second, the technical parameters, such as enhanced scanning sequence, slice thickness, field strength, and b values, varied among the included studies. Further studies should be performed to optimize the imaging protocol. In addition, hormonal status should be considered as one of the factors that can cause background enhancement of breast tissue (40). Third, variations in lesion diameter in the included studies may have affected the overall accuracy estimates. Only four studies provided data pertaining to lesion size, and they found maximum diameters in the range of 0.5–8.2 cm.
In conclusion, the findings of this meta-analysis show that combined DCE-MRI and DWI had superior diagnostic accuracy than either DCE-MRI or DWI alone for the diagnosis of breast cancer. However, a threshold value for the classification of malignant/benign lesions could not be determined based on this meta-analysis, since this threshold is influenced by variations in b value, dynamic phase, and the pathological characteristics of the lesion. The threshold value should also be selected based on the purpose of the examination. Further randomized controlled trials with multiparametric MRI (i.e. combined DCE-MRI and DWI) are needed to establish more clearly the potential benefits, harms, and cost-effectiveness of this protocol.
Footnotes
Acknowledgments
This study was supported by a grant from National Natural Science Foundation of China (no. 81270416 to Xiaoling Zhang).
Conflict of interest
None declared.
Funding
This research received no specific grant from any funding agency in the public, commercial, or not-for-profit sectors.